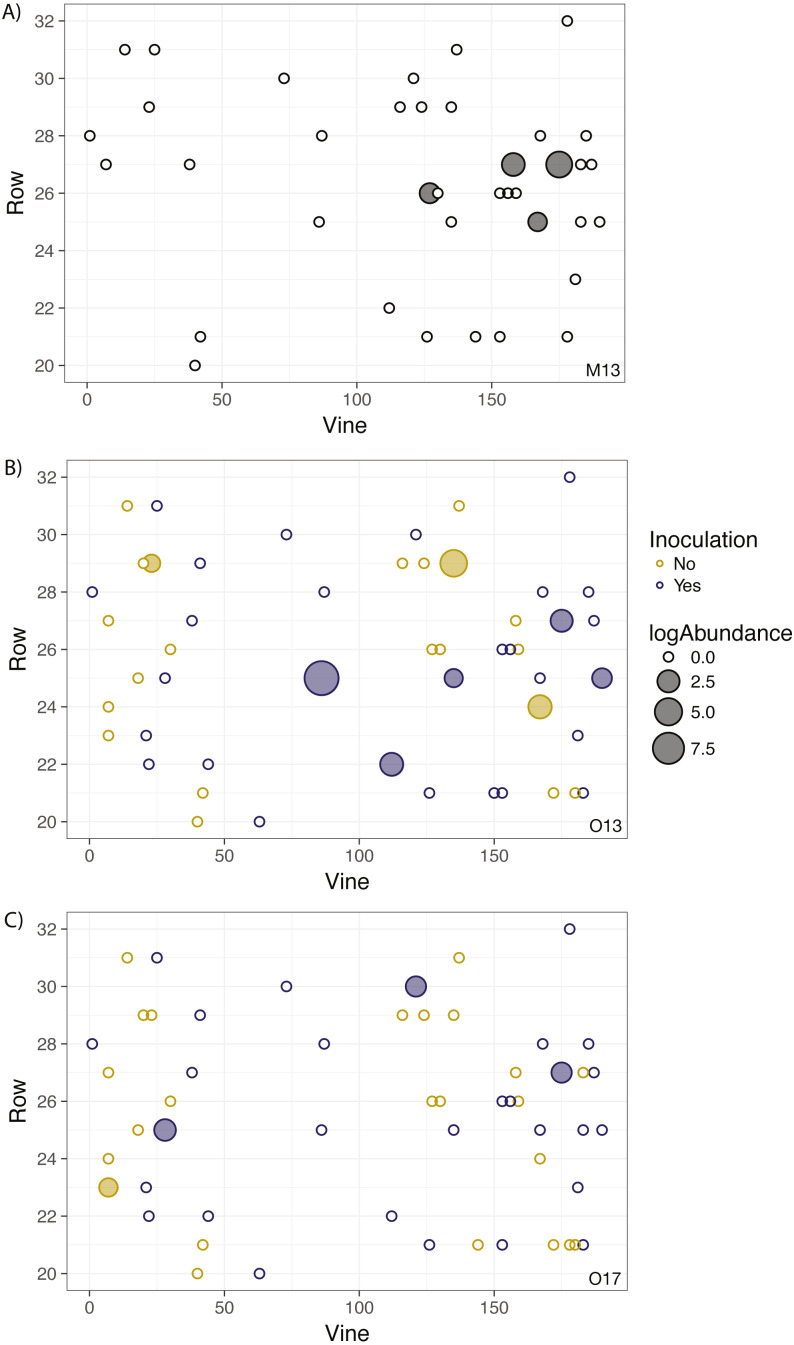
Figure 2. Geographic distribution and abundance of the target isolate, R. irregulare DAOM 197198, in soil samples taken in May 2013 (A) and October 2013 (B), and October 2017 (C).
Each point represents an individual experimental vine, and the point is filled if the sample tested positive for the presence of the isolate or left unfilled if the sample tested negative. The size of the point is proportional to the log abundance of the isolate. Yellow points represent non-inoculated vines, and purple points represent inoculated vines (colours omitted in A due to being pre-inoculation). No statistically significant spatial autocorrelation is present.

