Abstract
Background
Incidence of skin cancer is one of the global burdens of malignancies that increase each year, with melanoma being the deadliest one. Imaging-based automated skin cancer detection still remains challenging owing to variability in the skin lesions and limited standard dataset availability. Recent research indicates the potential of deep convolutional neural networks (CNN) in predicting outcomes from simple as well as highly complicated images. However, its implementation requires high-class computational facility, that is not feasible in low resource and remote areas of health care. There is potential in combining image and patient’s metadata, but the study is still lacking.
Objective
We want to develop malignant melanoma detection based on dermoscopic images and patient’s metadata using an artificial intelligence (AI) model that will work on low-resource devices.
Methods
We used an open-access dermatology repository of International Skin Imaging Collaboration (ISIC) Archive dataset consist of 23,801 biopsy-proven dermoscopic images. We tested performance for binary classification malignant melanomas vs nonmalignant melanomas. From 1200 sample images, we split the data for training (72%), validation (18%), and testing (10%). We compared CNN with image data only (CNN model) vs CNN for image data combined with an artificial neural network (ANN) for patient’s metadata (CNN+ANN model).
Results
The balanced accuracy for CNN+ANN model was higher (92.34%) than the CNN model (73.69%). Combination of the patient’s metadata using ANN prevents the overfitting that occurs in the CNN model using dermoscopic images only. This small size (24 MB) of this model made it possible to run on a medium class computer without the need of cloud computing, suitable for deployment on devices with limited resources.
Conclusion
The CNN+ANN model can increase the accuracy of classification in malignant melanoma detection even with limited data and is promising for development as a screening device in remote and low resources health care.
Keywords: skin cancer, convolutional neural network, artificial neural network, embedded artificial intelligence
Introduction
The global burden of skin cancer, especially in the white-skinned population, of which malignant melanoma is the deadliest, accounted for 0.11% of all types of death in 2017.1 Early detection of skin cancer is important, more than 99% of patients will have five-year survival if the skin cancer is detected early. When melanoma is recognized and treated early, it is almost always curable. Melanoma can advance and invade other body parts, where it becomes difficult to treat and can be catastrophic. While it is not the most common of the skin cancers, it causes the most deaths.2
Dermoscopy is a skin imaging modality that has reported augmentation for diagnosis of skin cancer in contrast to pure visual inspection. However, clinicians should be sufficiently trained for those improvements to be realized. In order to make expertise more widely available, the International Skin Imaging Collaboration (ISIC) has developed an archive containing dermoscopic images for research purposes along with clinical training toward automated algorithmic analysis by receiving challenges of ISIC.3
Early melanoma detection is feasible by visual inspection of pigmented dermatologic lesions, treated by malignant tumor simple excision. Nonetheless, owing to the scarcity of dermatologists, visual inspection has variable accuracy which leads patients to undergo a series of biopsies and complicates the management.
Attempts for early diagnosis of melanoma are paramount.4 In general, there is evidence that the prevalence of in situ and invasive skin cancer increases after the implementation of skin cancer screening; thin and thick were observed with increasing and decreasing rates, respectively.5 Previous studies related to image analysis using deep learning in skin cancer detection had been drawn to dermatologists’ attention.6–8 The convolutional neural network (CNN) is one of the deep learning methods, which possessed potential for analyzing general and highly variable tasks in dermoscopic images, but its implementation combined with patient’s metadata in the clinical setting is still lacking. The implementation of CNN in the clinical setting requires high-class cloud computational facility such as cloud computing which seems unfeasible in low-resource and remote areas of health care.
Therefore, in our study, we aimed to developed artificial intelligence (AI) model for malignant melanoma detection based on dermoscopic images and patient’s metadata with relatively small dataset. We want this model to work on low resource devices, so the model file size needs to be as small as possible.
Materials and Methods
Experimental Dataset
We applied the dataset from open-access dermatology repository ISIC archive (www.isic-archive.com). The ISIC archive data are made up of melanocytic lesions which are confirmed by biopsy and classified either benign or malignant. The ISIC archive is the biggest non-private skin dermoscopic image dataset accessible, containing about 23,906 photographs which are cut off for both quality and privacy assurance. Lesion diagnosis in dermoscopic images are coupled with a definitive diagnosis, consist of nevus, melanoma, pigmented benign keratosis, basal cell carcinoma, seborrheic keratosis, and others.9
Sample Selection
We selected metadata and the images of “ISIC 2019: Training” data are licensed under a Creative Commons Attribution-NonCommercial 4.0 International License (https://creativecommons.org/licenses/by-nc/4.0/)10 We used binary classification to separate melanoma from others. Of about 9000 dermoscopic images from ISIC, 3807 images (both malignant and nonmalignant melanoma) were initially downloaded from HAM 10000,11 MSK-1, MSK-2, MSK-3, and MSK-4 datasets.12 Classes are quite unbalanced in this dataset, there are about 90% of nonmelanoma images in the dataset, and 10% malignant images. Thereafter, 1200 images were randomly selected.
Data Preprocessing
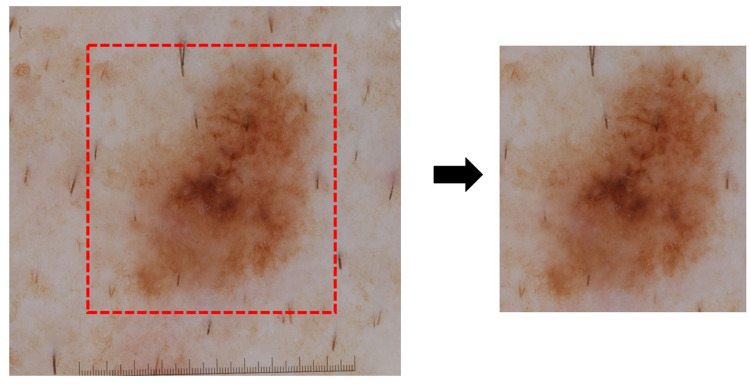
The randomly selected images were cropped to remove any sticker, ruler, or hair to avoid any disturbance in the model (Figure 1). The images for the training data consisted of 900 (281 malignant, 619 benign), and were further split into training (720) and validation (180) during model training with a 0:2 ratio. For testing data, 300 images were used (93 malignant, 207 nonmalignant melanoma). Patient’s metadata consist of age, gender, anatomic site and location variables. For preprocessing patient’s metadata, we use one hot encoder for categorical variables (ie anatomy site, location, and gender), and for numerical variables (age), we use MinMaxScaler.
Figure 1.
Dermoscopic image data preprocessing. Original dermoscopic image (left side) obtained from dermatology repository International Skin Imaging Collaboration (ISIC) archive (www.isic-archive.com) was cropped and removed the ruler, sticker, or hair (right side) for further analysis.
Model Construction
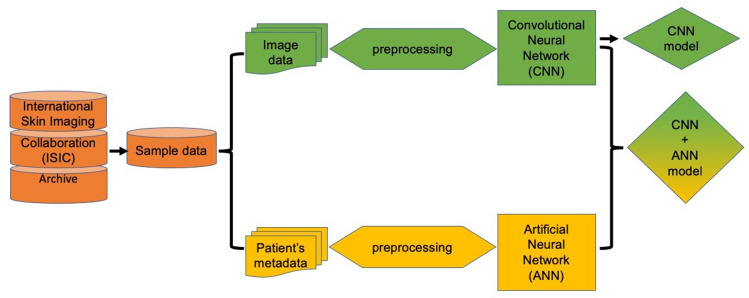
We propose a framework that includes two models, CNN and a combination of CNN with ANN. This framework consists of the first stages, that is, preprocessing of data. Then the data is entered into the neural network. The different classification algorithms of CNN and ANN are combined in order to make the best decision. Figure 2 shows an overview of the proposed framework.
Figure 2.
Schematic representation of experimental methodology. Initially input data is preprocessed to generate the dataset to be employed to further establish a CNN model. In parallel, patient metadata variable is also preprocessed to generate dataset for establishing the ANN model. These independent models were further combined to assess the impact on accuracy of the prediction between image only data (CNN model) and image plus patient’s metadata (CNN+ANN model).
After images data preprocessing, the dermatologic lesions contain only tiny percentage of the view. Thus, decreasing the scale of image may cause the lesions to be too little to identify. To document this point, the CNN model obtain 1200 rectangular image patches randomly from the middle of every picture at various scales (1/5, 2/5, 3/5, and 4/5 of original size), and then reorganized them into 300×300 pixels using bilinear interpolation, Then, the CNN administer on the fly data augmentation, including vertical and horizontal flips, random rotation (−10°, +10°), and zoom (90–110% of length and width) to boost the dataset.
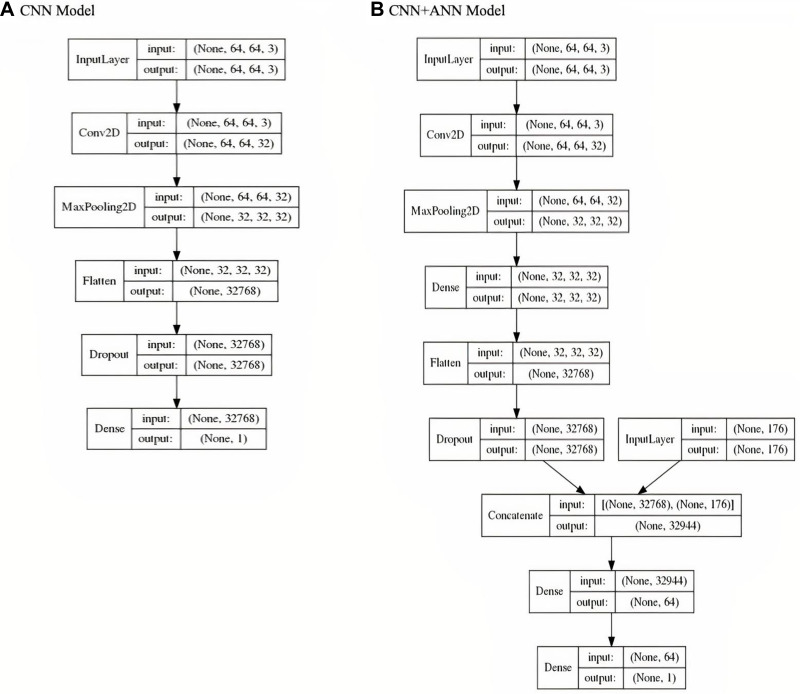
The architecture and detail of the layer and parameters of CNN and CNN+ANN model has been shown in Figure 3A and B), respectively. From this architecture, we can see the number of layers in each model. In the CNN model architecture, we provided input image into convolution layer, performed convolution on the image and apply an activation to the matrix, performed pooling to reduce dimensionality size, feed to neural network, flatten the output, and dropped inputs to 0 (zero) randomly to reduce overfitting, then output the class using an activation function and classifies images. In the CNN+ANN model, we concatenated the CNN model output with ANN input, and combined all the features to fully connected layers, then output the class using an activation function and classifies images and patient’s metadata. Both models were implemented on Keras application program interface with TensorFlow backend, using the R programming language, version 1.14.
Figure 3.
Model architecture. CNN model architecture (A) and CNN+ANN model architecture (B) showed the flow inside the model (printed from TensorFlow 1.14).
Evaluation
To assess our proposed deep learning model, we use area under the receiver operating characteristic curve (AUROC), accuracy, balanced accuracy, sensitivity, specificity, as performance metrics, which are defined as follow:
 |
(1) |
 |
(2) |
 |
(3) |
where TP is the number of true positive, TN is the number of true negative, FP is the number of false positive, and FN is the number of false negative. TPR and TNR stands for true positive rate and true negative rate, respectively. AUROC is the optimal cutoff risk score threshold which, identified at both sensitivity and specificity, were maximized. Accuracy is the amount of data that is correctly predicted from all the data. Balanced accuracy is a parameter used to evaluate how well a binary classifier is, especially useful when a class is unbalanced (one class appears more often than another). The F1 score is the harmonic mean of precision and recall, if a model gets the highest score of 1.0, it means perfect precision and recall.
Results
The mean (SD) age in the malignant melanoma group was 62.6 (17.10) years, much older than the mean (SD) age among nonmalignant melanoma that was 17.5 (11.20) years. The distribution of age between malignant and nonmalignant melanoma were significantly different (p-value <0.01) (Table 1). Male is the dominant gender both in malignant and nonmalignant patients, and there is no significant difference between both groups.
Table 1.
Distribution of Patient’s Metadata
| Variables | Malignant Melanoma (n=374) | Nonmalignant Melanoma (n=826) | p-value |
|---|---|---|---|
| Age, mean, (±SD), year | 62.6 (±17.10) | 17.5 (±11.20) | <0.01 |
| Gender, n (%) | 0.38 | ||
| Female | 127 (33.96) | 300 (36.32) | |
| Male | 213 (56.95) | 443 (53.63) | |
| Unknown/missing | 34 (9.09) | 83 (10.5) | |
| Anatomy site, n (%) | 0.01 | ||
| Lower extremity | 54 (14.44) | 166 (20.10) | |
| Posterior torso | 48 (12.83) | 198 (23.97) | |
| Anterior torso | 34 (9.09) | 130 (15.74) | |
| Upper extremity | 28 (7.49) | 138 (16.71) | |
| Head/neck | 21 (5.61) | 92 (11.14) | |
| Lateral torso | 2 (0.53) | 11 (1.33) | |
| Other (7 sites) | 0 (0.00) | 82 (9.93) | |
| Unknown/missing | 187 (50.00) | 9 (1.09) | |
| Location, n (%) | 0.09 | ||
| Back | 45 (12.03) | 132 (15.98) | |
| Lower extremity | 28 (7.49) | 98 (11.86) | |
| Trunk | 14 (3.74) | 69 (8.35) | |
| Abdomen | 13 (3.48) | 71 (8.60) | |
| Chest | 11 (2.94) | 19 (2.30) | |
| Face | 9 (2.41) | 38 (4.60) | |
| Upper extremity | 9 (2.41) | 36 (4.36) | |
| Foot | 6 (1.60) | 15 (1.82) | |
| Lower limb | 6 (1.60) | 10 (1.21) | |
| Other (139 locations) | 53 (14.17) | 330 (39.95) | |
| Unknown/missing | 180 (48.13) | 8 (0.97) |
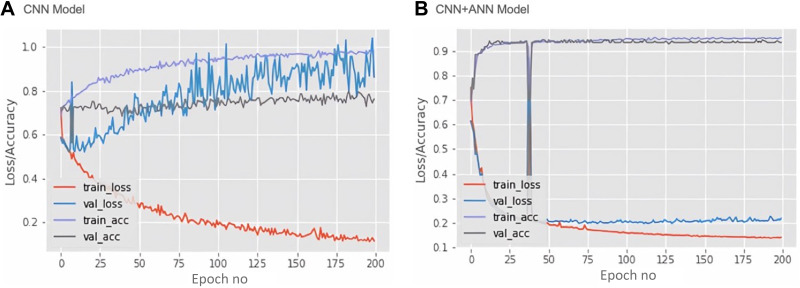
Training loss, validation loss, training accuracy, validation accuracy and epochs are the important parameters to diagnose learning model problems. The error on the training set is defined as training loss; whereas the validation loss is an error followed by running the validation set via previously trained CNN. Therefore, in our study, we determined these parameters of the CNN and CNN+ANN, which have been represented as a model learning curve (Figure 4). The network model has been trained for 200 Epochs since extra training showed no decrease in validation loss. The CNN model (Figure 4A) demonstrated an overfitting due to the large gap between training and validation as well as loss and accuracy. The training loss diminished after every epoch, indicating the learning ability of the CNN model in recognizing specific images through the training set. However, the validation loss increased after every epoch, implying that training data does not fit into validation, and this model could not be satisfactorily generalized on the validation set. Further, the ANN+CNN model (Figure 4B) demonstrates a decrease in training and validation loss with increase in number of epochs. The minimum gap between training and validation both in loss and accuracy was also revealed. This curve indicates that the ANN+CNN model is less overfitting than the CNN model with improved learning optimization and performance.
Figure 4.
Mode learning curve. Based on loss and accuracy curve of training and validation vs epoch in each model, the learning optimization and performance of the CNN+ANN model (B) has improved more than the CNN model (A). The loss and accuracy of the CNN+ANN model (B) shows that the model is more representative and less overfitting than the CNN model (A).
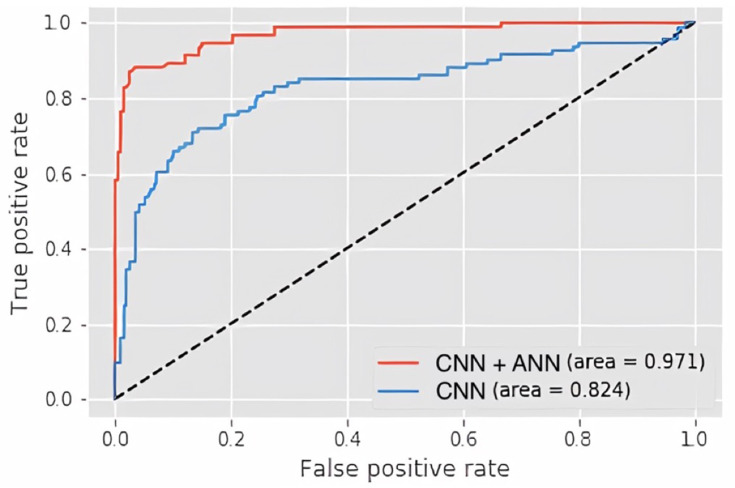
Model accuracy is measured by AUROC, which has been represented for CNN and CNN+ANN model in Figure 5. ROC curve is a graph that plots the true positive rate (y-axis) against the false positive rate (x-axis) based on the variation in the threshold for assigning observations to a particular class, which functions to summarize the performance of the classifier across all possible thresholds. The results show a higher AUC (97.1%) of the CNN+ANN model compared to CNN (82.4%), which indicate its greater accuracy.
Figure 5.
Area under the receiver operating characteristic curve (AUROC). The CNN+ANN model (red line) outperforms the CNN model (blue line).
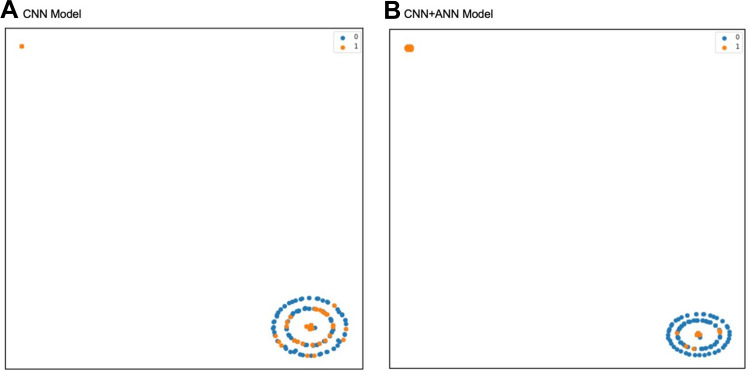
The label distributions of CNN and CNN+ANN models are shown in Figure 6. The output of the model is described as T-distributed stochastic neighbor embedding (t-SNE) two-dimensional plot. Prediction results of the CNN model show that the malignant melanomas are mostly located on the same area of benign melanomas. Otherwise, prediction results of CNN+ANN shows fewer malignant melanomas found on benign melanomas area. This indicates that the malignant melanoma tends to be classified better in the CNN+ANN model than in CNN model.
Figure 6.
T-distributed stochastic neighbor embedding (t-SNE) plot to describe label distribution of malignant melanoma in the CNN model (A) and the CNN+ ANN model (B). The malignant melanoma tends to be classified better in the CNN+ANN model (B) than in the CNN model (A). One datum with malignant melanoma represented by one orange dot, one datum with nonmalignant melanoma represented by one blue dot.
Confusion matrix is a contingency table with two dimensions, namely actual and predictive, in each of these dimensions there is a collection of identical classes, so that each dimension and class combination is a variable in the contingency table. This table serves to visualize algorithm performance, to see if the system is confused or has mislabeled one another. The details of the CNN model and CNN+ANN model confusion matrix are shown in Tables 2 and 3, respectively. Table 2 shows that there were many misclassifications of nonmalignant melanoma in the CNN model, but most of these misclassifications were corrected in the CNN+ANN model (Table 3).
Table 2.
Confusion Matrix CNN
| Predicted Labels | Total | |||
|---|---|---|---|---|
| Nonmalignant Melanoma | Malignant Melanoma | |||
| True Labels | Nonmalignant Melanoma | 196 | 11 | 207 |
| Malignant Melanoma | 44 | 49 | 93 | |
| Total | 240 | 60 | 300 | |
Table 3.
Confusion Matrix CNN+ANN
| Predicted Labels | Total | |||
|---|---|---|---|---|
| Nonmalignant Melanoma | Malignant Melanoma | |||
| True Labels | Nonmalignant Melanoma | 202 | 5 | 207 |
| Malignant Melanoma | 12 | 81 | 93 | |
| Total | 214 | 86 | 300 | |
Based on Table 4, the CNN model, with only image input information, yields an AUROC of 82.40%. Meanwhile, the CNN+ANN model with a combination of image and patient’s metadata reaches an AUROC of 97.10%. The CNN+ANN model also achieved a recall (sensitivity) of 87.10% at a precision (positive predictive value) of 94.19%. The accuracy reaches 94.33% and the balanced accuracy is 92.34%. The CNN+ANN model shows higher performance over the CNN model.
Table 4.
Malignant Melanomas Detection Result Using CNN Model and CNN+ANN Model
| Model | Data Set | Number of Malignant Melanomas | TP | FP | FN | Precision (%) | Recall (%) | Accuracy (%) | Balanced Accuracy (%) | F1 | AUROC (%) |
|---|---|---|---|---|---|---|---|---|---|---|---|
| CNN | 300 | 93 | 49 | 11 | 44 | 81.67 | 52.69 | 81.67 | 73.69 | 64.05 | 82.40 |
| CNN+ANN | 300 | 93 | 81 | 5 | 12 | 94.19 | 87.10 | 94.33 | 92.34 | 90.50 | 97.10 |
The final model file size is 25.4 MB (MB), relatively small to be loaded and run from any computer (with CPU Core I3 class or even lower, without discreet GPU/TPU or neural engine). It can be reduced further by the TensorFlow optimization toolkit for an on-device deployment as a fully offline classifier application.
Discussion
Detection of abnormality in medical images is the process of identification of some diseases such as cancer. In the past, clinicians detected these abnormalities depending on time-consuming human labor effort. Therefore, development of an automatic system used to detect abnormality is urgently needed. Different methods are proposed for abnormality detection in medical images. For example, magnetic resonance imaging of brain split fusion (ie, potential field segmentation) is used to detect tumors.13
In general, a computer-aided diagnosis (CAD) system is widely used to assist radiologists and clinicians on diagnosis of medical images. The CAD system is established on medical image processing, machine learning, and computer vision algorithms. A typical CAD system involves the following stages: preprocessing, feature extraction, feature selection, and classification.14 Deep learning is a tool for machine learning on multiple linear processing units and nonlinear processing units which abstracted from the data.15 There are many well-known deep learning technique applications such as autoencoders, stacked autoencoders, restricted Boltzmann machines (RBMs), deep belief networks (DBNs) and deep CNNs. Lately, the CNN method has been applied widely in medical image analysis as well as vision systems.16–18 However, there are few studies considered to combine dermoscopic images and patient’s metadata as training data under CNN-based methods. In this study, we also successfully demonstrate an application of a CNN+ANN model which combined dermoscopic images and patient’s metadata to detect malignant melanoma.
In spite of the ability of deep learning methods with higher performance, there are several limitations which restrain implementation in clinical practice. Deep learning architecture needs substantial training data and computing power. Shortage of computing power causes more training network time which depends on the magnitude of the training data inputted. For example, CNNs unusually involve a difficult task which takes priority of labeling data for supervised learning and manual labeling of medical images. These limitations may be overcome by a stronger facility including increased computing power, data storage facilities enhancement, digital storage medical images upgrade, and improvement of the deep network architecture. The application of deep learning in diagnostic imaging analysis also had the same criticism as black box problem in artificial intelligence in which inputs and outputs are known, but the internal representations are not clarified. Applications are also altered by noise and brightness issues fundamental to the medical images.19 We use preprocessing steps to remove the noise in order to ameliorate the performance. We also reduced the number of training data to hundreds instead of thousands and resized the training input to 64x64 pixels to lower the computer capability requirements, and finally include the metadata into the training process to improve the learning progress.
Compared with the previous studies,20–25 our result has a similar high performance even though we used less dataset, unbalanced data which was closer to the clinical setting implementation, lower size and no need of high computational devices. This model will be useful for screening, early detection for patients in low-resource and remote area health care. A limitation of our study is that it required manual cropping. In future research we will optimize smaller size mode further by utilizing TensorFlow optimization kit if needed and develop the application from image cropping until prediction in mobile phone/low computational devices.
Conclusion
The CNN+ANN model outperformed the CNN model with only dermoscopic images. The CNN+ANN model combination of dermoscopic images and patient’s metadata can increase the accuracy of classification in malignant melanoma detection even with limited data and prevent the overfitting that happened in the CNN model with only dermoscopic images.
Acknowledgments
The first author thanks the Directorate General of Resources for Science, Technology and Higher Education, at the Ministry of Education and Culture, Republic Indonesia for the sponsorship of her doctoral study. The author is also grateful to Muhammad Solihuddin Muhtar, International Center for Health Information Technology, Taipei Medical University, who provided advice and assisted on the process of evaluating model performance. He was not compensated for his contribution.
Disclosure
The authors report no conflicts of interest in this work.
References
- 1.Fitzmaurice C, Akinyemiju TF, Al Lami FH, et al. Global, regional, and national cancer incidence, mortality, years of life lost, years lived with disability, and disability-adjusted life-years for 29 cancer groups, 1990 to 2016: a Systematic Analysis for the Global Burden of Disease Study. JAMA Oncol. 2018;4(11):1553–1568. doi: 10.1001/jamaoncol.2018.2706 [DOI] [PMC free article] [PubMed] [Google Scholar]
- 2.Meyskens FL, Mukhtar H, Rock CL, et al. Cancer prevention: obstacles, challenges, and the road ahead framing the major issues. J Natl Cancer Inst. 2016;108(2):djv309. [DOI] [PMC free article] [PubMed] [Google Scholar]
- 3.ISIC Archive. Available from: https://www.isic-archive.com/#!/topWithHeader/tightContentTop/about/isicArchive. Accessed July11, 2019.
- 4.Tromme I, Legrand C, Devleesschauwer B, et al. Melanoma burden by melanoma stage: assessment through a disease transition model. Eur J Cancer. 2016;53:33–41. doi: 10.1016/j.ejca.2015.09.016 [DOI] [PubMed] [Google Scholar]
- 5.Brunssen A, Waldmann A, Eisemann N, Katalinic A. Impact of skin cancer screening and secondary prevention campaigns on skin cancer incidence and mortality: a systematic review. J Am Acad Dermatol. 2017;76(1):129–139.e10. doi: 10.1016/j.jaad.2016.07.045 [DOI] [PubMed] [Google Scholar]
- 6.Dascalu A, David EO. Skin cancer detection by deep learning and sound analysis algorithms: a prospective clinical study of an elementary dermoscope. EBioMedicine. 2019;43:107–113. doi: 10.1016/j.ebiom.2019.04.055 [DOI] [PMC free article] [PubMed] [Google Scholar]
- 7.Li Y, Shen L. Skin lesion analysis towards melanoma detection using deep learning network. Sensors (Basel). 2018;18(2). [DOI] [PMC free article] [PubMed] [Google Scholar]
- 8.Hosseinzadeh Kassani S, Hosseinzadeh Kassani P. A comparative study of deep learning architectures on melanoma detection. Tissue Cell. 2019;58:76–83. doi: 10.1016/j.tice.2019.04.009 [DOI] [PubMed] [Google Scholar]
- 9.Zhang J, Xie Y, Xia Y, et al. Attention residual learning for skin lesion classification. IEEE Trans Med Imaging. 2019;1. [DOI] [PubMed] [Google Scholar]
- 10.Creative Commons. Attribution-noncommercial 4.0 international — CC BY-NC 4.0. Available from: https://creativecommons.org/licenses/by-nc/4.0/. Accessed July11, 2019.
- 11.Tschandl P, Rosendahl C, Kittler H. The HAM10000 dataset, a large collection of multi-source dermatoscopic images of common pigmented skin lesions. Sci Data. 2018;5(1):180161. doi: 10.1038/sdata.2018.161 [DOI] [PMC free article] [PubMed] [Google Scholar]
- 12.Codella NCF, Gutman D, Celebi ME, et al. Skin lesion analysis toward melanoma detection: a challenge at the 2017 International Symposium on Biomedical Imaging (ISBI), hosted by the international skin imaging collaboration (ISIC). Proceedings - International Symposium on Biomedical Imaging. IEEE Computer Society; 2018:168–172. [Google Scholar]
- 13.Cabria I, Gondra I. Mri segmentation fusion for brain tumor detection. Inf Fusion. 2017;36:1–9. doi: 10.1016/j.inffus.2016.10.003 [DOI] [Google Scholar]
- 14.Mosquera-Lopez C, Agaian S, Velez-Hoyos A, Thompson I. Computer-aided prostate cancer diagnosis from digitized histopathology: a review on texture-based systems. IEEE Rev Biomed Eng. 2015;8:98–113. doi: 10.1109/RBME.2014.2340401 [DOI] [PubMed] [Google Scholar]
- 15.Deng L, Yu D. Deep learning: methods and applications. foundations and trends®. Signal Process. 2014;7(3–4):197–387. [Google Scholar]
- 16.Premaladha J, Ravichandran K. Novel approaches for diagnosing melanoma skin lesions through supervised and deep learning algorithms. J Med Syst. 2016;40(4):96. doi: 10.1007/s10916-016-0460-2 [DOI] [PubMed] [Google Scholar]
- 17.Kharazmi P, Zheng J, Lui H, Wang ZJ, Lee TK. A computer-aided decision support system for detection and localization of cutaneous vasculature in dermoscopy images via deep feature learning. J Med Syst. 2018;42(2):33. doi: 10.1007/s10916-017-0885-2 [DOI] [PubMed] [Google Scholar]
- 18.Wang SH, Phillips P, Sui Y, Liu B, Yang M, Cheng H. Classification of alzheimer’s disease based on eight-layer convolutional neural network with leaky rectified linear unit and max pooling. J Med Syst. 2018;42(5):85. doi: 10.1007/s10916-018-0932-7 [DOI] [PubMed] [Google Scholar]
- 19.Hussain S, Anwar SM, Majid M. Segmentation of glioma tumors in brain using deep convolutional neural network. Neurocomputing. 2018;282:248–261. doi: 10.1016/j.neucom.2017.12.032 [DOI] [Google Scholar]
- 20.Manzo M, Pellino S. Bucket of deep transfer learning features and classification models for melanoma detection. J Imaging. 2020;6(12):129. doi: 10.3390/jimaging6120129 [DOI] [PMC free article] [PubMed] [Google Scholar]
- 21.Winkler JK, Sies K, Fink C, et al. Melanoma recognition by a deep learning convolutional neural network-performance in different melanoma subtypes and localisations. Eur J Cancer. 2020;127:21–29. doi: 10.1016/j.ejca.2019.11.020 [DOI] [PubMed] [Google Scholar]
- 22.Banerjee S, Singh SK, Chakraborty A, Das A, Bag R. Melanoma diagnosis using deep learning and fuzzy logic. Diagnostics. 2020;10(8):577. doi: 10.3390/diagnostics10080577 [DOI] [PMC free article] [PubMed] [Google Scholar]
- 23.Bajwa MN, Muta K, Malik MI, et al. Computer-aided diagnosis of skin diseases using deep neural networks. Appl Sci. 2020;10(7):2488. doi: 10.3390/app10072488 [DOI] [Google Scholar]
- 24.Kassem MA, Hosny KM, Fouad MM. Skin lesions classification into eight classes for ISIC 2019 using deep convolutional neural network and transfer learning. IEEE Access. 2020;8:114822–114832. doi: 10.1109/ACCESS.2020.3003890 [DOI] [Google Scholar]
- 25.Yap J, Yolland W, Tschandl P. Multimodal skin lesion classification using deep learning. Exp Dermatol. 2018;27(11):1261–1267. doi: 10.1111/exd.13777 [DOI] [PubMed] [Google Scholar]


