

Summary
The aim of this study is to investigate myocardial damage in recovering coronavirus disease 2019 (COVID-19) patients with high-sensitivity troponin levels (hsTnT) and echocardiography. In this single-center cohort study, 215 COVID-19 recovered patients were recruited from all over Japan between April and September 2020. Demographic characteristics, hsTnT levels, and echocardiography data were collected for 209 patients, after excluding those without serum samples or good-quality echocardiographic images. The mean (± standard deviation) age was 44 (± 12) years (range: 36-55 years), and 50.7% of the patients were males. The median time interval (interquartile range) from COVID-19 onset to post-recovery examination was 56 days (34-96 days). Seventy-four recovered patients (35.4%) had hsTnT less than detection sensitivity (< 3 pg/mL) and 135 recovered patients (64.6%) had hsTnT ≥ 3 pg/mL. Ejection fraction was more than 50% in all cases. Left ventricular global longitudinal strain (LVGLS) and right ventricular free-wall longitudinal strain (RVFWLS) were reduced in 62 (29.7%) and 8 patients (3.8%), respectively. They were significantly associated with elevated hsTnT levels. In cases with hsTnT above 5 pg/mL, the LVGLS was greatly reduced to 19.0 ± 2.2% (p < 0.001). Multivariate linear regression analysis showed that elevated hsTnT level was an independent predictor of reduced LVGLS (standardized β = -0.34; p < 0.001). In recovered COVID-19 patients, even a slight increase in hsTnT above detection sensitivity was associated with decreased LVGLS. hsTnT and echocardiography may be useful tools to detect myocardial injury in recovered COVID-19 patients.
Keywords: COVID-19, myocardial injury, high-sensitivity troponin levels, left ventricular global longitudinal strain, COVID-19 sequelae
Introduction
Coronavirus disease 2019 (COVID-19) is a threat in terms of prevalence and mortality worldwide (1). Myocardial damage in patients with COVID-19 infection has been reported (2,3). Several case reports and small series have suggested that elevated troponin in COVID-19 patients has a significant impact on worsening cardiovascular disease and death (4-6). Recently, a study reported an association between high-sensitivity troponin T (hsTnT) levels slightly elevated above the detection sensitivity and myocardial damage on magnetic resonance imaging (MRI) in recovered COVID-19 (7). In addition, cardiac MRI abnormalities were detected in mild cases of COVID-19 among young athletes (8). It was also reported that strain analysis by echocardiography performed during hospitalization was associated with death (9-11). In particular, myocardial strain analysis by echocardiography has shown that a reduction in left and right ventricular longitudinal strain is an independent prognostic factor (12,13). Therefore, it is assumed that abnormalities in cardiac functions seen on an echocardiogram may be prolonged even after the recovery of the infection. In addition, there are no studies on the detailed assessment of cardiac functions by echocardiography during the recovery period, including studies on patients with mild or poor symptomatic disease and no history of oxygen inhalation.
The aim of this study was to evaluate the presence of myocardial damage using serological myocardial damage markers and echocardiography in patients who had recently recovered from COVID-19 disease.
Patients and Methods
Study design and population
Patients who participated in COVIPLA, a study on convalescent plasma therapy in Japan between April and September 2020, were enrolled in this study.
Patients ranged in age from 20 to 70 years, and all participants had negative results on swab tests and underwent blood tests and echocardiography at least 3 weeks after onset of infection. All examinations in the COVID-19 recovery period were performed in the National Center for Global Health and Medicine. In addition, patients weighing more than 45 kg among males and more than 40 kg among females were enrolled.
This study conforms to the guidelines laid down by the Declaration of Helsinki, and the protocol was approved by the hospital ethics committee (NCGM-G-003559-01). An opportunity for eligible patients to refuse to participate in this study was provided by opting out format.
Measurement of hsTnT
Measurement of hsTnT was performed using a commercially standardized sample kit (Roche Diagnostics, Tokyo, Japan) on the serum samples stored at -80°C obtained from the COVIPLA registry.
Echocardiographic data analysis
Echocardiography was performed on the same day as that of blood sampling. Comprehensive echocardiographic examination was performed using commercially available ultrasound machines (Artida; Toshiba Medical Systems, Tokyo, Japan) by trained and registered echocardiographers who were blinded to the clinical information of the patients.
Ejection fraction (EF) and left ventricular (LV) end-diastolic and end-systolic volumes were calculated using the disk summation method. Right ventricular (RV) end-diastolic area and RV fractional area change (RVFAC) were measured from the apical 4-chamber view to approximate RV size and systolic function, respectively. Tricuspid annular plane systolic excursion (TAPSE) was measured from the apical four-chamber view with the M-mode cursor through the lateral tricuspid annulus. Cardiac function analysis was performed by a cardiology specialist and a clinical technician specializing in echocardiography. In speckle tracking analysis, LV global longitudinal strain (LVGLS), circumferential strains, and RV longitudinal strain (RVLS) were measured using Image Arena (TOMTEC Imaging Systems, Germany). LVGLS was calculated from the averages of the 4-chamber, 3-chamber, and 2-chamber views, and RVLS was calculated from the 4-chamber view to obtain RV 4-chamber strain including the ventricular septum (RV4CSL) and right ventricular free-wall longitudinal strain (RVFWLS) (14).
In this study, strain values were expressed in absolute values, and larger absolute values indicated better cardiac ventricular function. Myocardial strain analysis was performed by two independent, blinded observers. Ventricular dimensions, volume procedures, and reference values for abnormalities were based on the guidelines of the American Society of Echocardiography and the European Society of Cardiovascular Imaging (15). As a control group for right and left ventricular myocardial strain, age, sex and hypertension matched patients (n = 30) with no history of cardiovascular disease were referred.
Statistical analysis
Continuous measures were shown as mean ± standard deviation, and if the variables were normally distributed, t-test and ANOVA were used to compare differences between two and three groups, respectively. If the variables were not normally distributed, they were expressed as median values (25th-75th percentile) and compared between two groups using the Mann-Whitney U test and between three groups using the Kruskal- Wallis test. Comparisons among the three groups were performed using the Tukey-Kramer post hoc test or the Dunn correction for post hoc analyses, according to the distribution of the test.
Categorical variables were presented as numbers and percentages and compared using the chi-squared test or the Kruskal-Wallis test. Correlations of continuous variables were tested with the Pearson's correlation coefficient if the data were normally distributed. A two-sided p-value < 0.05 was considered statistically significant.
In myocardial strain analysis, intra-observer variability by the same observer at two different time points for 15 patients was also analyzed. The results were analyzed using Pearson correlation analysis and the Bland-Altman method.
Multiple linear regression analysis of the association between echocardiographic strain measures and hsTnT levels, including age, sex, and risk of cardiovascular disease risk as independent variables, was performed. Standardized partial regression coefficients (β) were used to compare the effect on the dependent variable, and 95% confidence intervals were determined.
All statistical analyses were performed using IBM SPSS statistical software, version 24 (IBM, Illinois, USA).
Results
Patient characteristics
Two hundred and fifteen patients from the COVIPLA registry who underwent echocardiography and blood tests were enrolled between April and September 2020. We finally included 209 patients after excluding cases in which hsTnT levels could not be measured due to lack of serum samples (n = 5) and in which good-quality echocardiographic images were not available (n = 1). The mean age (± standard deviation) was 44 ± 12 years (range: 36-55 years). The proportion of males was 50.7%. Of the 41 patients (19.6%) with a history of oxygen inhalation, 4 (1.9%) had a history of intubation and 3 (1.4%) had a history of extracorporeal membrane oxygenation.
Elevation of hsTnT
The hsTnT levels were less than the detection sensitivity (< 3 pg/mL) in 74 recovered patients (35.4%) and were ≥ 3 pg/mL in the remaining 135 recovered patients (64.6%). In this study, we compared hsTnT levels between two groups: one with levels less than detection sensitivity (< 3 pg/mL) and the other with levels ≥ 3 pg/mL. The baseline characteristics of patients in these two groups are summarized in Table 1. Comparisons between the groups showed significant differences in age, sex, body mass index (BMI), hypertension, diabetes mellitus, dyslipidemia, oxygen demand on admission, and hemoglobin levels.
Table 1. Baseline characteristics according to hsTnT Levels.
| Variables | Overall, n = 209 | hsTnT < 3, n = 74 | hsTnT ≥ 3, n = 135 | p-value |
|---|---|---|---|---|
| Age, y | 45 ± 12 | 38 ± 9 | 49 ± 12 | < 0.001 |
| Males | 106 (50.7%) | 13 (17.6%) | 93 (68.9%) | < 0.001 |
| BMI, kg/m2 | 24.3 ± 3.7 | 22.4 ± 2.0 | 25.6 ± 4.2 | < 0.001 |
| HR, beats/min | 65 ± 10 | 63 ± 9 | 65 ± 10 | 0.10 |
| Comorbidities | ||||
| Hypertension | 33 (15.8%) | 3 (4.1%) | 30 (22.2%) | < 0.001 |
| Diabetes | 16 (7.7%) | 0 (0.0%) | 16 (11.9%) | 0.001 |
| Dyslipidemia | 26 (12.4%) | 2 (2.7%) | 24 (17.8%) | 0.001 |
| Smoking | 47 (22.5%) | 15 (20.3%) | 32 (23.7%) | 0.63 |
| COPD | 1 (0.5%) | 0 (0.0%) | 1 (0.7%) | 1.00 |
| CAD | 0 (0.0%) | 0 (0.0%) | 0 (0.0%) | - |
| Arrhythmia | 4 (1.9%) | 0 (0.0%) | 4 (3.0%) | 0.30 |
| Oxygen inhalation | 41 (19.6%) | 4 (5.4%) | 37 (27.4%) | < 0.001 |
| Intubation | 5 (2.4%) | 1 (1.4%) | 4 (3.0%) | 0.66 |
| ECMO | 0 (0.0%) | 0 (0.0%) | 2 (1.5%) | 0.54 |
| Laboratory | ||||
| WBC, × 103/μL | 5,649 ± 1,434 | 5,663 ± 1,503 | 5,591 ± 1,401 | 0.73 |
| Hemoglobin, g/dL | 13.8 ± 1.4 | 13.1 ± 1.1 | 14.1 ± 1.4 | < 0.001 |
| Creatinine, mol/L | 0.71 ± 0.15 | 0.65 ± 0.1 | 0.74 ± 0.2 | 0.03 |
| eGFR, ml/min/1.73 m2 | 88.1 ± 11.1 | 89.2 ± 9.6 | 87.4 ±12.1 | 0.27 |
| Echocardiography | ||||
| LVEF < 53% | 0 (0.0%) | 0 (0.0%) | 0 (0.0%) | - |
| LVGLS < 20% | 62 (29.7%) | 3 (4.1%) | 59 (43.7%) | < 0.001 |
| RVFAC < 35% | 17 (8.1%) | 3 (4.1%) | 14 (10.4%) | 0.18 |
| TAPSE < 17 mm | 16 (7.7%) | 3 (4.1%) | 13 (9.6%) | 0.27 |
| RVFWLS < 20% | 8 (3.8%) | 0 (0.0%) | 8 (6.0%) | 0.05 |
Results are expressed as mean ± standard deviation or number (%). BMI, body mass index; CAD, coronary artery disease; COPD, chronic obstructive pulmonary disease; ECMO, extracorporeal membrane oxygenation; eGFR, estimated glomerular filtration rate; HR, heart rate; hsTnT, high-sensitivity troponin T; LVEF, left ventricular ejection fraction; LVGLS, left ventricular global longitudinal strain; RVFAC, right ventricular fractional area change; RVFWLS, right ventricular free-wall strain; TAPSE, tricuspid annular plane systolic excursion; WBC, white blood cell count.
Echocardiographic parameters based on hsTnT levels
The LVEF was more than 50% in all cases. According to the guidelines for echocardiographic abnormalities (14), LVGLS was reduced (< 20%) in 62 patients (29.7%), TAPSE was < 17 mm in 16 patients (7.7%), and RVFWLS was < 20% in 8 patients (3.8%). A significant difference in the reduction of LVGLS was observed between patients with hsTnT levels below the detection sensitivity (hsTnT < 3) and those with levels ≥ 3 (p < 0.001) (Table 1). Table 1 shows the comparison of the mean values of different echocardiographic parameters between the two groups. There were significant differences between the groups in terms of LV end-diastolic and -systolic volumes, LV mass index, LVGLS, and LV diastolic functions (E/A (E: early diastolic trans-mitral flow velocity, A: late diastolic trans-mitral flow velocity) and E/e' (e': early diastolic mitral annular velocity, DT deceleration time)). Right atrial (RA) and ventricular volumes (RA area, RV end-diastolic area) and RV systolic functions (TAPSE, RVLS) were statistically different.
Figure 1 shows a comparison by one-way ANOVA and post hoc analysis of control and hsTnT levels. LVEF was not significantly different among the three groups at the hsTnT level (64.9 ± 4.6%, 65.8 ± 4.3%, and 66 ± 4.9%; p = 0.36). The mean value of LVGLS in control group was 22.7 ± 4.1%. There was a significant difference among the three groups at the hsTnT level (21.8 ± 1.9%, 20.7 ± 1.8%, and 19.0 ± 2.2%; p < 0.001). Furthermore, post hoc analysis in the 3 ≤ hsTnT < 5 and 5 ≤ hsTnT groups showed a significant difference in LVGLS. RV4CSL and RVFWSL were significantly different among the three hsTnT groups. Significant differences were also detected in RV4CSL (22.4 ± 3.0% and 20.5 ± 2.8%; p = 0.006) and RVFWLS (26.0 ± 3.5% and 24.1 ± 3.1%; p = 0.001) when the 3 ≤ hsTnT < 5 group and 5 < hsTnT group were compared. Only groups above the detection sensitivity of hsTnT (> 3 pg/mL), and the parameters that divided these into two groups by a median of 5 pg/mL of hsTnT are shown in Supplementary Table S1(https://www. globalhealthmedicine.com/site/supplementaldata. html?ID=19). There were significant differences in LVGLS, LV volume, myocardial thickness, RVLS (RV4CSL and RVFWLS), and RA area between the two groups above hsTnT detection sensitivity. A comparison of hsTnT with left and right ventricular function showed a stronger correlation of hsTnT with LVGLS (r = -0.56, p < 0. 001) than with RVFWSL (r = -0.34, p < 0.001) or EF (r = -0.02, p = 0.74) (Figure 2).
Figure 1.
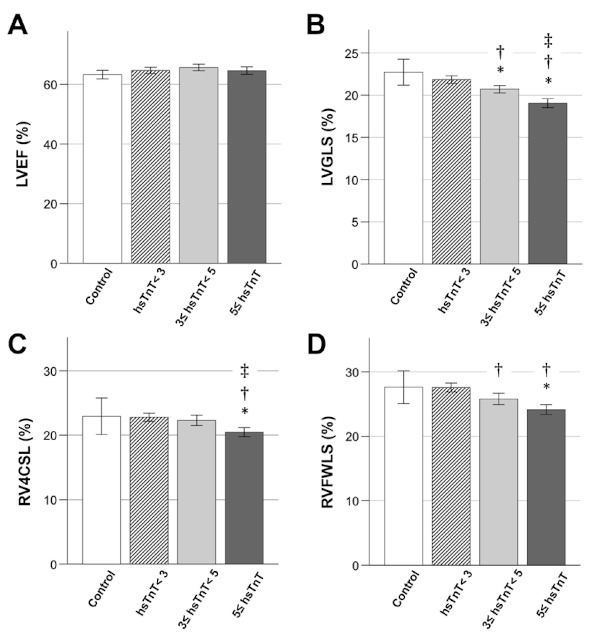
Comparison of cardiac ventricular functions at different hsTnT levels in recovered COVID-19 patients. (A) Significant differences were not detected in LVEF of hsTnT among the four groups. (B, C, and D) Significant differences in LVGLS, RV4CSL, and RVFWLS between the two groups above hsTnT detection sensitivity (3 ≤ hsTnT). *p < 0.05 compared with control. †p < 0.05 compared with hsTnT < 3. ‡p < 0.05 compared with 3 ≤ hsTnT < 5. hsTnT, high-sensitivity troponin; LVEF, left ventricular ejection fraction; LVGLS, left ventricular global longitudinal strain; RV4CSL, right ventricular 4-chamber strain including the ventricular septum; RVFWLS, right ventricular free-wall longitudinal strain.
Figure 2.
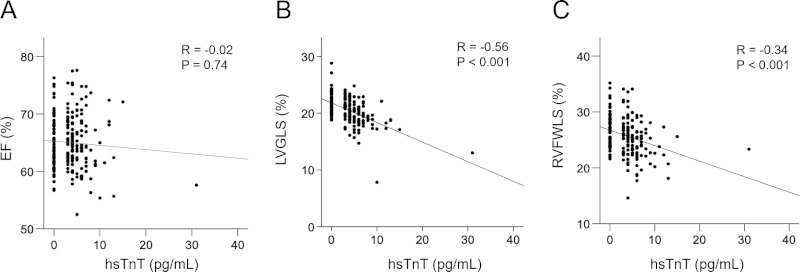
Relationship between hsTnT and cardiac function in recovered COVID-19 patients. There was no significant correlation between hsTnT and EF (A). LVGLS (B) and RVFWLS (C) were significantly correlated with hsTnT. LVGLS had a more significant correlation with hsTnT than RVFWSL. EF, ejection fraction; hsTnT, high-sensitivity troponin; LVGLS, left ventricular global longitudinal strain; RVFWLS, right ventricular free-wall longitudinal strain.
Multiple linear regression analysis in LVGLS and RVLS
Multiple regression analysis was performed to examine the association of LVGLS and RVFWSL decline with the level of hsTnT values, including age, BMI, impaired renal function, diabetes, hypertension, and in-hospital oxygen demand as independent variables.
In the multiple regression analysis adjusted for LVGLS, age (β = -0.14, 95% confidence interval [CI] = -0.05 to -0.001, p = 0.04), male sex (β = -0.26, 95% CI = -1.78 to -0.62, p < 0.001), and elevated hsTnT (β = -0.34, 95% CI = -0.30 to -0.12, p < 0.001) were independent risk factors (Table 2).
Table 2. Multivariate linear regression analysis as a predictor of LVGLS and RVFWLS.
| Variables | LVGLS |
RVFWLS |
||||
|---|---|---|---|---|---|---|
| β | 95% CI | p-value | β | 95% CI | p-value | |
| Age | -0.14 | -0.05 to -0.001 | 0.04 | -0.23 | -0.11 to -0.02 | 0.005 |
| Sex (male) | -0.26 | -1.78 to -0.62 | < 0.001 | -0.15 | -2.0 to -0.06 | 0.04 |
| BMI | -0.06 | -0.12 to 0.04 | 0.33 | -0.19 | -0.3 to -0.05 | 0.008 |
| Hypertension | -0.23 | -0.89 to 0.61 | 0.71 | 0.07 | -0.67 to 1.9 | 0.34 |
| Diabetes | -0.06 | -1.5 to 0.49 | 0.31 | -0.09 | -2.5 to 0.96 | 0.23 |
| Oxygen inhalation | 0.04 | -0.46 to 0.88 | 0.54 | -0.02 | -1.3 to 0.97 | 0.76 |
| eGFR | -0.11 | -0.04 to 0.0 | 0.05 | -0.12 | -0.08 to 0.003 | 0.04 |
| hsTnT | -0.34 | -0.30 to -0.12 | < 0.001 | -0.14 | -0.28 to 0.02 | 0.08 |
β, standardizedβ; BMI, body mass index; CI, confidence intervals; eGFR, estimated glomerular filtration rate; hsTnT, high-sensitivity troponin T; LVGLS, left ventricular global longitudinal strain; RVFWLS, right ventricular free-wall strain.
In the multiple regression analysis adjusted for RVFWSL, age (β = -0.23, 95% CI = -0.11 to -0.02, p = 0.005), males (β = -0.15, 95% CI = -2.0 to -0.06, p = 0.04), and BMI (β = -0.19, 95% CI = -0.30 to -0.05, p = 0.008) were associated with RVFWSL. The association between hsTnT and RVFWSL was not statistically significant (β = -0.14, 95% CI = -0.28 to 0.02, p = 0.08) (Table 2).
Reproducibility
Excellent correlations were shown in the inter- and intra-observer variability of LVGLS, RVGLS, and RVFWLS (r = 0.95 and r = 0.94 for LVGLS, r = 0.94 and r = 0.96 for RV4CSL, and r = 0.97 and r = 0.90 for RVFWLS). Bland-Altman analysis showed that interobserver and intra-observer variability was -0.5 ± 1.8% and -0.5 ± 1.9 for LVGLS, 0.6 ± 2.6% and 0.6 ± 2.5% for RV4CSL, -0.3 ± 2.8% and 0.2 ± 1.5% for the RVFWLS.
Discussion
Of the 209 patients who recovered from COVID-19 infection, 67 (32.1%) had reduced LVGLS. Furthermore, LVGLS was associated with elevated hsTnT levels. These abnormalities were seen in patients in their late thirties, and their frequency increased with age. In our study, 65% of COVID-19 recovered patients had elevated hsTnT levels above detection sensitivity, whereas in a previous study conducted in Germany (7), 71% of recovered patients had positive hsTnT above detection sensitivity, and the frequency of myocardial dysfunction was similar to the frequency of positivity in our study.
Cardiac MRI studies have shown a correlation between hsTnT and positive T1 mapping, which can detect myocardial damage (7). Our echocardiographic studies also showed a significant correlation between LVGLS and hsTnT, suggesting that echocardiography, which is even easier to perform than cardiac MRI, can also detect small myocardial damage. A multicenter study reported that almost half of the patients admitted with COVID-19 had some abnormal echocardiographic findings, which influenced the changes in treatment strategy (16). Other multicenter studies have reported that elevated troponin and comprehensive echocardiographic abnormalities, including global LV dysfunction, wall motion abnormalities, diastolic dysfunction, RV dysfunction, and the presence of pericardial effusion, affected all-cause mortality (10). Although these past studies did not perform myocardial strain analysis, it indicated the importance of detecting abnormalities on echocardiography. In addition, it has been reported that abnormalities in LVGLS, RVLS, and TAPSE were independent predictors of in-hospital mortality in COVID-19 patients (9,11). Echocardiographic myocardial strain analysis is an accurate and reproducible imaging technique that is angle-independent (17-19). Global longitudinal strain (GLS) measured by echocardiography has been recognized as a more useful parameter than LVEF for detecting subtle abnormal changes and has been successful in predicting cardiovascular diseases (14,20).
In this study, 80% of patients were mildly ill with no history of oxygen inhalation, and on multivariate linear analysis, a history of oxygen inhalation was not associated with lower LVGLS. LVGLS has been reported to be affected by age, impaired renal function, diabetes mellitus, and hypertension (21,22). In addition, a validation study of echocardiographic myocardial strain due to aging in healthy subjects reported that LVGLS physiologically declined with age after 70 years of age (23). Our study did not include patients over 70 years of age or patients with a history of cardiovascular disease such as coronary artery disease, and strain validation in the control group showed an absolute value of more than 20% as normal, the same as guidelines and previous reports (14,23); therefore, the effects were minimal. We have shown that elevated hsTnT is an independent marker of myocardial damage even after adjusting for these risk factors in multiple regression analysis. Furthermore, even a small elevation above detection sensitivity is useful.
In our analysis, RV function was rarely less than 20%, as defined by the guidelines (15), during COVID-19 recovery, although RVGLS was significantly different in each group of hsTnT and was slightly less related to hsTnT in multiple regression analysis. However, a study of COVID-19 hospitalized patients in China found a predominant difference in mortality with RVGLS below 23% of the absolute value (13). In the extreme phase of COVID-19 infection, the cytokine storm causes damage to the right heart system due to acute respiratory distress syndrome (24,25) and pulmonary thromboembolism (26-29). In our study, the impairment of RVGLS was related to BMI even during COVID-19 recovery. It has been reported that COVID-19 is more severe in obese patients (30). Obesity may have an impact on the prolongation of RV dysfunction in COVID-19. More studies are needed on RV function during COVID-19 recovery.
Our study is the first to analyze both myocardial strain and high-sensitivity troponin at the same time in COVID-19 patients during recovery, and to assess the prevalence of myocardial damage as an aftereffect. In this study, there were few abnormalities in RV function, but LV dysfunction was present in about 30% of the patients, and was also associated with elevated hsTnT levels, suggesting that myocardial damage may persist even in the recovery phase of COVID-19. In the future, during the recovery period, it will be important to screen for myocardial damage by echocardiographic reduction in LVGLS or an increase in hsTnT levels above detection sensitivity, followed by cardiac MRI to detect myocardial damage with a more detailed approach.
Our study has some limitations. This was a single-center study, data collection was retrospective, and there were no echocardiographic or hsTnT data before or during COVID-19 infection, and no cardiac magnetic resonance or cardiac catheterization data. There were no comparisons with a control population with cardiovascular risk factors for obesity or diabetes other than hypertension. As the analysis was based on stored serum samples, serological markers such as brain natriuretic peptide were not tested due to insufficient sample volume. There were variations in the time between recovery and testing, so in some cases, abnormalities may not have been detected. Other echocardiographic imaging protocols and post-processing approaches may yield different results; therefore, if multicenter studies are conducted in the future, speckle tracking measurements need to be adjusted for machine-to-machine errors. Finally, there were no outcomes such as cardiovascular events or death in this study, and a longer-term prospective study should be conducted in the future.
Conclusions
In this Japanese cohort study of recovered COVID-19 patients, even a slight increase in hsTnT was an independent marker of decreased LVGLS, and may thus be a useful marker of myocardial injury in recovered COVID-19 patients. Therefore, even if there are no obvious electrocardiogram or chest X-ray abnormalities in recovered COVID-19 patients, it is important to measure hsTnT, and in cases with detectable levels, measurement of LVGLS by echocardiography is recommended and the use of cardioprotective drugs might be considered.
Funding: This work was supported by a donation from the National Center for Global Health and Medicine and supported by the Health, Labour, and Welfare Policy Research Grants, Research on Emerging and Re-emerging Infectious Diseases and Immunization (grant number 20HA1006). The funders/sponsors have had no role in the design and/or implementation of the study.
Conflict of Interest
The authors have no conflicts of interest to disclose.
References
- 1. Guan WJ, Ni ZY, Hu Y, et al. Clinical characteristics of coronavirus disease 2019 in China. N Engl J Med. 2020; 382:1708-1720. [DOI] [PMC free article] [PubMed] [Google Scholar]
- 2. Inciardi RM, Lupi L, Zaccone G, et al. Cardiac involvement in a patient with coronavirus disease 2019 (COVID-19). JAMA Cardiol. 2020; 5:819-824. [DOI] [PMC free article] [PubMed] [Google Scholar]
- 3. Bavishi C, Bonow RO, Trivedi V, Abbott JD, Messerli FH, Bhatt DL. Special Article - Acute myocardial injury in patients hospitalized with COVID-19 infection: A review. Prog Cardiovasc Dis. 2020; 63:682-689. [DOI] [PMC free article] [PubMed] [Google Scholar]
- 4. Guo T, Fan Y, Chen M, Wu X, Zhang L, He T, Wang H, Wan J, Wang X, Lu Z. Cardiovascular implications of fatal outcomes of patients with coronavirus disease 2019 (COVID-19). JAMA cardiol. 2020; 5:811-818. [DOI] [PMC free article] [PubMed] [Google Scholar]
- 5. Shi S, Qin M, Shen B, Cai Y, Liu T, Yang F, Gong W, Liu X, Liang J, Zhao Q, Huang H, Yang B, Huang C. Association of cardiac injury with mortality in hospitalized patients with COVID-19 in Wuhan, China. JAMA cardiol. 2020; 5:802-810. [DOI] [PMC free article] [PubMed] [Google Scholar]
- 6. Chapman AR, Bularga A, Mills NL. High-sensitivity cardiac troponin can be an ally in the fight against COVID-19. Circulation. 2020; 141:1733-1735. [DOI] [PubMed] [Google Scholar]
- 7. Puntmann VO, Carerj ML, Wieters I, Fahim M, Arendt C, Hoffmann J, Shchendrygina A, Escher F, Vasa-Nicotera M, Zeiher AM, Vehreschild M, Nagel E. Outcomes of cardiovascular magnetic resonance imaging in patients recently recovered from coronavirus disease 2019 (COVID-19). JAMA cardiol. 2020; 5:1265-1273. [DOI] [PMC free article] [PubMed] [Google Scholar]
- 8. Rajpal S, Tong MS, Borchers J, Zareba KM, Obarski TP, Simonetti OP, Daniels CJ. Cardiovascular magnetic resonance findings in competitive athletes recovering from COVID-19 infection. JAMA cardiol. 2021; 6:116-118. [DOI] [PMC free article] [PubMed] [Google Scholar]
- 9. Lassen MCH, S k a a r u p KG, L i n d J N, e t a l. Echocardiographic abnormalities and predictors of mortality in hospitalized COVID-19 patients: the ECHOVID-19 study. ESC Heart Fail. 2020; 7:4189-4197. [DOI] [PMC free article] [PubMed] [Google Scholar]
- 10. Giustino G, Croft LB, Stefanini GG, et al. Characterization of myocardial injury in patients with COVID-19. J Am Coll Cardiol. 2020; 76:2043-2055. [DOI] [PMC free article] [PubMed] [Google Scholar]
- 11. Baycan OF, Barman HA, Atici A, Tatlisu A, Bolen F, Ergen P, Icten S, Gungor B, Caliskan M. Evaluation of biventricular function in patients with COVID-19 using speckle tracking echocardiography. Int J Cardiovasc Imaging. 2021; 37:135-144. [DOI] [PMC free article] [PubMed] [Google Scholar]
- 12. Balaban Kocas B, Cetinkal G, Ser OS, Kilci H, Keskin K, Ozcan SN, Verdi Y, Zeren MI, Kilickesmez K. The relation between left ventricular global longitudinal strain and troponin levels in patients hospitalized with COVID-19 pneumonia. Int J Cardiovasc Imaging. 2021; 37:125-133. [DOI] [PMC free article] [PubMed] [Google Scholar]
- 13. Li Y, Li H, Zhu S, et al. Prognostic value of right ventricular longitudinal strain in patients with COVID-19. JACC Cardiovasc Imaging. 2020; 13:2287-2299. [DOI] [PMC free article] [PubMed] [Google Scholar]
- 14. Voigt JU, Pedrizzetti G, Lysyansky P, et al. Definitions for a common standard for 2D speckle tracking echocardiography: consensus document of the EACVI/ ASE/Industry Task Force to standardize deformation imaging. Eur Heart J Cardiovasc Imaging. 2015; 16:1-11. [DOI] [PubMed] [Google Scholar]
- 15. Lang RM, Badano LP, Mor-Avi V, et al. Recommendations for cardiac chamber quantification by echocardiography in adults: an update from the American Society of Echocardiography and the European Association of Cardiovascular Imaging. J Am Soc Echocardiogr. 2015; 28:1-39. e14 [DOI] [PubMed] [Google Scholar]
- 16. Dweck MR, Bularga A, Hahn RT, et al. Global evaluation of echocardiography in patients with COVID-19. Eur Heart J Cardiovasc Imaging. 2020; 21:949-958. [DOI] [PMC free article] [PubMed] [Google Scholar]
- 17. Leitman M, Lysyansky P, Sidenko S, Shir V, Peleg E, Binenbaum M, Kaluski E, Krakover R, Vered Z. Two-dimensional strain-a novel software for real-time quantitative echocardiographic assessment of myocardial function. J Am Soc Echocardiogr. 2004; 17:1021-1029. [DOI] [PubMed] [Google Scholar]
- 18. Kalam K, Otahal P, Marwick TH. Prognostic implications of global LV dysfunction: a systematic review and meta-analysis of global longitudinal strain and ejection fraction. Heart. 2014; 100:1673-1680. [DOI] [PubMed] [Google Scholar]
- 19. Nagata Y, Takeuchi M, Mizukoshi K, et al. Intervendor variability of two-dimensional strain using vendor-specific and vendor-independent software. J Am Soc Echocardiogr. 2015; 28:630-641. [DOI] [PubMed] [Google Scholar]
- 20. Biering-Sorensen T, Biering-Sorensen SR, Olsen FJ, et al. Global longitudinal strain by echocardiography predicts long-term risk of cardiovascular morbidity and mortality in a low-risk general population: The Copenhagen city heart study. Circ Cardiovasc Imaging. 2017; 10:e005521. [DOI] [PMC free article] [PubMed] [Google Scholar]
- 21. Zhang T, Li J, Cao S. Prognostic value of left ventricular global longitudinal strain in chronic kidney disease patients: a systematic review and meta-analysis. Int Urol Nephrol. 2020; 52:1747-1756. [DOI] [PubMed] [Google Scholar]
- 22. Wang Y, Yang H, Huynh Q, Nolan M, Negishi K, Marwick TH. Diagnosis of nonischemic stage B heart failure in Type 2 diabetes mellitus. Optimal parameters for prediction of heart failure. JACC: Cardiovasc Imaging. 2018; 11:1390-1400 [DOI] [PubMed] [Google Scholar]
- 23. Yoshida Y, Nakanishi K, Daimon M, et al. Alteration of cardiac performance and serum B-type natriuretic peptide level in healthy aging. J Am Coll Cardiol. 2019; 74:1789-1800. [DOI] [PubMed] [Google Scholar]
- 24. Li H, Liu L, Zhang D, et al. SARS-CoV-2 and viral sepsis: observations and hypotheses. Lancet. 2020; 395:1517-1520. [DOI] [PMC free article] [PubMed] [Google Scholar]
- 25. Mehta P, McAuley DF, Brown M, Sanchez E, Tattersall RS, Manson JJ, ; HLH Across Speciality Collaboration UK. COVID-19: consider cytokine storm syndromes and immunosuppression. Lancet. 2020; 395:1033-1034. [DOI] [PMC free article] [PubMed] [Google Scholar]
- 26. Magro C, Mulvey JJ, Berlin D, et al. Complement associated microvascular injury and thrombosis in the pathogenesis of severe COVID-19 infection: A report of five cases. Transl Res. 2020; 220:1-13. [DOI] [PMC free article] [PubMed] [Google Scholar]
- 27. Fu J, Kong J, Wang W, et al. The clinical implication of dynamic neutrophil to lymphocyte ratio and D-dimer in COVID-19: A retrospective study in Suzhou China. Thromb Res. 2020; 192:3-8. [DOI] [PMC free article] [PubMed] [Google Scholar]
- 28. Bikdeli B, Madhavan MV, Jimenez D, et al. COVID-19 and thrombotic or thromboembolic disease: Implications for prevention, antithrombotic therapy, and follow-up: JACC state-of-the-art review. J Am Coll Cardiol. 2020; 75:2950-2973. [DOI] [PMC free article] [PubMed] [Google Scholar]
- 29. Piazza G, Morrow DA. Diagnosis, management, and pathophysiology of arterial and venous thrombosis in COVID-19. JAMA. 2020; 324:2548-2549. [DOI] [PubMed] [Google Scholar]
- 30. Tartof SY, Qian L, Hong V, et al. Obesity and mortality among patients diagnosed with COVID-19: Results from an integrated health care organization. Ann Intern Med. 2020; 173:773-781. [DOI] [PMC free article] [PubMed] [Google Scholar]