Abstract
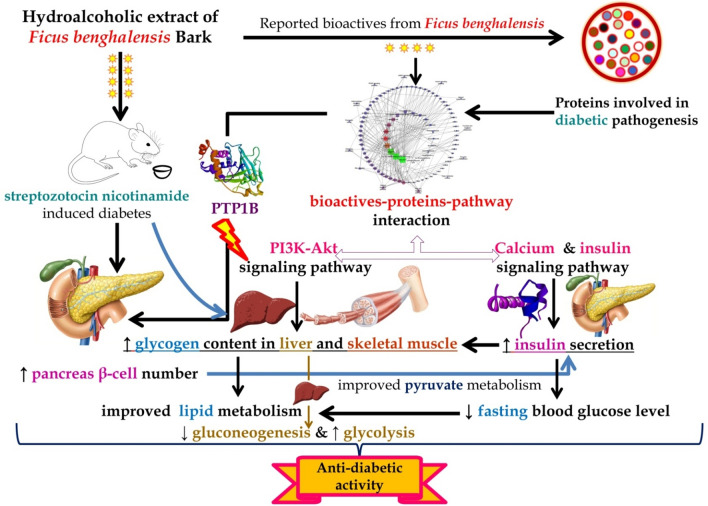
A total of 21 different bioactives were identified from F. benghalensis in which 3 molecules, i.e., apigenin, 3′,4′,5,7-tetrahydroxy-3-methoxyflavone, and kaempferol were predicted to target the highest number of proteins involved in diabetic pathogenesis in which protein tyrosine phosphatase 1b was primarily targeted. Similarly, a docking study identified ursolic acid to have the highest binding affinity with protein tyrosine phosphatase 1b. The combined synergic network analysis identified PI3K/Akt signaling pathway to be primarily modulated followed by the calcium signaling pathway. Similarly, in oral glucose tolerance test, we observed the efficacy of hydroalcoholic extract of F. benghalensis to lower the total area under the curve of glucose and increase total area under curve of insulin for 2 hours. Likewise, hydroalcoholic extract reversed the altered homeostatic hepatic enzymes after 28 days of treatments. Similarly, the extract also enhanced the antioxidant enzymes level like catalase and superoxide dismutase in liver homogenate. In summary, hydroalcoholic extract of F. benghalensis bark may act as an antidiabetic agent by enhancing the glycolysis, decreasing gluconeogenesis, promoting glucose uptake, enhancing insulin secretion, and maintaining pancreatic β-cell mass via PI3K/Akt signaling pathway and downregulating the function of protein tyrosine phosphatase 1b.
Supplementary Information
The online version contains supplementary material available at 10.1007/s13205-021-02788-7.
Keywords: Diabetes mellitus, Ficus benghalensis, Network Pharmacology, PI3K/Akt, PTP1B
Introduction
Diabetes mellitus (DM) is a complex polygenic metabolic disorder characterized by elevated fasting blood glucose level due to impaired insulin function, resistance, deficiency, or a combination of all (Ali 2013); contributed by multiple factors like age, obesity, pregnancy, and genetic factors (Wu et al. 2014). Although the malfunctioning of multiple signalling pathways (PPAR, P13K, and Wnt) and dysregulated proteins are concerned with diabetic pathogenesis and its progression (Herman and Zimmet 2012; Karter et al. 2013; Maruthur 2013), most of the prescriptions for Type 2 DM in the current pharmacotherapy utilizes various synthetic oral hypoglycaemic agents (are single target) like insulin sensitizers, peroxisome proliferator-activated receptor (PPAR) agonists, thiazolidinediones, sulfonylureas, and α-glucosidase inhibitors; associated with multiple side effects including dizziness, syncope, vomiting, fatigue, and orthostatic hypotension (Chaudhury et al. 2017; Kerru et al. 2018). Hence, it is important to identify a new antidiabetic agent that could target multiple proteins involved in progressing diabetic pathogenesis with minimum side effects; this can be achieved via the utilization of traditional folk medicines. Further, World Health Organization also suggests identifying new antidiabetic agents from the traditional medicine system (WHO 1965). In addition, diabetes is a polygenic condition (Ali 2013); thus, the treatment approach should include multiple compound–proteins interactions; regulating multiple pathways and generating the synergistic effect (Pujol et al. 2010).
Natural products are effective in managing DM (Ríos et al. 2015; Wang et al. 2013) and are being utilized in Ayurveda and Traditional Chinese Medicine. The treatment strategy of natural products is credited for the complex therapeutic network which includes the combination of multicompounds and multitargets interaction to produce synergistic or additive effects. Further, with the utility of multicomponents with multitargets, demonstration has been made for more effectiveness with fewer side effects compared to single-target drugs (Espinoza-Fonseca 2006). Rapid development in network biology/pharmacology has helped to identify efficacy and safety of molecules in the drug development process (Khan and Khan 2016). Further, it discloses the deep-seated multifarious affiliation among multiple bioactives, their targets, and associated pathways. As a complex composition of folk medicine, the desired therapeutic action could be due to multifaceted synergistic or additive communications (Gupta et al. 2017); may act concomitantly, ephemerally (short time), or feebly (low affinity) with multiple targets (Bai et al. 2013; Ohlson 2008). A combination of various bioactives with different affinities with multiple targets may add in efficacy and decreased toxicity (Hopkins 2008); may help in treating the complex diseases systematically.
The bark of Ficus benghalensis L. (family: Moraceae), commonly known as Banyan is used to treat “Madhumey” (Ayurvedic term for diabetes) as a traditional folk medicine (Prashanth 2017) and composes multiple bioactives, such as triterpenes, flavonoids, phytosterols, and polyphenols (Khaliq 2017). It is also recorded as “Nyagrodha” in the Ayurvedic pharmacopeia of India to treat Prameha, i.e., metabolic disorder (Government of India, Ministry of Health and Family Welfare, Department of AYUSH, The Ayurvedic Pharmacopoeia of India). Further, the bark of F. benghalensis is reported to lower the elevated blood glucose level in experimental animals (Gayathri and Kannabiran et al. 2008). However, the combined interaction of bioactives from F. benghalensis with proteins involved in DM has not been reported yet.
Hence, the present study aimed to identify the probable interactions of regulated proteins involved in diabetic pathogenesis by the bioactives of F. benghalensis and reveal the deal of antidiabetic activity via the network pharmacology approach followed by experimental evaluation of hydroalcoholic extract of F. benghalensis bark in streptozocin–nicotinamide-induced diabetes in rats.
Materials and methods
Network pharmacology
Bioactives and their targets in diabetes
The reported bioactives of F. benghalensis were retrieved from the ChEBI (https://www.ebi.ac.uk/chebi/) . Canonical simplified molecular-input line-entry system (SMILES) of each phytoconstituent was retrieved from PubChem (https://pubchem.ncbi.nlm.nih.gov/) database to screen drug-likeness character via Mol Soft (http://molsoft.com/mprop/) based on Lipinski’s Rule of Five (Lipinski 2004). The targets of all compounds were identified by querying the SMILES of each biomolecule in BindingDB (Liu et al. 2007). The data were compiled for the target of each compound with a search score ≥ 0.7; based on the similarity of 70%. The gene code of each target was identified from the UniProt (https://www.uniprot.org/). The proteins involved in the diabetes mellitus were identified using open-source databases and published literature.
Pathway analysis and network construction
The probable interactions of proteins were predicted using STRING (Szklarczyk et al. 2017) and the modulated pathways were identified concerning the Kyoto Encyclopedia of Genes and Genomes pathway database. Cytoscape 3.5.1 (Shannon et al. 2003) was used to construct the network between phytoconstituents, proteins, and related pathways. The network was set as directed and the map node size and map node color were set as “low values to small size” and “low values to bright colors” respectively based on the edge count for both settings.
The binding affinity of compounds with targets
Molecular docking was performed to predict the binding affinity of bioactives with respective targets using autodock 4.0 (Morris et al. 2009). A node of the target was identified with the highest “edge score”; reflects the interaction of the protein with multiple phytoconstituents within the constructed network in which the phytoconstituents were docked with the corresponding edge linked target. After docking, the pose scoring the lowest binding energy was chosen to visualize the ligand–protein interaction.
Experimental pharmacology
Plant collection, authentication, and extract preparation
Barks of F. benghalensis were collected from local areas of Belagavi, India (16°08′37.1 "N 74°38′51.4 "E) in January; authenticated by a botanist at Indian Council of Medical Research- National Institute of Traditional Medicine Belagavi, India, and herbarium was deposited for the same (accession number RMRC-1405) for future reference. Barks were washed thoroughly under running water, shade dried, and turned into a coarse powder. The coarse powder (250 g) was then subjected for maceration with 70% v/v ethanol for 7 days with occasional shaking; filtered, marc was dried, and subjected for soxhlet extraction. Later, both extracts were combined and concentrated using a rotator evaporator (IKA RV 10) under reduced pressure which yielded 10.92%w/w.
Animals and ethical clearance
Healthy albino Wistar rats weighing 223.67 ± 10.61 g of either sex were used in the present study. Rats were purchased from the committee for the purpose of control and supervision of experiments on animals registered vendor and housed in pathogen-free conditions. The experiment was performed after receiving the approval from Institutional Animal Ethics committee (IAEC) at KLE College of Pharmacy, Belagavi, Karnataka, India (resolution no. KLECOP/CPCSEA-Reg, No. 221/Po/Re/S/2000/CPCSEA, Res. 28–12/10/2019). Animals were acclimatized under a 12 light/dark cycle for 7 days before the study.
Grouping and induction of diabetes
Nicotinamide at the dose of 230 mg/kg was injected 15 min before the administration of streptozocin at the dose of 65 mg/kg by freshly dissolving in water for injection and chilled citrate buffer (pH 4.5), respectively. After 7 days of injection, fasting blood glucose was measured. The animals showing elevated fasting blood glucose levels (250 mg/dl) were used for further study. Animals were randomized using computer-generated random numbers for diabetic control and test except normal containing 6 animals in each namely (a) normal; administered with saline, (b) diabetic (STZ); administered with saline, (c) GLI50 (STZ + glibenclamide); administered with 50 mg/kg, glibenclamide, (d) low test dose (STZ + FB100); administered with 100 mg/kg extract, (e) medium dose (STZ + FB200); administered with 200 mg/kg, extract, and (f) high dose (STZ + FB400); administered with 400 mg/kg, extract p.o. Each group contained 3 cages with 2 animals in each.
Measurement of body weight, food intake, and water intake
The body weight, food intake, and water intake of individual animals were recorded on the 1st, 7th, 14th, 21st, and 28th day of treatment. The measured food and water intake represented the water and food intake of 2 animals in each cage.
Measurement of fasting blood glucose/insulin level and oral glucose tolerance test (OGTT)
The fasting blood glucose level was measured using a glucometer (Janaushadi, India). Whole-body insulin sensitivity was assessed using an oral glucose tolerance test (Kumar et al. 2012) at multiple points, i.e., 0, 30, 60, 90, and 120 min. Similarly, blood was collected to assess the insulin level using a commercially available kit (Ray Biotech, USA).
Collection of blood and visceral organs
At the end of the experiment, blood was collected from a cardiac puncture to separate plasma. The liver and pancreas were collected immediately, washed thoroughly to avoid any blood clots, and stored appropriately in 10% v/v formalin (Nair et al. 2018).
Plasma biochemical estimations
Fasting blood glucose level and insulin levels in the OGTT were measured using a glucometer and commercially available kit respectively. Serum urea, uric acid, creatinine, and lipid profile, i.e., total cholesterol, triglyceride, and high-density lipid (HDL) were measured using commercially available kits (ERBA diagnostics). The low-density lipoprotein (LDL) and very low-density lipoprotein (VLDL) levels were measured using the following formula
Glucose uptake in rat hemidiaphragm
Percentage glucose uptake in rat hemidiaphragm after 28 days treatments was performed as explained by Kumar et al. 2012 with minor modifications. Briefly, 10 × 10 mm2 of rat hemidiaphragm was incubated to 30 mM of glucose solution in the presence of 0.25 units of insulin. After 30 min, samples were collected and the percentage glucose uptake by rat hemidiaphragm was quantified using the following formula:
where Ac is the absorbance of the glucose solution before incubating rat hemidiaphragm, At is the absorbance of the test, i.e., after incubating rat hemidiaphragm.
Glycogen and hepatic enzyme estimation
Glycogen content in skeletal muscle and liver was quantified as explained by Seifter and Dayton 1950. Further, multiple enzymes like glucose-6-phosphatase, fructose-1,6-biphosphatase (Pari and Srinivasan 2010), hexokinase (Brandstrup et al. 1957), lactate dehydrogenase (King 1959), phosphofructokinase (PFK, KinesisDx, USA), serum glutamic-oxaloacetic transaminase (SGOT, Erba Lab, India), and serum glutamic pyruvic transaminase (SGPT, Erba Lab, India) were measured in liver homogenate.
Evaluation of antioxidant biomarkers
The level of various antioxidant biomarkers, such as superoxide dismutase (SOD); incubating liver homogenate with pyrogallol solution (2.5 mg/mL, 0.1 mL) and tris–HCl buffer (0.05 mol/L, 2.9 mL) to record absorbance at 420 nm at 90 and 120 s (Nandi and Chatterjee 1987), catalase; by mixing H2O2 (0.019 mol/L, 1.0 mL) with liver homogenate (10% w/v, 0.05 mL) and recording the absorbance at 240 nm (Claiborne 1985), glutathione; incubating the mixture of Ellman’s reagent and EDTA (20 mmol/L, pH 4.7) with liver homogenate for 30 min and recording the absorbance at 412 nm and total thiols; incubating the liver homogenate with dithionitrobenzene (10 mmol/L, 40 mL) in the presence of methanol of 10 min to record absorbance at 412 nm (Sedlak and Lindsay 1968), and malondialdehyde to quantify the thiobarbituric acid-reactive substance via the incubation of liver homogenate with thiobarbituric acid (0.375%), trichloroacetic acid (15%), and HCl (5 g/L) at 95 ºC for 15 min, cooled, and centrifuged to record the absorbance at 512 nm (Hiroshi et al. 1979) were measured in liver homogenates.
Hepatic and pancreas histology
A trained pathologist was blinded for the study to fix liver samples with 10% formalin, sectioned the tissue (4 µM), and stained it with hematoxylin and eosin (H & E).
Statistical analysis
The phytoconstituents–proteins–pathways interaction was evaluated by edge count based on color and size map. All the data in experimental pharmacology were represented using mean ± SEM and analyzed using a one-way or two-way analysis of variance, followed by posthoc Tukey’s test or Bonferroni test where applicable, using GraphPad Prism (GraphPad Software Corporation, San Diego California, USA). The difference among the means was considered to be significant if p < 0.05.
Results
Network pharmacology
Bioactives and their targets
A total of 21 bioactives were identified from F. benghalensis which were under multiple phytochemistry, i.e., triterpenoids, isoflavone, flavonoid, phytosterols, ceramide, furocoumarins, and the organic molecular entity which are summarized in Table S1 with their molecular formula, molecular weight, and druglikeness score. Information was compiled for the compounds with a search score ≥ 0.7 to identify proteins involved in diabetes. The pharmacological action of each compound against each target molecule reflects the large numbers of the compounds are involved in the inhibitory activity rather than activation of the receptors; however, the probable pharmacological activity of few compounds against some targets was unclear. The list of targeted protein molecules and their gene codes are summarized in Table S2.
Pathway analysis
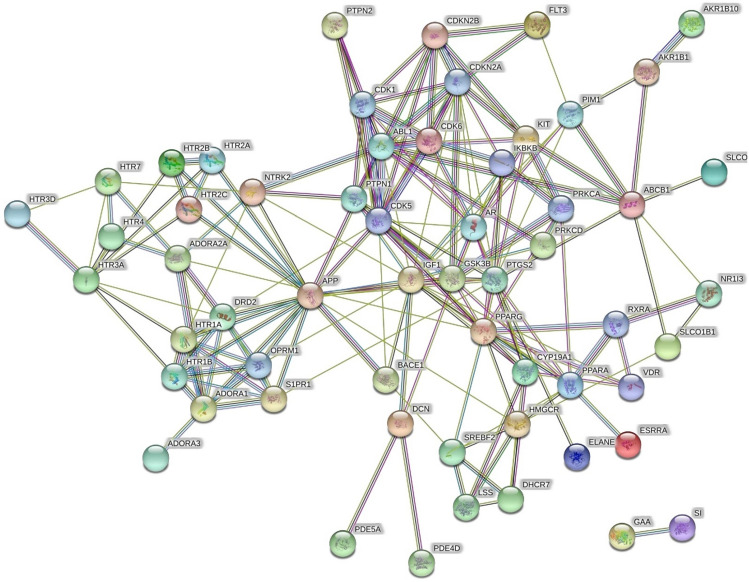
A total of 51 different pathways were identified to be modulated by the phytoconstituents of F. benghalensis; among them, 13 were involved in DM. Among the 13 different pathways, the PI3K-Akt signalling pathway scored the highest number of the gene set (Table S3). The protein–protein interaction of the targets involved in diabetes is shown in Fig. 1.
Fig. 1.
STRING analysis of proteins interaction involved in the diabetes mellitus. The protein(s) and their interaction(s) in the network are presented by node(s) and edge(s) respectively
Network analysis of phytoconstituent–protein–pathway interaction
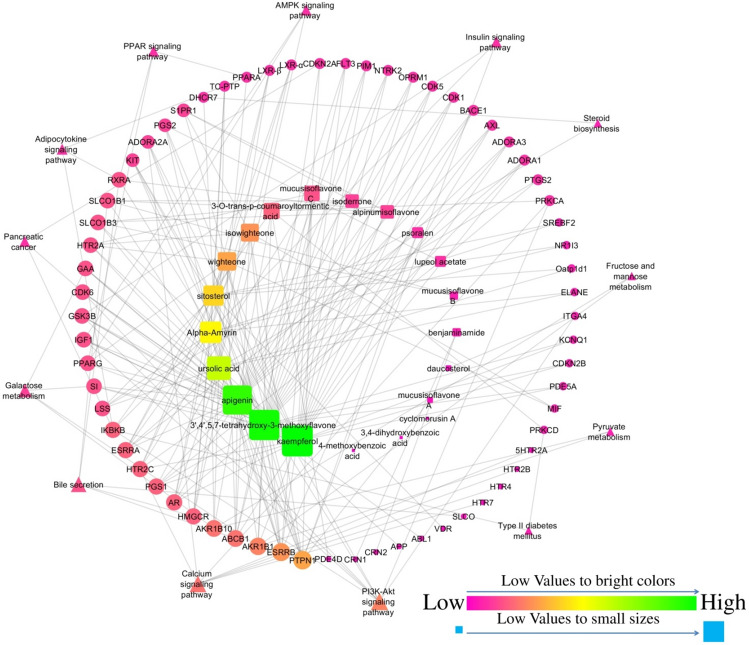
The network was constructed to represent the interaction among biomolecules, their targets, and modulated pathways which include 99 nodes; among them, 65 were targets, 21 were phytoconstituents, and 13 were modulated pathways. Furthermore, the network contained 228 edges; among them, 48 edges were pathway–targets interactions and 180 were compound–targets interactions. Similarly, 9 molecules (ursolic acid, mucusisoflavone A, mucusisoflavone C, isowighteone, wighteone, psoralen, 3′,4′,5,7-tetrahydroxy-3-methoxyflavone, α-amyrin, and sitosterol) targeted protein-tyrosine phosphatase 1B (PTP1B). Further, the PI3K/Akt signaling pathway was primarily modulated by regulating the maximum number of genes, i.e., KIT, CDK6, IKBKB, PRKCA, RXRA, GSK3B, IGF1, and ITGA4 (Fig. 2).
Fig. 2.
Interaction of bioactives from F. benghalensis with their targets and regulated pathways
Docking analysis
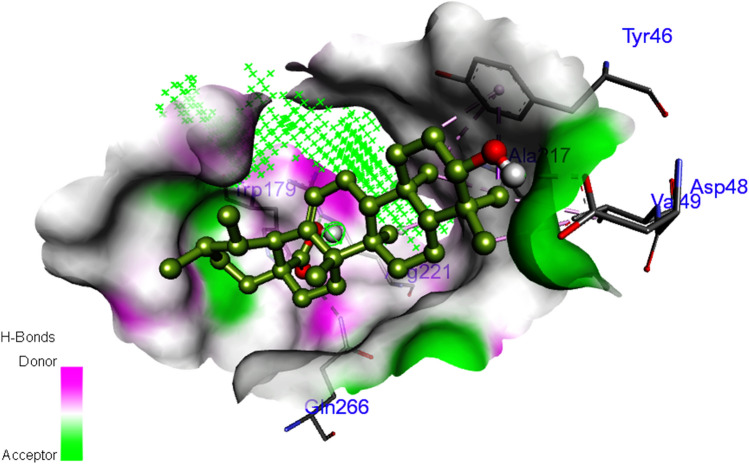
A total of 9 phytoconstituents were identified to inhibit the PTP1B based on the edge count of the network. Among them, ursolic acid was predicted to have the highest binding affinity (-8.93 kcal/mol) with PTP1B with 5 hydrogen bonds with Asp48, Gln266, Trp179, and Arg221 (Fig. 3). The binding affinity of each phytoconstituent with PTP1B along with the number of hydrogen bond interactions/residues is summarized in Table S4.
Fig. 3.
Interaction of ursolic acid with protein-tyrosine phosphatase 1B
Animal study
Effect on body weight, food intake, and water intake
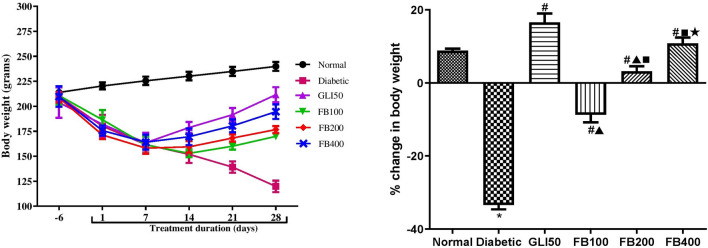
Induction of diabetes showed a significant decrease in the body weight (p < 0.001) as compared to normal. Administration of glibenclamide showed a significant increase (p < 0.001) in body weight as compared to the diabetic group. Likewise, treatment with multiple doses of extracts showed a dose-dependent significant increase in body weight as compared to the diabetic group (Fig. 4).
Fig. 4.
Effect of hydroalcoholic extract of Ficus benghalensis on body weight. All the data are presented in mean ± SEM (n = 6). Percentage change in body weight was analyzed using one-way ANOVA followed by Tukey's Test for Post Hoc Analysis. *p < 0.001 compared to normal, #p < 0.001 compared to diabetic, ▲p < 0.001 compared to GLI50, ■p < 0.001 compared to FB100, ★p < 0.05 compared to FB200
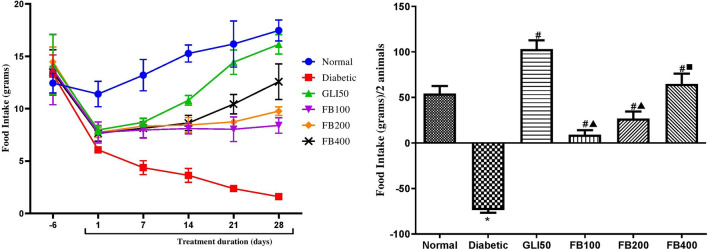
There was a significant increase (p < 0.01) in water intake and a significant decrease (p < 0.001) in food intake in diabetic groups as compared to normal. The treatment with glibenclamide showed a significant decrease (p < 0.01) in water intake and a significant increase (p < 0.001) in food intake compared to a diabetic. Similarly, treatment with extracts showed a significant decrease in water intake (p < 0.05–0.01) and a significant increase (p < 0.001) in food intake compared to a diabetic (Figs. 5 and 6).
Fig. 5.
Effect of hydroalcoholic extract of Ficus benghalensis extract on food intake. All the data are presented in mean ± SEM (n =3 ). Food intake/2 animals in each group were analyzed using one-way ANOVA followed by Tukey's Test for post hoc analysis. *p < 0.001 compared to normal, #p < 0.001 compared to diabetic, ▲p < 0.001 compared to GLI50, ■p < 0.01 compared to FB100
Fig. 6.
Effect of hydroalcoholic extract of Ficus benghalensis on water intake. All the data are presented in mean ± SEM (n = 3). Water intake/2 animals were analyzed using one-way ANOVA followed by Tukey's test for post hoc analysis. *p < 0.01 compared to normal, #p < 0.05, ##p < 0.001 compared to disease, ▲p < 0.05 compared to GLI50
Effect on fasting blood glucose level and OGTT glucose level
After 28 days of treatments, a significant increase (p < 0.001) in the fasting blood glucose level was observed in the diabetic group compared to normal. Treatment with glibenclamide showed a significant decrease (p < 0.001) in fasting blood glucose levels compared to the diabetic group. Similarly, treatment with multiple doses of the extract showed a significant decrease (p < 0.001) in fasting blood glucose levels compared to the diabetic in a dose-dependent manner. Further, in the OGTT the AUC in the diabetic group was found to significantly higher (p < 0.001) as compared to normal. Likewise, the administration of glibenclamide and multiple doses of extract reflected the potency to enhance the glucose clearance by decreasing the AUC and the effect was also dose-dependent (Fig. 7).
Fig. 7.
Effect of hydroalcoholic extract of Ficus benghalensis on fasting blood glucose level and OGTT. All the data are presented in mean ± SEM (n = 6). Fasting blood glucose level and total area under the curve of glucose was analyzed using one-way ANOVA followed by Tukey's Test for post hoc analysis. *p < 0.001 compared to normal, #p < 0.001 compared to diabetic, ▲p < 0.001 compared to GLI50, ■p < 0.01, ■■p < 0.001 compared to FB100, ★p < 0.001 compared to FB200
Effect on fasting insulin level and OGTT insulin level
Fasting insulin level was found to be significantly decreased (p < 0.001) compared to normal. Similarly, treatment with glibenclamide showed a significant increase (p < 0.001) in insulin levels compared to the diabetic group. Likewise, treatment with multiple doses of the extract showed a significant increase (p < 0.05 and 0.001) in insulin level compared to the diabetic group. Likewise, the AUC of insulin level over 2 h was significantly lower (p < 0.001) in the diabetic group compared to normal. Similarly, treatment with glibenclamide showed a significant increase (p < 0.001) in insulin levels compared to the diabetic group. Likewise, treatment with multiple doses of the extract showed a significant increase (p < 0.05 and 0.001) in AUC of insulin level compared to a diabetic group, and the effect was found to be dose-dependent (Fig. 8).
Fig. 8.
Effect of hydroalcoholic extract of Ficus benghalensis on fasting insulin level and during OGTT. All the data are presented in mean ± SEM (n = 6). Fasting insulin level and total area under the curve of insulin was analyzed using one-way ANOVA followed by Tukey's Test for post hoc analysis. *p < 0.001 compared to normal, #p < 0.05, ##p < 0.01, ###p < 0.001 compared to diabetic, ▲p < 0.05, ▲▲p < 0.001 compared to GLI50, ■p < 0.05, ■■p < 0.001 compared to FB100, ★p < 0.001 compared to FB200
Effect on glycated hemoglobin
The glycated hemoglobin level was found to be significantly high (p < 0.001) in the diabetic group compared to normal and was significantly reversed (p < 0.001) with glibenclamide and extract treatment. Further, the decrease in the glycated hemoglobin was found to be dose-dependent at 100 mg/kg, 200 mg/kg, and 400 mg/kg of extract treatment (Fig. 9).
Fig. 9.
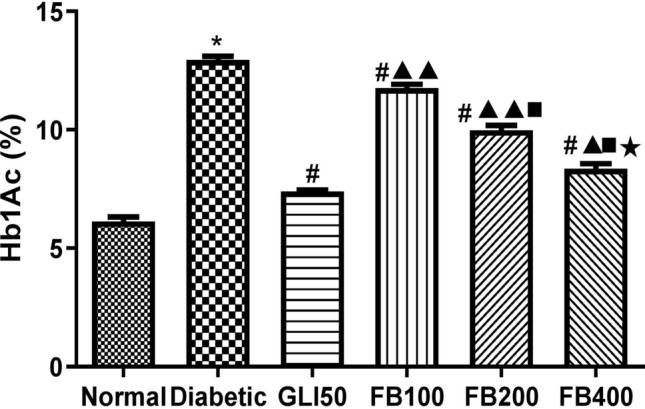
Effect of hydroalcoholic extract of Ficus benghalensis bark on glycylated haemoglobin. All the data are presented in mean ± SEM (n = 6). The difference among the means of Hb1Ac level between groups was analyzed using one-way ANOVA followed by Tukey's Test for post hoc analysis. *p < 0.001 compared to normal, #p < 0.001 compared to diabetic, ▲p < 0.01, ▲▲p < 0.001 compared to GLI50, ■p < 0.001 compared to FB100, ★P < 0.001 compared to FB200
Effect on hepatic enzymes
A significant increase (p < 0.001) in hepatic enzymes like glucose-6-phosphatases, fructose 1,6 biphosphatase, lactate dehydrogenase, phosphofructokinase, and SGOT: SGPT ratio was observed in the diabetic group compared to normal. Further, treatment with glibenclamide and multiple doses of the extract showed a significant decrease (p < 0.05–0.001) in all the hepatic enzymes and SGOT: SGPT ratio. In contrast, there was a significant decrease in the hexokinase enzyme level in the diabetic group compared to the normal. Further, treatment with glibenclamide and multiple doses of the extract showed a significant increase (p < 0.001) in hexokinase level compared to a diabetic in a dose-dependent manner (Table 1).
Table 1.
Effect of hydroalcoholic extract of F. benghalensis on hepatic enzymes
| Groups | Hexokinase (units/mg) | Glucose-6-phosphatase (units/mg) | Fructose-1,6-biphosphatase (Units/mg) | Lactate dehydrogenase (μMol/L/h/mg) | Phosphofructokinase (units/mg ) | SGOT: SGPT ratio |
|---|---|---|---|---|---|---|
| Normal | 2.92 ± 0.01 | 10.95 ± 0.20 | 3.99 ± 0.05 | 166.40 ± 3.41 | 4.10 ± 0.16 | 1.34 ± 0.05 |
| Diabetic | 1.61 ± 0.02* | 27.67 ± 0.79* | 11.28 ± 0.27* | 377.10 ± 8.23* | 11.24 ± 0.24* | 2.75 ± 0.10* |
| GLI50 | 2.59 ± 0.01## | 15.71 ± 0.56## | 5.49 ± 0.23## | 209.60 ± 5.15## | 4.99 ± 0.12## | 1.52 ± 0.05## |
| FB100 | 1.80 ± 0.02#▲▲ | 23.07 ± 0.36##▲▲ | 12.29 ± 0.37▲▲ | 328.70 ± 4.61##▲▲ | 9.98 ± 0.22##▲▲ | 1.58 ± 0.04## |
| FB200 | 1.99 ± 0.02#▲▲■ | 21.29 ± 0.24##▲▲ | 9.86 ± 0.25#▲▲■ | 293.10 ± 3.73##▲▲■ | 8.23 ± 0.13##▲▲■ | 1.59 ± 0.06## |
| FB400 | 2.14 ± 0.01#▲▲■★ | 18.52 ± 0.09##▲■★ | 6.21 ± 0.12##■★ | 223.50 ± 1.62##▲▲■★ | 5.78 ± 0.19##▲▲■★ | 1.49 ± 0.05## |
All the data are presented in Mean ± SEM (n = 6). The difference among the means of each group was analyzed using one-way ANOVA followed by Tukey's test for post hoc analysis. *p < 0.001 compared to normal, #p < 0.01, ##p < 0.001 compared to diabetic, ▲p < 0.01, ▲▲p < 0.001 compared to GLI50, ■p < 0.001 compared to FB100, ★p < 0.001 compared to FB200
Effect on urea, uric acid, and creatinine level
There was a significant increase (p < 0.001) in serum urea, uric acid, and creatinine level in the diabetic group compared to normal. Similarly, treatment with glibenclamide significantly decreased (p < 0.001) urea, uric acid, and serum creatinine as compared to the diabetic group. Likewise, treatment with extract showed a significant decrease in urea (p < 0.001), uric acid (p < 0.001), and creatinine levels (p < 0.05–0.001) compared to a diabetic (Table 2).
Table 2.
Effect of hydroalcoholic extract of F. benghalensis on urea, uric acid, and creatinine level
| Groups | Urea (mg/dl) | Uric acid (mg/dl) | Creatinine (mg/dl) |
|---|---|---|---|
| Normal | 30.95 ± 0.80 | 1.66 ± 0.12 | 2.71 ± 0.15 |
| Diabetic | 55.27 ± 0.97* | 2.89 ± 0.16* | 3.26 ± 0.04* |
| GLI50 | 37.30 ± 0.71# | 1.58 ± 0.03# | 2.53 ± 0.05### |
| FB100 | 50.53 ± 0.34#▲▲ | 1.99 ± 0.05#▲ | 2.88 ± 0.04#▲ |
| FB200 | 46.92 ± 0.37#▲▲■ | 1.88 ± 0.05# | 2.79 ± 0.02## |
| FB400 | 42.90 ± 0.44#▲▲■■★ | 1.80 ± 0.04# | 2.68 ± 0.06### |
All the data are presented in mean ± SEM (n = 6). The difference among the means of each group was analyzed using one-way ANOVA followed by Tukey's test for post hoc analysis. *p < 0.001 as compared to normal, #p < 0.05, ##p < 0.01, ###p < 0.001 as compared to diabetic, ▲p < 0.05, ▲▲p < 0.001 as compared to GLI50, ■p < 0.01, ■■p < 0.001 as compared to FB100, ★p < 0.001 as compared to FB200
Effect on lipid profile
There was a significant increase (p < 0.001) in triglycerides, total cholesterol, VLDL, and LDL, and a significant decrease (p < 0.001) in HDL level in the diabetic group compared to normal. The treatment with glibenclamide and extract showed a significant decrease (p < 0.001) in triglycerides, total cholesterol, VLDL, and LDL and a significant increase (p < 0.001) in HDL levels as compared to the diabetic group (Table 3).
Table 3.
Effect of hydroalcoholic extract of F. benghalensis on lipid profile
| Groups | Triglycerides (mg/dl) | Total cholesterol (mg/dl) | HDL (mg/dl) | VLDL (mg/dl) | LDL (mg/dl) |
|---|---|---|---|---|---|
| Normal | 45.92 ± 0.45 | 90.99 ± 0.94 | 59.49 ± 0.67 | 9.18 ± 0.09 | 22.32 ± 0.55 |
| Diabetic | 93.11 ± 3.53* | 144.40 ± 0.66* | 36.41 ± 0.63* | 18.62 ± 0.71* | 89.39 ± 1.59* |
| GLI50 | 51.07 ± 0.67# | 103.40 ± 0.96# | 57.93 ± 0.39# | 10.21 ± 0.13# | 35.29 ± 0.93# |
| FB100 | 74.26 ± 0.47#▲▲▲ | 131.00 ± 1.39#▲▲ | 44.52 ± 0.48#▲▲▲ | 14.85 ± 0.09#▲▲▲ | 71.61 ± 1.65#▲▲▲ |
| FB200 | 66.04 ± 0.55#▲▲▲■ | 122.90 ± 1.69#▲▲■ | 49.39 ± 0.45#▲▲▲■■ | 13.21 ± 0.11#▲▲▲■ | 60.26 ± 1.67#▲▲▲■ |
| FB400 | 61.12 ± 0.83#▲▲▲■■ | 108.60 ± 1.05#▲■★ | 53.12 ± 0.25#▲▲▲■■★ | 12.22 ± 0.17#▲▲▲■■ | 43.21 ± 0.89#▲▲■■★ |
All the data are presented in mean ± SEM (n = 6). The difference among the means of each group was analyzed using one-way ANOVA followed by Tukey's Test for Post Hoc Analysis. *p < 0.001 compared to normal, #p < 0.001 compared to diabetic, ▲p < 0.05, ▲▲p < 0.01, ▲▲▲p < 0.001 compared to GLI50, ■p < 0.01, ■■p < 0.001 compared to FB100; ★p < 0.001 compared to FB200
Effect on glycogen content
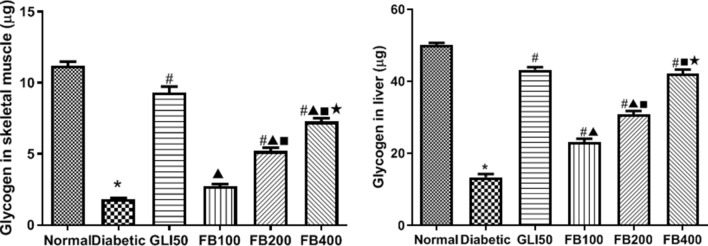
There was a significant decrease (p < 0.001) in hepatic and skeletal muscle glycogen content in the diabetic group compared to normal which was significantly reversed (p < 0.001) after glibenclamide and extract treatment. The glycogen content in liver and skeletal muscle was dose-dependent in extract treatment (Fig. 10).
Fig. 10.
Effect of hydroalcoholic extract on skeletal muscle and liver glycogen content. All the data are presented in mean ± SEM (n = 6). The difference among the means of glycogen content between groups was analyzed using one-way ANOVA followed by Tukey's Test for post hoc analysis. *p < 0.001 compared to normal, #p < 0.001 compared to diabetic, ▲p < 0.001 compared to GLI50, ■p < 0.001 compared to FB100, ★p < 0.001 compared to FB200
Effect on percentage glucose uptake
There was a significant decrease (p < 0.001) in the percentage glucose uptake by isolated rat hemidiaphragm compared to normal. Similarly, treatment with glibenclamide and multiple doses of the extract significantly increased (p < 0.001) the glucose uptake by isolated rat hemidiaphragm compared to the diabetic group (Fig. 11).
Fig. 11.
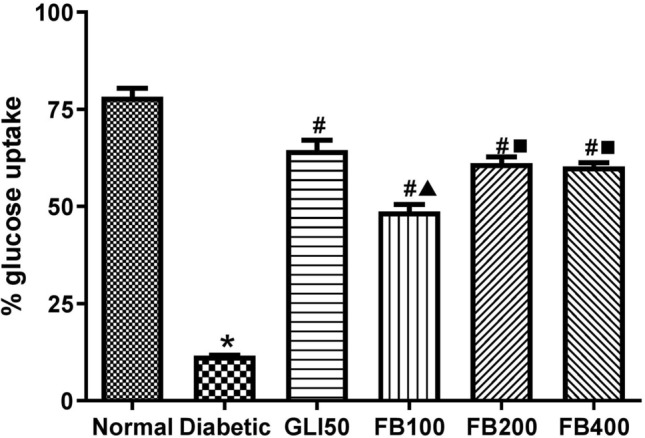
Effect of hydroalcoholic extract of Ficus benghalensis on percentage glucose glucose uptake in rat hemidiaphragm. All the data are presented in mean ± SEM (n = 6). The difference among the means % glucose uptake between groups was analyzed using one-way ANOVA followed by Tukey's Test for post hoc analysis. *p < 0.001 compared to normal, #p < 0.001 compared to diabetic, ▲p < 0.001 compared to GLI50, ■p < 0.001 compared to FB100
Effect on antioxidant biomarkers
In the diabetic group, there was a significant decrease (p < 0.001) in SOD, glutathione, and catalase levels compared to normal. Similarly, glibenclamide treatment showed a significant increase (p < 0.001) in SOD and glutathione levels compared to the diabetic. Significant increase in SOD (p < 0.05) and glutathione (p < 0.05 & 0.01) levels were observed in the extract group at 200 and 400 mg/kg dose. Likewise, treatment with multiple doses of the extract showed a significant increase (p < 0.05 & 0.01) in catalase activity compared to the diabetic. However, there was no significant difference in the means of total thiols and malondialdehyde levels (Table 4).
Table 4.
Effect of hydroalcoholic extract of F. benghalensis on antioxidant biomarkers
| Groups | SOD (units/ml) | Total thiols (µMoles/mg of protein) | GSH (µM/mg of protein) | Catalase (units/min/mg of protein) | MDA (nMol/ unit of protein) |
|---|---|---|---|---|---|
| Normal | 27.81 ± 0.80 | 260.20 ± 4.87 | 135.90 ± 4.20 | 77.34 ± 2.29 | 203.00 ± 6.92 |
| Diabetic | 16.52 ± 1.16* | 353.80 ± 64.72 | 33.76 ± 6.28* | 30.86 ± 5.78 * | 276.70 ± 49.39 |
| GLI50 | 25.72 ± 0.34### | 262.70 ± 46.98 | 111.40 ± 19.83### | 47.89 ± 8.52 | 194.70 ± 34.52 |
| FB100 | 19.10 ± 0.53▲▲ | 350.20 ± 2.42 | 58.19 ± 2.75 ▲ | 53.51 ± 2.23 # | 292.60 ± 2.15 |
| FB200 | 24.63 ± 0.91###■ | 331.10 ± 3.08 | 79.51 ± 2.40# | 58.84 ± 1.19 ## | 283.90 ± 4.62 |
| FB400 | 27.73 ± 0.37###■ | 274.70 ± 26.70 | 86.70 ± 7.86## | 59.71 ± 5.85 ## | 217.00 ± 20.56 |
All the data are presented in mean ± SEM (n = 6). The difference among the means of each group was analyzed using one-way ANOVA followed by Tukey's Test for Post Hoc Analysis. *p < 0.001 as compared to normal, #p < 0.05, ##p < 0.01, ###p < 0.001 as compared to diabetic, ▲p < 0.01, ▲▲p < 0.001 as compared to GLI50, ■p < 0.001 compared to FB100
Histopathology study
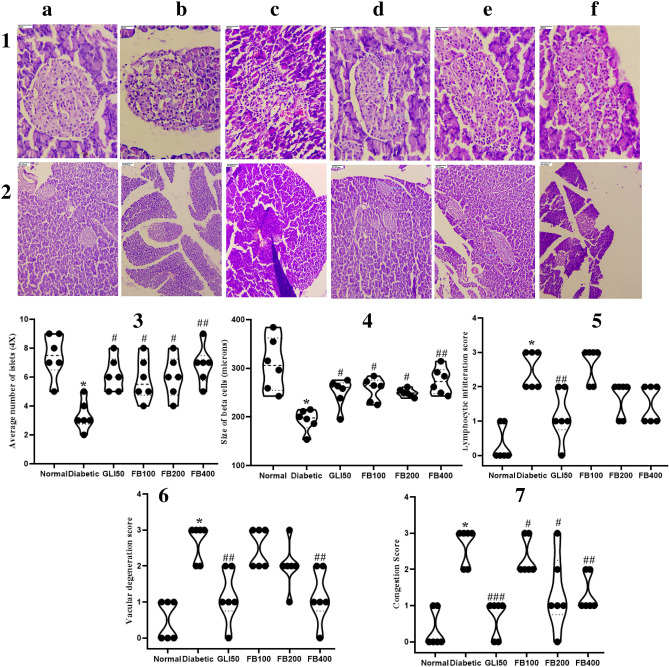
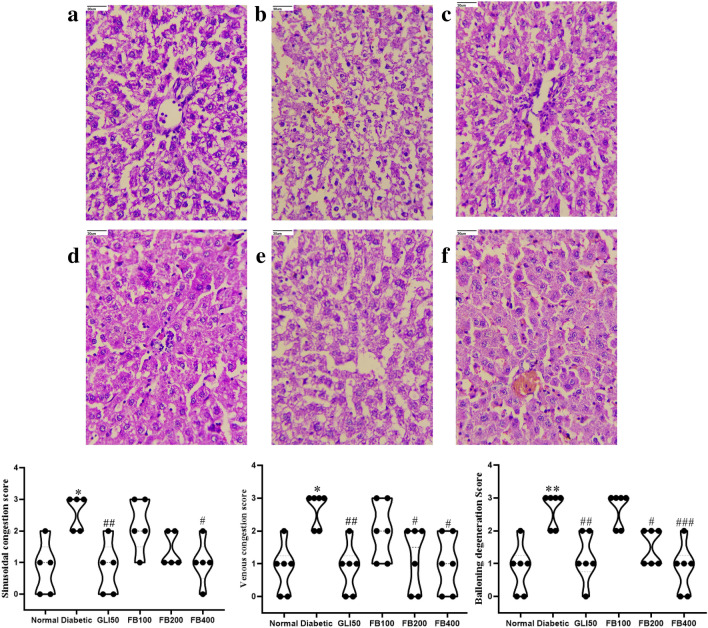
In the diabetic group, there was a significant decrease (p < 0.001) in the average number of islets and their size compared to the normal group. However, treatment with extract showed a significant increase (p < 0.05 & 0.01) in their count and size compared to the diabetic group. Further, there was a significant increase (p < 0.001) in lymphocytic infiltration, vascular degeneration, and congestion in pancreas in the diabetic group compared to normal. Further, treatment with extract improved congestion at all doses compared to the diabetic. Although there was no significant improvement in lymphocytic infiltration after extract treatment, a dose of 400 mg/kg improved vascular degeneration compared to the diabetic group (Fig. 12). Further, there was a significant increase (p < 0.001) in sinusoidal congestion, venous congestion, and ballooning degeneration in hepatocytes in diabetic group which has been ameliorated with extract treatment at the significant level of 0.05 and 0.01 (Fig. 13).
Fig. 12.
Histopathology analysis of pancreas magnification HE. a normal, b diabetic, c GLI50, d FB100, e FB200, and f FB400 at (1) 40 × and (2) 10 × , (3) average number of islets, (4) size of beta cells, (5) lymphocytic infiltration, (6) vascular degeneration and (7) congestion score. All the data are presented in mean ± SEM (n = 6). The difference among the means of each histological parameter between groups was analyzed using one-way ANOVA followed by Tukey's Test for post hoc analysis. *p < 0.001 compared to normal, #p < 0.05, ##p < 0.01, ###p < 0.001 compared to diabetic
Fig. 13.
Histopathology analysis of liver (magnification HE. 40X). a normal, b diabetic, c GLI50, d FB100, e FB200, and f FB400; represents sinusoidal congestion, venous congestion and ballooning degeneration. All the data are presented in mean ± SEM (n = 6). The difference among the means of each histological parameter between groups was analyzed using one-way ANOVA followed by Tukey's Test for post hoc analysis. *p < 0.01, **p < 0.001 compared to normal, #p < 0.05, ##p < 0.01, ###p < 0.001 compared to diabetic
Discussion
Network pharmacology is a theoretical approach that helps to understand the complex system of the living organism by exploring a large number of data sets for compound–protein interaction, protein–protein interaction, and associated biochemistry. It further wires to understand the interaction of gene set and generate a hypothesis for the experimental design (Morrow et al. 2010). Due to the rapid progression in bioinformatics’ tools, the current era of SysBiomics kindled the researchers to be aware of the correlation between the set of targets rather than single (Collins et al. 2007; Wang et al. 2012). To fulfil this approach, we identified the probable targets of an individual phytoconstituent from BindingDB based on the principle “similar compounds identify their similar targets” (Liu et al. 2007), and the network was constructed to understand the probable interaction of multiple phytoconstituents, their targets and probably modulated pathways in diabetes mellitus. Further, the study aimed to evaluate the outcome of network pharmacology in the streptozocin–nicotinamide-induced DM.
Mining of phytoconstituents from F. benghalensis bark identified the multiple class of compounds, i.e., triterpenoids, isoflavones, flavonoids, steroid saponins, phytosterols, ceramides, and furocoumarins which interacted with 33 proteins involved in DM. Further, multicomponent–protein–pathway network analysis identified the majority of the flavonoids were involved in the regulation of PTP1B by modulating the PI3K-Akt signaling pathway. However, it is to be understood that the generation of the network is due to the involvement of multiple phytoconstituents irrespective of a particular group of phytoconstituents like flavonoids. Hence, in the present study, the whole extract was the choice of the testing agent rather than a selective group of fractions for in vivo study.
During the 28 days of treatments, the effectiveness of hydroalcoholic extract was observed via the assessment of reversal weight loss and water intake followed by enhanced appetite in diabetic animals. Further, a significant decrease in blood glucose and increase insulin level in treated animals was also confirmed via AUC of glucose and insulin level during OGTT. Since the streptozocin–nicotinamide model is the reflection of the insulin-deficient model due to the partial damage of pancreatic β cell mass, the increased insulin production to respond to exogenous glucose could be due to the regeneration of pancreatic β-cells in extract-treated animals which were not observed in the diabetic group.
Network interaction identified the prime regulation of PTP1B which has been well credited for pancreatic β-cell proliferation, regulating changes in islet morphometry, and modulating the pathways in maintaining pancreatic β-cell mass. Likewise, surgical removable of PTP1B alleviates the streptozocin-induced damage in pancreatic β-cell mass (Fernandez-Ruiz et al. 2014). Further, PTP1B is well credited for the negative regulation of insulin signaling in DM by removing phosphate from the tyrosine residues of insulin receptor at tyrosine kinase P-subunits leading to the disturbed equilibrium state of tyrosine kinase and phosphatase; mimics insulin activity (Kennedy 1999). Likewise, one of our previous studies identified lead hits from F. benghalensis as α-glucosidase inhibitor which may involve in regulating the p53 signaling pathway (Khanal and Patil 2019). In the present study, after 28 days of treatments with extract, the level of insulin secretion was found to be significantly higher which was also confirmed via the AUC in OGTT; reflects the possibility in maintaining the pancreatic β-cells which was also confirmed via the higher number of β-cells in the pancreatic tissue in histopathological observation. This outcome could be due to the probable inhibition of PTP1B by mucusisoflavone A, mucusisoflavone C, isowighteone, wighteone, psoralen, ursolic acid, 3′,4′,5,7-tetrahydroxy-3-methoxyflavone, α-amyrin, and sitosterol; primarily ursolic acid as it has been reported to enhance the insulin receptor phosphorylation and stimulate glucose uptake (Zhang et al. 2006) as demonstrated in the glucose uptake assay in rat hemidiaphragm and increased glycogen content in liver and skeletal muscle.
Histopathological observation showed an increase in pancreatic β-cell count/shape and decreased lymphocytic infiltration, vascular degeneration, and congestion after 28 days of treatments with extract; reflects the maintenance of pancreatic β-cell mass; via probable inhibition of PTP1B and modulation of the p53 signaling pathway (Khanal and Patil 2019), and enhanced insulin secretion via PI3K-Akt signaling pathway and calcium signaling pathway. Further, liver cirrhosis can be assessed as SGOT: SGPT ratio > 2 (Cohen and Kaplan 1979) and sinusoidal and venous congestion followed by ballooning degeneration of hepatocytes (Kakar et al. 2004); has been identified in the diabetic group. However, due to the antioxidant potency of extract, these changes could have been ameliorated.
Similarly, our network pharmacology prediction identified PI3K-Akt and calcium signaling pathways to be primarily modulated. PI3K-Akt signaling pathway regulates insulin secretion, glucose transport, glycogen synthesis, and protein synthesis in skeletal muscle and decreased gluconeogenesis and enhanced glycolysis in the liver via PI3K-Akt signaling pathway (Huang et al. 2018). Hence, the increased insulin production at the fasting level as well as during OGTT increased glycogen content in liver and skeletal muscle could be via PI3K-Akt mediated pathway. The previous report reflected the disturbance in calcium homeostasis accelerates the death of pancreatic β-cells leading to type 1 diabetes mellitus (Jiang et al. 2018). Likewise, PI3K has been identified to stimulate the autocrine function of pancreatic β-cell via the inhibition of Ca2+ATPase; increases the intracellular Ca2+ concentration by activating calcium-mediated signaling pathways leading to insulin secretion (Jiang et al. 2018). Further, in our previous study, we predicted identified 3 flavonoids, i.e., apigenin, 3,4′,5,7-tetrahydroxy-3′-methoxyflavone, and kaempferol as a regulators of the p53 signaling pathway which is also well reported to maintain pancreatic β-cell mass (Khanal and Patil 2019); could be one of the reasons for increased glucose clearance via the elevated level of insulin during OGTT.
Serotonin receptors and PPAR act as homeostatic regulators of energy intake and expenditure which can be regulated in managing diabetes mellitus (Calkin et al. 2007; Oh et al. 2016). A total of 10 bioactives from the F. benghalensis were identified to interact with multiple subunits of serotonin receptors which would have a role in the amelioration of food and water intake in extract treated diabetic animals. Further, apigenin, kaempferol, wighteone, and ursolic acid were identified to interact with PPAR; hence, they could regulate the transcription of insulin-responsive genes and manage hepatic glucose production, transportation, and utilization. Thus, PPAR mediated action could have contributed to the elevated level of enzymes for glycolysis and decreased level of enzymes involved in gluconeogenesis. Further, estrogen receptors are also identified as new players in DM by modulating the genes involved in glucose uptake, insulin sensitivity and also participating in glucose homeostasis (Barros et al. 2006) which was modulated by mucusisoflavone C, 3′,4′,5,7-tetrahydroxy-3-methoxyflavone, kaempferol, psoralen, ursolic acid, and α-amyrin. Likewise, treatment with extract also ameliorated lipid profile which could be due to the regulation of adipocytokine signaling pathway by regulating three proteins, i.e., RXRα; activates endogenous retinoids, PPARα; regulates genes involved in fatty acid transport and oxidation, and IKBKB; modulates lipid metabolism and associated disorders (He et al. 2013; Konstandi et al. 2013; Schmid and Birbach 2008; Yu et al. 2015).
Although the bark of F. benghalensis is well recognized to manage DM, the probable mechanism of action for anti-diabetic activity was not reported yet. To overcome this study gap of ethnomedicine use of F. benghalensis bark, we utilized the system biology tools followed by an experimental evaluation to propose the probable molecular mechanism (Fig. 14) for the antidiabetic effect and support the Ayurvedic literature.
Fig. 14.
Proposed mechanism of action of hydroalcoholic extract of Ficus benghalensis L. bark
Conclusion
The current study utilized a network pharmacology approach to study the probable molecular mechanism of Indian folk medicine, F. benghalensis bark in the management of diabetes. The study identified probable regulation of PTP1B (target) and PI3K-Akt (modulated pathway) within the complex set of diabetic proteins and their interaction with bioactives from F. benghalensis which has a direct role in insulin secretion. The study also identified flavonoids as a major group of bioactives from F. benghalensis in diabetes management. One of the limitations of the present study is the expression of PTP1B in the liver, skeletal muscle and adipose tissues with F. benghalensis bark extract treatment was not studied which needs to be further confirmed.
Supplementary Information
Below is the link to the electronic supplementary material.
Acknowledgements
Pukar Khanal is thankful to Dr. Yadu Nandan Dey for his suggestions during the preparation of the manuscript. The authors are also thankful to Principal KLE College of Pharmacy, Belagavi, and Head of Department, Department of Pharmacology for their support and providing necessary facilities.
Authors’ contribution
PK performed the review of literature, performed the work, and drafted the manuscript. BMP designed the work, supervised, and reviewed the final manuscript.
Funding
This work has not received any funding from any government and private agencies.
Additional information
This work shares the common data for three groups (normal, diabetic, and GLI50) with the previously published article; Khanal P, Patil BM. Integration of network and experimental pharmacology to decipher the antidiabetic action of Duranta repens L. J Integr Med. 2021;19(1):66–77. https://doi.org/10.1016/j.joim.2020.10.003.
Declarations
Conflict of interest
The authors declare that they have no competing interests.
Contributor Information
Pukar Khanal, Email: pukarkhanal58@gmail.com.
B. M. Patil, Email: drbmpatil@klepharm.edu, Email: bmpatil59@hotmail.com
References
- Ali O. Genetics of type 2 diabetes. World J Diabetes. 2013;4(4):114–123. doi: 10.4239/wjd.v4.i4.114. [DOI] [PMC free article] [PubMed] [Google Scholar]
- Bai F, Xu Y, Chen J, Liu Q, Gu J, Wang X, Ma J, Li H, Onuchic JN, Jiang H. Free energy landscape for the binding process of Huperzine A to acetylcholinesterase. Proc Natl Acad Sci. 2013;110(11):4273–4278. doi: 10.1073/pnas.1301814110. [DOI] [PMC free article] [PubMed] [Google Scholar]
- Barros RPA, Machado UF, Gustafsson JÅ. Estrogen receptors: new players in diabetes mellitus. Trends Mol Med. 2016;12(9):425–431. doi: 10.1016/j.molmed.2006.07.004. [DOI] [PubMed] [Google Scholar]
- Brandstrup N, Kirk JE, Bruni C. The hexokinase and phosphoglucoisomerase activities of aortic and pulmonary artery tissue in individuals of various ages. J Gerontol. 1957;12(2):166–171. doi: 10.1093/geronj/12.2.166. [DOI] [PubMed] [Google Scholar]
- Calkin AC, Jandeleit-Dahm KA, Sebekova E, Allen TJ, Mizrahi J, Cooper ME, Tikellis C. PPARs and diabetes-associated atherosclerosis. Curr Pharm Des. 2007;13(26):2736–2741. doi: 10.2174/138161207781662902. [DOI] [PubMed] [Google Scholar]
- Chaudhury A, Duvoor C, Dendi VSR, Kraleti S, Chada A, Ravilla R, Marco A, Shekhawat NS, Montales MT, Kuriakose K, Sasapu A, Beebe A, Patil N, Musham CK, Lohani GP, Mirza W. Clinical review of antidiabetic drugs: implications for type 2 diabetes mellitus management. Front Endocrinol (Lausanne) 2017;2017(8):6. doi: 10.3389/fendo.2017.00006. [DOI] [PMC free article] [PubMed] [Google Scholar]
- Claiborne A. Catalase activity. In: Greenwald RA, editor. CRC Hand Book of Methods for Oxygen Radical Research. Boca Raton, Florida, USA: CRC Press; 1985. pp. 283–284. [Google Scholar]
- Cohen JA, Kaplan MM. The SGOT/SGPT ratio–an indicator of alcoholic liver disease. Dig Dis Sci. 1979;24(11):835–838. doi: 10.1007/BF01324898. [DOI] [PubMed] [Google Scholar]
- Collins SR, Miller KM, Maas NL, Roguev A, Fillingham J, Chu CS, Schuldiner M, Gebbia M, Recht J, Shales M, Ding H, Xu H, Han J, Ingvarsdottir K, Cheng B, Andrews B, Boone C, Berger SL, Hieter P, Zhang Z, Brown GW, Ingles CJ, Emili A, Allis CD, Toczyski DP, Weissman JS, Greenblatt JF, Krogan NJ. Functional dissection of protein complexes involved in yeast chromosome biology using a genetic interaction map. Nature. 2007;446(7137):806–810. doi: 10.1038/nature05649. [DOI] [PubMed] [Google Scholar]
- Espinoza-Fonseca LM. The benefits of the multi-target approach in drug design and discovery. Bioorganic Med Chem. 2006;14(4):896–897. doi: 10.1016/j.bmc.2005.09.011. [DOI] [PubMed] [Google Scholar]
- Fernandez-Ruiz R, Vieira E, Garcia-Roves PM, Gomis R. Protein tyrosine phosphatase-1B modulates pancreatic β-cell mass. PLoS ONE. 2014;9(2):e90344. doi: 10.1371/journal.pone.0090344. [DOI] [PMC free article] [PubMed] [Google Scholar]
- Gayathri M, Kannabiran K. Antidiabetic and ameliorative potential of Ficus bengalensis bark extract in streptozotocin induced diabetic rats. Indian J Clin Biochem. 2008;23(4):394–400. doi: 10.1007/s12291-008-0087-2. [DOI] [PMC free article] [PubMed] [Google Scholar]
- Government of India, Ministry of Health and Family Welfare, Department of AYUSH. The Ayurvedic Pharmacopoeia of India. Part- 1, Volume – 1, Page No. 119
- Gupta RC, Chang D, Nammi S, Bensoussan A, Bilinski K, Roufogalis BD. Interactions between antidiabetic drugs and herbs: an overview of mechanisms of action and clinical implications. Diabetol Metab Syndr. 2017;9(1):1–12. doi: 10.1186/s13098-017-0254-9. [DOI] [PMC free article] [PubMed] [Google Scholar]
- He Y, Gong L, Fang Y, Zhan Q, Liu HX, Lu Y, Guo GL, Lehman-McKeeman L, Fang J, Wan YJY. The role of retinoic acid in hepatic lipid homeostasis defined by genomic binding and transcriptome profiling. BMC Genomics. 2013;14(1):575. doi: 10.1186/1471-2164-14-575. [DOI] [PMC free article] [PubMed] [Google Scholar]
- Herman WH, Zimmet P. Type 2 diabetes: an epidemic requiring global attention and urgent action. Diabetes Care. 2012;35(5):943–944. doi: 10.2337/dc12-0298. [DOI] [PMC free article] [PubMed] [Google Scholar]
- Hiroshi O, Nobuko O, Kunio Y. Assay for lipid peroxides in animal tissues by thiobarbituric acid reaction. Anal Biochm. 1979;95:351–358. doi: 10.1016/0003-2697(79)90738-3. [DOI] [PubMed] [Google Scholar]
- Hopkins AL. Network pharmacology: the next paradigm in drug discovery. Nat Chem Biol. 2008;4(11):682–690. doi: 10.1038/nchembio.118. [DOI] [PubMed] [Google Scholar]
- Huang X, Liu G, Guo J, Su ZQ. The PI3K/AKT pathway in obesity and type 2 diabetes. Int J Biol Sci. 2018;14(11):1483–1496. doi: 10.7150/ijbs.27173. [DOI] [PMC free article] [PubMed] [Google Scholar]
- Jiang WJ, Peng YC, Yang KM. Cellular signaling pathways regulating β-cell proliferation as a promising therapeutic target in the treatment of diabetes. Exp Ther Med. 2018;16(4):3275–3285. doi: 10.3892/etm.2018.6603. [DOI] [PMC free article] [PubMed] [Google Scholar]
- Kakar S, Kamath PS, Burgart LJ. Sinusoidal dilatation and congestion in liver biopsy: is it always due to venous outflow impairment? Arch Pathol Lab Med. 2004;128(8):901–904. doi: 10.5858/2004-128-901-SDACIL. [DOI] [PubMed] [Google Scholar]
- Karter AJ, Schillinger D, Adams AS, Moffet HH, Liu J, Adler NE, Kanaya AM. Elevated rates of diabetes in pacific islanders and Asian subgroups. Diabetes Care. 2013;36(3):574–579. doi: 10.2337/dc12-0722. [DOI] [PMC free article] [PubMed] [Google Scholar]
- Kennedy BP. Role of protein tyrosine phosphatase-1B in diabetes and obesity. Biomed & Pharmacother. 1999;53:466–470. doi: 10.1016/s0753-3322(00)88105-6. [DOI] [PubMed] [Google Scholar]
- Kerru N, Singh-Pillay A, Awolade P, Singh P. Current anti-diabetic agents and their molecular targets: a review. Eur J Med Chem. 2018;152:436–488. doi: 10.1016/j.ejmech.2018.04.061. [DOI] [PubMed] [Google Scholar]
- Khaliq HA. A review of pharmacognostic, physicochemical, phytochemical and pharmacological studies on Ficus bengalensis L. J Sci Innovative Res. 2017;6(4):151–163. [Google Scholar]
- Khan SN, Khan AU. Breaking the spell: combating multidrug resistant “superbugs”. Front Microbiol. 2016;7:1–11. doi: 10.3389/fmicb.2016.00174. [DOI] [PMC free article] [PubMed] [Google Scholar]
- Khanal P, Patil BM. Gene set enrichment analysis of alpha-glucosidase inhibitors from Ficus benghalensis. Asian Pac J Trop Biomed. 2019;9(6):263–270. [Google Scholar]
- King J. A routine method for the estimation of lactic dehydrogenase activity. J Med Lab Technol. 1959;16:265–272. [PubMed] [Google Scholar]
- Konstandi M, Shah YM, Matsubara T, Gonzalez FJ. Role of PPARα and HNF4α in stress-mediated alterations in lipid homeostasis. PLoS ONE. 2013;8(8):e70675. doi: 10.1371/journal.pone.0070675. [DOI] [PMC free article] [PubMed] [Google Scholar]
- Kumar R, Patel DK, Prasad SK, Sairam K, Hemalatha S. Antidiabetic activity of alcoholic root extract of Caesalpinia digyna in streptozotocin-nicotinamide induced diabetic rats. Asian Pac J Trop Biomed. 2012;2(2):S934–S940. [Google Scholar]
- Lipinski CA. Lead- and drug-like compounds: the rule-of-five revolution. Drug Discov Today Technol. 2004;1(4):337–341. doi: 10.1016/j.ddtec.2004.11.007. [DOI] [PubMed] [Google Scholar]
- Liu T, Lin Y, Wen X, Jorissen RN, Gilson MK. BindingDB: a web-accessible database of experimentally determined protein–ligand binding affinities. Nucleic Acids Res. 2007;35(SUPPL. 1):198–201. doi: 10.1093/nar/gkl999. [DOI] [PMC free article] [PubMed] [Google Scholar]
- Maruthur NM. The growing prevalence of type 2 diabetes: increased incidence or improved survival? Curr Diab Rep. 2013;13(6):786–794. doi: 10.1007/s11892-013-0426-4. [DOI] [PubMed] [Google Scholar]
- Morris GM, Huey R, Lindstrom W, Sanner MF, Belew RK, Goodsell DS, Olson AJ. AutoDock 4 and AutoDockTools 4: automated docking with selective receptor flexibility. J Comput Chem. 2009;30(16):2785–2791. doi: 10.1002/jcc.21256. [DOI] [PMC free article] [PubMed] [Google Scholar]
- Morrow JK, Tian L, Zhang S. Molecular networks in drug discovery. Crit Rev Biomed Eng. 2010;38(2):143–156. doi: 10.1615/critrevbiomedeng.v38.i2.30. [DOI] [PMC free article] [PubMed] [Google Scholar]
- Nair J, Velpandian T, Das US, Sharma P, Nag T, Mathur SR, Mathur R. Molecular and metabolic markers of fructose induced hepatic insulin resistance in developing and adult rats are distinct and Aegle marmelos is an effective modulator. Sci Rep. 2018;8(1):15950. doi: 10.1038/s41598-018-33503-x. [DOI] [PMC free article] [PubMed] [Google Scholar]
- Nandi A, Chatterjee IB. Scavenging of superoxide radical by ascorbic acid. J Biosci. 1987;11(1–4):435–441. [Google Scholar]
- Oh CM, Park S, Kim H. Serotonin as a new therapeutic target for diabetes mellitus and obesity. Diabetes Metab J. 2016;40(2):89–98. doi: 10.4093/dmj.2016.40.2.89. [DOI] [PMC free article] [PubMed] [Google Scholar]
- Ohlson S. Designing transient binding drugs: a new concept for drug discovery. Drug Discov Today. 2008;13(9–10):433–439. doi: 10.1016/j.drudis.2008.02.001. [DOI] [PubMed] [Google Scholar]
- Pari L, Srinivasan S. Antihyperglycemic effect of diosmin on hepatic key enzymes of carbohydrate metabolism in streptozotocin–nicotinamide-induced diabetic rats. Biomed Pharmacother. 2010;64(7):477–481. doi: 10.1016/j.biopha.2010.02.001. [DOI] [PubMed] [Google Scholar]
- Prashanth BK (2017). Banyan tree: Ficus benghalensis: uses, research, renedies, side effects. easyayurveda. https://easyayurveda.com/2017/05/22/banyan-tree-ficus-benghalensis/
- Pujol A, Mosca R, Farrés J, Aloy P. Unveiling the role of network and systems biology in drug discovery. Trends Pharmacol Sci. 2010;31(3):115–123. doi: 10.1016/j.tips.2009.11.006. [DOI] [PubMed] [Google Scholar]
- Ríos JL, Francini F, Schinella GR. Natural products for the treatment of type 2 diabetes mellitus. Planta Med. 2015;81(12–13):975–994. doi: 10.1055/s-0035-1546131. [DOI] [PubMed] [Google Scholar]
- Schmid JA, Birbach A. IkappaB kinase beta (IKKbeta/IKK2/IKBKB)–a key molecule in signaling to the transcription factor NF-kappaB. Cytokine Growth Factor Rev. 2008;19(2):157–165. doi: 10.1016/j.cytogfr.2008.01.006. [DOI] [PubMed] [Google Scholar]
- Sedlak J, Lindsay RH. Estimation of total, protein-bound, and non-protein sulfhydryl groups in tissue with Ellman's reagent. Anal Biochem. 1968;25:192–205. doi: 10.1016/0003-2697(68)90092-4. [DOI] [PubMed] [Google Scholar]
- Seifter S, Dayton S. The estimation of glycogen with the anthrone reagent”. Arch Biochem. 1950;25(1):191–200. [PubMed] [Google Scholar]
- Shannon P, Markiel A, Ozier O, Baliga NS, Wang JT, Ramage D, Amin N, Schwikowski B, Ideker T. Cytoscape: a software environment for integrated models of biomolecular interaction networks. Genome Res. 2003;13(11):2498–2504. doi: 10.1101/gr.1239303. [DOI] [PMC free article] [PubMed] [Google Scholar]
- Szklarczyk D, Morris JH, Cook H, Kuhn M, Wyder S, Simonovic M, Santos A, Doncheva NT, Roth A, Bork P, Jensen LJ, von Mering C. The STRING database in 2017: quality-controlled protein–protein association networks, made broadly accessible. Nucleic Acids Res. 2017;45(D1):D362–D368. doi: 10.1093/nar/gkw937. [DOI] [PMC free article] [PubMed] [Google Scholar]
- Wang X, Yang B, Zhang A, Sun H, Yan G. Potential drug targets on insomnia and intervention effects of Jujuboside A through metabolic pathway analysis as revealed by UPLC/ESI-SYNAPT-HDMS coupled with pattern recognition approach. J Proteomics. 2012;75(4):1411–1427. doi: 10.1016/j.jprot.2011.11.011. [DOI] [PubMed] [Google Scholar]
- Wang Z, Wang J, Chan P. Treating type 2 diabetic mellitus with traditional—Google Scholar. Evid Based Comp. 2013;2013:343594. doi: 10.1155/2013/343594. [DOI] [PMC free article] [PubMed] [Google Scholar]
- WHO Diabetes mellitus. report of a WHO expert committee. World Health Organ Tech Rep Ser. 1965;310:1–44. [PubMed] [Google Scholar]
- Wu Y, Ding Y, Tanaka Y, Zhang W. Risk factors contributing to type 2 diabetes and recent advances in the treatment and prevention. Int J Med Sci. 2014;11(11):1185–1200. doi: 10.7150/ijms.10001. [DOI] [PMC free article] [PubMed] [Google Scholar]
- Yu XH, Zheng XL, Tang CK. Nuclear factor-κB activation as a pathological mechanism of lipid metabolism and atherosclerosis. Adv Clin Chem. 2015;70:1–30. doi: 10.1016/bs.acc.2015.03.004. [DOI] [PubMed] [Google Scholar]
- Zhang W, Hong D, Zhou Y, Zhang Y, Shen Q, Li JY, Hu LH, Li J. Ursolic acid and its derivative inhibit protein tyrosine phosphatase 1B, enhancing insulin receptor phosphorylation and stimulating glucose uptake. Biochim Biophys Acta Gen Subj. 2006;1760(10):1505–1512. doi: 10.1016/j.bbagen.2006.05.009. [DOI] [PubMed] [Google Scholar]
Associated Data
This section collects any data citations, data availability statements, or supplementary materials included in this article.
Supplementary Materials
Data Availability Statement
This work shares the common data for three groups (normal, diabetic, and GLI50) with the previously published article; Khanal P, Patil BM. Integration of network and experimental pharmacology to decipher the antidiabetic action of Duranta repens L. J Integr Med. 2021;19(1):66–77. https://doi.org/10.1016/j.joim.2020.10.003.


