

Abstract
Purpose:
Epidermal growth factor receptor (EGFR) amplification promotes gliomagenesis and is linked to lack of oxygen within the tumor microenvironment. Using hypoxia-sensitive spin-and-gradient echo echo-planar imaging and perfusion MRI, we investigated the influence of EGFR amplification on tissue oxygen availability and utilization in human gliomas.
Methods:
This study included 72 histologically confirmed EGFR amplified and non-amplified glioma patients. Reversible transverse relaxation rate (R2’), relative cerebral blood volume (rCBV), and relative oxygen extraction fraction (rOEF) were calculated for the contrast enhancing and non-enhancing tumor regions. Using Student t-test or Wilcoxon rank-sum test, median R2’, rCBV, and rOEF were compared between EGFR amplified and non-amplified gliomas. ROC analysis was performed to assess the ability of imaging characteristics to discriminate EGFR amplification status. Overall survival (OS) was determined using univariate and multivariate cox models. Kaplan-Meier survival curves were plotted and compared using the log-rank test.
Results:
EGFR amplified gliomas exhibited significantly higher median R2’ and rOEF than non-amplified gliomas. ROC analysis suggested that R2’ (AUC = 0.7190; P = 0.0048) and rOEF (AUC = 0.6959; P = 0.0156) could separate EGFR status. Patients with EGFR amplified gliomas had a significantly shorter OS than non-amplified patients. Univariate cox regression analysis determined both R2’ and rOEF significantly influence OS. No significant difference was observed in rCBV between patient cohorts nor was rCBV found to be an effective differentiator of EGFR status.
Conclusion:
Imaging of tumor oxygen characteristics revealed EGFR amplified gliomas to be more hypoxic and contribute to shorter patient survival than EGFR non-amplified gliomas.
Keywords: epidermal growth factor receptor, glioma, hypoxia, relative oxygen extraction fraction, reversible transverse relaxation rate, spin-and-gradient echo echo-planar imaging
INTRODUCTION
In 2016, the World Health Organization (WHO) adjusted glioma classification criteria to integrate molecular findings with histological features [1]. Gliomas are primarily stratified by isocitrate dehydrogenase (IDH) mutational and 1p19q codeletion statuses [1]. The impacts of O6-methylguanine DNA-methyltransferase (MGMT) promoter methylation, IDH, and 1p19q genotypes on glioma invasiveness, metabolism, patient overall survival, and treatment response have been comprehensively studied [2–6]. Within IDH wild-type gliomas, epidermal growth factor receptor (EGFR) mutation and amplification are thought to represent a more aggressive phenotype [7–10] that is often less responsive to traditional chemoradiation therapy [11]. Therefore, an imaging biomarker with sensitivity to EGFR amplified IDH wild-type gliomas might be useful for patient stratification or enrichment in targeted clinical trials, as well as better understanding the basic biology of EGFR amplified gliomas.
Amplification of EGFR and subsequent increase in ligand binding or receptor activation in glioblastoma (GBM) is known to prompt cellular proliferation and tumor invasion independent of angiogenesis [12]. When exposed to nutrient deficient or hypoxic microenvironments, tumor cells often induce translational up-regulation of EGFR and subsequent amplification of the receptor, providing cells with a survival advantage [13]. Therefore, we hypothesize that EGFR amplified gliomas may be slightly more hypoxic than EGFR non-amplified gliomas, which may be detectable non-invasively using blood oxygen level dependent (BOLD) methods [14]. Deoxygenated blood becomes paramagnetic, exposing iron in the hemoglobin molecules and altering the magnetic susceptibility of the surrounding tissue; in this way, BOLD employs deoxyhemoglobin as an endogenous contrast agent [15]. A multiple-echo spin-and-gradient echo echo-planar imaging (SAGE-EPI) sequence can be used to measure transverse relaxation rates (R2 and R2*) [16–18]. From R2 and R2*, the reversible transverse relaxation rate (R2’) can be calculated as a measure of susceptibility-induced intra-voxel dephasing and provides an estimate of vascular oxygen saturation [18,19]. Previous studies demonstrated the correlation between R2’, an indirect measure of relative changes in deoxyhemoglobin concentration, and the hypoxic state of human brain tissue [20–22]. R2’ is proportional to the venous blood volume and dependent on hemoglobin concentration and the oxygenation level or oxygen extraction fraction within the blood [14]. A recent study has also shown a strong, positive correlation between R2’ measurements and both hypoxia inducible factor (HIF)-1a and Ki-67, measures of tumor hypoxia and proliferation, respectively [23]. By accounting for cerebral blood volume (CBV) using dynamic susceptibility contrast (DSC) MRI, we can estimate the relative oxygen extraction fraction (rOEF) from R2’ measurements, allowing investigation of in vivo metabolic characteristics associated with glioma genotypes [14]. In previous studies, rOEF has been employed to elucidate oxygen utilization in healthy volunteers and patients affected by stroke or multiple sclerosis [24–26]. Using this approach, the current study tested whether EGFR amplified IDH wild-type gliomas exhibit higher measures of rOEF compared with EGFR non-amplified IDH wild-type gliomas.
METHODS
Patient Selection
A total of 72 histologically confirmed glioma patients were included in this retrospective study. Within the cohort, 36 patients were diagnosed with WHO Grade IV gliomas (glioblastoma), while 19 patients presented WHO Grade III gliomas (i.e., anaplastic astrocytoma, anaplastic oligodendroglioma, and oligoastrocytoma) and 17 patients had WHO Grade II gliomas (i.e., astrocytoma, oligodendroglioma, and mixed glioma). At the time of the scan, 33 patients were on active treatment including chemotherapy and/or radiation, and the remaining 39 patients were not on active therapy for at least two years prior to the scan. Overall survival (OS) ranged from 7 to 1426 days with a median OS of 361 days. A more comprehensive summary of patient demographics and molecular information can be found in Table 1. Isocitrate dehydrogenase (IDH1) 1 mutational status and EGFR amplification status were obtained from the patients’ clinical charts. IDH1 status was determined using genomic sequencing analysis, specifically through polymerase chain reaction (PCR) and/or immunohistochemistry of resected tumor tissue [27]. Patient EGFR amplification status was determined using fluorescent in situ hybridization or the Foundation Medicine genomic profiling service [28]. When available, MGMT promoter methylation status, determined using PCR, was obtained from the patients’ clinical charts [29]. All patients provided written informed consent to participate in this study, receive advanced imaging, and have medical information included in our IRB-approved research database. All patients received SAGE-EPI, DSC perfusion, and anatomic MRI between April 2015 and July 2019.
Table 1.
Patient demographics and molecular information
| All Patients | WHO II | WHO III | WHO IV | |
|---|---|---|---|---|
|
No. of Patients (Enhancing/ non-enhancing tumor) |
72 (45/27) | 17 (3/14) | 19 (7/12) | 36 (35/1) |
|
Treatment (off treatment/ on treatment) |
(39/33) | (11/6) | (17/2) | (11/25) |
|
Age median [range] |
51 [21–83] | 41 [21–62] | 49 [21–68] | 57 [32–83] |
|
Sex male/female |
45/27 | 9/8 | 12/7 | 24/12 |
|
IDH wild type/mutant |
42/30 | 1/16 | 8/11 | 33/3 |
|
EGFR non-amplified/amplified |
53/19 | 16/1 | 17/2 | 20/16 |
|
MGMT unmethylated/methylated (unknown) |
34/30 (8) | 6/9 (2) | 10/6 (3) | 18/15 (3) |
Magnetic Resonance Imaging Acquisition and Analysis
All patients received standard anatomic imaging, multi-echo SAGE-EPI, and DSC perfusion MRI. All scans were acquired on 3T MRI scanners (Prisma, or Skyra, Siemens Healthcare; Erlangen, Germany).
Anatomic MRI
In accordance with the standardized brain tumor imaging protocol (BTIP) [30], anatomic scans consisted of at least T2-weighted turbo spin-echo images, fluid-attenuated inversion recovery (FLAIR) images (3 mm slice thickness and no interslice gap), and T1-weighted pre- and post-contrast imaging (2D axial turbo spin-echo with 3 mm slice thickness and no interslice gap or 3D magnetization-prepared rapid gradient-echo images of 1 mm isotropic voxel size). All anatomic images were registered to post-contrast T1-weighted images for subsequent analyses.
Multi-echo Spin-and-gradient-echo Echo-planar Imaging (SAGE-EPI)
In addition to standard anatomic scans, patients received brain imaging with a SAGE-EPI sequence consisting of two gradient echoes with echo times (TEs) = 14.0 and 34.1 ms, one asymmetric spin-echo with TE = 58.0ms, and one spin-echo with TE = 92.4 ms. Additional acquisition parameters include a repetition time (TR) >10,000 ms, field-of-view (FOV) = 217 × 240 mm, matrix size = 116 × 128, slice thickness = 4.0 mm with no inter-slice gap, partial Fourier encoding = 6/8, GRAPPA = 3, and bandwidth = 1628 Hz/pixel. Figure 1 illustrates details on the specific pulse sequence.
Figure 1.
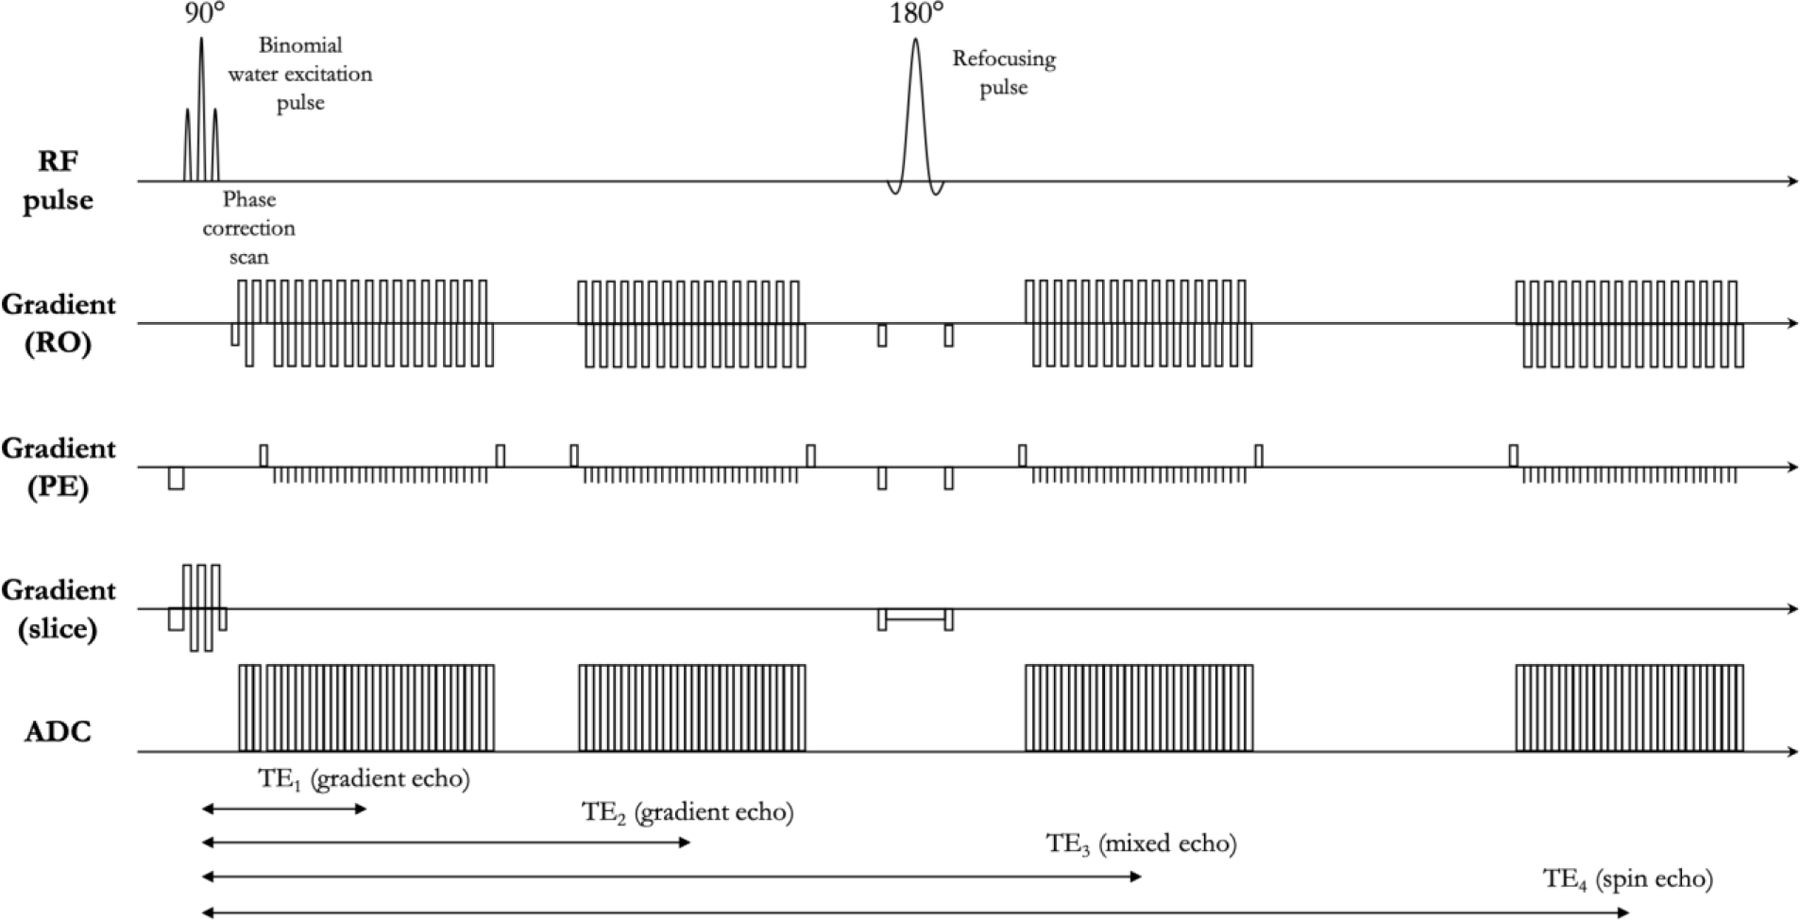
Pulse sequence diagram of spin-and-gradient echo (SAGE) sequence. The sequence is composed of a slice-selective water-excitation radio-frequency (RF) pulse, a refocusing pulse, and four single shot echo-planar imaging (EPI) readouts. The first two echos are gradient echos with echo times of TE1 and TE2. The third echo is a mixed gradient and spin echo (TE3). The last one is a pure spin echo (TE4). TE4 is twice as long as the time from the excitation pulse to the refocusing pulse.
Dynamic Susceptibility Contrast (DCS) Perfusion MRI
For DSC perfusion MRI, patients were administered with a total dose of 0.1 mmol/kg of a gadolinium contrast agent, either gadopentetate dimeglumine (Gdg-DTPA; Magnevist, Bayer Schering Pharma, Leverkusen, Germany) or gadobenate dimeglumine (Gd-BOPTA; Multihance, Bracco Diagnostics, Princeton, NJ) [31]. First, patients were given a preload dose of 0.025 mmol/kg of Gd-DTPA or Gd-BTDO3A to mitigate contrast agent leakage effects. Following at least two minutes of incubation time, 10 to 25 baseline acquisitions were taken. Next, an additional 10–20 cc (0.075 mmol/kg) at a rate of 3–5 cc/second of Gd-DTPA or Gd-BTDO3A was delivered for dynamic bolus administration [17]. DSC acquisition parameters included: TE = 21.0–23.0 ms, TR = 1250–1290 ms, flip angle = 60°, matrix size = 128 × 128, slice thickness = 5.0 mm with no inter-slice gap, and number of timepoints = 120. The total scan time for DSC-MRI was between 2 and 3 minutes. All DSC-MRI acquisitions covered the volume of contrast-enhancing and non-enhancing tumor.
Post-Processing
Three mutually exclusive regions of interest (ROIs) were defined: (1) contrast enhancing tumor (CET) defined by T1-weighted subtraction map; (2) regions of central necrosis defined by hypointensity on post-contrast T1-weighted images within contrast enhancing tumor; and (3) T2 hyperintense regions on T2-weighted FLAIR images (referred to as non-enhancing tumor (NET)), excluding areas of necrosis and contrast enhancement. In the hemisphere contralateral to the lesion, a ROI of normal appearing white matter was segmented. All ROIs were segmented by two investigators (T.O. and J.Y.) using a semi-automated thresholding method previously documented [32–34] using the Analysis of Functional NeuroImages (AFNI) software (NIMH Scientific and Statistical Computing Core; Bethesda, MD, USA).
T2 Relaxometry, Relative Cerebral Blood Volume (rCBV), and the Relative Oxygen Extraction Fraction (rOEF)
SAGE-EPI acquisition was used to estimate the transverse relaxation rates R2 and R2*, by solving a set of Bloch equations as described by Schmiedeskamp et al. [35] as:
| [Eq. 1] |
Where
| [Eq. 2] |
Sn is the signal magnitude for the nth echo, and δ is the difference caused by imperfectly matched slice profiles between echo trains before and after the refocusing pulse. R2 and R2* were calculated for each voxel. The reversible transverse relaxation rate, R2’, was calculated as: R2’ = R2* − R2, to create the R2’ maps.
DSC data were first motion-corrected using FSL (mcflirt, FMRIB library). CBV maps were then calculated using a previously described bidirectional contrast agent leakage correction method [36]. We normalized the CBV maps by the average CBV within the normal appearing white matter ROI to calculate the relative CBV (rCBV). All maps were aligned to the corresponding post-contrast T1-weighted images for further analysis.
The reversible relaxation rate characterizes the signal loss due to local susceptibility-induced dephasing. A theoretical model has been developed to predict R2’ using deoxygenated blood volume (λ) and the deoxyhemoglobin-induced frequency shift (δ⍵) [37]: R2’ = λ ∙ δ⍵, where δ⍵ is proportional to the susceptibility difference between oxygenated and deoxygenated blood (Δχ), fractional hematocrit, static magnetic field B0, and oxygen extraction fraction (OEF). Here, we assume that B0, Δχ, and hematocrit remain constant, and that λ is a constant fraction of CBV. With these assumptions, we can reduce the R2’ dependency to only the CBV and OEF: R2’ = C ∙ CBV ∙ OEF. C is a constant. By using the R2’ map estimated from SAGE-EPI acquisition and the rCBV calculated from DSC imaging, we are able to obtain a relative measurement of cerebral blood oxygen extraction fraction (rOEF):
| [Eq. 3] |
Statistical Analyses
All calculations and analyses were performed in MATLAB (Release 2018a, MathWorks, Natick, MA) and/or GraphPad Prism software (Version 7.0c GraphPad Software, San Diego, California). P values less than 0.05 were considered statistically significant.
Median R2’, rCBV, and rOEF within (1) contrast-enhancing tumor (CET), (3) T2 hyperintense non-enhancing tumor or edema (NET), and (4) a combined ROI of CET and NET were compared between EGFR non-amplified and amplified gliomas, using Student t-test or Mann-Whitney U test if one or both samples were not normally distributed as assessed by Shapiro-Wilk parametric hypothesis test. For normally-distributed data, Student’s t-test or analysis of variance (ANOVA) was performed. For non-normally-distributed data, a Mann-Whitney or Wilcoxon rank-sum analysis was performed. Using Matlab, heatmaps were generated for R2’, rCBV, and rOEF. Receiver-operating characteristic (ROC) analysis was performed to assess the ability for R2’, rCBV, and rOEF to discriminate between EGFR non-amplified and amplified tumors. The area under the curve (AUC), cut-off value, sensitivity, specificity, and prediction accuracy (percentage of cases predicted correctly) were reported.
Univariate cox proportional hazards regression analysis was performed to investigate the association between overall survival and imaging metrics (i.e., R2’, rCBV, and rOEF) along with IDH status, EGFR status, treatment status, and age. Also, multivariable Cox regression was used to determine whether imaging characteristics significantly predict survival while controlling for clinical factors. Kaplan-Meier curves were used to illustrate differences in survival between EGFR amplified and EGFR non-amplified patients. Additional Kaplan-Meier survival curves were performed based on median R2’, median rCBV, median rOEF, age, tumor grade, and treatment status. Log-rank (Mantel-Cox) test was performed to compare survival curves. Statistical significance was defined as alpha = 0.05.
RESULTS
EGFR amplified gliomas appeared to demonstrate greater hypoxia and oxygen extraction compared with EGFR non-amplified gliomas. Figure 2 illustrates the anatomic MR images (post-contrast T1-weighted image and FLAIR image) and R2’, rCBV, and rOEF maps of a 51-year-old male patient with an IDH wild-type, EGFR non-amplified glioblastoma (Fig. 2A) and an 83-year-old male patient with an IDH wild-type, EGFR amplified glioblastoma (Fig. 2B), supporting this general observation.
Figure 2.
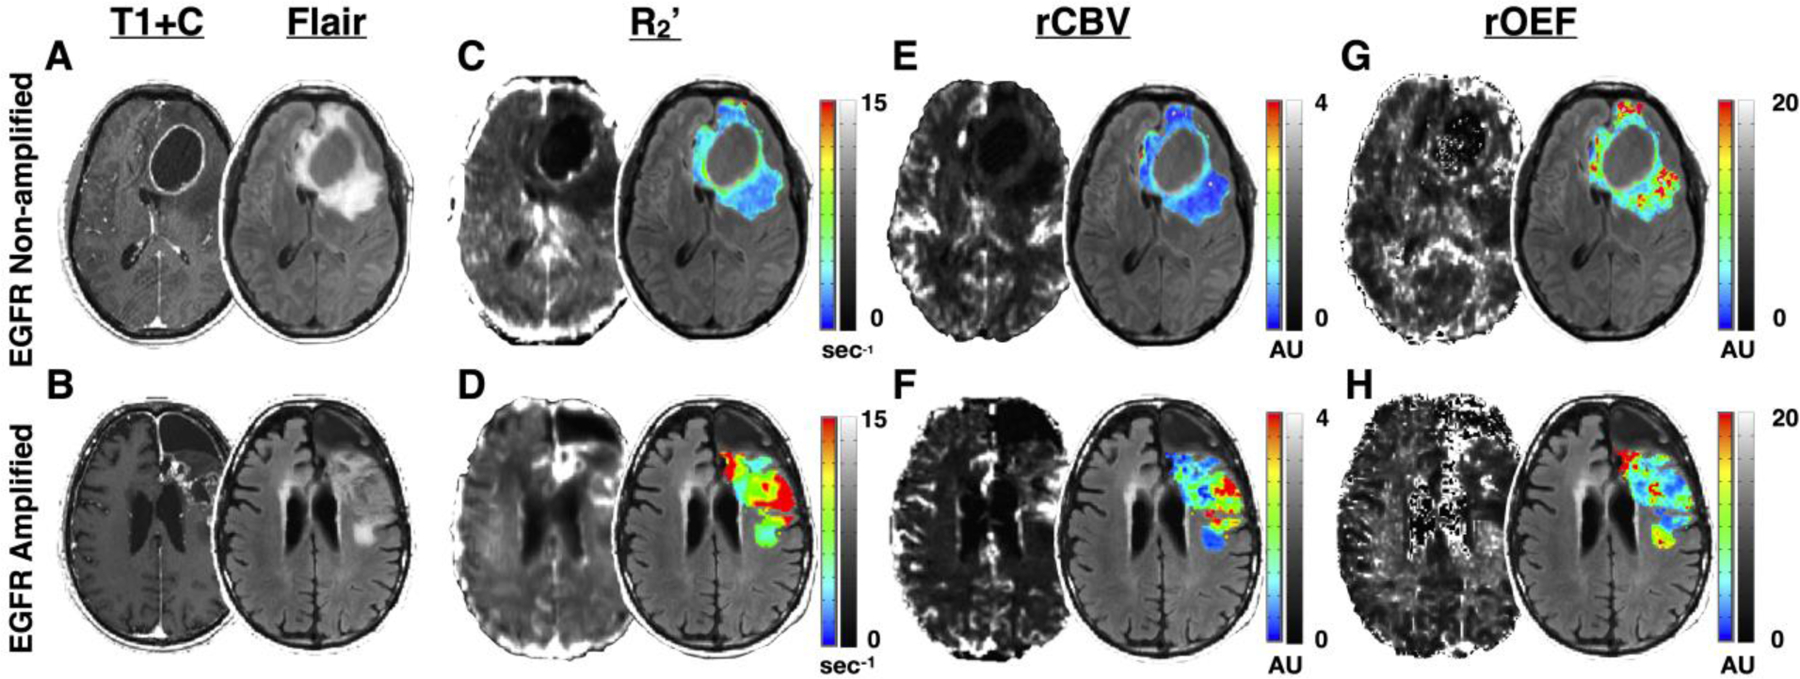
Oxygen-sensitive MR images in representative EGFR non-amplified and EGFR amplified gliomas. (A) The postcontrast T1-weighted image (left) and T2-weighted FLAIR image (right) of a 51-year-old male patient with an IDH wild-type, EGFR non-amplified glioblastoma. (B) The postcontrast T1-weighted image (left) and T2-weighted FLAIR image (right) of an 83-year-old male patient with an IDH wild-type, EGFR amplified glioblastoma. (C-H) The selected tumor regions include contrast enhancing tumor (CET) and non-enhancing tumor (NET) tissue and exclude necrotic regions. (C–D) R2’ map (left) and R2’ color map within the tumor regions overlaid on FLAIR (right). Scale bars illustrate R2’ values in which blue and black represent low R2’ or less hypoxic regions, while red and white illustrate high R2’ or more hypoxic regions. (E–F) rCBV map (left) and rCBV color map within the tumor regions overlaid on FLAIR (right). Scale bars illustrate rCBV values in which blue and black represent low rCBV and red and white represent voxels with high rCBV. rCBV is shown as an arbitrary unit. (G–H) rOEF map (left) and rOEF color map within tumor regions overlaid on FLAIR (right). Scale bars illustrate rOEF values in which blue and black represent low rOEF and red and white represent voxels with high rOEF. rOEF is shown as an arbitrary unit.
Consistent with in vitro and in vivo animal model studies showing higher hypoxia in EGFR amplified tumors [12,13], median R2’ in the combined CET and NET region was significantly higher in EGFR amplified than non-amplified gliomas (Fig. 3A and E; P = 0.0049; 5.760 ± 1.325 s−1 vs. 4.685 ± 1.214 s−1). No significant difference was observed in median rCBV between EGFR amplified and non-amplified gliomas (Fig. 3C and G; P=0.3241; 0.728 ± 0.360 vs. 0.780 ± 0.338). In the NET tissue, median R2’ was significantly higher in EGFR amplified gliomas (Fig. 3B and F; P=0.0253; 5.567 ± 1.340 s−1 vs. 4.653 ± 1.192 s−1), while no significant difference was observed in median rCBV (Fig. 3D and H; P=0.1319; 0.634 ± 0.295 vs. 0.723 ± 0.317). EGFR amplified tumors also exhibited significantly higher rOEF in both the combined CET and NET regions (Fig. 4A and C; P = 0.0159; 5.833 ± 2.337 vs. 4.220 ± 2.023) as well as NET alone (Fig. 4B and D; P=0.0058; 6.340 ± 2.189 vs. 4.453 ± 2.048).
Figure 3.
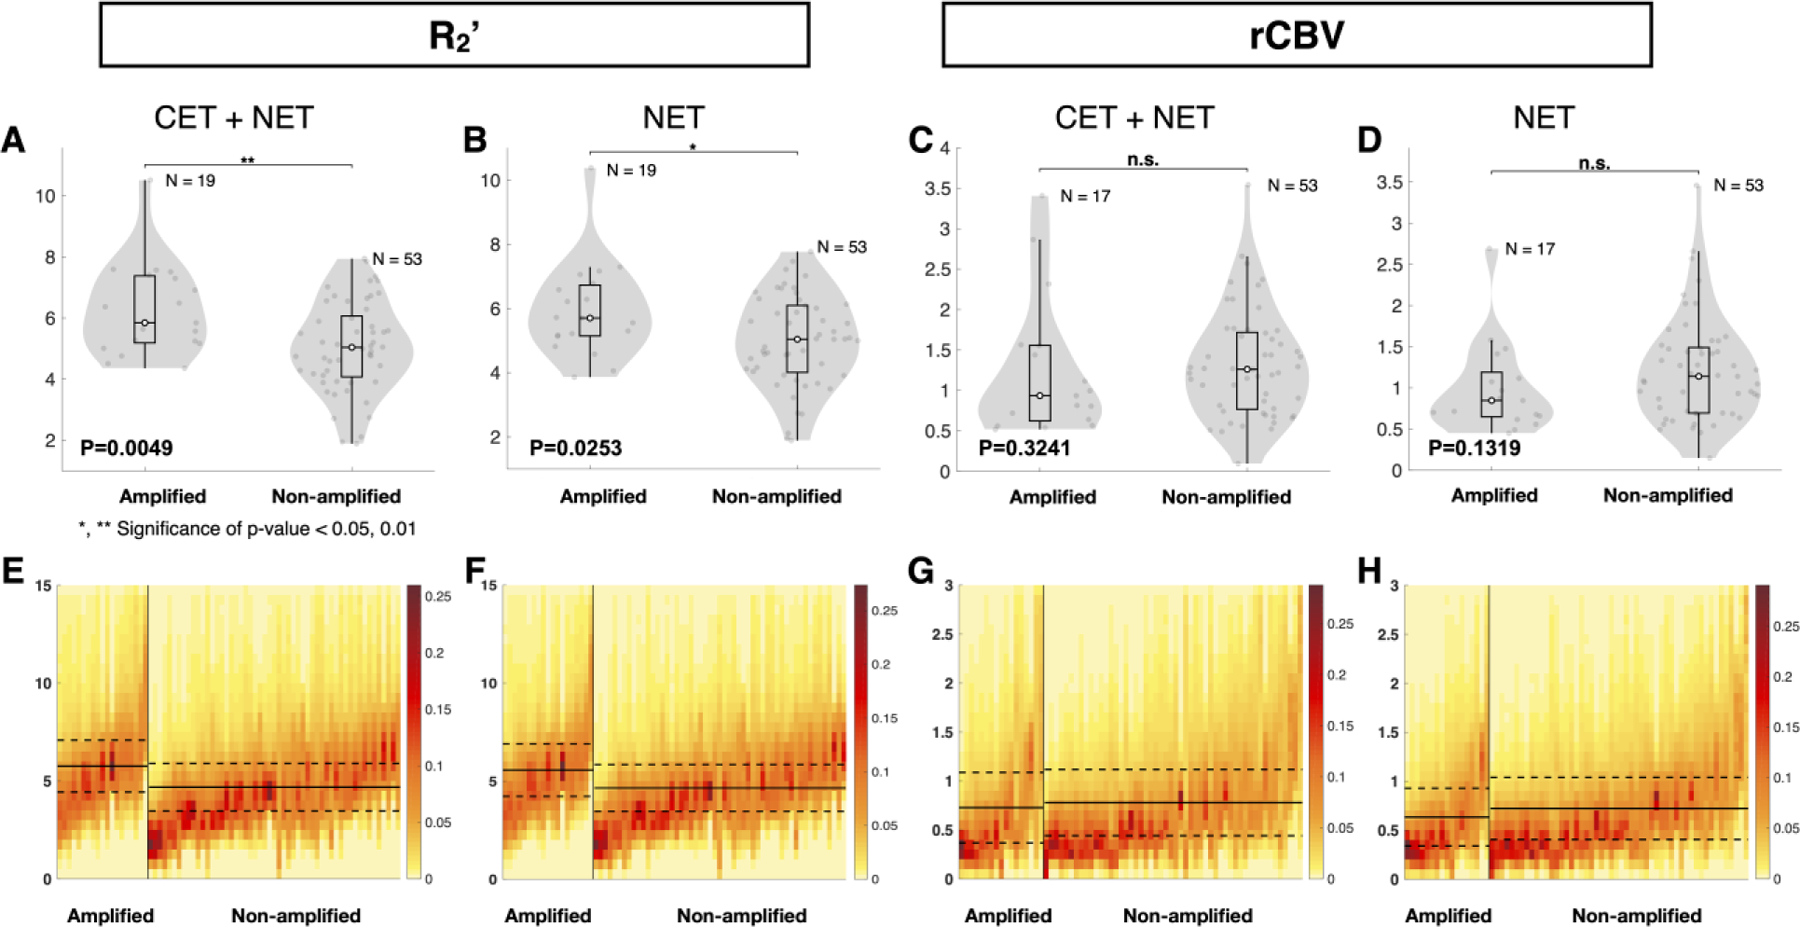
Quantitative comparison of oxygen-sensitive characteristics of EGFR amplified and non-amplified gliomas. (A and B) Comparison of median R2’ and (C and D) median rCBV between EGFR amplified and non-amplified gliomas. (A, C, E, and G) Tumor region includes contrast enhancing tumor (CET) and non-enhancing tumor (NET) tissue. (B, D, F, and H) The tumor region includes only NET tissue. (A and B) EGFR amplified gliomas exhibited significantly higher R2’ than non-amplified gliomas. (C and D) No significant difference was found in rCBV measurements between the EGFR amplified and non-amplified gliomas. Heatmaps illustrate (E and F) median R2’ and (G and H) median rCBV in tumor regions of EGFR amplified and non-amplified gliomas. The y-axes represent the MR measurement ranging from (E and F) 0 to 15 sec−1 and (G and H) 0 to 3 AU. (E–H) Each column of the heatmap represents the (E and F) R2’ or (G and H) rCBV values within a patient’s tumor region, with the EGFR amplified gliomas on the left and the EGFR non-amplified gliomas on the right. EGFR amplified and non-amplified gliomas are ordered from the highest to the lowest median (E and F) R2’ and (G and H) rCBV values. The color bar indicates the fraction of voxels with each (E and F) R2’ and (G and H) rCBV value. Red represents the highest frequency or fraction of voxels with the corresponding MR value, while yellow represents the lowest frequency. Extreme values were excluded from this analysis. The solid black line represents the mean of all median values for EGFR amplified or non-amplified gliomas, while the dashed lines represent the standard deviation of the mean. “n.s.” refers to no significance or P ≥0.05, while “*” and “**” refer to P <0.05 and <0.01, respectively.
Figure 4.
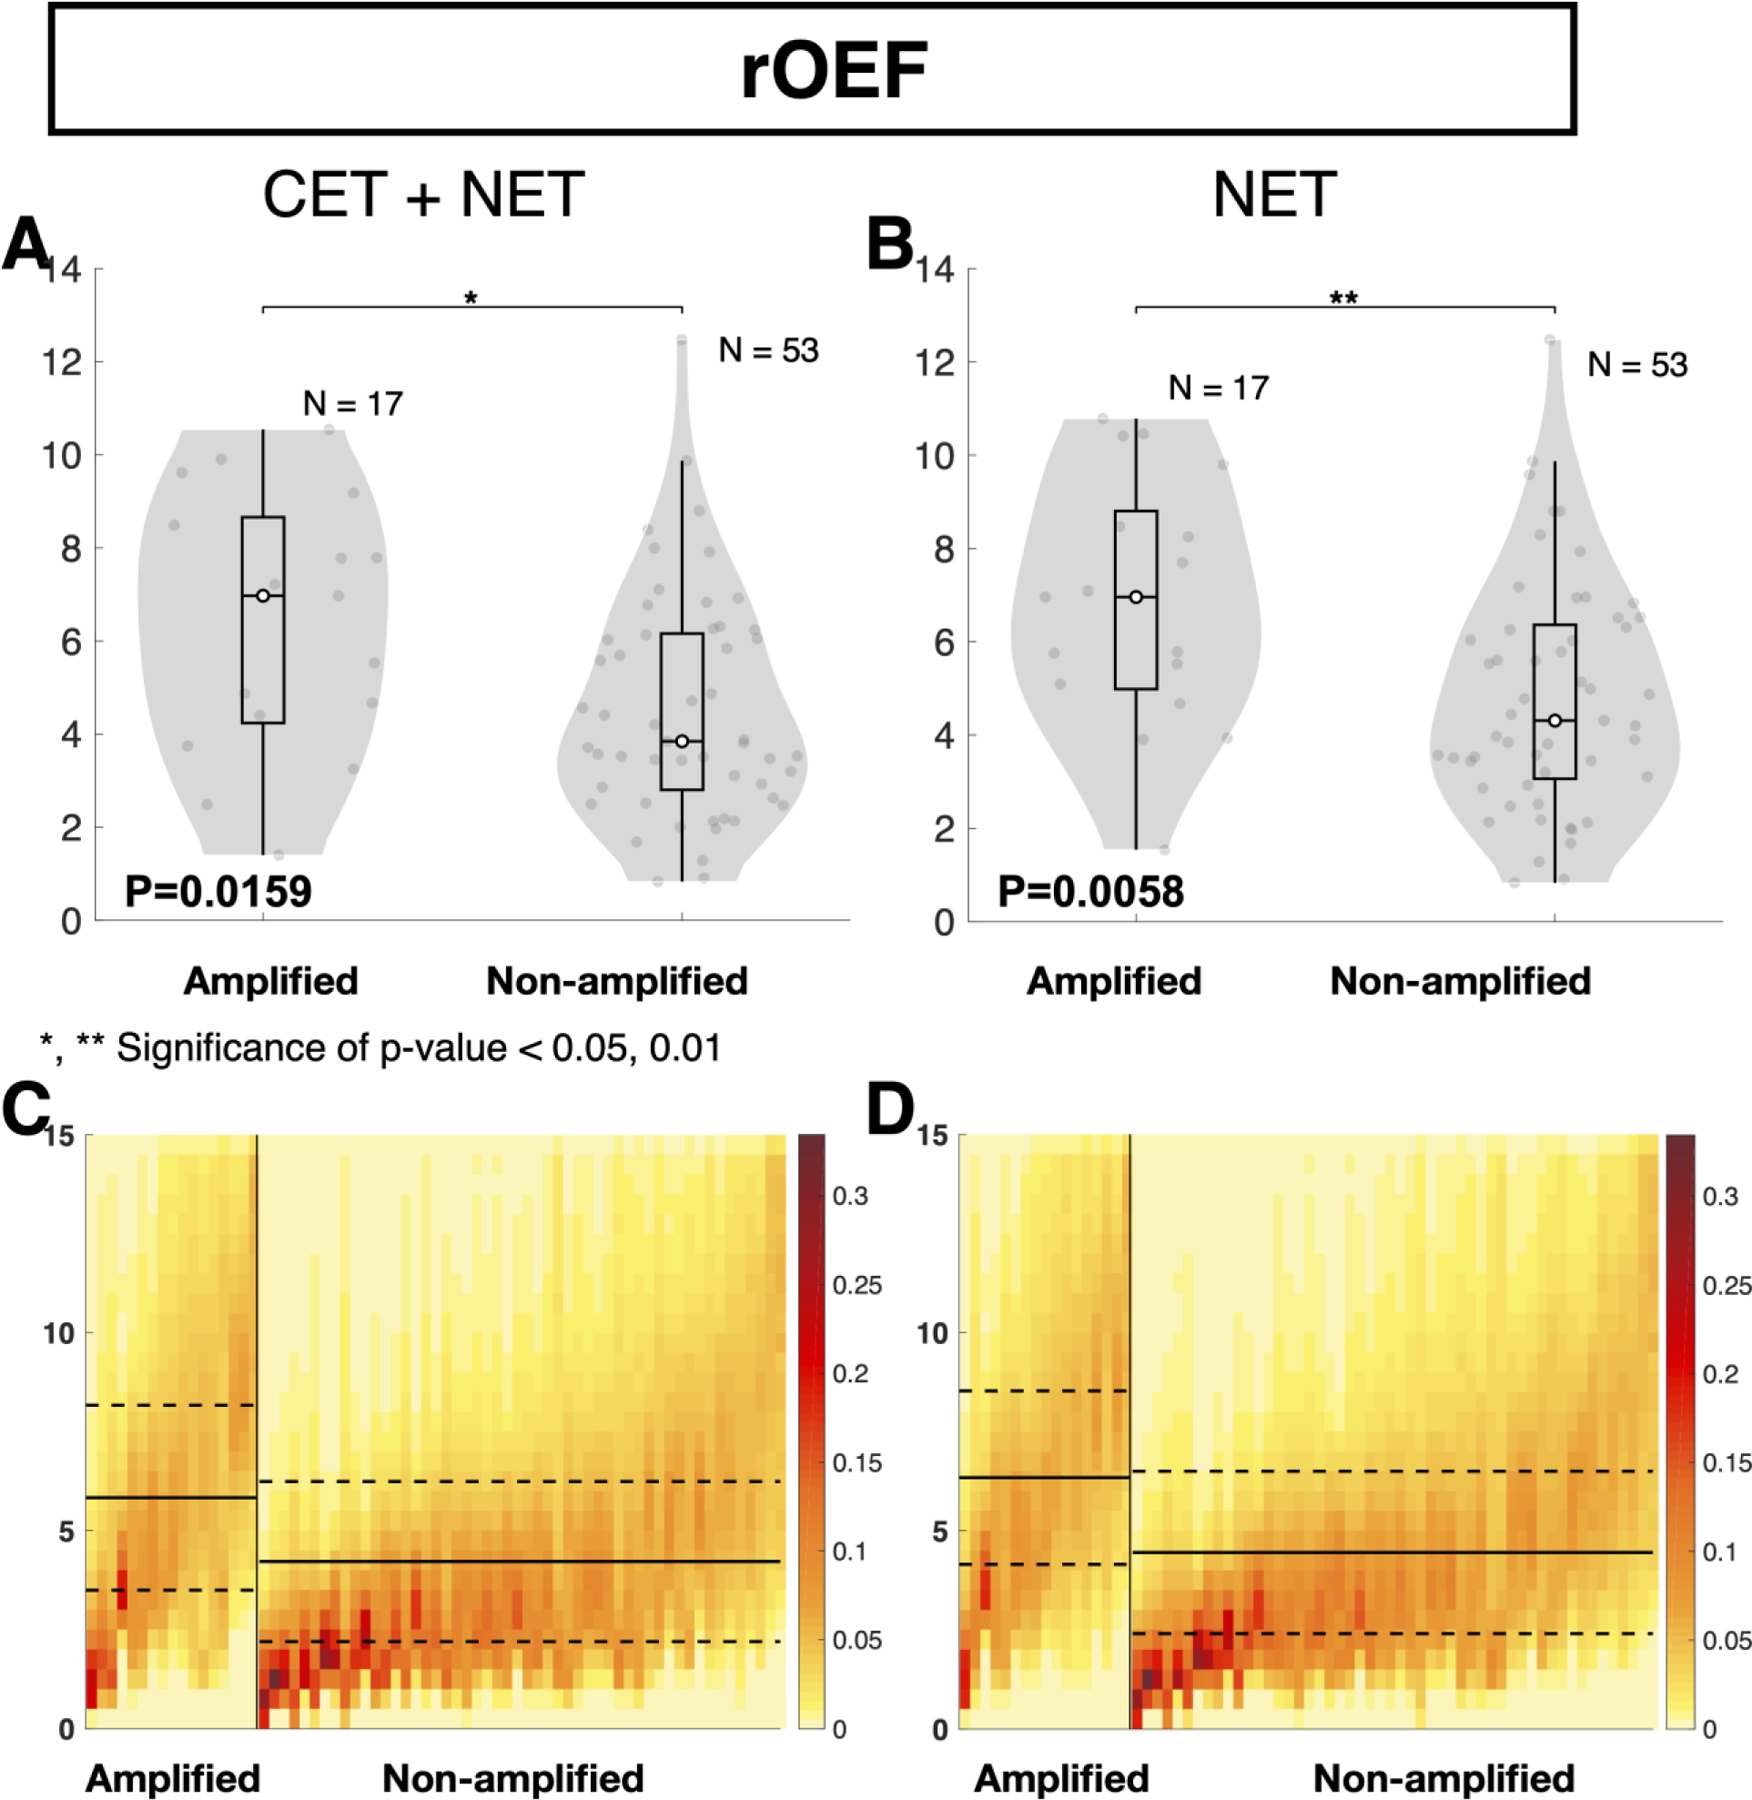
Quantitative comparison of oxygen extraction between EGFR amplified and non-amplified gliomas. (A and B) Comparison of median rOEF between EGFR amplified and non-amplified gliomas. (A and C) Tumor region includes contrast enhancing tumor (CET) and non-enhancing tumor (NET) tissue. (B and D) Tumor region only includes NET tissue. (A and B) EGFR amplified gliomas exhibited significantly higher rOEF than non-amplified gliomas. Heatmaps illustrate (C and D) median rOEF in tumor regions of EGFR amplified and non-amplified gliomas. The y-axis represents rOEF values ranging from 0 to 15 AU. Each column of the heatmap represents the rOEF values within a patient’s tumor region, with the EGFR amplified gliomas on the left and the EGFR non-amplified gliomas on the right. EGFR amplified and non-amplified gliomas are ordered from the highest to the lowest median rOEF values. The color bar indicates the fraction of voxels with each rOEF value. Red represents the highest frequency or fraction of voxels with the corresponding MR value, while yellow represents the lowest frequency. Extreme values were excluded from this analysis. The solid black line represents the mean of all median rOEF for EGFR amplified or non-amplified gliomas, while the dashed line represents the standard deviation of the mean. “n.s.” refers to no significance or P ≥0.05, while “*” and “**” refer to P <0.05 and <0.01, respectively.
ROC analysis was performed to assess the ability for median R2’, rCBV, and rOEF to discriminate between EGFR amplified and EGFR non-amplified tumors using either CET and NET (Fig. 5A) or NET regions alone (Fig. 5B). Results suggest the best differentiation of EGFR amplified and non-amplified gliomas within combined CET and NET regions could be achieved using an R2’ threshold of 5.2264 s−1 with an estimated sensitivity of 73.7% and specificity of 60.4% (Fig. 5A; Area under the curve (AUC) = 0.7190; P = 0.0048; Accuracy = 63.89%). Using the combined CET and NET region of interest, rCBV was insufficient in separating EGFR status, with a cut-off value of 1.1281 AU and sensitivity and specificity of 62.26% and 64.71%, respectively (Figure 5A; AUC = 0.5805; P = 0.3207; Accuracy = 62.86%). With a threshold of 6.9467 AU, sensitivity of 52.9%, and specificity of 86.8%, rOEF was also able to distinguish EGFR status in CET and NET tissue (Figure 5A; AUC = 0.6959; P = 0.0156; Accuracy = 78.57%).
Figure 5.
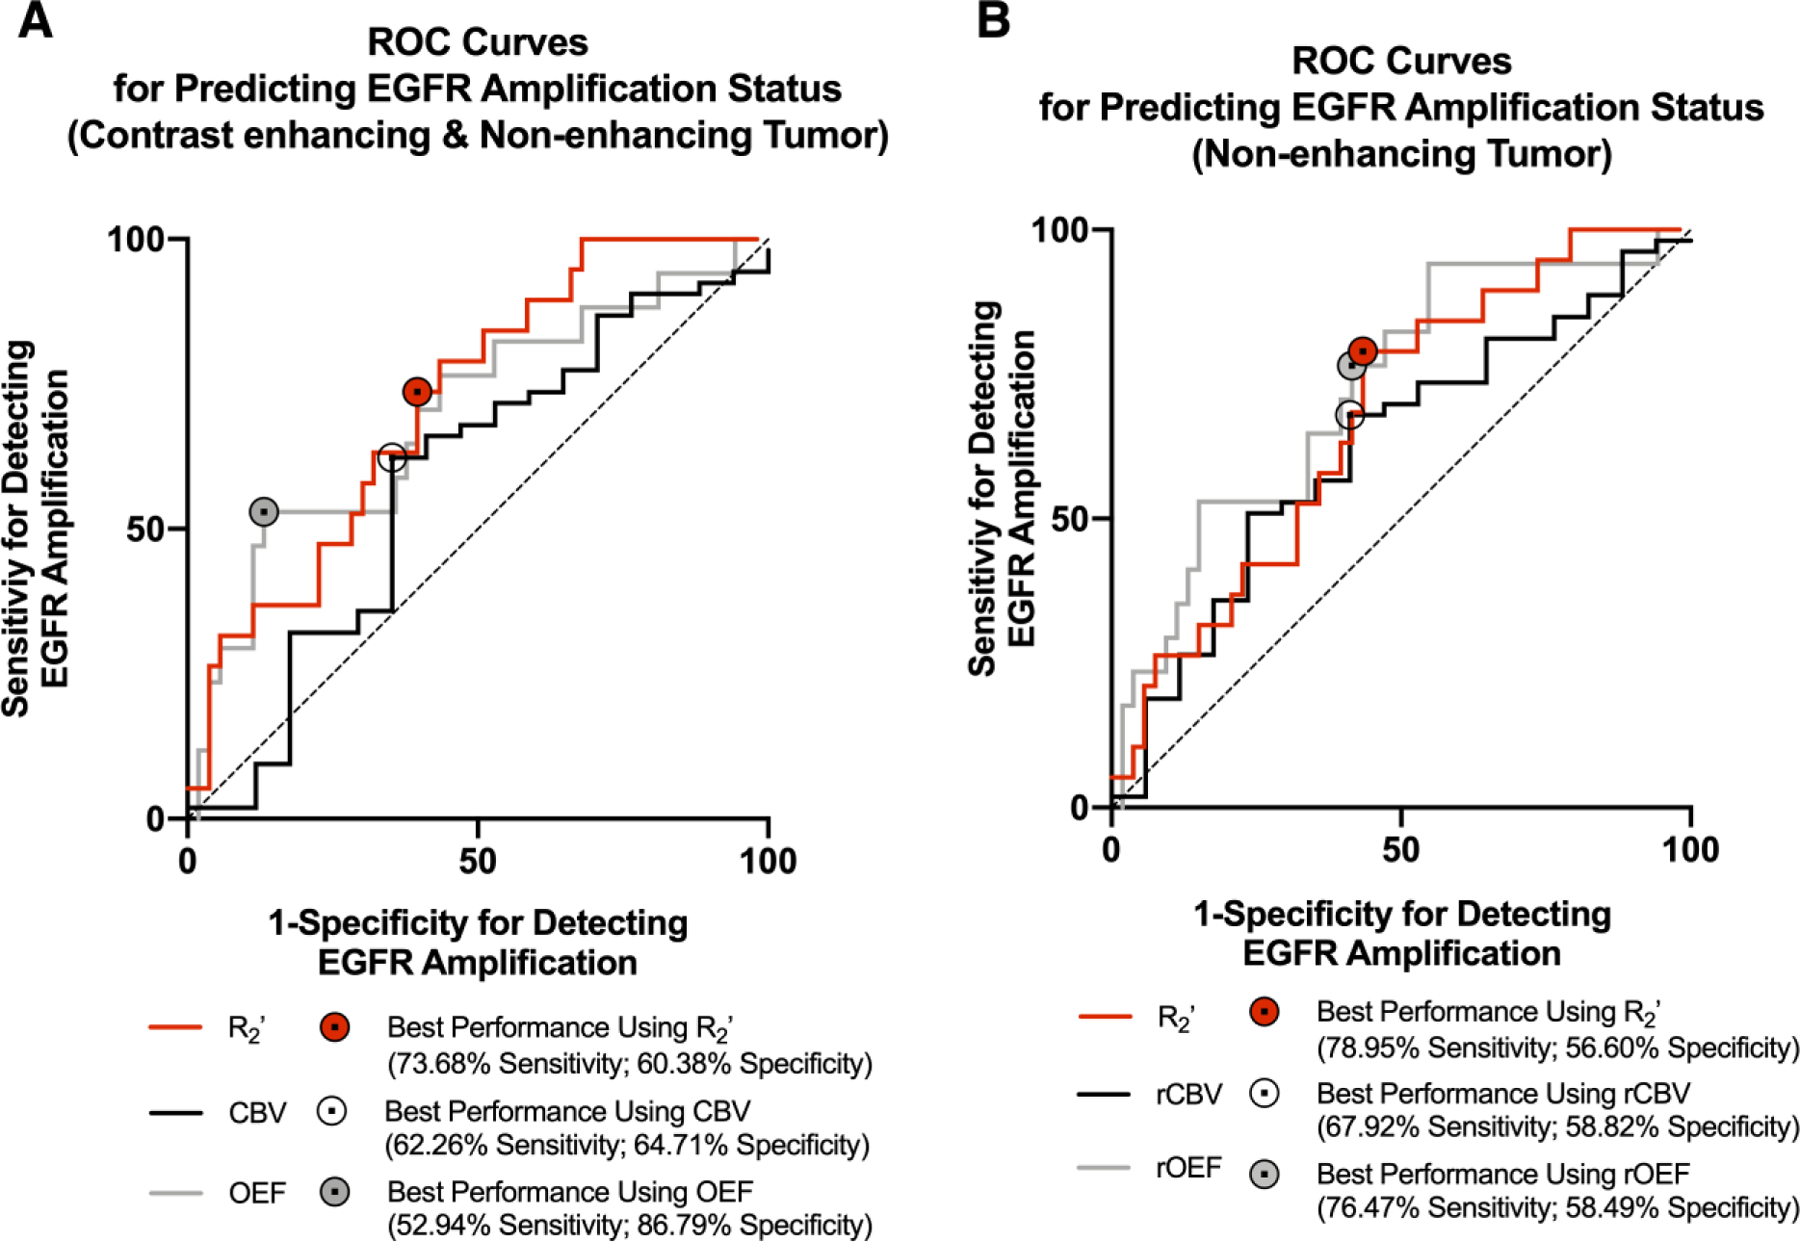
Receiver-Operator Characteristic (ROC) curves. (A) ROC curves for predicting EGFR amplification status using oxygen-sensitive MR characteristics of contrast enhancing tumor (CET) and non-enhancing tumor (NET) regions. (B) ROC curves for predicting EGFR amplification status using oxygen-sensitive MR characteristics of the NET region. (A and B) Curves are plotted for R2’ (red), CBV (black), and rOEF (gray), and a reference line of 50% sensitivity and specificity is shown (dashed). The area under the ROC curves (AUC) and P value for each curve are reported in the results.
Consistent with the combined CET and NET regions, examination of NET excluding any enhancing tumor also suggested median R2’ (Figure 5B; AUC = 0.6743; P = 0.0249; Accuracy = 62.50%) and rOEF (Figure 5B; AUC = 0.7214; P = 0.0063; Accuracy = 62.86%) could differentiate EGFR amplified from non-amplified gliomas; whereas rCBV, with a cut-off value of 0.8889 AU and sensitivity and specificity of 67.9% and 58.8%, could not (Figure 5B; AUC = 0.6226; P = 0.1302; Accuracy = 65.71%). Within the NET region, an R2’ threshold of 5.1106 s−1 could differentiate EGFR amplified from non-amplified gliomas with sensitivity of 79.0% and specificity of 56.6%, while a rOEF threshold of 5.0387 AU could differentiate them with sensitivity of 76.5% and specificity of 58.5%.
Univariate cox regression analysis revealed that both clinical characteristics (age, treatment, IDH, and EGFR status) and MR measurements (R2’ and rOEF) significantly influenced overall survival (OS). No significant association was observed between rCBV and OS. Using a multivariate regression model to control for clinical factors, no MR measurements were significant independent prognostic factors of survival. However, multivariate analysis demonstrated a trend towards increased risk of death with increasing R2’ (Table 2; P = 0.1175, Hazard Ratio (HR) = 1.2974, Confidence Interval (CI) = [0.9364, 1.7978]).
Table 2.
Univariate and Multivariate Cox proportional-hazards model analysis. Univariate Cox regression model identified significant (P < 0.001) influence of R2’ and rOEF on overall survival. For R2’, rCBV, and rOEF, median values from the combined CET and NET region were included. For treatment status, off-treatment patients were coded as 0 and those who were on active therapies as 1. For IDH status, wild-type (WT) patients were coded as 0 and mutant (Mut) as 1. For EGFR status, non-amplified (Non-amp) patients were coded as 0 and amplified (Amp) as 1.
| OS (Univariate) | OS (Multivariate) | ||||||
|---|---|---|---|---|---|---|---|
| Characteristic (unit) | P value | Z score | HR (CI) | P value | Z score | HR (CI) | |
| Age (year) | 0.0130 | 2.4829 | 1.0477 (1.0099 – 1.0869) | ||||
| Treatment status (on/off) | 1.99E-03 | 3.0925 | 3.7735 (1.6264 – 8.7550) | ||||
| IDH (Mut/WT) | 1.17E-03 | −3.246 | 0.0905 (0.0212 – 0.3860) | ||||
| EGFR (Amp/Non-amp) | 5.76E-03 | 2.7609 | 3.1891 (1.3999 – 7.2649) | ||||
| R2’ (s−1) | 6.68E-04 | 3.4024 | 1.5121 (1.1916 – 1.9187) | 0.1175 | 1.5652 | 1.2974 (0.9364 – 1.7978) | |
| rCBV | 0.2335 | −1.1914 | 0.6791 (0.3593 −1.2836) | 0.8973 | −0.129 | 0.9552 (0.4765 – 1.9148) | |
| rOEF | 8.82E-04 | 3.3256 | 1.282 (1.1074 – 1.4842) | 0.4276 | 0.7932 | 1.1043 (0.8643 – 1.4109) | |
Kaplan-Meier curves were graphed by EGFR amplification status or pre-specified threshold for metabolic MR measurements including R2’, rCBV, and rOEF. Consistent with findings of Cox regression analyses, EGFR amplified patients had a significantly shorter OS than EGFR non-amplified patients (Figure 6C; P= 0.00357, HR = 3.07 [1.16–8.12]). Patients who exhibited gliomas with a median R2’ greater than or equal to 4.8 s−1 had significantly worse OS than patients with lower median R2’ (Figure 6A; P = 0.00013, HR= 7.04 [3.16–15.7]). Although rCBV was not an effective differentiator of EGFR status, rCBV remained a significant predictor of OS. Patients with rCBV greater than or equal to 0.6 AU exhibited a survival advantage over patients with lower rCBV (Figure 6B; P = 0.00137, HR = 0.262 [0.0681–1.01]). Furthermore, rOEF was a significant predictor of OS (Figure 6D; P= 4.8 × 10⁻⁵, HR = 4.59 [1.53–13.8]). Patients who exhibited an rOEF greater than or equal to 7.1 AU had shorter OS than patients with lower rOEF. A significant survival advantage was observed in patients younger than 51 years of age (Figure S2A; P = 0.0031, HR = 0.407 [0.182–0.91]), patients with low grade gliomas (Figure S2B; P = 6.36 × 10⁻⁵, HR = 0.191 [0.083–0.44]), and patients who were not on active therapy at the time of the scan (Figure S2C; P = 9.56 × 10⁻⁴, HR = 0.277 [0.117–0.66]).
Figure 6.
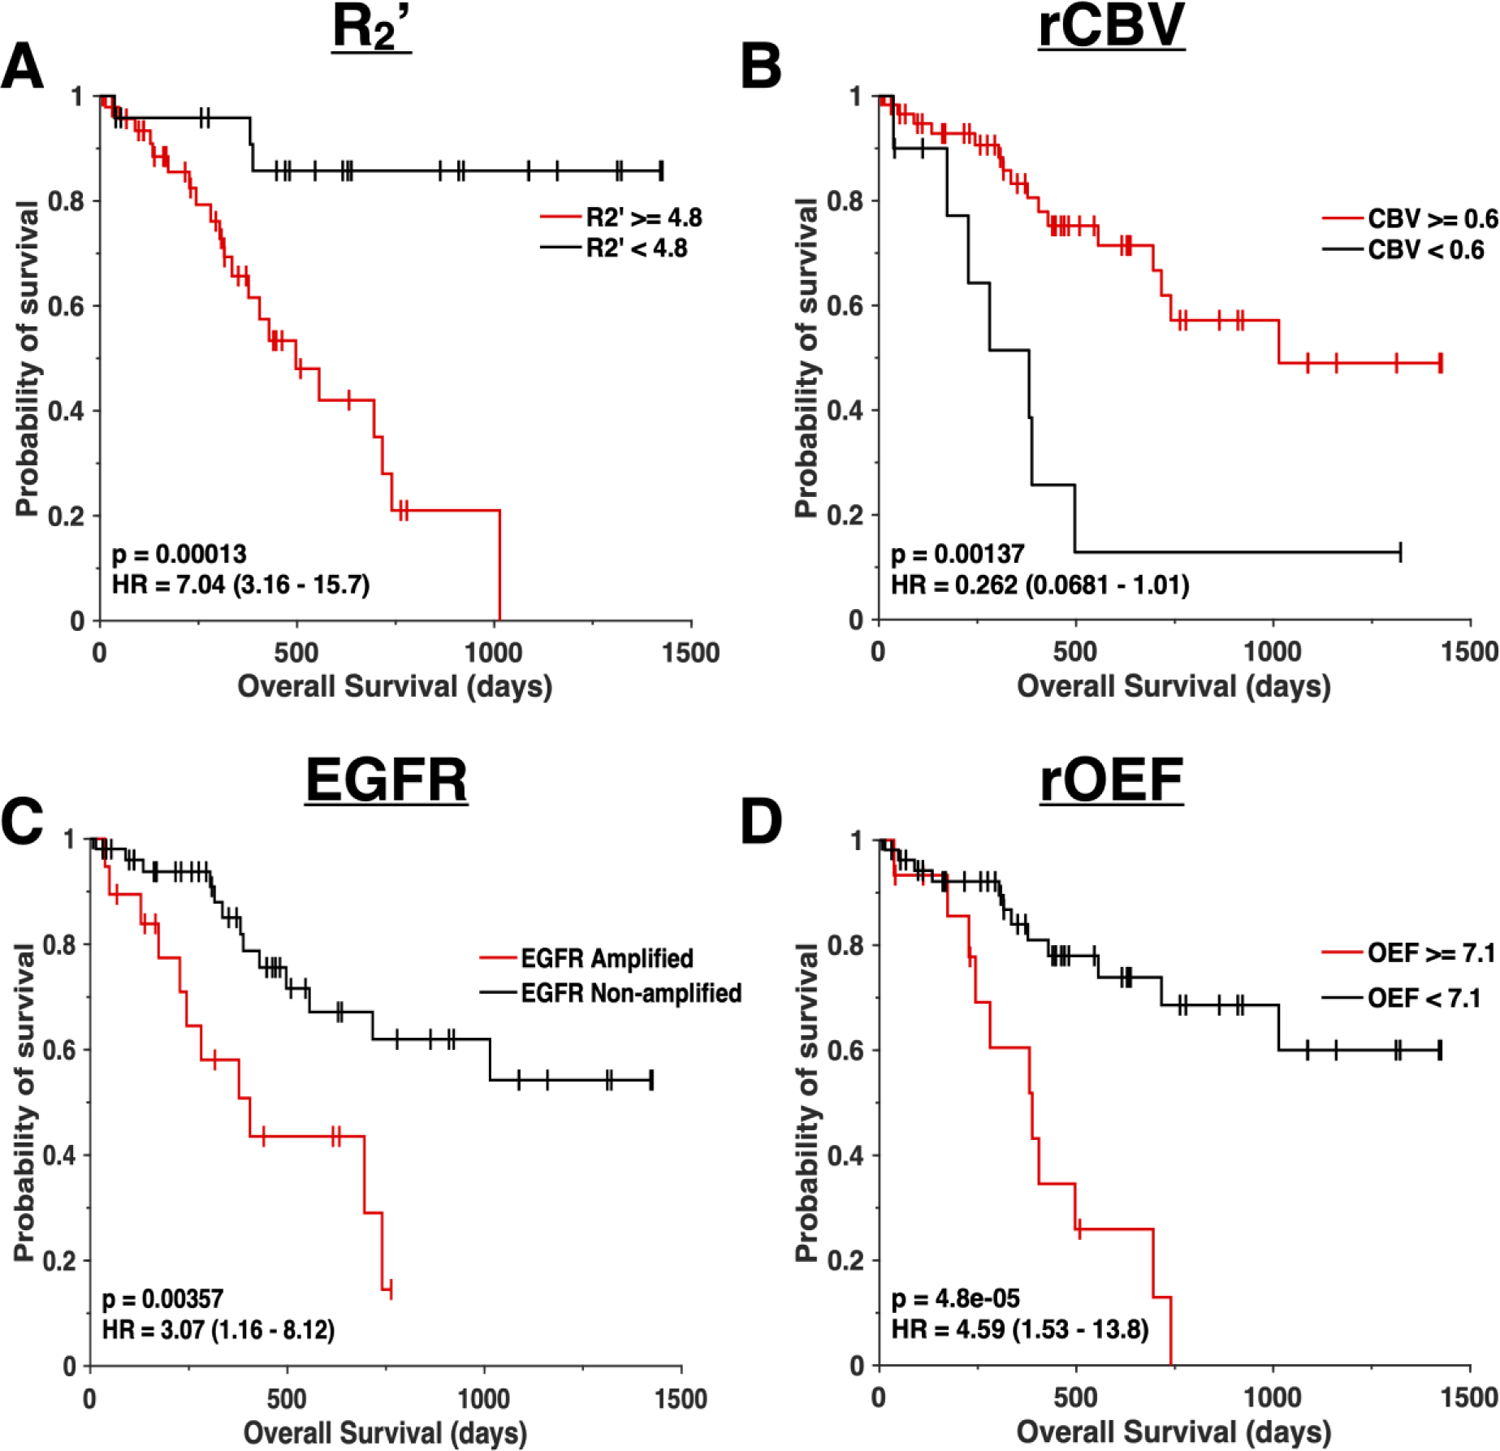
Survival curves. Kaplan-Meier plots showing significant difference in overall survival between (A) patients with median R2’ values above or equal to 4.8 sec−1 (red) and R2’ below 4.8 sec−1 (black), (B) patients with median rCBV values above or equal to 0.6 (red) and rCBV below 0.6 (black), (C) EGFR amplified (red) and EGFR non-amplified (black) gliomas, and (D) patients with median rOEF values above or equal to 7.1 (red) and rOEF below 7.1 (black). All curves illustrate a significant difference (P < 0.001) in overall survival. (A) Median R2’, (B) rCBV, and (D) rOEF were calculated from the contrast-enhancing and the non-contrast enhancing tumor region.
DISCUSSION
Genotypic characteristics of a tumor influence cancer metabolism and growth, microenvironmental nutrient availability, and cellular response to radiation and chemotherapy. With advanced MR imaging techniques and increasingly available genetic sequencing, researchers and clinicians may elucidate specific abnormalities within diseased brain tissue. In this study, a combination of SAGE-EPI and DSC-MRI was implemented to measure glioma tissue oxygen availability and utilization with relatively high spatial resolution. The examined imaging metrics were used to better understand the tumor microenvironment and prognostication in patients with EGFR amplified and non-amplified gliomas.
For each glioma, two mutually exclusive regions of interest (ROIs), specifically the contrast enhancing tumor (CET) and the non-enhancing tumor (NET), were defined. Higher grade tumors tend to display contrast-enhanced regions on T1-weighted images, while low-grade gliomas often do not exhibit contrast enhancement. In order to prevent bias toward grade III and IV contrast-enhancing tumors, statistical evaluation was performed on the “combined” tumor region (CET and NET) and the NET region alone.
In general, patients with EGFR amplified gliomas exhibited significantly higher median R2’ and rOEF, regardless of which ROI was examined. The difference in R2’ and rOEF was large enough to adequately differentiate these two genotypes with sufficient sensitivity and specificity, and both measurements could be used to stratify long and short-term OS using univariate analysis. We did not observe any significant differences in rCBV between EGFR amplified and non-amplified gliomas and continuous values of rCBV were not prognostic for OS. Additionally, it is important to note that R2’ and rOEF were not independent predictors of OS when accounting for clinical variables in multivariate analysis, including EGFR amplification status. This lack of prognosis when accounting for clinical variables may reflect both the relationship between EGFR status and R2’ or rOEF measures as well as the limited predictive nature of EGFR amplification itself. Recent studies have suggested limited prognostic value of EGFR amplification in high grade gliomas [7] and those treated with chemoradiation [38], while clinical factors including age, IDH status, and treatment remained strongly prognostic. Therefore, if R2’ and rOEF strongly reflect EGFR amplification status, and EGFR status is only weakly associated with OS when accounting for other factors, then measures of R2’ and rOEF may not be expected to be independent predictors of OS when also explicitly accounting for EGFR status. This may be due to a number of factors including subsequent treatments, surgeries, or other thigs that may alter the metabolic behavior of the tumor in later stages of the disease.
Although oxygen-sensitive MRI does not provide a direct measure of tissue oxygen consumption or hypoxia, oxygen-sensitive MRI techniques can provide higher spatial resolution images at a fraction of the cost compared with more exotic approaches including dynamic 17O MRI or fluoromisonidazole (FISMO) positron emission tomography (PET) [39,40]. Although PET can provide a more direct measure of tumor hypoxia associated with absolute oxygen concentration, PET imaging is costly and provides poor spatial resolution. R2’ mapping does not require injection of a radiotracer or exotic contrast agent, while rOEF only requires additional DSC perfusion data that is routinely collected in brain tumor patients during standard of care MRI examinations. It is important to note that R2’ measurements reflect the degree of vascular hypoxia, as it is influenced by both deoxyhemoglobin concentration and relative blood volume in the underlying image voxel. Therefore, while R2’ appears to provide slightly more sensitivity compared with rOEF, this may be more related to slight alterations in blood volume than differences in tissue oxygen utilization. Nevertheless, R2’ mapping has a significant advantage over quantification of rOEF in that rOEF requires additional rCBV calculation with the use of contrast agents and may be less reproducible because of these extra steps.
One limitation of this study was the relatively small population size and heterogeneity of the patient population. Of the 72 patients, only 19 presented EGFR amplified gliomas and a majority was diagnosed with GBM. The patient population also consisted of patients who had not received treatment within two years prior to the completion of the study and those who were on a variety of active therapies. With increased availability and use of genetic testing, future studies will be able to include more patients with EGFR amplified and non-amplified gliomas.
Another potential limitation is the heterogeneous composition of gliomas, which presents a limitation in which EGFR amplified tumors may have varying proportions of amplified and non-amplified cells. EGFR amplified tumors contain both EGFR amplified cells, which tend to be in the invasive regions of the tumor, and EGFR non-amplified cells [41]. Further investigation is necessary to elucidate the influence of tumor heterogeneity on imaging characteristics and determine the relationship between MR measurements and the number of cells harboring amplification. While in-plane resolution was around 2 mm for R2’ and rOEF images, higher spatial resolution mapping of tissue oxygenation would likely reveal more information about tumor heterogeneity.
Lastly, it is important to note that the MR measurements of R2’ and rOEF are a relative and indirect measure of tumor hypoxia or tissue oxygen utilization. Nonetheless, previous studies have established R2’, rCBV, and rOEF to be useful biomarkers of tissue oxygen saturation and consumption in the human brain [16,18,19,21,22,24–26] and have been shown to correlate with tissue markers of hypoxia and proliferation in brain tumors [23], suggesting R2’ and rOEF may be useful non-invasive surrogates of tumor hypoxia in brain tumors.
In conclusion, the current study demonstrates measurable differences between EGFR amplified and non-amplified gliomas dependent on oxygen-sensitive measures of R2’ and rOEF obtained using SAGE-EPI combined with DSC-MRI on clinical MRI systems, with EGFR amplified tumors exhibiting higher oxygen utilization.
Supplementary Material
Supplemental Figure 1 Quantitative comparison of oxygen-sensitive characteristics between WHO II-III vs. IV gliomas. (A and B) Comparison of median R2’, (C and D) median rCBV, (E and F) median rOEF between WHO grade 2/3 and WHO grade 4 gliomas. (A, C, and E) Tumor region includes contrast enhancing tumor (CET) and non-enhancing tumor (NET) tissue. (B, D, and F) The tumor region includes only NET tissue. “n.s.” refers to no significance or P ≥0.05, while “*” and “**” refer to P <0.05 and <0.01, respectively.
Supplemental Figure 2 Survival curves. Kaplan-Meier plots showing significant difference in overall survival between (A) patients younger than 51 years of age (black) and patients who were 51 or older at the time of the study (red), (B) patients with grade II and III gliomas (black) and patients with grade IV tumors (red), and (C) patients who were off treatment (black) and patients were on active treatment during the time of the study (red). All curves illustrate a significant difference (P < 0.001) in overall survival.
Acknowledgments
Funding: American Cancer Society (ACS) Research Scholar Grant (RSG-15-003-01-CCE) (Ellingson); Heart of the Brain (Cloughesy; Liau); University of California Research Coordinating Committee (Ellingson); UCLA Jonsson Comprehensive Cancer Center Seed Grant (Ellingson); UCLA SPORE in Brain Cancer (NIH/NCI 1P50CA211015-01A1) (Ellingson, Liau, Nghiemphu, Lai, Pope, Cloughesy); NIH/NCI 1R21CA223757-01 (Ellingson).
ABBREVIATIONS
- CET
contrast enhancing tumor
- DSC
dynamic susceptibility contrast
- EGFR
epidermal growth factor receptor
- IDH
isocitrate dehydrogenase
- NET
non-contrast enhancing tumor
- R2’
reversible transverse relaxation rate
- rCBV
relative cerebral blood volume
- rOEF
relative oxygen extraction fraction
- SAGE-EPI
spin-and-gradient echo echo-planar imaging
Footnotes
Publisher's Disclaimer: This Author Accepted Manuscript is a PDF file of a an unedited peer-reviewed manuscript that has been accepted for publication but has not been copyedited or corrected. The official version of record that is published in the journal is kept up to date and so may therefore differ from this version.
Conflict of interest:
Ellingson – Advisory Board – Hoffman La-Roche; Siemens; Nativis; Medicenna; MedQIA; Bristol Meyers Squibb; Imaging Endpoints; Agios. Paid Consultant – Nativis; MedQIA; Siemens; Hoffman La-Roche; Imaging Endpoints; Medicenna; Agios. Grant Funding – Hoffman La-Roche; Siemens; Agios; Janssen. Dr. Ellingson also holds a patent on this technology (US Patent #15/577,664; International PCT/US2016/034886).
Cloughesy – Advisory Board – Roche/Genentech, Amgen, Tocagen, NewGen, LPath, Proximagen, Celgene, Vascular Biogenics Ltd, Insys, Agios, Cortice Bioscience, Pfizer, Human Longevity, BMS, Merck, Notable Lab, MedQIA
Nathanson – Co-Founder of Katmai Pharmaceuticals, Consultant of Katmai Pharmaceuticals, Co-Founder of Trethera Corporation, Shareholder in Sofie Biosciences.
Oughourlian– None related to this study
Yao– None related to this study
Hagiwara– None related to this study
Raymond – None related to this study
Pope– None related to this study
Salamon– None related to this study
Lai – None related to this study
Ji– None related to this study
Nghiemphu– None related to this study
Liau – None related to this study
Ethical approval All procedures performed in reports involving human participants were in accordance with the ethical standards of the institutional and/or national research committee and with the 1964 Helsinki declaration and its later amendments or comparable ethical standards.
Informed consent Informed consent was obtained from all participants before evaluation.
REFERENCES
- 1.Louis DN, Perry A, Reifenberger G, von Deimling A, Figarella-Branger D, Cavenee WK, Ohgaki H, Wiestler OD, Kleihues P, Ellison DW (2016) The 2016 World Health Organization Classification of Tumors of the Central Nervous System: a summary. Acta Neuropathol 131 (6):803–820. 10.1007/s00401-016-1545-1 [DOI] [PubMed] [Google Scholar]
- 2.Shah N, Lin B, Sibenaller Z, Ryken T, Lee H, Yoon JG, Rostad S, Foltz G (2011) Comprehensive analysis of MGMT promoter methylation: correlation with MGMT expression and clinical response in GBM. PLoS One 6 (1):e16146. 10.1371/journal.pone.0016146 [DOI] [PMC free article] [PubMed] [Google Scholar]
- 3.Cohen AL, Holmen SL, Colman H (2013) IDH1 and IDH2 mutations in gliomas. Curr Neurol Neurosci Rep 13 (5):345. 10.1007/s11910-013-0345-4 [DOI] [PMC free article] [PubMed] [Google Scholar]
- 4.Millward CP, Brodbelt AR, Haylock B, Zakaria R, Baborie A, Crooks D, Husband D, Shenoy A, Wong H, Jenkinson MD (2016) The impact of MGMT methylation and IDH-1 mutation on long-term outcome for glioblastoma treated with chemoradiotherapy. Acta Neurochir (Wien) 158 (10):1943–1953. 10.1007/s00701-016-2928-8 [DOI] [PubMed] [Google Scholar]
- 5.Wick W, Meisner C, Hentschel B, Platten M, Schilling A, Wiestler B, Sabel MC, Koeppen S, Ketter R, Weiler M, Tabatabai G, von Deimling A, Gramatzki D, Westphal M, Schackert G, Loeffler M, Simon M, Reifenberger G, Weller M (2013) Prognostic or predictive value of MGMT promoter methylation in gliomas depends on IDH1 mutation. Neurology 81 (17):1515–1522. 10.1212/WNL.0b013e3182a95680 [DOI] [PubMed] [Google Scholar]
- 6.Kaloshi G, Benouaich-Amiel A, Diakite F, Taillibert S, Lejeune J, Laigle-Donadey F, Renard MA, Iraqi W, Idbaih A, Paris S, Capelle L, Duffau H, Cornu P, Simon JM, Mokhtari K, Polivka M, Omuro A, Carpentier A, Sanson M, Delattre JY, Hoang-Xuan K (2007) Temozolomide for low-grade gliomas: predictive impact of 1p/19q loss on response and outcome. Neurology 68 (21):1831–1836. 10.1212/01.wnl.0000262034.26310.a2 [DOI] [PubMed] [Google Scholar]
- 7.Aibaidula A, Chan AK, Shi Z, Li Y, Zhang R, Yang R, Li KK, Chung NY, Yao Y, Zhou L, Wu J, Chen H, Ng HK (2017) Adult IDH wild-type lower-grade gliomas should be further stratified. Neuro Oncol 19 (10):1327–1337. 10.1093/neuonc/nox078 [DOI] [PMC free article] [PubMed] [Google Scholar]
- 8.Brat DJ, Aldape K, Colman H, Holland EC, Louis DN, Jenkins RB, Kleinschmidt-DeMasters BK, Perry A, Reifenberger G, Stupp R, von Deimling A, Weller M (2018) cIMPACT-NOW update 3: recommended diagnostic criteria for “Diffuse astrocytic glioma, IDH-wildtype, with molecular features of glioblastoma, WHO grade IV”. Acta Neuropathol 136 (5):805–810. 10.1007/s00401-018-1913-0 [DOI] [PMC free article] [PubMed] [Google Scholar]
- 9.Labussiere M, Boisselier B, Mokhtari K, Di Stefano AL, Rahimian A, Rossetto M, Ciccarino P, Saulnier O, Paterra R, Marie Y, Finocchiaro G, Sanson M (2014) Combined analysis of TERT, EGFR, and IDH status defines distinct prognostic glioblastoma classes. Neurology 83 (13):1200–1206. 10.1212/WNL.0000000000000814 [DOI] [PubMed] [Google Scholar]
- 10.Reuss DE, Kratz A, Sahm F, Capper D, Schrimpf D, Koelsche C, Hovestadt V, Bewerunge-Hudler M, Jones DT, Schittenhelm J, Mittelbronn M, Rushing E, Simon M, Westphal M, Unterberg A, Platten M, Paulus W, Reifenberger G, Tonn JC, Aldape K, Pfister SM, Korshunov A, Weller M, Herold-Mende C, Wick W, Brandner S, von Deimling A (2015) Adult IDH wild type astrocytomas biologically and clinically resolve into other tumor entities. Acta Neuropathol 130 (3):407–417. 10.1007/s00401-015-1454-8 [DOI] [PubMed] [Google Scholar]
- 11.Saadeh FS, Mahfouz R, Assi HI (2018) EGFR as a clinical marker in glioblastomas and other gliomas. Int J Biol Markers 33 (1):22–32. 10.5301/ijbm.5000301 [DOI] [PubMed] [Google Scholar]
- 12.Talasila KM, Soentgerath A, Euskirchen P, Rosland GV, Wang J, Huszthy PC, Prestegarden L, Skaftnesmo KO, Sakariassen PO, Eskilsson E, Stieber D, Keunen O, Brekka N, Moen I, Nigro JM, Vintermyr OK, Lund-Johansen M, Niclou S, Mork SJ, Enger PO, Bjerkvig R, Miletic H (2013) EGFR wild-type amplification and activation promote invasion and development of glioblastoma independent of angiogenesis. Acta Neuropathol 125 (5):683–698. 10.1007/s00401-013-1101-1 [DOI] [PMC free article] [PubMed] [Google Scholar]
- 13.Franovic A, Gunaratnam L, Smith K, Robert I, Patten D, Lee S (2007) Translational up-regulation of the EGFR by tumor hypoxia provides a nonmutational explanation for its overexpression in human cancer. Proc Natl Acad Sci U S A 104 (32):13092–13097. 10.1073/pnas.0702387104 [DOI] [PMC free article] [PubMed] [Google Scholar]
- 14.He X, Yablonskiy DA (2007) Quantitative BOLD: mapping of human cerebral deoxygenated blood volume and oxygen extraction fraction: default state. Magn Reson Med 57 (1):115–126. 10.1002/mrm.21108 [DOI] [PMC free article] [PubMed] [Google Scholar]
- 15.Pauling L, Coryell CD (1936) The Magnetic Properties and Structure of Hemoglobin, Oxyhemoglobin and Carbonmonoxyhemoglobin. Proc Natl Acad Sci U S A 22 (4):210–216. 10.1073/pnas.22.4.210 [DOI] [PMC free article] [PubMed] [Google Scholar]
- 16.Stokes AM, Skinner JT, Quarles CC (2014) Assessment of a combined spin- and gradient-echo (SAGE) DSC-MRI method for preclinical neuroimaging. Magn Reson Imaging 32 (10):1181–1190. 10.1016/j.mri.2014.08.027 [DOI] [PMC free article] [PubMed] [Google Scholar]
- 17.Schmiedeskamp H, Straka M, Newbould RD, Zaharchuk G, Andre JB, Olivot JM, Moseley ME, Albers GW, Bammer R (2012) Combined spin- and gradient-echo perfusion-weighted imaging. Magn Reson Med 68 (1):30–40. 10.1002/mrm.23195 [DOI] [PMC free article] [PubMed] [Google Scholar]
- 18.Skinner JT, Robison RK, Elder CP, Newton AT, Damon BM, Quarles CC (2014) Evaluation of a multiple spin- and gradient-echo (SAGE) EPI acquisition with SENSE acceleration: applications for perfusion imaging in and outside the brain. Magn Reson Imaging 32 (10):1171–1180. 10.1016/j.mri.2014.08.032 [DOI] [PMC free article] [PubMed] [Google Scholar]
- 19.Ni W, Christen T, Zun Z, Zaharchuk G (2015) Comparison of R2’ measurement methods in the normal brain at 3 Tesla. Magn Reson Med 73 (3):1228–1236. 10.1002/mrm.25232 [DOI] [PMC free article] [PubMed] [Google Scholar]
- 20.Geisler BS, Brandhoff F, Fiehler J, Saager C, Speck O, Rother J, Zeumer H, Kucinski T (2006) Blood-oxygen-level-dependent MRI allows metabolic description of tissue at risk in acute stroke patients. Stroke 37 (7):1778–1784. 10.1161/01.STR.0000226738.97426.6f [DOI] [PubMed] [Google Scholar]
- 21.Jensen-Kondering U, Manavaki R, Ejaz S, Sawiak SJ, Carpenter TA, Fryer TD, Aigbirhio FI, Williamson DJ, Baron JC (2017) Brain hypoxia mapping in acute stroke: Back-to-back T2’ MR versus (18)F-fluoromisonidazole PET in rodents. Int J Stroke 12 (7):752–760. 10.1177/1747493017706221 [DOI] [PubMed] [Google Scholar]
- 22.Toth V, Forschler A, Hirsch NM, den Hollander J, Kooijman H, Gempt J, Ringel F, Schlegel J, Zimmer C, Preibisch C (2013) MR-based hypoxia measures in human glioma. J Neurooncol 115 (2):197–207. 10.1007/s11060-013-1210-7 [DOI] [PubMed] [Google Scholar]
- 23.Yao J, Chakhoyan A, Nathanson DA, Yong WH, Salamon N, Raymond C, Mareninov S, Lai A, Nghiemphu PL, Prins RM, Pope WB, Everson RG, Liau LM, Cloughesy TF, Ellingson BM (2019) Metabolic characterization of human IDH mutant and wild type gliomas using simultaneous pH- and oxygen-sensitive molecular MRI. Neuro Oncol. 10.1093/neuonc/noz078 [DOI] [PMC free article] [PubMed]
- 24.Christen T, Schmiedeskamp H, Straka M, Bammer R, Zaharchuk G (2012) Measuring brain oxygenation in humans using a multiparametric quantitative blood oxygenation level dependent MRI approach. Magn Reson Med 68 (3):905–911. 10.1002/mrm.23283 [DOI] [PubMed] [Google Scholar]
- 25.An H, Lin W (2000) Quantitative measurements of cerebral blood oxygen saturation using magnetic resonance imaging. J Cereb Blood Flow Metab 20 (8):1225–1236. 10.1097/00004647-200008000-00008 [DOI] [PMC free article] [PubMed] [Google Scholar]
- 26.Fan AP, Govindarajan ST, Kinkel RP, Madigan NK, Nielsen AS, Benner T, Tinelli E, Rosen BR, Adalsteinsson E, Mainero C (2015) Quantitative oxygen extraction fraction from 7-Tesla MRI phase: reproducibility and application in multiple sclerosis. J Cereb Blood Flow Metab 35 (1):131–139. 10.1038/jcbfm.2014.187 [DOI] [PMC free article] [PubMed] [Google Scholar]
- 27.Lai A, Kharbanda S, Pope WB, Tran A, Solis OE, Peale F, Forrest WF, Pujara K, Carrillo JA, Pandita A, Ellingson BM, Bowers CW, Soriano RH, Schmidt NO, Mohan S, Yong WH, Seshagiri S, Modrusan Z, Jiang Z, Aldape KD, Mischel PS, Liau LM, Escovedo CJ, Chen W, Nghiemphu PL, James CD, Prados MD, Westphal M, Lamszus K, Cloughesy T, Phillips HS (2011) Evidence for sequenced molecular evolution of IDH1 mutant glioblastoma from a distinct cell of origin. J Clin Oncol 29 (34):4482–4490. 10.1200/JCO.2010.33.8715 [DOI] [PMC free article] [PubMed] [Google Scholar]
- 28.Hatanpaa KJ, Burger PC, Eshleman JR, Murphy KM, Berg KD (2003) Molecular diagnosis of oligodendroglioma in paraffin sections. Lab Invest 83 (3):419–428. 10.1097/01.lab.0000059948.67795.ef [DOI] [PubMed] [Google Scholar]
- 29.Tynninen O, Aronen HJ, Ruhala M, Paetau A, Von Boguslawski K, Salonen O, Jaaskelainen J, Paavonen T (1999) MRI enhancement and microvascular density in gliomas. Correlation with tumor cell proliferation. Invest Radiol 34 (6):427–434. 10.1097/00004424-199906000-00007 [DOI] [PubMed] [Google Scholar]
- 30.Ellingson BM, Bendszus M, Boxerman J, Barboriak D, Erickson BJ, Smits M, Nelson SJ, Gerstner E, Alexander B, Goldmacher G, Wick W, Vogelbaum M, Weller M, Galanis E, Kalpathy-Cramer J, Shankar L, Jacobs P, Pope WB, Yang D, Chung C, Knopp MV, Cha S, van den Bent MJ, Chang S, Yung WK, Cloughesy TF, Wen PY, Gilbert MR, Jumpstarting Brain Tumor Drug Development Coalition Imaging Standardization Steering C (2015) Consensus recommendations for a standardized Brain Tumor Imaging Protocol in clinical trials. Neuro Oncol 17 (9):1188–1198. 10.1093/neuonc/nov095 [DOI] [PMC free article] [PubMed] [Google Scholar]
- 31.Wang YL, Yao J, Chakhoyan A, Raymond C, Salamon N, Liau LM, Nghiemphu PL, Lai A, Pope WB, Nguyen N, Ji M, Cloughesy TF, Ellingson BM (2019) Association between Tumor Acidity and Hypervascularity in Human Gliomas Using pH-Weighted Amine Chemical Exchange Saturation Transfer Echo-Planar Imaging and Dynamic Susceptibility Contrast Perfusion MRI at 3T. AJNR Am J Neuroradiol 40 (6):979–986. 10.3174/ajnr.A6063 [DOI] [PMC free article] [PubMed] [Google Scholar]
- 32.Ellingson BM, Harris RJ, Woodworth DC, Leu K, Zaw O, Mason WP, Sahebjam S, Abrey LE, Aftab DT, Schwab GM, Hessel C, Lai A, Nghiemphu PL, Pope WB, Wen PY, Cloughesy TF (2017) Baseline pretreatment contrast enhancing tumor volume including central necrosis is a prognostic factor in recurrent glioblastoma: evidence from single and multicenter trials. Neuro Oncol 19 (1):89–98. 10.1093/neuonc/now187 [DOI] [PMC free article] [PubMed] [Google Scholar]
- 33.Tran AN, Lai A, Li S, Pope WB, Teixeira S, Harris RJ, Woodworth DC, Nghiemphu PL, Cloughesy TF, Ellingson BM (2014) Increased sensitivity to radiochemotherapy in IDH1 mutant glioblastoma as demonstrated by serial quantitative MR volumetry. Neuro Oncol 16 (3):414–420. 10.1093/neuonc/not198 [DOI] [PMC free article] [PubMed] [Google Scholar]
- 34.Ellingson BM, Kim HJ, Woodworth DC, Pope WB, Cloughesy JN, Harris RJ, Lai A, Nghiemphu PL, Cloughesy TF (2014) Recurrent glioblastoma treated with bevacizumab: contrast-enhanced T1-weighted subtraction maps improve tumor delineation and aid prediction of survival in a multicenter clinical trial. Radiology 271 (1):200–210. 10.1148/radiol.13131305 [DOI] [PMC free article] [PubMed] [Google Scholar]
- 35.Hatanpaa KJ, Burma S, Zhao D, Habib AA (2010) Epidermal growth factor receptor in glioma: signal transduction, neuropathology, imaging, and radioresistance. Neoplasia 12 (9):675–684. 10.1593/neo.10688 [DOI] [PMC free article] [PubMed] [Google Scholar]
- 36.Leu K, Boxerman JL, Cloughesy TF, Lai A, Nghiemphu PL, Liau LM, Pope WB, Ellingson BM (2016) Improved Leakage Correction for Single-Echo Dynamic Susceptibility Contrast Perfusion MRI Estimates of Relative Cerebral Blood Volume in High-Grade Gliomas by Accounting for Bidirectional Contrast Agent Exchange. AJNR Am J Neuroradiol 37 (8):1440–1446. 10.3174/ajnr.A4759 [DOI] [PMC free article] [PubMed] [Google Scholar]
- 37.Yablonskiy DA, Haacke EM (1994) Theory of NMR signal behavior in magnetically inhomogeneous tissues: the static dephasing regime. Magn Reson Med 32 (6):749–763. 10.1002/mrm.1910320610 [DOI] [PubMed] [Google Scholar]
- 38.Goldstein M, Rudra S, Dahiya S, Tsien C, Huang J (2019) Prognostic value of EGFR Amplification in Glioblastoma Patients treated with Radiation Therapy and Concurrent Temozolomide. International Journal of Radiation Oncology• Biology• Physics 105 (1):E98–E99 [Google Scholar]
- 39.Bekaert L, Valable S, Lechapt-Zalcman E, Ponte K, Collet S, Constans JM, Levallet G, Bordji K, Petit E, Branger P, Emery E, Manrique A, Barre L, Bernaudin M, Guillamo JS (2017) [18F]-FMISO PET study of hypoxia in gliomas before surgery: correlation with molecular markers of hypoxia and angiogenesis. Eur J Nucl Med Mol Imaging 44 (8):1383–1392. 10.1007/s00259-017-3677-5 [DOI] [PubMed] [Google Scholar]
- 40.Paech D, Nagel AM, Schultheiss MN, Umathum R, Regnery S, Scherer M, Wick A, Platt T, Wick W, Bendszus M, Unterberg A, Schlemmer HP, Ladd ME, Niesporek SC (2020) Quantitative Dynamic Oxygen 17 MRI at 7.0 T for the Cerebral Oxygen Metabolism in Glioma. Radiology 295 (1):181–189. 10.1148/radiol.2020191711 [DOI] [PubMed] [Google Scholar]
- 41.Snuderl M, Fazlollahi L, Le LP, Nitta M, Zhelyazkova BH, Davidson CJ, Akhavanfard S, Cahill DP, Aldape KD, Betensky RA, Louis DN, Iafrate AJ (2011) Mosaic amplification of multiple receptor tyrosine kinase genes in glioblastoma. Cancer Cell 20 (6):810–817. 10.1016/j.ccr.2011.11.005 [DOI] [PubMed] [Google Scholar]
Associated Data
This section collects any data citations, data availability statements, or supplementary materials included in this article.
Supplementary Materials
Supplemental Figure 1 Quantitative comparison of oxygen-sensitive characteristics between WHO II-III vs. IV gliomas. (A and B) Comparison of median R2’, (C and D) median rCBV, (E and F) median rOEF between WHO grade 2/3 and WHO grade 4 gliomas. (A, C, and E) Tumor region includes contrast enhancing tumor (CET) and non-enhancing tumor (NET) tissue. (B, D, and F) The tumor region includes only NET tissue. “n.s.” refers to no significance or P ≥0.05, while “*” and “**” refer to P <0.05 and <0.01, respectively.
Supplemental Figure 2 Survival curves. Kaplan-Meier plots showing significant difference in overall survival between (A) patients younger than 51 years of age (black) and patients who were 51 or older at the time of the study (red), (B) patients with grade II and III gliomas (black) and patients with grade IV tumors (red), and (C) patients who were off treatment (black) and patients were on active treatment during the time of the study (red). All curves illustrate a significant difference (P < 0.001) in overall survival.