

Abstract
Background
Prone positioning (PP) has been used to improve oxygenation in patients affected by the SARS-CoV-2 disease (COVID-19). Several mechanisms, including lung recruitment and better lung ventilation/perfusion matching, make a relevant rational for using PP. However, not all patients maintain the oxygenation improvement after returning to supine position. Nevertheless, no evidence exists that a sustained oxygenation response after PP is associated to outcome in mechanically ventilated COVID-19 patients. We analyzed data from 191 patients affected by COVID-19-related acute respiratory distress syndrome undergoing PP for clinical reasons. Clinical history, severity scores and respiratory mechanics were analyzed. Patients were classified as responders (≥ median PaO2/FiO2 variation) or non-responders (< median PaO2/FiO2 variation) based on the PaO2/FiO2 percentage change between pre-proning and 1 to 3 h after re-supination in the first prone positioning session. Differences among the groups in physiological variables, complication rates and outcome were evaluated. A competing risk regression analysis was conducted to evaluate if PaO2/FiO2 response after the first pronation cycle was associated to liberation from mechanical ventilation.
Results
The median PaO2/FiO2 variation after the first PP cycle was 49 [19–100%] and no differences were found in demographics, comorbidities, ventilatory treatment and PaO2/FiO2 before PP between responders (96/191) and non-responders (95/191). Despite no differences in ICU length of stay, non-responders had a higher rate of tracheostomy (70.5% vs 47.9, P = 0.008) and mortality (53.7% vs 33.3%, P = 0.006), as compared to responders. Moreover, oxygenation response after the first PP was independently associated to liberation from mechanical ventilation at 28 days and was increasingly higher being higher the oxygenation response to PP.
Conclusions
Sustained oxygenation improvement after first PP session is independently associated to improved survival and reduced duration of mechanical ventilation in critically ill COVID-19 patients.
Supplementary Information
The online version contains supplementary material available at 10.1186/s13613-021-00853-1.
Keywords: COVID19, Prone positioning, Ventilatory free days, ICU
Background
To date, SARS-CoV-2 has infected more that 132 million people of whom more than 2.8 million died worldwide [1]. When the case fatality ratio is not homogeneous across countries, probably depending on the number of tests done, the mortality in patients admitted to the Intensive Care Unit (ICU) is higher than 40% [2] and can reach 73% for patients requiring both mechanical ventilation and dialysis [3]. The pneumonia caused by SARS-CoV-2 (COVID-19), indeed, can lead to severe Acute Respiratory Distress Syndrome (ARDS) requiring invasive mechanical ventilation. COVID-19-related ARDS is associated to a severe impairment of lung ventilation/perfusion matching, resulting from a defect of hypoxic pulmonary vasoconstriction and presence of thrombi in the pulmonary microcirculation, leading to high intra-pulmonary shunt and dead space, respectively [4, 5]. Early prone positioning (PP) has been used in critically ill patients affected by the COVID-19, both in patients receiving invasive mechanical ventilation [6] and in those spontaneously breathing [7]. In non-COVID-19 severe ARDS, PP has an established role [8], as it can improve oxygenation and survival as compared to supine position [9]. The mechanisms by which PP improves oxygenation include the recruitment of atelectatic dorsal lung areas and the redistribution of lung ventilation toward still well perfused areas [10, 11]. Moreover, PP may reduce the lung stress and strain associated with mechanical ventilation, thus decreasing the risk of ventilator-induced lung injury [12].
Though the improvement of oxygenation resulting from PP may be dramatic in some patients, it is not observed in every one of them. The COVID-19-related hypoxemia is, indeed, caused by a combination of several factors, which affect in different ways, making COVID-19 ARDS patients potentially responding differently to PP in terms of oxygenation. Moreover, the relationship between oxygenation response to PP and survival is still an open question, since it has been found either marginally [13] or not associated [14] with survival in patients with non-COVID-19 ARDS. Several evidences exists that in many proned COVID-19 patients, the oxygenation improvement determined by PP is not sustained after re-supination [7, 15, 16]. To date, no evidence exists that a sustained improvement of oxygenation after resupination is associated to patient’s outcome. Therefore, we aimed at further explore whether, in mechanically ventilated COVID-19 patients undergoing PP, an oxygenation improvement to PP sustained after resupination would be associated to patient outcome. To investigate this, we performed a secondary analysis on consecutive mechanically ventilated ARDS COVID-19 patients admitted to 16 Italian ICUs and undergoing PP for clinical decision. We analyzed if the oxygenation variation after the first PP session, as compared to the pre-PP state, could be associated to ICU ventilatory-free days (VFD), ICU mortality and likelihood of liberation from mechanical ventilation assessed at 28 days after ICU admission.
Methods
This is a secondary analysis on patients enrolled in a previous prospective study [17] conducted in 15 ICUs from Italian hospitals between February 22 and May 4, 2020. The data from another ICU obtained after the publication of the first paper were included in present report.
The study was approved by the Institutional Review Board of the study coordinator center (Maggiore Hospital, Bologna, Italy, approval number: 273/2020/OSS/AUSLBO) and by each institutional review committee of the participating hospitals. Informed consent was partially waived according to the approval of the local Ethics committee and analysis was conducted on anonymized individual data. The study was registered in ClinicalTrials.gov (NCT04411459).
Inclusion and exclusion criteria
To be included in the present study patients should be tested positive for SARS-CoV-2 infection (confirmed by real-time reverse transcription-polymerase chain reaction assays), older than 18 years, receive invasive mechanical ventilation, undergo at least one PP session for which PaO2/FiO2 and driving pressure (DP) data were available (Additional file 1: Figure S1) and fulfill the criteria for ARDS, according to the Berlin definition [8]. The single non-inclusion criterion was the use of non-invasive ventilation (NIV) during the entire clinical course.
Data collection and mechanical measurements
Baseline data and patient’s history were collected using an electronic case report form developed by YGHEA, CRO division of Ecol Studio SPA (Bologna Operational Headquarters, Bologna, Italy) and hosted by Actide Nubilaria (Novara, Italy). Collected data included demographic data, clinical symptoms or signs at presentation, underlying comorbidities, laboratory data, chest radiologic reports, respiratory parameters before the intubation and ventilator settings during the first 5 days of mechanical ventilation [e.g., positive end-expiratory pressure (PEEP), plateau pressure (Pplat), static compliance (CRS), PaO2/FiO2 ratio], and clinical outcomes. The PaO2/FiO2 and DP were recorded within 3 h before PP (T1) and from 1 to 3 h after re-supination (T2). DP was computed as Pplat minus total PEEP. DP (DPdiff) and PaO2/FiO2 difference (Pfdiff) were calculated as the difference in DP and in PaO2/FiO2, respectively, between T1 and T2 (T2 minus T1). Both measurements were taken; therefore, in supine position, the duration of the PP session was recorded.
Definitions
Mechanical ventilation was considered invasive if delivered through an endotracheal tube or a tracheostomy cannula. The duration of invasive mechanical ventilation was defined as the time elapsed from intubation to successful extubation or successful permanent disconnection from mechanical ventilation for tracheostomized patients. This latter was considered effective if sustained 24 h per day. Extubation failure was defined as the need for reintubation within 48 h from extubation. VFDs at 28 days were defined as 28 minus the number of days elapsed from the last successful extubation in intubated patients, whether or not NIV was used after extubation. VFDs were defined as zero in patients who died during the 28 days regardless of their extubation status. In tracheostomized patients, intermittent disconnections were not counted and VFDs were defined as 28 minus the number of days from the last successful sustained disconnection from mechanical ventilation. A cut-off of 40 ml/cmH2O was chosen for discriminating between higher and lower CRS as previously suggested [8]. To define responders and non-responders to PP, we evaluated the distribution of PaO2/FiO2 response, calculate as percentage of PaO2/FiO2 change in T2 as compared to T1. Responders were defined as the patients in which the P/F increase in T2 was ≥ of the median population response, while non-responders were those with a percentage P/F change in T2 < median response of the general population.
Statistical analysis
Continuous variables were expressed as median and first-to-third interquartile range (IQR), unless otherwise stated, while categorical variables were expressed as counts and percentage, and compared using Mann–Whitney U test and Chi-square test, respectively. The differences of PaO2/FiO2 ratio and driving pressure before and after pronation between the responders and non-responders [18] groups were analyzed with a general linear model for repeated measures. Correlation between variables was tested using the Pearson R test. Ventilator-free days were expressed as mean ± SD, as suggested by Yehya et al. [19]. The liberation from mechanical ventilation at 28 days after intubation (D0) was analyzed by performing a competing risks regression model on data, according to the method of Fine and Gray [20], with the event death being the competing risk. The response to prone positioning was analyzed as ordinal variable, grouping patients into 4 classes of response based on the quartiles of PaO2/FiO2 response to first PP distribution. Model building was performed by means of a variable selection based on an initial screening using univariate analysis with a P value < 0.2 criterion, then a stepwise selection with entry criterion at P value = 0.05 and stay criterion at P value = 0.1. Estimates of coefficients in the model are reported as sub-hazard ratios (95% confidence intervals (CI). All P values refers to two-tailed tests of significance and P < 0.05 was deemed as the statistically significant threshold. Data were analyzed using SPSS Statistics 26 (IBM SPSS Statistics for Windows, Version 26.0. Armonk, NY: IBM Corp.) and Stata/IC 16 (College Station, Texas, USA). Post-hoc power was calculated on the primary outcome of the study (VFDs) using G*Power 3.1.9.4.
Results
Sample selection
Of the 470 patients in the original database, 313 (66.6%) underwent PP during ICU stay and were screened for eligibility. Complete data on respiratory variables before and after prone positioning were available for 191/313 (61%) patients, who were subsequently considered in the current analysis.
Main characteristics of the sample
The main characteristics of the population are summarized in Table 1. Age was 66 years [59–72], 152 patients (79.6%) were males, SAPS II and SOFA scores at admission were 38 [30–45] and 5 [3–7], respectively. Hypertension was the most common comorbidity (104/191, 54.5%). NIV, continuous positive airway pressure (CPAP) or high flow nasal oxygen (HFNO) were used in most of the patients before intubation and most of them underwent NIV or CPAP for more than 24 h at the time of intubation. PaO2/FiO2 observed before intubation was 94 [76–112] mmHg.
Table 1.
Demographic data and clinical characteristics
| Total population (n = 191) | Responders (n = 96) | Non responders (n = 95) | P | |
|---|---|---|---|---|
| Age—yr | 66 [59–72] | 65 [59–72] | 68 [59–72] | 0.25 |
| Sex—male—no (%) | 152 (79.6) | 75 (78) | 77 (81) | 0.72 |
| BMI | 28 [26–31] | 28 [25–31] | 28 [26–31] | 0.35 |
| SAPS II score | 38 [30–45] | 38[30–46] | 38[30–44] | 0.81 |
| SOFA score | 5 [3–7] | 4 [3–6] | 5 [3–7] | 0.31 |
| Hypertension—no (%) | 104 (54.5) | 50 (52) | 54 (57) | 0.56 |
| Chronic ischemic heart disease—no (%) | 20 (10.5) | 8 (8) | 12 (13) | 0.36 |
| Chronic kidney disease—no (%) | 12 (6.3) | 5 (5.2) | 7 (7.4) | 0.57 |
| Diabetes—no (%) | 46 (24.1) | 22 (22.9) | 24 (25.3) | 0.74 |
| Chronic liver disease (MELD > 10)—n (%) | 3 (1.6) | 1 (1) | 2 (2.1) | 0.62 |
| COPD—no (%) | 14 (7.3) | 8 (8.3) | 6 (6.3) | 0.39 |
| HFNO before intubation—no (%)—183 | 20 (10.9) | 13 (13.5) | 7 (7.4) | 0.24 |
| CPAP/NIV before intubation—no (%) | 127 (70.4) | 60 (62.5) | 67 (70.5) | 0.20 |
| PaO2/FiO2 before intubation—mmHg | 94 [76–112] | 90 [70–113] | 96 [80–110] | 0.50 |
| Tidal volume set—ml/kg IBW | 7.2 [6.6–7.8] | 7.3[6.5–8.1] | 7.1[6.6–7.6] | 0.48 |
| PEEP set—cmH2O | 12 [10–14] | 12 [10–15] | 12 [10–14] | 0.80 |
| Highest Pplata—cmH2O | 25 [23–28] | 25 [22–28] | 26 [24–29] | 0.04 |
| Lowest CRS supinea—ml/cmH2O | 35 [29–41] | 37 [30–43] | 33 [27–40] | 0.005 |
| Lowest PaO2/FiO2a—mmHg | 90 [69—113] | 89 [67—114] | 90 [70—110] | 0.87 |
| Class 3—P/F200—300 (%) | 0 (0) | 0 (0) | 0 (0) | |
| Class 2—P/F 100—200 (%) | 72 (38.8) | 40 (41.7) | 32 (33.7) | |
| Class 1—P/F < 100 (%) | 119 (62.3) | 56 (58.3) | 63 (66.3) | |
| Duration of CPAP/NIV trial before intubation | (n = 127) | (n = 60) | (n = 67) | 0.23 |
| < 12 h—no (%) | 26 (20.5) | 8 (13.3) | 18 (26.9) | |
| 12—24 h—no (%) | 31 (24.4) | 16 (26.7) | 15 (22.4) | |
| 24—48 h—no (%) | 22 (17.3) | 13 (21.7) | 9 (13.4) | |
| > 48 h—no (%) | 48 (37.8) | 23 (38.3) | 25 (37.3) |
Data expressed as median [IQR] or counts (% in group). Comparisons were performed using Mann–Whitney U test or Chi-square test. Significant P values are highlighted in bold
BMI body mass index, SAPS simplified acute physiology score, SOFA sequential organ failure assessment score, COPD chronic obstructive pulmonary disease, CPAP continuous positive airway pressure, MELD model for end-stage liver disease, NIV non-invasive ventilation, PaO2 arterial oxygen partial pressure, FiO2 inspired fraction of oxygen, IBW Ideal Body Weight, PEEP positive end expiratory pressure, Pplat plateau pressure, CRS respiratory system compliance, HFNO high flow nasal oxygen, PP prone position, DP driving pressure
aDuring the first 5 days of ICU stay
Responders and non-responders comparability
The median PaO2/FiO2 improvement after prone positioning was 49% [19–100%]. Responders and non-responders to PP did not show any significant difference in demographic characteristics, chronic disease or ventilatory treatment before the first session of PP and the proportion of male sex was the same in each group (Table 1). No significant difference was found in the duration of PP (Table 2).
Table 2.
Clinical outcomes within the 28 days after inclusion
| Total population (n = 191) | Responders (n = 96) | Non-responders (n = 95) | P | |
|---|---|---|---|---|
| PaO2/FiO2 response to prone positioning (%, mmHg) | 49 [19–100] | 100 [67–155] | 19 [3–31] | < 0.001 |
| Duration of prone positioning (hours) | 16 [16–17] | 16 [16–16.7] | 16 [16–17] | 0.757 |
| Tracheostomy—no (%) | 113 (59.2) | 46 (47.9) | 67 (70.5) | 0.008 |
| Duration of MV, days | 18 [11–28] | 18 [10–27] | 18 [12–29] | 0.432 |
| Attempted extubation—no (%) | 39 (20.4) | 33 (34.3) | 6 (6.3) | < 0.001 |
| Weaning failure—reintubation no (%) | 22 (18.8) | 17 (17.7) | 5 (5.3) | 0.093 |
| VAP—no (%) | 105 (55) | 53 (55.2) | 52 (54.7) | 0.885 |
| Steroid use | 133 (70%) | 72 (75%) | 61 (64%) | 0.083 |
| Non pulmonary infections—no (%) | 72 (37.7) | 37 (38.5) | 35 (36.8) | 0.882 |
| Cardiovascular complications—no (%) | 31 (16.2) | 13 (13.5) | 18 (18.9) | 0.333 |
| Digestive complications—no (%) | 8 (4.2) | 5 (5.2) | 3 (3.2) | 0.721 |
| Neurologic complications—no (%) | 17 (8.9) | 9 (9.4) | 8 (8.4) | 1.000 |
| Renal Replacement therapy—no (%) | 43 (22.5) | 22 (22.9) | 21 (22.1) | 1.000 |
| Veno-venous ECMO—no (%) | 3 (1.6) | 0 (0.0) | 3 (3.2) | 0.121 |
| ICU length of stay, days | 22 [14–35] | 22[15–35] | 21[14–35] | 0.994 |
| VFD at 28 days, days | 4.5 ± 7.1 | 6.3 ± 8.1 | 2.7 ± 5.6 | < 0.001 |
| ICU mortality—no (%) | 83 (43.4) | 32 (33.3) | 51 (53.7) | 0.006 |
Values are median (IQR) except for VFD (Mean ± SD). Significant P values are highlighted in bold
FiO2 inspired fraction of oxygen, CRS respiratory system compliance measured in supine position, PaO2 arterial oxygen partial pressure, MV mechanical ventilation, NIV non-invasive ventilation, CPAP continuous positive airway pressure, HFNO high flow nasal oxygen, VFD ventilator free days, VAP ventilator associated pneumonia, DP driving pressure
Globally, the lowest PaO2/FiO2 ratio observed during the first 5 days of ICU stay was 90 [69–113] and the two groups did not differ either for the lowest PaO2/FiO2 ratio or for the ARDS stage according to the Berlin definition [8]. Non-responders had significantly higher Pplat and lower CRS during the first 5 days of ICU stay.
Before PP, neither the PaO2/FiO2 ratio (responders: 101 [80–127] cmH2O, non-responders: (105 [90–130] cmH2O, P = 0.10) and DP (responders: 13 [10–16] cmH2O, non-responders: (14 [11–16] cmH2O, P = 0.16) were significantly different among groups. After the PP session, PaO2/FiO2 was 210 [161–276] in responders and 127 [100–150] mmHg (P < 0.001) in non-responders and the DP was slightly but significantly lower in responders as compared to non-responders (12 [10–14] vs 13 [11–15] cmH2O, P = 0.003). PFdiff was different between the two groups, as expected by study design, but DPdiff was not (Fig. 1a, b). Moreover, there was no significant correlation between PFdiff and DPdiff (r = − 0.06; P = 0.38, Additional file 2: Figure S2).
Fig. 1.

Physiologic effect of the first prone positioning session and impact on patient outcome. Effect of the first proning session on change in PaO2/FiO2 ratio (a PaO2/FiO2 in after prone position minus PaO2/FiO2 before prone position), change in driving pressure (b driving pressure after prone position minus driving pressure before prone position) and ventilator-free days (c) in responders (blue) and non-responders (grey) patients with acute respiratory distress syndrome related to COVID-19
Clinical outcomes in responders and non-responders
Clinical outcomes and complication rates during ICU stay in the global population and in the two groups are summarized in Table 2. Median duration of invasive mechanical ventilation and ICU length of stay were not significantly different between the groups. In responders, as compared to the non-responders group, the number of VFDs was significantly higher (mean ± SD 6.3 ± 8.1 vs 2.7 ± 5.6 days, P < 0.001) (Fig. 1c), the tracheostomy rate was lower (47.9% vs 70.5% P = 0.008) as well as the ICU mortality (33.3% vs 53.7%, P = 0.006). No differences in the cardiovascular, digestive, neurologic, infective and renal complications were found.
The competing risk regression analysis (Table 3) showed that an increase in PaO2/FiO2 after the first PP session was independently associated with a greater chance of liberation from mechanical ventilation at 28 days together with lower age, higher PaO2/FiO2 ratio during the first 5 days and the absence of renal, pulmonary, neurologic and cardiovascular complications. Specifically, in our population, for each quartile increase in terms of PaO2/FiO2 response the subhazard ratio for being free from invasive mechanical ventilation at 28 day increase of 1.563 (95% CI 1.329—1.838, P < 0.001, Fig. 2).
Table 3.
Competing-risk regression analysis for liberation from mechanical ventilation with death as the competing event
| Variable (reference level) | Univariate analysis | Multivariate analysis | ||||
|---|---|---|---|---|---|---|
| SHR | 95% CI | P | SHR | 95% CI | P | |
| Age | 0.964 | 0.943–0.986 | 0.002 | 0.971 | 0.946–0.996 | 0.025 |
| Sex (male) | 0.679 | 0.305–1.511 | 0.342 | – | ||
| BMI | 1.011 | 0.959–1.065 | 0.689 | – | ||
| SOFA score at admission | 0.865 | 0.770–0.970 | 0.013 | – | ||
| SAPS II score | 0.970 | 0.937–1.004 | 0.076 | – | ||
| Hypertension (yes) | 0.700 | 0.507–0.967 | 0.031 | – | ||
| Chronic ischemic heart disease (yes) | 0.468 | 0.146–1.494 | 0.200 | – | ||
| COPD (oxygen therapy/CPAP) (yes) | 0.845 | 0.208–3.431 | 0.814 | – | ||
| Chronic kidney disease (yes) | 1.216 | 0.281–5.266 | 0.793 | – | ||
| Diabetes (yes) | 0.768 | 0.451–1.310 | 0.333 | – | ||
| Chronic liver disease (MELD > 10) | 1.054 | 0.295–3.765 | 0.936 | – | ||
| Need for renal replacement therapy (yes) | 0.208 | 0.093–0.466 | 0.001 | 0.244 | 0.113–0.526 | < 0.001 |
| Late onset VAP (yes) | 0.290 | 0.174–0.483 | < 0.001 | 0.280 | 0.174–0.450 | < 0.001 |
| CRS < 40 ml/cmH2O in the first 5 days | 1.021 | 0.990–1.053 | 0.195 | – | ||
| Steroid use (yes) | 1.860 | 0.852–4.060 | 0.119 | – | ||
| PaO2/FiO2 variation after pronationb | 1.370 | 1.187–1.582 | < 0.001 | 1.563 | 1.329–1.838 | < 0.001 |
| Cardiovascular complications (yes) | 0.180 | 0.0752–0.433 | < 0.001 | 0.194 | 0.088–0.427 | < 0.001 |
| Neurologic complications (yes) | 0.376 | 0.165–0.856 | 0.020 | 0.296 | 0.110–0.798 | 0.016 |
| Digestive complications (yes) | 0.267 | 0.046–1.583 | 0.146 | – | ||
| Extra-pulmonary infections (yes) | 0.698 | 0.486–1.000 | 0.050 | – | ||
| DP before prone positioning | 0.971 | 0.890–1.058 | 0.500 | – | ||
| ARDS PaO2/FiO2 class (severe)a | 1.775 | 1.143–2.755 | 0.011 | 1.738 | 1.116–2.705 | 0.014 |
| Infection during ICU stay (yes) | 0.698 | 0.486–1.000 | 0.050 | – | ||
Significant P values are highlighted in bold
SHR subdistribution hazard ratio (SHR 1 no association between the covariate and the corresponding cumulative incidence function, SHR > 1 an increase of the covariate value is associated with an increased risk of liberation from mechanical ventilation, SHR < 1 implies the opposite), DP driving pressure, VAP ventilator associated pneumonia, CRS compliance of the respiratory system, BMI Body mass index, COPD chronic obstructive pulmonary disease, CPAP continuous positive airway pressure, ICU intensive care unit
aPer class points increase, class 1 = severe ARDS, class 2 = moderate ARDS. Reference level in branches for each covariate
bPer quartile variation, 1st quartile (< 19%), 2nd quartile (19–49%), 3rd quartile (49–100%), 4th quartile (> 100%)
Fig. 2.
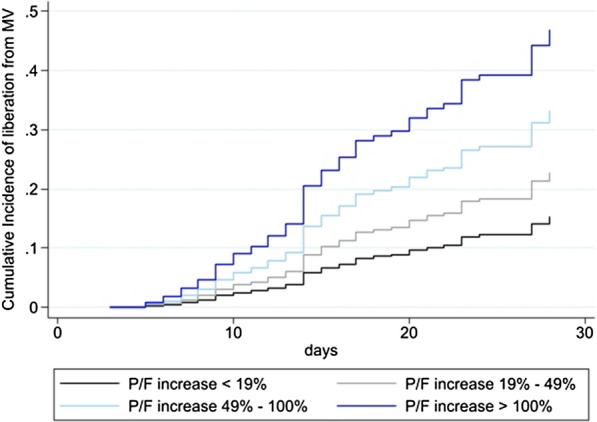
Cumulative incidence of liberation from mechanical ventilation. Cumulative incidence of liberation from mechanical ventilation (MV) over 28 days after intubation. The four curves represent the cumulative incidence functions related to the quartiles of PaO2/FiO2 response to prone positioning referred to the multivariate model (Table 3)
Discussion
In this secondary analysis of critically ill COVID-19 patients we analyzed if the sustained oxygenation improvement after the first PP session could be associated to ICU outcome in terms of time to liberation from mechanical ventilation, complication rates and mortality. We found that, in severe COVID-19-related ARDS, the sustained PaO2/FiO2 improvement after the first prone positioning was progressively related a to lower mechanical ventilation time and ICU mortality.
Severe COVID-19 is characterized by dyspnea, a respiratory rate of 30 or more breaths per minute, a blood oxygen saturation of 93% or less, a PaO2/FiO2 ratio of less than 300 mmHg, or infiltrates in more than 50% of the lung field within 24 to 48 h from the onset of symptoms [21]. PP has been rapidly adopted by intensivists once the first wave spread out to the ICUs worldwide, mainly for its positive effect on arterial oxygen content. This can be consequence of several mechanisms, which are largely dependent on the stage of the disease. Despite its sound physiological basis, PP determines a variable oxygenation response across COVID-19 patients, some improving dramatically oxygenation and others not. Recruitment of dorsal lung regions due to the lung edema shift from vertebral to sternal lung, which, furthermore, continued to receive most pulmonary blood flow (at least in non COVID-19-related ARDS), is the main mechanism thought to be involved in the oxygenation improvement during PP [22]. When this happens, CRS improves, and DP decreases because of the wider surface available for ventilation.
When analyzing the oxygenation in COVID-19 patients returning to supine position after the first PP session, the variable persistence of oxygenation improvement was found both in noninvasively and invasively ventilated patients [7, 15, 16]. However, this finding has never been previously linked with patients’ outcome. We found that the sustained oxygenation improvement after the first PP session was independently associated with a reduced duration of mechanical ventilation and mortality rate.
In a previous study by Lee et al. [23] in non-COVID-19 ARDS, a sustained oxygenation after PP was associated to an improvement of respiratory system mechanics. In their paper, indeed, only responders increase CRS after resupination, while non-responders did not. In our population, responders had a slightly lower DP after PP, but both responders and non-responders had a comparable decrease in DP—and presumably in lung recruitment—after PP. Since the improvement in DP was not different between responders and non-responders, it cannot explain per se why the oxygenation increased only in the responders group.
To support this, a recent work by Haddam et al. found that the gas exchange improvement after PP could not be predicted by the variation of dorsal aeration measured by lung ultrasound [24]. Therefore, several mechanisms, beside lung recruitment, are involved in the PaO2/FiO2 increase following PP in ARDS and this is probably even more true for COVID-19-related ARDS, where the vascular impairment can be responsible for a defective hypoxic pulmonary vasoconstriction [4]. A new CT scan study comparing COVID-19 ARDS to an historical non-COVID ARDS population, found, indeed, that for comparable lung aeration and compliance, COVID-19 ARDS has a significantly higher percentage of hypoxemia [25]. This confirms the hypothesis that COVID-19-related ARDS is a specific “vasocentric” phenotype of ARDS [26]. The oxygenation response to PP may, therefore, be a hint of at partially preserved ventilation/perfusion matching and, therefore, an indirect sign of disease extension. Patients not improving oxygenation after PP may, therefore, highlight an extended damage of both the alveolar and vascular structures. A recent observational study demonstrated that transesophageal echocardiography monitoring is feasible, sensitive and promising in tracking individual hemodynamic response to PP, which may be unpredictably deleterious in some patients [27]. The heterogeneous effect on the right ventricle output may, indeed, help to understand the different responsiveness to PP seen in these patients. Future studies are needed to address this key physiopathological point.
Previous studies in non-COVID ARDS found that an oxygenation improvement after PP was marginally [13] or not associated [14] with mortality. Despite mortality was not the primary outcome of this study, we believe that the association between response to PP and mortality may be a peculiar characteristic of COVID-19-related ARDS and that further studies need to specifically address this point.
Non-responders had a prolonged duration of mechanical ventilation, an increased risk of death and a higher rate of tracheostomy compared to responders. This was not unexpected, since a reduced response to PP was independently associated to a higher risk of prolonged liberation from mechanical ventilation, while no differences were found in the complication rates.
Since the oxygenation response to the first PP can highlight patients at major risk of death, it may be used to inform who may benefit from a further level of assistance. Beside PP, indeed, other interventions can be used to increase oxygenation in COVID-19, like inhaled nitric oxide [5, 28], intravenous Almitrine [29], ECMO [30]. The reduced oxygenation response to PP may be, therefore, helpful to select patients needing alternative ventilatory treatment. Indeed, the only three patients that in our population underwent ECMO were in the non-responders group.
A prolonged time of prone positioning (36 h) was recently suggested to help preserving the oxygenation improvement after resupination [31]. In our population, both responders and non-responders had the same time of PP, but it is worth to explore in future studies if non-responders may need a prolonged session of prone positioning to fully exploit the potential of the maneuver. We found that a sustained oxygenation improvement after prone positioning was associated with better outcome; whether this was linked to a higher organ oxygen delivery, to a different stage of the disease or to a different mechanism linked to PP disease must be explored by future studies. Poor response to prone positioning, moreover, could be potentially used to identify patients that are at higher risk of prolonged weaning and, therefore, modify the policy of tracheostomy, sedation and ventilation. During prone positioning, all patients were paralyzed and ventilated in volume-controlled ventilation. Recent evidence [32] show that spontaneous breathing could be beneficial during prone position and the effect of spontaneous breathing during prone positioning in COVID-19 patients has to be explored. Moreover, despite no differences were found in driving pressure change, PEEP and recruitment may have played a role in some patients. Further studies are needed to assess the impact of PEEP [33], lung recruitment and/or recruitability [34, 35] on PP response.
Our study has several limitations. First, the ventilatory treatment and weaning were not standardized among participating, thus adding potential confounding factors. Second, for many variables, we asked the participating centers to collect the lowest values within the first 5 days of ICU stay, thus possibly missing important data on the precise time course of these variables. Third, several experimental COVID-19 therapies were tested in different centers during the conduction of present study. Forth, we did not evaluate thrombosis among complications, since this parameter can be difficult to be assessed, both for micro and macro thrombosis. Finally, we analyzed the response to the first prone positioning session. Further studies should evaluate if the response to subsequent PP sessions could be useful in predicting outcome. In our analysis, we grouped patients based on the oxygenation response to PP. Before performing the maneuver, no single variable was predictive of the response. Moreover, all patients started PP per clinical decision, and therefore, it is possible to assume that the severity of patients in the groups was the same and this was confirmed by the baseline characteristics of the groups. The only mechanical difference among the two groups in the first 5 days of ICU stay was the lowest Crs, since this was slightly higher in responders. Despite this, in both groups PP was decided on oxygenation and not on respiratory mechanics. Post-hoc power analysis revealed that the primary outcome (VFDs) had a power of 0.92, meaning that there is an 92% chance of detecting a difference as statistically significant, if in fact a true difference exists.
Conclusions
A sustained oxygenation response after the first PP session in COVID-19 ARDS patients is an independent predictor of prolonged liberation from mechanical ventilation and ICU survival. Oxygenation improvement to PP is not related to improvement in DP. Further studies are needed to evaluate if the oxygenation response to PP can be used in the decision-making process in severe mechanically ventilated COVID-19 patients.
Supplementary Information
Additional file 1: Fig. S1. Flow chart of data analysis.
Additional file 2: Fig. S2. Correlation between PaO2/FiO2 difference (PFdiff, after minus before prone position) and driving pressure difference (DPdiff, after minus before prone position). Pearson R correlation in the entire population.
Additional file 3. ICU-RER collaborators list.
Acknowledgements
All the authors and collaborators are deeply grateful to all the ICU staff that participated to patient’s care during the pandemic. Their hard work will not be forgotten.
Marco Tartaglione, Valentina Chiarini, Virginia Buldini, Carlo Coniglio, Federico Moro, Clara Barbalace, Mario Citino, Nicola Cilloni, Lorenzo Giuntoli, Angela Bellocchio, Emanuele Matteo, Giacinto Pizzilli, Antonio Siniscalchi, Chiara Tartivita, Francesco Matteo, Annalisa Marchio, Igor Bacchilega, Laura Bernabé, Sonia Guarino, Elena Mosconi, Luca Bissoni, Lorenzo Viola, Tommaso Meconi, Vittorio Pavoni, Aline Pagni, PatriziaPompa Cleta, Marco Cavagnino, Anna Malfatto, Angelina Adduci, Silvia Pareschi, Gabriele Melegari, Jessica Maccieri, Elisa Marinangeli, Fabrizio Racca, Marco Verri, Giulia Falò, Elisabetta Marangoni, Francesco Boni, Giulia Felloni, FedericoDomenico Baccarini, Marina Terzitta, Stefano Maitan, Filippo Becherucci, Maddalena Parise, Francesca Masoni, Michele Imbriani, Paolo Orlandi, Francesco Monetti, Giorgia Dalpiaz, Rita Golfieri, Federica Ciccarese, Antonio Poerio, Francesco Muratore, Fabio Ferrari, Martina Mughetti, Loredana Franchini, Ersenad Neziri, Marco Miceli, MariaTeresa Minguzzi, Lorenzo Mellini, Sara Piciucchi, Maurizio Bartolucci.
Abbreviations
- ARDS
Acute respiratory distress syndrome
- COVID-19
Coronavirus 19 disease
- CPAP
Continuous positive airway pressure
- Crs
Respiratory system compliance
- DP
Driving pressure
- DPdiff
Driving pressure difference
- ECMO
Extra-corporeal membrane oxygenation
- FiO2
Inspired oxygen fraction
- HFNO
High flow nasal cannula
- ICU
Intensive care unit
- IQR
Interquartile range
- NIV
Non-invasive ventilation
- PaO2
Partial arterial oxygen content
- PEEP
Positive end-expiratory pressure
- PFdiff
P/F difference
- PP
Prone positioning
- Pplat
Plateau pressure
- SAPS
Simplified acute physiology score
- SD
Standard deviation
- SOFA
Sequential organ failure assessment
- VA⁄Q ˙
Ventilation/perfusion
- VFD
Ventilatory free days
Authors’ contributions
GS, LG and SS, conceived the study and coordinated the data analysis and manuscript production. MLBR, LG and GS conducted data analysis and checked data for conformity. IO, TT, CAM, CC, EG, EB, AC, IC, DC FC, FD, MF, EG, GG, CL, MCL, ML, AM, GN, RP, AP, ER, ST participated to data collection and to database creation. GS, LG, SS, and CG interpreted the data and wrote the manuscript’s draft. VMR, CAV, and all authors contributed to the manuscript critical review and to data interpretation. All authors read and approved the final manuscript. All authors had full access to all the data in the study and accept responsibility to submit for publication.
Funding
No funding.
Availability of data and materials
On reasonable request.
Declarations
Ethics approval and consent to participate
The study was approved by the Institutional Review Board of the study coordinator center (Maggiore Hospital, Bologna, Italy, approval number: 273/2020/OSS/AUSLBO) and by each institutional review committee of the participating hospitals. Informed consent was partially waived according to the approval of the local Ethics committee and analysis was conducted on anonymized individual data. The study was registered in ClinicalTrials.gov (NCT04411459).
Consent for publication
Not applicable.
Competing interests
GS received a grant from the Italian society of anesthesia (SIAARTI) and a travel grant from PLUG group (ESICM 2019) not related to the current analysis.
Footnotes
Publisher's Note
Springer Nature remains neutral with regard to jurisdictional claims in published maps and institutional affiliations.
Contributor Information
Savino Spadaro, Email: spdsvn@unife.it.
The ICU-RER COVID-19 Collaboration:
Marco Tartaglione, Valentina Chiarini, Virginia Buldini, Carlo Coniglio, Federico Moro, Clara Barbalace, Mario Citino, Nicola Cilloni, Lorenzo Giuntoli, Angela Bellocchio, Emanuele Matteo, Giacinto Pizzilli, Antonio Siniscalchi, Chiara Tartivita, Francesco Matteo, Annalisa Marchio, Igor Bacchilega, Laura Bernabé, Sonia Guarino, Elena Mosconi, Luca Bissoni, Lorenzo Viola, Tommaso Meconi, Vittorio Pavoni, Aline Pagni, Patrizia Pompa Cleta, Marco Cavagnino, Anna Malfatto, Angelina Adduci, Silvia Pareschi, Gabriele Melegari, Jessica Maccieri, Elisa Marinangeli, Fabrizio Racca, Marco Verri, Giulia Falò, Elisabetta Marangoni, Francesco Boni, Giulia Felloni, Federico Domenico Baccarini, Marina Terzitta, Stefano Maitan, Filippo Becherucci, Maddalena Parise, Francesca Masoni, Michele Imbriani, Paolo Orlandi, Francesco Monetti, Giorgia Dalpiaz, Rita Golfieri, Federica Ciccarese, Antonio Poerio, Francesco Muratore, Fabio Ferrari, Martina Mughetti, Loredana Franchini, Ersenad Neziri, Marco Miceli, Maria Teresa Minguzzi, Lorenzo Mellini, Sara Piciucchi, and Maurizio Bartolucci
References
- 1.COVID-19 Map. Johns Hopkins Coronavirus. Resour Cent. 2021. https://coronavirus.jhu.edu/map.html. Accessed 7 Apr 2021.
- 2.Grasselli G, Greco M, Zanella A, et al. Risk factors associated with mortality among patients with COVID-19 in intensive care units in Lombardy, Italy. JAMA Intern Med. 2020;180:1345–1355. doi: 10.1001/jamainternmed.2020.3539. [DOI] [PMC free article] [PubMed] [Google Scholar]
- 3.Karagiannidis C, Mostert C, Hentschker C, et al. Case characteristics, resource use, and outcomes of 10 021 patients with COVID-19 admitted to 920 German hospitals: an observational study. Lancet Respir Med. 2020;8:853–862. doi: 10.1016/S2213-2600(20)30316-7. [DOI] [PMC free article] [PubMed] [Google Scholar]
- 4.Gattinoni L, Coppola S, Cressoni M, Busana M, Rossi S, Chiumello D. COVID-19 does not lead to a “typical” acute respiratory distress syndrome. Am J Respir Crit Care Med. 2020;201:1299–1300. doi: 10.1164/rccm.202003-0817LE. [DOI] [PMC free article] [PubMed] [Google Scholar]
- 5.Hedenstierna G, Chen L, Hedenstierna M, Scaramuzzo G. Treatment of COVID-19 by inhaled NO to reduce shunt? Am J Respir Crit Care Med. 2020;202:618. doi: 10.1164/rccm.202004-0940LE. [DOI] [PMC free article] [PubMed] [Google Scholar]
- 6.Zang X, Wang Q, Zhou H, Liu S, Xue X, COVID-19 Early Prone Position Study Group Efficacy of early prone position for COVID-19 patients with severe hypoxia: a single-center prospective cohort study. Intensive Care Med. 2020 doi: 10.1007/s00134-020-06182-4. [DOI] [PMC free article] [PubMed] [Google Scholar]
- 7.Coppo A, Bellani G, Winterton D, et al. Feasibility and physiological effects of prone positioning in non-intubated patients with acute respiratory failure due to COVID-19 (PRON-COVID): a prospective cohort study. Lancet Respir Med. 2020;8:765–774. doi: 10.1016/S2213-2600(20)30268-X. [DOI] [PMC free article] [PubMed] [Google Scholar]
- 8.ARDS Definition Task Force. Ranieri VM, Rubenfeld GD, et al. Acute respiratory distress syndrome: the Berlin definition. JAMA. 2012;307:2526–2533. doi: 10.1001/jama.2012.5669. [DOI] [PubMed] [Google Scholar]
- 9.Guérin C, Reignier J, Richard J-C, et al. Prone positioning in severe acute respiratory distress syndrome. N Engl J Med. 2013;368:2159–2168. doi: 10.1056/NEJMoa1214103. [DOI] [PubMed] [Google Scholar]
- 10.Gattinoni L, Carlesso E, Taccone P, Polli F, Guérin C, Mancebo J. Prone positioning improves survival in severe ARDS: a pathophysiologic review and individual patient meta-analysis. Minerva Anestesiol. 2010;76:448–454. [PubMed] [Google Scholar]
- 11.Sud S, Friedrich JO, Adhikari NK, et al. Comparative Effectiveness of Protective Ventilation Strategies for Moderate and Severe ARDS: Network Meta-Analysis. Am J Respir Crit Care Med. 2021 doi: 10.1164/rccm.202008-3039OC. [DOI] [PubMed] [Google Scholar]
- 12.Scaramuzzo G, Ball L, Pino F, et al. Influence of positive end-expiratory pressure titration on the effects of pronation in acute respiratory distress syndrome: a comprehensive experimental study. Front Physiol. 2020;11:179. doi: 10.3389/fphys.2020.00179. [DOI] [PMC free article] [PubMed] [Google Scholar]
- 13.Protti A, Chiumello D, Cressoni M, et al. Relationship between gas exchange response to prone position and lung recruitability during acute respiratory failure. Intensive Care Med. 2009;35:1011–1017. doi: 10.1007/s00134-009-1411-x. [DOI] [PubMed] [Google Scholar]
- 14.Albert RK, Keniston A, Baboi L, Ayzac L, Guérin C. Prone position–induced improvement in gas exchange does not predict improved survival in the acute respiratory distress syndrome. Am J Respir Crit Care Med. 2014;189:494–496. doi: 10.1164/rccm.201311-2056LE. [DOI] [PubMed] [Google Scholar]
- 15.Sartini C, Tresoldi M, Scarpellini P, et al. Respiratory parameters in patients with COVID-19 after using noninvasive ventilation in the prone position outside the intensive care unit. JAMA. 2020;323:2338–2340. doi: 10.1001/jama.2020.7861. [DOI] [PMC free article] [PubMed] [Google Scholar]
- 16.Elharrar X, Trigui Y, Dols A-M, et al. Use of prone positioning in nonintubated patients with COVID-19 and hypoxemic acute respiratory failure. JAMA. 2020;323:2336–2338. doi: 10.1001/jama.2020.8255. [DOI] [PMC free article] [PubMed] [Google Scholar]
- 17.Gamberini L, Tonetti T, Spadaro S, et al. Factors influencing liberation from mechanical ventilation in coronavirus disease 2019: multicenter observational study in fifteen Italian ICUs. J Intensive Care. 2020;8:80. doi: 10.1186/s40560-020-00499-4. [DOI] [PMC free article] [PubMed] [Google Scholar]
- 18.Grasso S, Mascia L, Del Turco M, et al. Effects of recruiting maneuvers in patients with acute respiratory distress syndrome ventilated with protective ventilatory strategy. Anesthesiology. 2002;96:795–802. doi: 10.1097/00000542-200204000-00005. [DOI] [PubMed] [Google Scholar]
- 19.Yehya N, Harhay MO, Curley MAQ, Schoenfeld DA, Reeder RW. Reappraisal of ventilator-free days in critical care research. Am J Respir Crit Care Med. 2019;200:828–836. doi: 10.1164/rccm.201810-2050CP. [DOI] [PMC free article] [PubMed] [Google Scholar]
- 20.Fine JP, Gray RJ. A Proportional hazards model for the subdistribution of a competing risk. J Am Stat Assoc. 1999;94:496–509. doi: 10.1080/01621459.1999.10474144. [DOI] [Google Scholar]
- 21.Berlin DA, Gulick RM, Martinez FJ. Severe Covid-19. N Engl J Med. 2020 doi: 10.1056/NEJMcp2009575. [DOI] [PubMed] [Google Scholar]
- 22.Gattinoni L, Taccone P, Carlesso E, Marini JJ. Prone position in acute respiratory distress syndrome. Rationale, indications, and limits. Am J Respir Crit Care Med. 2013;188:1286–1293. doi: 10.1164/rccm.201308-1532CI. [DOI] [PubMed] [Google Scholar]
- 23.Lee HY, Cho J, Kwak N, et al. Improved oxygenation after prone positioning may be a predictor of survival in patients with acute respiratory distress syndrome. Crit Care Med. 2020 doi: 10.1097/CCM.0000000000004611. [DOI] [PubMed] [Google Scholar]
- 24.Haddam M, Zieleskiewicz L, Perbet S, et al. Lung ultrasonography for assessment of oxygenation response to prone position ventilation in ARDS. Intensive Care Med. 2016;42:1546–1556. doi: 10.1007/s00134-016-4411-7. [DOI] [PubMed] [Google Scholar]
- 25.Chiumello D, Busana M, Coppola S, et al. Physiological and quantitative CT-scan characterization of COVID-19 and typical ARDS: a matched cohort study. Intensive Care Med. 2020;46:2187–2196. doi: 10.1007/s00134-020-06281-2. [DOI] [PMC free article] [PubMed] [Google Scholar]
- 26.Goligher EC, Ranieri VM, Slutsky AS. Is severe COVID-19 pneumonia a typical or atypical form of ARDS? And does it matter? Intensive Care Med. 2020 doi: 10.1007/s00134-020-06320-y. [DOI] [PMC free article] [PubMed] [Google Scholar]
- 27.Evrard B, Goudelin M, Fedou AL, et al. Hemodynamic response to prone ventilation in COVID-19 patients assessed with 3D transesophageal echocardiography. Intensive Care Med. 2020;46:2099–2101. doi: 10.1007/s00134-020-06217-w. [DOI] [PMC free article] [PubMed] [Google Scholar]
- 28.Alvarez RA, Berra L, Gladwin MT. Home nitric oxide therapy for COVID-19. Am J Respir Crit Care Med. 2020;202:16–20. doi: 10.1164/rccm.202005-1906ED. [DOI] [PMC free article] [PubMed] [Google Scholar]
- 29.Losser M-R, Lapoix C, Delannoy M, Champigneulle B, Payen D. Almitrine as a non-ventilatory strategy to improve intrapulmonary shunt in COVID-19 patients. Anaesth Crit Care Pain Med. 2020;39:467–469. doi: 10.1016/j.accpm.2020.05.013. [DOI] [PMC free article] [PubMed] [Google Scholar]
- 30.Barbaro RP, MacLaren G, Boonstra PS, et al. Extracorporeal membrane oxygenation support in COVID-19: an international cohort study of the Extracorporeal Life Support Organization registry. Lancet Lond Engl. 2020;396:1071–1078. doi: 10.1016/S0140-6736(20)32008-0. [DOI] [PMC free article] [PubMed] [Google Scholar]
- 31.Carsetti A, Paciarini A, Marini B, et al. Prolonged prone position ventilation for SARS-CoV-2 patients is feasible and effective. Crit Care. 2020;24:225. doi: 10.1186/s13054-020-02956-w. [DOI] [PMC free article] [PubMed] [Google Scholar]
- 32.Yoshida T, Tanaka A, Roldan R, Quispe R, Taenaka H, Uchiyama A, Fujino Y. Prone position reduces spontaneous inspiratory effort in patients with acute respiratory distress syndrome: a bi-center study. Am J Respir Crit Care Med. 2021 doi: 10.1164/rccm.202012-4509LE. [DOI] [PubMed] [Google Scholar]
- 33.Katira BH, Osada K, Engelberts D, Bastia L, Damiani LF, Li X, et al. Positive end-expiratory pressure, pleural pressure, and regional compliance during pronation: an experimental study. Am J Respir Crit Care Med. 2021 doi: 10.1164/rccm.202007-2957OC. [DOI] [PubMed] [Google Scholar]
- 34.Chen L, Del Sorbo L, Grieco DL, Junhasavasdikul D, Rittayamai N, Soliman I, et al. Potential for lung recruitment estimated by the recruitment-to-inflation ratio in acute respiratory distress syndrome. A clinical trial. Am J Respir Crit Care Med. 2020;201:178–187. doi: 10.1164/rccm.201902-0334OC. [DOI] [PubMed] [Google Scholar]
- 35.Scaramuzzo G, Spadaro S, Dalla Corte F, Waldmann AD, Böhm SH, Ragazzi R, et al. Personalized positive end-expiratory pressure in acute respiratory distress syndrome: comparison between optimal distribution of regional ventilation and positive transpulmonary pressure. Crit Care Med. 2020;48:1148–1156. doi: 10.1097/CCM.0000000000004439. [DOI] [PubMed] [Google Scholar]
Associated Data
This section collects any data citations, data availability statements, or supplementary materials included in this article.
Supplementary Materials
Additional file 1: Fig. S1. Flow chart of data analysis.
Additional file 2: Fig. S2. Correlation between PaO2/FiO2 difference (PFdiff, after minus before prone position) and driving pressure difference (DPdiff, after minus before prone position). Pearson R correlation in the entire population.
Additional file 3. ICU-RER collaborators list.
Data Availability Statement
On reasonable request.