Abstract
Paper-based visual analogue scale (VAS) items were developed 100 years ago. Although they gained great popularity in clinical and medical research for assessing pain, they have been scarcely applied in other areas of psychological research for several decades. However, since the beginning of digitization, VAS have attracted growing interest among researchers for carrying out computerized and paper-based data assessments. In the present study, we investigated the research question “Which different design characteristics of paper-based VAS items are preferred by women and men?” Based on a sample of 115 participants (68 female), our results revealed that the respondents preferred a paper-based VAS item with a horizontal, 8-cm long, 3 DTP (“desktop publishing point”) wide, black line, with flat line endpoints, and the ascending numerical anchors “0” and “10”, both for women and men. Although we did not identify any gender difference in these characteristics, our findings uncovered clear preferences on how to design paper-based VAS items.
Keywords: visual analogue scale items, VAS, paper-based, item design, gender
In psychological research, one of the most important problems is to quantify latent and subjective inner psychological processes, mental health states, quality of life, preferences, attitudes, or opinions, which cannot be observed or assessed by ordinary physiological measures. This requires responsive psychological tools with satisfying psychometric properties for consecutive statistical analyses. In practice, one approach is that participants answer questions, called items, which refer to a certain underlying psychological concept, construct, paradigm, or universe. In a clinical psychological context, such items may be used to measure intervention- or treatment-induced changes in perceptions and feelings of various aspects of psychological pain and suffering. This may improve the level of understanding of a certain psychological process or mental health state, which may influence patient compliance as well as any ongoing psychological treatment positively.
Hayes and Patterson (1921) first introduced paper-based visual analogue scale (VAS) items to psychological research, followed by Freyd (1923), who initiated the development of graphic rating scales (GRS). GRS are designed as VAS items, but with additional ranked verbal descriptions along the line and between the endpoint labels. They define VAS and GRS as simple, self-explanatory, concrete, and precise scales on which respondents can make continuous classifications freed from quantitative terms. Freyd (1923) suggests not wording extreme endpoint labels in such a way that they will never be used. The VAS item does not provide any additional numbers along its line to produce a smooth response distribution (McDowell, 2006).
A paper-based VAS item is constructed as a unidimensional measure (also referred to as monopolar scale) of a latent construct with a straight horizontal or a vertical line. The line represents a linear continuum or continuous spectrum of a specific psychological process, state of mental health, preference, or attitude on a certain topic. Additionally, they are designed with verbal endpoint labels and numerical anchors at the beginning and the end of the line, respectively (e.g., “I fully disagree” or “extremely low” with “0”; “I fully agree” or “extremely high” with “10”, which define the extremes).
The horizontal format of VAS items has been reported as slightly easier to administer (McCormack et al., 1988) and to save space on a page (McDowell, 2006). Moreover, the horizontal format yielded superior results for statistical distributional properties such as normality and homoscedasticity (Ogon et al., 1996; Sriwatanakul et al., 1983).
In contrast, the EuroQol, a cross-European Quality of Life Scale (Brooks, 1996; EuroQol Group, 1990), in which five items with three category levels are accompanied by a large vertical VAS item (depicted as a thermometer for the measurement of personal health ranging from 0 to 100) was reported as easier to administer than in a horizontal format. A similar finding was identified among Chinese patients, who preferred vertically oriented VAS items when they were asked to state their perceptions of postoperative pain (Aun et al., 1986). This finding can be easily explained, because Chinese text is traditionally written in vertical columns.
However, in studies in which horizontally and vertically oriented VAS items have been directly compared, high correlations were found between both formats (ranging from r = .89–.99; Downie et al., 1978; Scott & Huskisson, 1979).
During the data collection process, the respondent is asked to set a vertical mark (i.e., drawing a vertical line crossing the horizontal VAS item) precisely at the position or magnitude of the subjectively experienced intensity or preference for the queried phenomenon. The distance of this mark from the origin (e.g., often “0” or “1”) is measured to determine the examinee’s self-reported magnitude of preferences, attitudes, or strength of symptoms. VAS items are sometimes constructed with a checkbox (e.g., “I do not know”) to provide the respondent with the option to mark it, in case she or he faces difficulties when answering the VAS item (Treiblmaier & Filzmoser, 2009). The text or statement related to the item is usually presented to the left and before the VAS item, whereas a checkbox (if any) is provided right next to the horizontal line.
VAS items are usually constructed as a straight line with a length of 100 mm. This facilitates to record the responses, which are often provided with a range from 0 to 100 or from 0.0 to 10.0, wherefore the 10-cm-line seems the most appropriate (Seymour et al., 1985). A comparison of 5-, 10-, 15-, and 25-cm VAS items revealed less reliable results for the 5-cm line (Revill et al., 1976), while different equidistant scoring has also been investigated for ranges from 0 to 75, 0 to 120, and 0 to 200 (Aitken, 1969; Flaherty, 1996; Jaeschke et al., 1990; McCormack et al., 1988; McGuire, 1984; Solomon, 1989; Svensson, 2000). Another example is the Health Assessment Questionnaire, which comprises two 15-cm horizontal VAS items for the assessment of global pain and global health with the endpoint labels “No Pain” and “Very Severe Pain”, and “Very Well” and “Very Poor”, respectively (Bruce & Fries, 2005). It has to be mentioned that the length of a VAS item is rather unimportant in settings of computerized data assessments on the screen (e.g., computer, tablet, smartphone), where the size of the displayed content often can be altered according to the needs of the respondents. However, if this design characteristic is of importance to be investigated, zooming in and out must be disabled.
Ordinal, Quasi-Metric and Interval Scale Data
In the past few decades, dichotomous items, Likert-type items (verbally coded 5-, 6-, or 7-point items) as well as traditional rating scale items (3- to 11-point items, sometimes with verbal coding only at the extremes), have been overwhelmingly used in questionnaires in social and behavioral sciences. In these, the respondents are forced to decide between ranked categories, which are sometimes unambiguously labeled. This yields quantitative, but ranked data. In contrast, VAS items are smooth and theoretically offer infinite gradations between the two endpoints, which enables data collection on a higher level of measurement, such as an interval or ratio scale (i.e., metric [or continuous] data), as long as respondents subjectively perceive the equal distances on the line in precisely the same way (e.g., between “0 and 1” and “9 and 10”). Additionally, they allow participants to state the individual level of agreement or disagreement precisely, intuitively, and freely according to their preferences, attitudes, opinions, and feelings.
In numerous psychology questionnaires, composite measures constituted by subsets of several items on a specific area or topic, are thought to measure complex concepts more precisely than a single item. Some researchers assume if composite or sum scores are calculated (i.e., aggregated across items) this may be “perfectly appropriate, therefore, to sum Likert items and analyse the summations parametrically, both univariately and multivariately” (Carifio & Perla, 2008, p. 1151). It seems that this practice somehow magically transforms ordinal data into quasi-metric, quasi-continuous, pseudo-metric, or quasi-interval data. In addition, some argue that if item-response analyses are performed on composite scores, data collected via an ordinal scale can be directly transformed into continuous-level scale data (Wetzel & Greiff, 2018). Hence, this quasi-metric assumption acts as a convenient point of access to the parametric statistical data analyses that have been carried out in the overwhelming majority of studies in the social and behavioral sciences in the past. There has been a long and controversial debate on this issue (Carifio & Perla, 2008; Jamieson, 2004; Pell, 2005).
There is a consensus that data gathered via VAS items allow the application of more sophisticated parametric statistical procedures without undermining the validity of the statistical analysis of interest (Aitken, 1969; Reips & Funke, 2008; Siegel, 1956). Additionally, good psychometric properties have been shown for VAS items as they can be considered as linear, for example, when participants had to rate their pain and later re-rate the pain for whether it had doubled or halved (Hofmans & Theuns, 2008; Myles et al., 1999; Myles & Urquhart, 2005). Moreover, evidence was found that VAS items are sensitive tools (Abend et al., 2014; Rausch & Zehetleitner, 2014), whereas category scales which only provided discrete scores to respondents were suspected of not showing the nuances of feelings (Aitken, 1969).
The Present Study
It is important to focus on how paper-based VAS items should be designed and presented to women and men. This enables more sensitive responses of participants to a psychological construct to represent the intraindividual preferences and feelings more precisely. However, to date, there exists no study on different paper-based VAS item design characteristics that also focuses on potential gender differences. Consequently, in the present study, we investigated the following research question: Which fine granular different characteristics of a paper-based VAS item design (e.g., line thickness, length, design of the endpoints, numerical anchors, color, and orientation) are preferred by women and men, respectively?
Method
Participants
In total, 115 participants (68 female, 47 male; response rate 100%) between 18 and 36 years completed our questionnaire. All respondents had normal or corrected-to-normal vision, were fluent in German, the language in which the questionnaire was provided, consumed no alcohol or drugs, and reported no diagnosis of a psychiatric or neurological disorder. All participants reported no problems when asked if they faced any difficulties with eye-hand coordination while responding to the questionnaire. The age distribution across gender was similar (women: M = 21.07 years, SD = 3.19 years; men: M = 21.81 years, SD = 2.96 years; p = .061). Furthermore, no relevant differences regarding the need of a visual aid (women: 48.5%, men: 34.0%, p = .131), actually wearing a visual aid (women: 37.9%, men: 33.3%, p = .690), or right hand as the dominant hand (women: 92.6%, men: 93.6%, p > .999) could be observed. The ethnic composition was 98% White and 2% Black.
Sampling Procedure
The study was conducted in accordance with the Declaration of Helsinki as well as the General Data Protection Regulation of the European Union. Additionally, it was approved by the ethics committee of Philipps University of Marburg (Approval number: 72/17). All participants provided their written informed consent prior to participation in the study. The participants were either recruited at Philipps University of Marburg through personal invitation or by invitations sent via an institutional e-mail. The sample consisted of university students enrolled in undergraduate courses from Philipps University of Marburg. Participants did not receive financial compensation but were invited to provide their email address if they were interested in the overall results of the study.
Design of the Study Setting
We carried out a cross-sectional questionnaire study, with a particular focus on the independent variable of gender (women or men). Additionally, we assessed visual impairment (yes or no) and handedness (right or left). Due to the fact, that visual impairment (but with a corrected-to-normal vision) and handedness revealed highly unequal sample cell sizes, we did not distinguish between these subgroups when performing the statistical analyses. Hence, for example, we did not split the sample into a group of participants with normal vision compared to the the group of participants with a corrected-to-normal vision. However, we also investigated the dependent variables, such as the subjects’ ratings ranging from 0 to 100 points for each different modality of a paper-based VAS design format.
Materials
We developed a questionnaire based on comprehensive literature research on a variety of existing types of paper-based VAS item design modalities. The questionnaire comprises numerous variations of VAS items characteristics. We supplied the questionnaire, the data set (.sav and .csv), and additional tables of the pilot and the main study on PsychArchives: (http://dx.doi.org/10.23668/psycharchives.3151 and on OSF: https://osf.io/3p8gy/; all materials submitted for review).
Procedure
Pilot Study
We conducted a small pilot study (25 participants) to assess five item design characteristics (e.g., line length, type of line endpoints, order of scale endpoints, preferred color, and line orientation). Because literature suggested a black, 10-cm long, horizontal line, we designed the first VAS items for the questionnaire of the pilot study based on this knowledge (Seymour et al., 1985). Since the results of this additional study confirmed our initial paper-based VAS item design (i.e., a horizontal, black, 10-cm long line with flat endpoints, and ascending order of scale endpoints), we applied the same characteristics in the questionnaire of the main study, with the two additional design characteristics (a) line width and (b) different scale ranges. The procedure for the data assessment for the pilot and the main study was identical.
Main Study
The data assessment was carried out at Philipps University of Marburg. Before the beginning of the study, a standardized, textual introduction was read aloud to the participants informing them about the objectives of the study. This familiarized them with the different types of paper-based VAS items as well as with the terminology used in the questionnaire. After this introduction, a written summary about the study and an information sheet on informed consent were handed out. They were explicitly informed that participation in this study was voluntary and could be stopped at any time without any consequences. All subjects signed the information sheet on informed consent, and all of them completed the questionnaire. The participants were allowed to ask questions at any stage during the study, which were all answered. During the preference elicitation task, the respondents assigned 0 to 100 points to each paper-based VAS design modality, which were presented in the predetermined order (cf. the supplied questionnaire on PsychArchives: http://dx.doi.org/10.23668/psycharchives.3151 and on OSF: https://osf.io/3p8gy/). The participants were instructed not to assign multiple times the same amount of points (e.g., 100 points could be assigned only to the most preferred design modality, etc.). On completion, everyone received a sheet as take-home-message with a summary about the study and the contact details of the examiner in case any questions arose later on. Finally, all subjects were thanked for their time and participation. The entire study duration ranged from 15 to 30 minutes for each participant. All data for this study were collected anonymously.
Statistical Analysis
All the parameters evaluated are presented in tables and figures, if appropriate 95% confidence intervals (CIs) for the mean are additionally presented. The independent two-sample t test was used to compare continuous normally distributed parameters with variance homogeneity regarding the independent variable gender. In the case of variance heterogeneity, Welch’s t test was used. The Mann-Whitney U test was used to compare nonnormally distributed (verification with the Kolmogorov-Smirnov test with Lilliefors’s correction) or ordinal parameters. Fisher’s exact test was used to compare dichotomous categorical data regarding gender. The type I error rate was set to 5%. Therefore, the results of the inferential statistics are descriptive only. Statistical analyses were carried out using the open-source statistical software package R, Version 3.6.1 (R Foundation for Statistical Computing, Vienna, Austria).
Results
The participants scored their preference for a specific paper-based VAS item design modality on a range from 0 to 100 points (higher points indicating greater preference). Detailed information on the results is given in Figures 1 to 7.
Figure 1.

Preferred VAS item design: A horizontal, black line width 3 DTP points, line length 8 cm, and flat line endpoints.
Note. VAS = visual analogue scales; DTP = desktop publishing point.
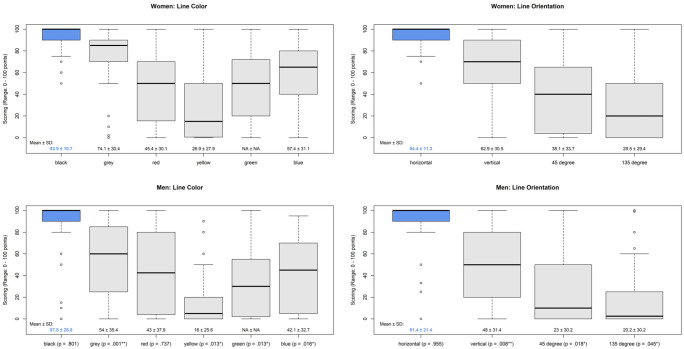
Figure 7.
Line color and line orientation: Women and men (compare questionnaire on PsychArchives and on OSF).
Preferred Visual Analogue Scale Item Design
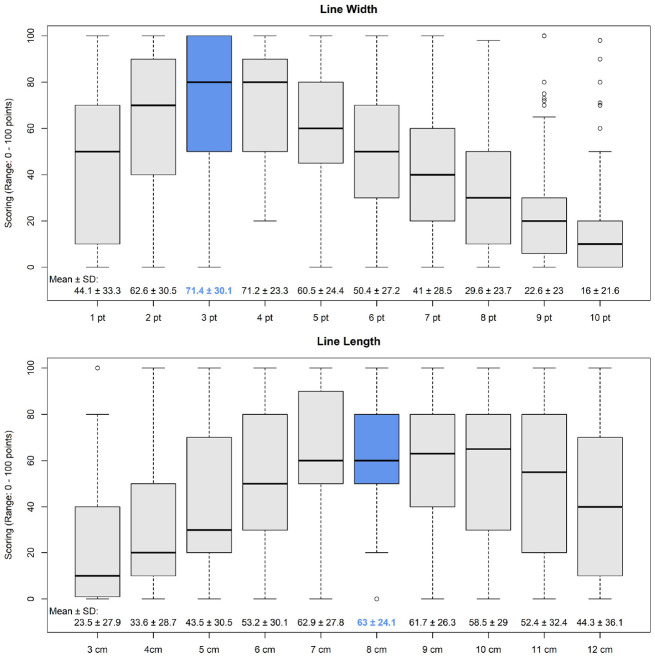
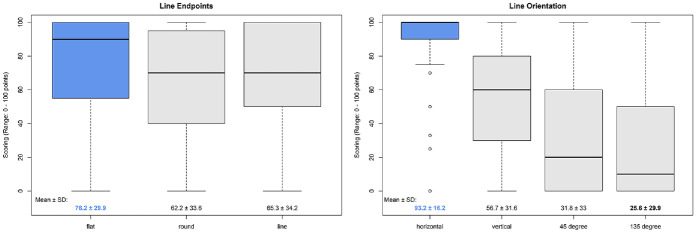
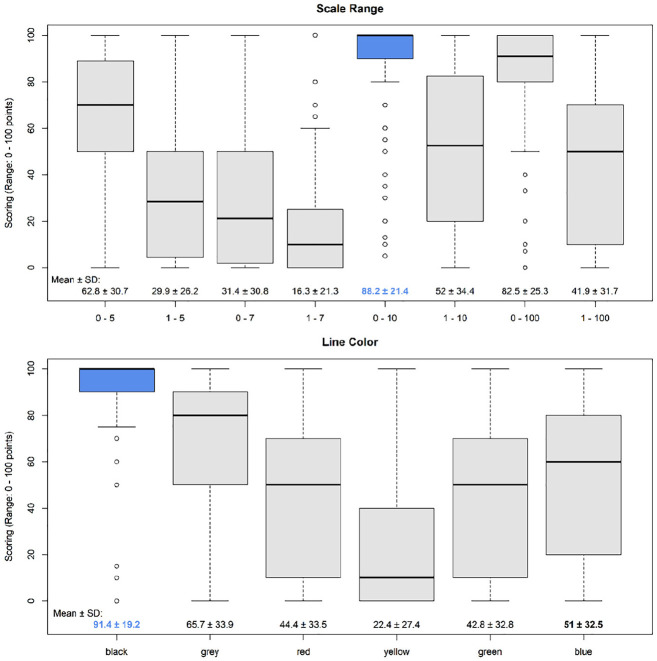
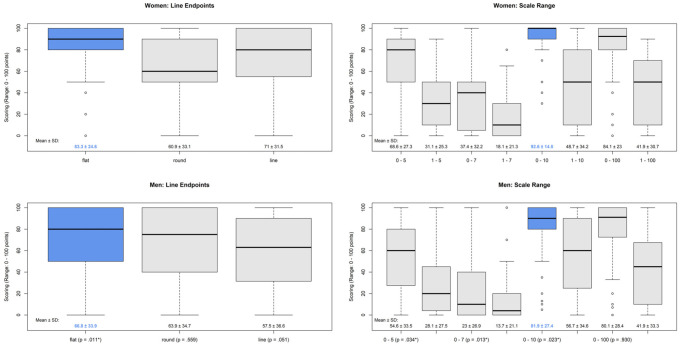
The preferred paper-based VAS item (see Figure 1) had a line width of 3 desktop publishing points (DTPs; M = 71.4; SD = 30.1; 95% CI = [65.9, 76.9]) and a line length of 8 cm (M = 63.0; SD = 24.1; 95% CI = [58.6, 67.4]). Interestingly with an increasing line width starting with 5 DTP points the preference for such VAS items decreased (cf. Figure 3), also very short VAS items (from 3 cm to 5 cm) were not preferred. (Note: A desktop publishing point is defined as an equivalent to 0.3527 mm; de Ruiter, 1988). For the endpoints (cf. Figure 2), the study cohort preferred flat endpoints (M = 76.2; SD = 29.9; 95% CI = [70.7, 81.7]) compared with round or vertical line endpoints. The major part of the study cohort preferred an ascending order of the scale endpoints (M = 96.4; SD = 10.2; 95% CI = [94.5, 98.4]; cf. Figure 4) and a scale range from 0 to 10 (M = 88.2; SD = 21.4; 95% CI = [84.3, 92.1]; cf. Figure 5) but with little difference from a scale range from 0 to 100 (M = 82.5; SD = 25.3; 95% CI = [77.9, 87.1]). The scale ranges not starting with 0 were not rated highly. Black was the preferred color of the paper-based VAS item (M = 91.4; SD = 19.2; 95% CI = [87.9, 94.9]; cf. Figure 5), and the preferred orientation was horizontal (M = 93.2; SD = 16.2; 95% CI = [90.2, 96.2]; cf. Figure 2).
Figure 3.
Line width and line length (compare questionnaire PsychArchives and on OSF).
Figure 2.
Line endpoints and line orientation (compare questionnaire on PsychArchives and on OSF).
Figure 4.
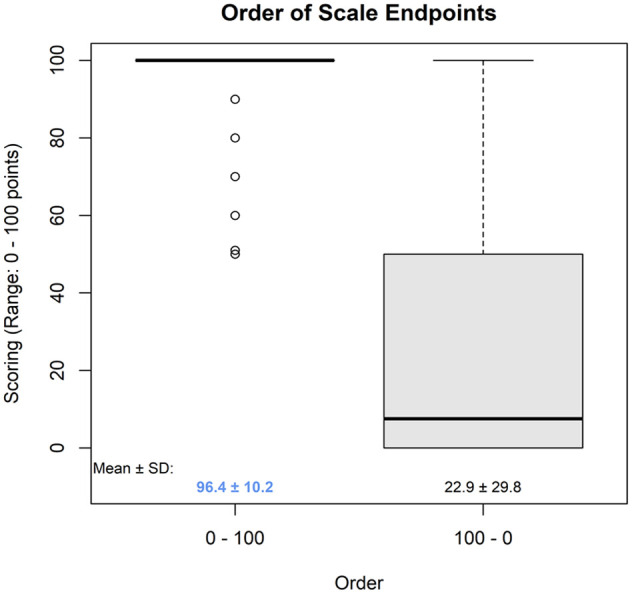
Order of scale endpoints (compare questionnaire on PsychArchives and on OSF).
Figure 5.
Scale range and line color (compare questionnaire on PsychArchives and on OSF).
Gender Differences
There was a statistically relevant difference between women and men (U = 2.54; p = .011) for the preference of the type of line endpoint (cf. Figure 6). Women (M = 83.3; SD = 24.6; 95% CI = [77.5, 89.1]) rated flat line endpoints higher than men (M = 66.8; SD = 33.9; 95% CI = [57.1, 76.5]). Also, a scale range from 0 to 10 was preferred more (U = 2.28; p = .023) by women (M = 92.6; SD = 14.5; 95% CI = [89.1, 95.9]) compared with men (M = 81.9; SD = 27.4; 95% CI = [74.1, 89.7]). Although most women preferred the black as a line color, women also assigned higher points to gray, yellow, green, and blue, compared with men (cf. Figure 7). A horizontal line orientation was preferred by most women. However, women are also more likely to prefer a vertical line orientation (U = 2.62; p = .008; M = 62.9; SD = 30.5; 95% CI = [55.7, 70.1]) than men (M = 48.0; SD = 31.4; 95% CI = [39.0, 57.0]). In general, there was no difference regarding the preference for specific paper-based VAS item characteristics, but women mostly assigned greater and more positive scores than men (Table 1).
Figure 6.
Line endpoints and scale range: Women and men (compare questionnaire on PsychArchives and on OSF).
Table 1.
Preferred VAS Item (Results With the Highest Scoring in Each Category).
| Female | Male | Total | |||||||
|---|---|---|---|---|---|---|---|---|---|
| Item | M | SD | n | M | SD | n | M | SD | n |
| Line width: 3 DTP points | 74.7 | 29.6 | 63 | 66.7 | 30.5 | 43 | 71.4 | 30.1 | 106 |
| Line length: 8 cm | 66.2 | 23.0 | 58 | 58.6 | 25.0 | 44 | 63.0 | 24.1 | 102 |
| Line endpoints: Flat | 83.3 | 24.6 | 59 | 66.8 | 33.9 | 44 | 76.2 | 29.9 | 103 |
| Order of scale endpoints: 0–100 | 97.3 | 8.3 | 62 | 95.3 | 12.4 | 44 | 96.4 | 10.2 | 106 |
| Scale range: 0–10 | 92.6 | 14.5 | 61 | 81.9 | 27.4 | 43 | 88.2 | 21.4 | 104 |
| Line color: Black | 93.9 | 10.7 | 65 | 87.8 | 26.8 | 46 | 91.4 | 19.2 | 111 |
| Line orientation: Horizontal | 94.4 | 11.3 | 65 | 91.4 | 21.4 | 46 | 93.2 | 16.2 | 111 |
Discussion
VAS has been widely used in medical research for several decades, especially for the measurement of pain. Numerous studies have reported satisfactory practical results, in which the high sensitivity of VAS to nuances of feelings can be deemed the most useful for application in psychological research as well as in psychological practice (e.g., for a more sensitive psychological diagnostics). The practical benefits of VAS are strengthened by good psychometric properties, especially when it is intended to apply parametric statistical procedures for data analyses.
In the present explorative, cross-sectional, empirical study, we focused on numerous different design characteristics to identify the preferred paper-based VAS item. We found that a VAS item should be designed with the following characteristics: (1) be a horizontal line, (2) have a line length of 8 cm, (3) have a line width of 3 DTP points, (4) be black, (5) have flat line endpoints (e.g., instead of round or vertical line endpoints), (6) have an ascending numerical order of scale endpoints (i.e., “0” and “10”, instead of “10” and “0”), and (7) use “0” and “10” as numerical anchors below the left and right endpoints, respectively (cf. Figure 1). We studied all answers of our participants and could rule out response biases and extreme response styles, such as end-aversion bias (Streiner et al., 2015), in all of our completed questionnaires. Because of the nature of our study, we could also exclude any socially desirable responses. Hence, we assume high data quality. Though the ratings of women and men yielded the same overall results, women mostly reported more positive ratings for the different design characteristics than men. It is possible that women perceive design characteristics with a different level of sensitivity compared to men, or they are more positive and generous when assigning points to a particular design modality (cf. Figures 6 and 7).
Our sample of 115 participants comprises mainly younger people (18-36 years old). Although our results indicated clear findings for the different design characteristics, it may be possible that people aged 36 years and older, and especially elderly people (65+ years), may prefer different design characteristics of paper-based VAS items. VAS items have been criticized for being too fine-grained for some respondents (Wetzel & Greiff, 2018). However, though they criticize VAS items, they do not focus on the assessment of fine gradations of feelings and on the potential loss of information when solely relying on Likert-type or rating scale items. Even prior findings suspected category scales of not showing nuances of feelings, because of the resulting discrete scores (Aitken, 1969), whereas VAS are considered for enabling a more nuanced assessment (Huang & Kämpfen, 2019). Nevertheless, especially in psychological research, most paradigms, symptoms, and feelings are considered as being on a continuum, because of an unobservable underlying universe of latent constructs that are assumed to be continuous and not categories. Based on these widely accepted assumptions, it is likely that VAS items measure this latent construct in a more appropriate way than categorical, ordinal scale items.
The status quo bias can be a problem in choice experiments, where people tend to prefer what they already have and know. However, a short and straightforward entreaty can reduce the status quo bias and may lead to a more stable preference ordering (Bonnichsen & Ladenburg, 2015). We addressed this issue in our study in two ways. First, we explicitly asked all our participants to precisely distinguish between their personal preferences and critically assign their points according to their subjectively perceived preferences and not to what they possibly already know about paper-based VAS items. Second, we conducted the aforementioned pilot study to reduce potential drawbacks in our main study. Thereby, we assessed (1) in which order the VAS design modalities should be presented and (2) which design characteristics should be used in the main study (cf. the supplied questionnaires for data assessment on PsychArchives: http://dx.doi.org/10.23668/psycharchives.3151 and on OSF: https://osf.io/3p8gy/).
In the busy daily lives of researchers, as well as clinicians, questionnaires help achieve a far better standardization and comparison of information than that gathered from subjective, mostly short, and sometimes nonstandardized anamnestic personal interviews. Therefore, it is crucial to ask people which format they prefer in order to state and rate the fine nuances of their feelings and attitudes. To date, paper-based VAS items remain very important for older people as well as to people who are physically not able to answer questions on a computer or on any other digital format. Moreover, researchers sometimes face technical constraints when carrying out field studies, when there is no internet connection available for an online assessment, especially when no provision of a computerized offline version is possible. In all these cases, paper-based VAS items may reduce the organizational burden, cognitive load, mental effort, and help participants answer important questions. However, it would be interesting to compare paper-based and computer-based VAS items in various psychological settings in future studies. We recommend paper-based VAS items, because they may enhance psychometric properties and facilitate more precise and quasi-metric psychological measurements allowing for parametric statistical analyses. Finally, as feelings are not ordinally scaled, it is of crucial importance not only to apply VAS items to measure fine nuances of emotions but also to study further potential gender differences within the application of VAS items. As the results indicate consistently higher ratings assigned by women than by men (to all seven studied VAS item design modalities) it would be interesting to further investigate this finding in gender-sensitive studies on VAS items.
Acknowledgments
We are grateful to Prof. Dr. Ivo Ponocny from the Department of Sustainability, Governance, and Methods at Modul University Vienna for his valuable comments on the content of this article. We are indebted to the editor-in-chief, Dr. George A. Marcoulides, and two anonymous referees, for their insightful comments that improved this article.
Footnotes
Authors’ Note: We support the principles of the Open Science Framework and have provided the questionnaires, data sets (.sav and .csv), and additional tables as supplementary material on PsychArchives and on OSF.
Declaration of Conflicting Interests: The author(s) declared no potential conflicts of interest with respect to the research, authorship, and/or publication of this article.
Funding: The author(s) received no financial support for the research, authorship, and/or publication of this article.
ORCID iD: Klemens Weigl  https://orcid.org/0000-0003-2674-1061
References
- Abend R., Dan O., Maoz K., Raz S., Bar-Haim Y. (2014). Reliability, validity and sensitivity of a computerized visual analog scale measuring state anxiety. Journal of Behavior Therapy and Experimental Psychiatry, 45(4), 447-453. 10.1016/j.jbtep.2014.06.004 [DOI] [PubMed] [Google Scholar]
- Aitken R. C. (1969). A growing edge of measurement of feelings [abridged]: Measurement of feelings using visual analogue scales. Proceedings of the Royal Society of Medicine, 62(10), 989-993. 10.1177/003591576906201005 [DOI] [PMC free article] [PubMed] [Google Scholar]
- Aun C., Lam Y. M., Collett B. (1986). Evaluation of the use of visual analogue scale in Chinese patients. Pain, 25(2), 215-221. 10.1016/0304-3959(86)90095-3 [DOI] [PubMed] [Google Scholar]
- Bonnichsen O., Ladenburg J. (2015). Reducing status quo bias in choice experiments. Nordic Journal of Health Economics, 3(1), 47-67. 10.5617/njhe.645 [DOI] [Google Scholar]
- Brooks R. (1996). EuroQol: The current state of play. Health Policy, 37(1), 53-72. 10.1016/0168-8510(96)00822-6 [DOI] [PubMed] [Google Scholar]
- Bruce B., Fries J. F. (2005). The Health Assessment Questionnaire (HAQ). Clinical and Experimental Rheumatology, 23(5, Suppl. 39), S14-S18. [PubMed] [Google Scholar]
- Carifio J., Perla R. (2008). Resolving the 50-year debate around using and misusing Likert scales. Medical Education, 42(12), 1150-1152. 10.1111/j.1365-2923.2008.03172.x [DOI] [PubMed] [Google Scholar]
- de Ruiter M. M. (Ed.). (1988). Advances in computer graphics III. Springer Science & Business Media. [Google Scholar]
- Downie W. W., Leatham P. A., Rhind V. M., Wright V., Branco J. A., Anderson J. A. (1978). Studies with pain rating scales. Annals of the Rheumatic Diseases, 37(4), 378-381. 10.1136/ard.37.4.378 [DOI] [PMC free article] [PubMed] [Google Scholar]
- EuroQol Group. (1990). EuroQol: A new facility for the measurement of health-related quality of life. Health Policy, 16(3), 199-208. 10.1016/0168-8510(90)90421-9 [DOI] [PubMed] [Google Scholar]
- Flaherty S. A. (1996). Pain measurement tools for clinical practice and research. Journal of American Association of Nurse Anesthetists, 64(2), 133-140. [PubMed] [Google Scholar]
- Freyd M. (1923). The Graphic Rating Scale. Journal of Educational Psychology, 14(2), 83-102. 10.1037/h0074329 [DOI] [Google Scholar]
- Hayes M. H. S., Patterson D. G. (1921). Experimental development of the graphic rating method. Psychological Bulletin, 18(2), 98-99. [Google Scholar]
- Hofmans J., Theuns P. (2008). On the linearity of predefined and self-anchoring visual analogue scales. British Journal of Mathematical and Statistical Psychology, 61(2), 401-413. 10.1348/000711007X206817 [DOI] [PubMed] [Google Scholar]
- Huang Z., Kämpfen F. (2019). Assessing (and addressing) reporting heterogeneity in visual analogue scales (VAS) with an application to gender difference in quality of life (University of Pennsylvania Population Center; Working Paper 2019-26). https://repository.upenn.edu/psc_publications/26 [Google Scholar]
- Jaeschke R., Singer J., Guyatt G. H. (1990). A comparison of seven-point and visual analogue scales. Controlled Clinical Trials, 11(1), 43-51. 10.1016/0197-2456(90)90031-V [DOI] [PubMed] [Google Scholar]
- Jamieson S. (2004). Likert scales: How to (ab)use them. Medical Education, 38(12), 1217-1218. 10.1111/j.1365-2929.2004.02012.x [DOI] [PubMed] [Google Scholar]
- McCormack H. M., de L., Horne D. J., Sheather S. (1988). Clinical applications of visual analogue scales: A critical review. Psychological Medicine, 18(04), 1007. 10.1017/S0033291700009934 [DOI] [PubMed] [Google Scholar]
- McDowell I. (2006). Measuring health: A guide to rating scales and questionnaires (3rd ed.). Oxford University Press. [Google Scholar]
- McGuire D. B. (1984). The measurement of clinical pain. Nursing Research, 33(3), 152-156. 10.1097/00006199-198405000-00007 [DOI] [PubMed] [Google Scholar]
- Myles P. S, Troedel S., Boquest M., Reeves M. (1999). The Pain Visual Analog Scale: Is it linear or nonlinear? Anesthesia & Analgesia, 87(6), 1517-1520. 10.1213/00000539-199912000-00038 [DOI] [PubMed] [Google Scholar]
- Myles P. S., Urquhart N. (2005). The linearity of the Visual Analogue Scale in patients with severe acute pain. Anaesthesia and Intensive Care, 33(1), 54-58. 10.1177/0310057X0503300108 [DOI] [PubMed] [Google Scholar]
- Ogon M., Krismer M., Söllner W., Kantner-Rumplmair W., Lampe A. (1996). Chronic low back pain measurement with visual analogue scales in different settings: Pain, 64(3), 425-428. 10.1016/0304-3959(95)00208-1 [DOI] [PubMed] [Google Scholar]
- Pell G. (2005). Use and misuse of Likert scales. Medical Education, 39(9), 970-970. 10.1111/j.1365-2929.2005.02237.x [DOI] [PubMed] [Google Scholar]
- Rausch M., Zehetleitner M. (2014). A comparison between a visual analogue scale and a four point scale as measures of conscious experience of motion. Consciousness and Cognition, 28, 126-140. 10.1016/j.concog.2014.06.012 [DOI] [PubMed] [Google Scholar]
- Reips U.-D., Funke F. (2008). Interval-level measurement with visual analogue scales in Internet-based research: VAS Generator. Behavior Research Methods, 40(3), 699-704. 10.3758/BRM.40.3.699 [DOI] [PubMed] [Google Scholar]
- Revill S. I., Robinson J. O., Rosen M., Hogg M. I. J. (1976). The reliability of a linear analogue for evaluating pain. Anaesthesia, 31(9), 1191-1198. 10.1111/j.1365-2044.1976.tb11971.x [DOI] [PubMed] [Google Scholar]
- Scott J., Huskisson E. C. (1979). Vertical or horizontal visual analogue scales. Annals of the Rheumatic Diseases, 38(6), 560-560. 10.1136/ard.38.6.560 [DOI] [PMC free article] [PubMed] [Google Scholar]
- Seymour R. A., Simpson J. M., Charlton E. J., Phillips M. E. (1985). An evaluation of length and end-phrase of visual analogue scales in dental pain. Pain, 21(2), 177-185. 10.1016/0304-3959(85)90287-8 [DOI] [PubMed] [Google Scholar]
- Siegel S. (1956). Nonparametric statistics for the behavioral sciences. McGraw-Hill. [Google Scholar]
- Solomon P. J. (1989). Analysis of patient self-assessment visual analogue scales. Applied Stochastic Models and Data Analysis, 5(2), 153-164. 10.1002/asm.3150050205 [DOI] [Google Scholar]
- Sriwatanakul K., Kelvie W., Lasagna L., Calimlim J. F., Weis O. F., Mehta G. (1983). Studies with different types of visual analog scales for measurement of pain. Clinical Pharmacology and Therapeutics, 34(2), 234-239. 10.1038/clpt.1983.159 [DOI] [PubMed] [Google Scholar]
- Streiner D. L., Norman G. R., Cairney J. (2015). Health measurement scales: A practical guide to their development and use (5th ed.). Oxford University Press. [Google Scholar]
- Svensson E. (2000). Comparison of the quality of assessments using continuous and discrete ordinal rating scales. Biometrical Journal, 42(4), 417-434. [DOI] [Google Scholar]
- Treiblmaier H., Filzmoser P. (2009, November). Benefits from using continuous rating scales in online survey research [Unpublished doctoral dissertation]. Vienna University of Technology. [Google Scholar]
- Wetzel E., Greiff S. (2018). The World Beyond Rating Scales: Why we should think more carefully about the response format in questionnaires. European Journal of Psychological Assessment, 34(1), 1-5. 10.1027/1015-5759/a000469 [DOI] [Google Scholar]


