

The authors wish to make the following corrections to this paper [1]. Following publication, it was discovered that the data provided to the authors for fruit juice was incorrect. Updated data were provided by IRI Australia. This affects the text relating to Figure 3 and the juice totals for Table 1. Corrected data are listed below.
Figure 3.
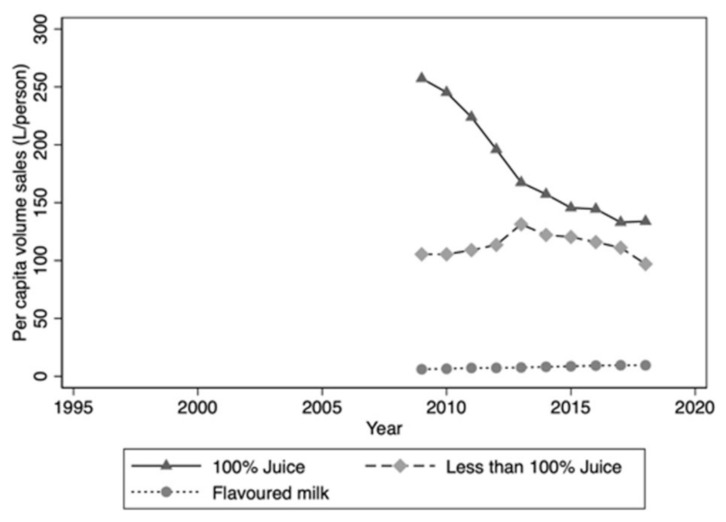
Per capita volume sales: Juice/juice drinks and flavoured milk drinks 2009–2018.
Table 1.
Trends in volume sales of water-based beverages between 1997 and 2018. * Total may not equal sum of sugar-sweetened beverages (SSB) and non-SSB categories due to rounding error.
| Beverage Category | Per Capita Volume Sales 1997 (L/Person) | Per Capita Volume Sales 2009 (L/Person) | Per Capita Volume Sales 2018 (L/Person) | Volume Share 1997 (%) * | Volume Share 2018 (%) * | Percentage Change per Capita Volume Sales 2009–2018 (%) | Annual Growth Rate 2009–2018 (%) | Percentage Change per Capita Volume Sales 1997–2018 (%) | Annual Growth Rate 1997–2018 (%) |
|---|---|---|---|---|---|---|---|---|---|
| All water-based beverages * | |||||||||
| Total | 130.86 | 129.61 | 149.42 | 100.00 | 100.00 | 0.67 | 1.53 | 14.18 | 0.64 |
| SSB | 83.16 | 74.40 | 61.04 | 63.54 | 40.85 | −0.82 | −1.80 | −26.59 | −1.21 |
| Non-SSB | 47.71 | 55.21 | 88.38 | 36.45 | 59.15 | 3.27 | 6.01 | 85.26 | 3.88 |
| Carbonated soft drinks | |||||||||
| Total | 98.54 | 91.62 | 70.58 | 75.30 | 47.24 | −0.79 | −2.30 | −28.37 | −1.29 |
| SSB | 75.78 | 62.51 | 44.62 | 57.91 | 29.86 | −1.69 | −2.86 | −41.13 | −1.87 |
| Non-SSB | 22.76 | 29.12 | 25.97 | 17.39 | 17.37 | 2.21 | −1.08 | 14.08 | 0.64 |
| Energy drinks | |||||||||
| Total | 0.14 | 3.56 | 6.36 | 0.11 | 1.33 | 81.39 | 7.86 | 4374.72 | 198.85 |
| SSB | 0.14 | 3.30 | 5.44 | 0.11 | 1.16 | 73.61 | 6.50 | 3728.39 | 169.47 |
| Non-SSB | 0.00 | 0.26 | 0.92 | 0.00 | 0.17 | NC | 25.07 | NC | NC |
| Sports drinks | |||||||||
| Total | 1.48 | 2.79 | 3.97 | 1.13 | 2.66 | 7.29 | 4.24 | 168.25 | 7.65 |
| SSB | 1.48 | 2.70 | 3.78 | 1.13 | 2.53 | 7.18 | 4.03 | 156.05 | 7.09 |
| Non-SSB | 0.00 | 0.09 | 0.19 | 0.00 | 0.13 | 61.48 | 10.57 | 6478.99 | 294.50 |
| Iced tea | |||||||||
| Total | 0.15 | 1.30 | 1.99 | 0.16 | 1.26 | 44.84 | 5.30 | 1217.43 | 55.34 |
| SSB | 0.15 | 1.15 | 1.73 | 0.16 | 0.78 | 39.36 | 5.09 | 1043.63 | 47.44 |
| Non-SSB | 0.00 | 0.16 | 0.26 | 0 | 0.56 | NC | 6.88 | NC | NC |
| Mineral waters | |||||||||
| Total | 5.00 | 4.49 † | 9.02 † | 3.82 | 6.03 † | −0.58 | 10.08 | 80.47 | 3.66 |
| SSB | 2.17 | 1.49 | 1.88 | 1.66 | 1.26 | −2.27 | 2.61 | −13.47 | −0.61 |
| Non-SSB | 2.82 | 0.80 | 1.17 | 2.61 | 2.01 | −6.02 | 4.51 | −58.65 | −2.67 |
| Mixers | |||||||||
| Total | 7.97 | 7.24 | 8.36 | 6.09 | 5.59 | −0.07 | 1.55 | 4.89 | 0.22 |
| SSB | 3.41 | 2.48 | 3.01 | 2.61 | 2.01 | 9.14 | 2.11 | −11.88 | −0.54 |
| Non-SSB | 4.55 | 4.75 | 5.35 | 3.48 | 3.58 | −6.98 | 1.25 | 17.47 | 0.79 |
| Unflavoured pure waters | |||||||||
| Total | 11.81 | 20.02 | 53.88 | 9.02 | 36.06 | 4.32 | 16.91 | 356.33 | 16.20 |
| Still | 5.76 | 17.83 | 47.91 | 4.41 | 32.57 | 14.32 | 16.88 | 732.37 | 33.29 |
| Sparkling | - | 2.19 | 5.97 | - | 3.99 | NC | 17.21 | NC | NC |
| Flavoured Milks | |||||||||
| Total | - | 6.06 | 9.48 | - | - | 56.42 | 5.64 | NC | NC |
| Juice | |||||||||
| Total | - | 362.59 | 230.75 | - | - | −36.36 | −3.64 | NC | NC |
| 100% Juice | - | 257.21 | 133.83 | - | - | −47.97 | −4.80 | NC | NC |
| Less than 100% Juice | - | 105.38 | 96.93 | - | - | −8.03 | −0.80 | NC | NC |
| Kombucha | |||||||||
| Total | - | 0.00 | 0.47 | - | - | NC | NC | NC | NC |
3. Results: Data on per capita volume sales for juice, juice drinks and flavoured milks were only available for the period 2009 to 2018. During this period, volume sales of juice drinks (<100% juice) declined slightly, while sales of 100% juice dropped sharply, by 43% (Figure 3).
The correct data were provided by IRI Australia. Please replace the above table with this one below.
Table 1.
Trends in volume sales of water-based beverages between 1997 and 2018. * Total may not equal sum of SSB and non-SSB categories due to rounding error.
| Beverage Category | Per Capita Volume Sales 1997 (L/Person) | Per Capita Volume Sales 2009 (L/Person) | Per Capita Volume Sales 2018 (L/Person) | Volume Share 1997 (%) * | Volume Share 2018 (%) * | Percentage Change per Capita Volume Sales 2009–2018 (%) | Annual Growth Rate 2009–2018 (%) | Percentage Change per Capita Volume Sales 1997–2018 (%) | Annual Growth Rate 1997–2018 (%) |
|---|---|---|---|---|---|---|---|---|---|
| All water-based beverages * | |||||||||
| Total | 130.86 | 129.61 | 149.42 | 100.00 | 100.00 | 0.67 | 1.53 | 14.18 | 0.64 |
| SSB | 83.16 | 74.40 | 61.04 | 63.54 | 40.85 | −0.82 | −1.80 | −26.59 | −1.21 |
| Non-SSB | 47.71 | 55.21 | 88.38 | 36.45 | 59.15 | 3.27 | 6.01 | 85.26 | 3.88 |
| Carbonated soft drinks | |||||||||
| Total | 98.54 | 91.62 | 70.58 | 75.30 | 47.24 | −0.79 | −2.30 | −28.37 | −1.29 |
| SSB | 75.78 | 62.51 | 44.62 | 57.91 | 29.86 | −1.69 | −2.86 | −41.13 | −1.87 |
| Non-SSB | 22.76 | 29.12 | 25.97 | 17.39 | 17.37 | 2.21 | −1.08 | 14.08 | 0.64 |
| Energy drinks | |||||||||
| Total | 0.14 | 3.56 | 6.36 | 0.11 | 1.33 | 81.39 | 7.86 | 4374.72 | 198.85 |
| SSB | 0.14 | 3.30 | 5.44 | 0.11 | 1.16 | 73.61 | 6.50 | 3728.39 | 169.47 |
| Non-SSB | 0.00 | 0.26 | 0.92 | 0.00 | 0.17 | NC | 25.07 | NC | NC |
| Sports drinks | |||||||||
| Total | 1.48 | 2.79 | 3.97 | 1.13 | 2.66 | 7.29 | 4.24 | 168.25 | 7.65 |
| SSB | 1.48 | 2.70 | 3.78 | 1.13 | 2.53 | 7.18 | 4.03 | 156.05 | 7.09 |
| Non-SSB | 0.00 | 0.09 | 0.19 | 0.00 | 0.13 | 61.48 | 10.57 | 6478.99 | 294.50 |
| Iced tea | |||||||||
| Total | 0.15 | 1.30 | 1.99 | 0.16 | 1.26 | 44.84 | 5.30 | 1217.43 | 55.34 |
| SSB | 0.15 | 1.15 | 1.73 | 0.16 | 0.78 | 39.36 | 5.09 | 1043.63 | 47.44 |
| Non-SSB | 0.00 | 0.16 | 0.26 | 0 | 0.56 | NC | 6.88 | NC | NC |
| Mineral waters | |||||||||
| Total | 5.00 | 4.49† | 9.02† | 3.82 | 6.03† | −0.58 | 10.08 | 80.47 | 3.66 |
| SSB | 2.17 | 1.49 | 1.88 | 1.66 | 1.26 | −2.27 | 2.61 | −13.47 | −0.61 |
| Non-SSB | 2.82 | 0.80 | 1.17 | 2.61 | 2.01 | −6.02 | 4.51 | −58.65 | −2.67 |
| Mixers | |||||||||
| Total | 7.97 | 7.24 | 8.36 | 6.09 | 5.59 | −0.07 | 1.55 | 4.89 | 0.22 |
| SSB | 3.41 | 2.48 | 3.01 | 2.61 | 2.01 | 9.14 | 2.11 | −11.88 | −0.54 |
| Non-SSB | 4.55 | 4.75 | 5.35 | 3.48 | 3.58 | −6.98 | 1.25 | 17.47 | 0.79 |
| Unflavoured pure waters | |||||||||
| Total | 11.81 | 20.02 | 53.88 | 9.02 | 36.06 | 4.32 | 16.91 | 356.33 | 16.20 |
| Still | 5.76 | 17.83 | 47.91 | 4.41 | 32.57 | 14.32 | 16.88 | 732.37 | 33.29 |
| Sparkling | - | 2.19 | 5.97 | - | 3.99 | NC | 17.21 | NC | NC |
| Flavoured Milks | |||||||||
| Total | - | 6.06 | 9.48 | - | - | 56.42 | 5.64 | NC | NC |
| Juice | |||||||||
| Total | - | 36.70 | 24.62 | - | - | −32.92 | −3.29 | NC | NC |
| 100% Juice | - | 26.0 | 18.82 | - | - | −43.02 | −4.30 | NC | NC |
| Less than 100% Juice | - | 10.69 | 9.80 | - | - | −8.34 | −0.83 | NC | NC |
| Kombucha | |||||||||
| Total | - | 0.00 | 0.47 | - | - | NC | NC | NC | NC |
The correct data were provided by IRI Australia. Please replace the above figure with this one below.
Figure 3.
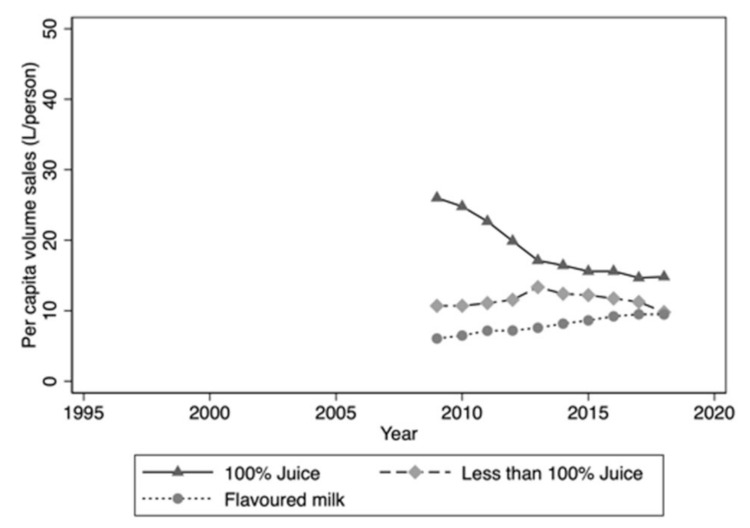
Per capita volume sales: Juice/juice drinks and flavoured milk drinks 2009–2018.
These changes have no material impact on the conclusions of the paper. The authors would like to apologize to readers of Nutrients for this error. The published version will be updated on the article webpage, with a reference to this correction notice.
Funding
This analysis was funded by an unrestricted grant from The Australian Beverages Council Ltd. The grant funders had no input into the data analysis or interpretation, or the decision to publish this work.
Institutional Review Board Statement
Not applicable.
Informed Consent Statement
Not applicable.
Data Availability Statement
Data available on a commercial basis from IRI Australia.
Conflicts of Interest
This analysis was funded by an unrestricted grant from The Australian Beverages Council Ltd. The funders had no role in the design of the study; in the collection, analyses, or interpretation of data; in the writing of the manuscript, or in the decision to publish the results.
Footnotes
Publisher’s Note: MDPI stays neutral with regard to jurisdictional claims in published maps and institutional affiliations.
Reference
- 1.Shrapnel W.S., Butcher B.E. Sales of Sugar-Sweetened Beverages in Australia: A Trend Analysis from 1997 to 2018. Nutrients. 2020;12:1016. doi: 10.3390/nu12041016. [DOI] [PMC free article] [PubMed] [Google Scholar]
Associated Data
This section collects any data citations, data availability statements, or supplementary materials included in this article.
Data Availability Statement
Data available on a commercial basis from IRI Australia.