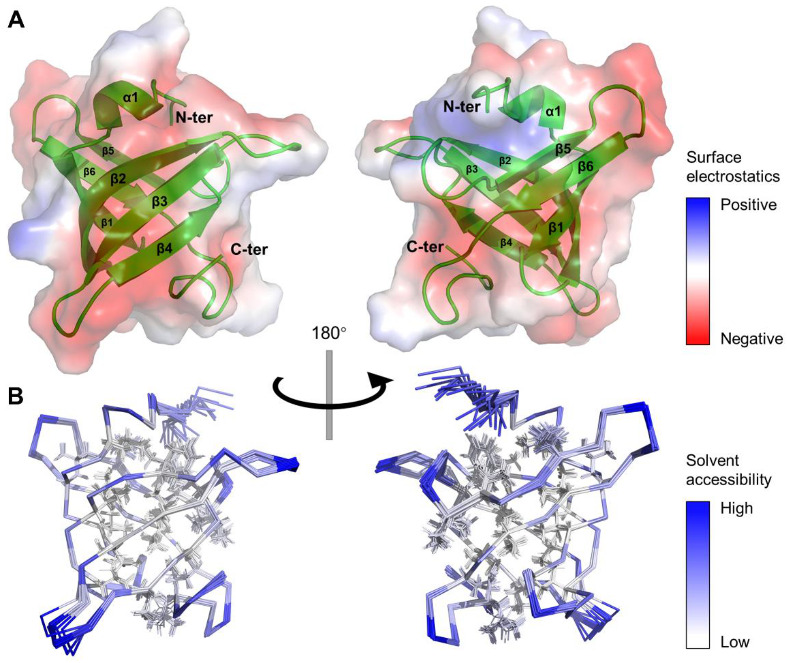
Figure 2.

Three-dimensional structure of MtbRimMCTD in solution. (A) Cartoon depiction and surface electrostatics display for the mean structure of MtbRimMCTD. Positive and negative charges are colored in blue and red on the protein surface with 50% transparency, respectively. (B) Ribbon depiction of 20 lowest-energy models for MtbRimMCTD. Relative solvent accessibility per residue is colored from white to blue in ascending order. Particularly, side chains of non-polar residues buried in the hydrophobic core are presented as lines.
