Abstract
Background
Myopic maculopathy (MM) is the most serious and irreversible complication of pathologic myopia, which is a major cause of visual impairment and blindness. Clinic proposed limited number of factors related to MM. To explore additional features strongly related with MM from optic disc region, we employ a machine learning based radiomics analysis method, which could explore and quantify more hidden or imperceptible MM-related features to the naked eyes and contribute to a more comprehensive understanding of MM and therefore may assist to distinguish the high-risk population in an early stage.
Methods
A total of 457 eyes (313 patients) were enrolled and were divided into severe MM group and without severe MM group. Radiomics analysis was applied to depict features significantly correlated with severe MM from optic disc region. Receiver Operating Characteristic were used to evaluate these features’ performance of classifying severe MM.
Results
Eight new MM-related image features were discovered from the optic disc region, which described the shapes, textural patterns and intensity distributions of optic disc region. Compared with clinically reported MM-related features, these newly discovered features exhibited better abilities on severe MM classification. And the mean values of most features were markedly changed between patients with peripapillary diffuse chorioretinal atrophy (PDCA) and macular diffuse chorioretinal atrophy (MDCA).
Conclusions
Machine learning and radiomics method are useful tools for mining more MM-related features from the optic disc region, by which complex or even hidden MM-related features can be discovered and decoded. In this paper, eight new MM-related image features were found, which would be useful for further quantitative study of MM-progression. As a nontrivial byproduct, marked changes between PDCA and MDCA was discovered by both new image features and clinic features.
Supplementary Information
The online version contains supplementary material available at 10.1186/s12967-021-02818-1.
Keywords: Pathologic myopia, Myopic maculopathy, Feature mining, Machine learning, Radiomics
Background
Pathologic myopia is a major cause of visual impairment and blindness worldwide, especially in East Asian populations [1, 2]. Mostly developing from high myopia, pathologic myopia may cause a wide spectrum of complications, such as glaucoma, retinal detachment, and myopic maculopathy. Myopic maculopathy (MM), also known as myopic macular degeneration, is the most serious and irreversible complication. It is estimated that by 2050, visual impairment from MM will affect 55.7 million people and 18.5 million will become blind [3]. According to the International Photographic Classification and Grading System for myopic maculopathy (META-PM) [4], MM from mild to severe could be graded as no macular lesions (C0), tessellated fundus (C1), diffuse chorioretinal atrophy (C2), patchy chorioretinal atrophy (C3), and macular atrophy (C4). A higher grade of MM has more marked fundus changes and visual impairment. Thus, the identification of early fundus changes in patients who then further develop MM may offer the potential insights for earlier intervention and reduction in visual impairment and blindness.
The early identification of MM, however, is challenging. Fang et al. [5] and Yan et al. [6] recently reported that the peripapillary atrophy (PPA) was a risk factor for the development from high myopia to pathologic myopia and the development of MM. Our previous study[7] also suggested that tilt ratio and PPA area were associated with macular and peripapillary choroidal thickness in young high myopic patients. These studies indicated that the region of the optic disc has features that may correlate with the development of MM. In the short term, these features could imply different fundus image changes between population who develop severe MM and who do not. In a long run, because optic disc changes usually occur in high myopia stage, these features also have potential to serve as indicators to discern the high-risk population in an early stage. Thus, exploring and quantifying more hidden or imperceptible MM-related features to the naked eyes in optic disc region may contribute to a more comprehensive understanding of MM and therefore may assist to distinguish the high-risk population.
Radiomics is a methodology that extracts a large number of features from medical images using data-characterization algorithms. These features offer potential to discover disease characteristics that are beyond the perception capacity of the naked eye. Although not yet used in ophthalmic imaging analysis, radiomics has been widely used in tumor phenotype classification, preoperative prediction, treatment assessment and etc. based on image feature mining [8–17]. Recently, machine-learning has been used to identify image features in a variety of eye diseases including diabetic retinopathy, glaucoma and macular degeneration [18–21]. However, the morphological assessment of the optic disc region in pathologic myopia is complicated, and the features solely from surface are far from sufficient for more accurate diagnosis and more descriptive characteristics are yet to be revealed. Employing machine learning and radiomics methods to extract and quantify these hidden image features could help discover more MM-related fundus image characteristics, and transfer retinal specialists’ experience to practical evaluating indicator to help make diagnosis [22].
This research aims to (1) mine MM-related image features from the optic disc region of fundus images via machine learning and radiomics methods; and (2) provide quantitative analysis on MM characteristics to assist ophthalmologists have further insights of the development of MM, and to support objective early diagnosis.
Patients and methods
Patients
The patients included in this study were recruited in the Shanghai High Myopia Study for Adults. The study protocol has been described in our previous study [23] and was approved by the Medical Ethics Committee of Shanghai General Hospital, Shanghai Jiao Tong University School of Medicine, consistent with the Declaration of Helsinki. Written informed consent was obtained from all study participants. The study (# NCT03446300) was registered at http://www.clinicaltrials.gov.
They were over 50 years of age and had an Axial length (AL) more than 26 mm. Exclusion criteria included: an IOP over 21 mmHg; previous intraocular or refractive surgery other than cataract surgery; media opacity; coexisting or history of ocular or severe systemic diseases, including dense cataract, glaucoma, diabetic retinopathy or diabetic macular edema and autoimmune disease; and other evidence of retinal pathology not related to myopia. Patients were also excluded if the retinal images were ‘poor’, for example, images out of focus, interfered of light, occluded and etc. Generalized estimating equation regression models were used to account for correlation between left and right eyes of the same patient [23]. Both eyes were included in this study, and if an eye was not eligible based on the inclusion criteria, it was excluded from this particular analysis.
According to the META-PM Study Group [4], myopic maculopathy was classified into C0, C1, C2, C3, and C4. According to the earlier reports, [5, 24–26] C2 was sub-classified into peripapillary chorioretinal atrophy (PDCA) and macular chorioretinal atrophy (MDCA). Lacqure cracks, myopic choroidal neovascularization and Fuch’s spot were classified as “plus lesions”. Eyes with graded greater than or equal to MDCA or associated with plus lesions were classified as severe MM group, while eyes with C0, C1 or PDCA were classified as without severe MM group. The classification and grading of MM were performed by two independent, well-trained graders (Q.Y.C and J.N.H). In cases of disagreement, an adjudication was made by a retinal specialist (Y.F). The clinical characteristics of the patients are listed in Table 1.
Table 1.
Patient clinical characteristics
| Total | C0 | C1 | PDCA | MDCA | C3 | C4 | P valuea | Without severe Myopic Maculopathy (MM) | Severe MM | P valueb | |
|---|---|---|---|---|---|---|---|---|---|---|---|
| Eye # (%) | 457 | 44(9.6) | 112(24.5) | 122(26.7) | 104(22.8) | 45(9.8) | 30(6.6) | / | 278 | 179 | / |
| Age in yrs | 67.9 ± 6.3 | 64.6 ± 5.7 | 67.6 ± 5.2 | 67.4 ± 6.1 | 69.1 ± 7 | 69 ± 6.3 | 70.5 ± 7.6 | < 0.001 | 67 ± 5.7 | 69.3 ± 6.9 | < 0.001 |
| Men (%) | 191(41.8) | 27(61.4) | 47(42.0) | 54(44.3) | 42(40.4) | 13(28.9) | 8(26.7) | 0.021 | 128(46.0) | 63(35.2) | 0.025 |
| SER, D | − 9.34 ± 5.65 | − 6.17 ± 3.09 | − 8.27 ± 4.85 | − 8.9 ± 4.82 | − 11.83 ± 6.34 | − 9.88 ± 6.7 | − 10.28 ± 6.8 | < 0.001 | − 8.21 ± 4.68 | − 11.08 ± 6.53 | < 0.001 |
| AL, mm | 28.53 ± 1.85 | 26.71 ± 0.53 | 27.62 ± 1.37 | 28.18 ± 1.65 | 29.62 ± 1.68 | 30.26 ± 1.4 | 29.63 ± 1.74 | < 0.001 | 27.72 ± 1.49 | 29.79 ± 1.64 | < 0.001 |
| BCVA (logMAR) | 0.46 ± 0.37 | 0.16 ± 0.14 | 0.35 ± 0.29 | 0.42 ± 0.34 | 0.6 ± 0.38 | 0.59 ± 0.41 | 0.95 ± 0.35 | < 0.001 | 0.35 ± 0.31 | 0.64 ± 0.4 | < 0.001 |
| Tilt ratio | 0.70 ± 0.13 | 0.78 ± 0.1 | 0.7 ± 0.14 | 0.72 ± 0.12 | 0.65 ± 0.13 | 0.63 ± 0.13 | 0.66 ± 0.11 | < 0.001 | 0.72 ± 0.13 | 0.65 ± 0.13 | < 0.001 |
| Torsion0 | − 2.89 ± 33.72 | 6.52 ± 46.43 | − 5.43 ± 34.44 | − 1.43 ± 41.04 | − 5.35 ± 23.94 | − 0.16 ± 20.67 | − 8.76 ± 14.06 | 0.303 | − 1.78 ± 39.52 | − 4.62 ± 21.85 | 0.326 |
| PPA area (mm2) | 2.27 ± 2.18 | 0.52 ± 0.34 | 1.45 ± 1.16 | 1.53 ± 1.14 | 3.52 ± 2.59 | 4.15 ± 2.86 | 3.77 ± 2.12 | < 0.001 | 1.34 ± 1.12 | 3.72 ± 2.59 | < 0.001 |
AL axial length, BCVA best-corrected visual acuity, C0 no myopic maculopathy; C1 tessellated fundus, C3 patchy atrophy, C4 macular atrophy, D diopter, logMAR logarithm of minimal angle of resolution, MDCA macular diffuse choroidal atrophy, PDCA peripapillary diffuse choroidal atrophy, PPA peripapillary atrophy, SER spherical equivalent refraction; Eyes with C0, C1 and PDCA were classified as without severe MM, eyes with MDCA, C3 and C4 were classified as severe MM
aP value for the difference in characteristics between different degree of myopic maculopathy, based on One-way ANOVA test or x2 test, as appropriate
bP value for the difference in characteristics between eyes with and without severe MM, based on Student’s t-test or x2 test, as appropriate
A total of 457 eyes of 313 participants with high myopia were included in the study, noted as the whole dataset. We split 70% of the eyes as training dataset consisting of 319 eyes, and 30% as validation dataset consisting of 138 eyes.
Methods
The radiomics method involved: (1) delineation of the regions of interests (ROIs); (2) construction of a feature pool by the automatic extraction of image features from the ROIs and, (3) selection of discriminative features using the correlation analysis and machine learning method.
ROI delineation
The ROIs were interactively extracted and annotated from fundus images according to the PPA and optic disc boundaries using an in-house annotation software as shown in Fig. 1. The contours of the delineated regions were smoothed through B-spline interpolation to avoid blurs generated by manual errors [27].
Fig. 1.
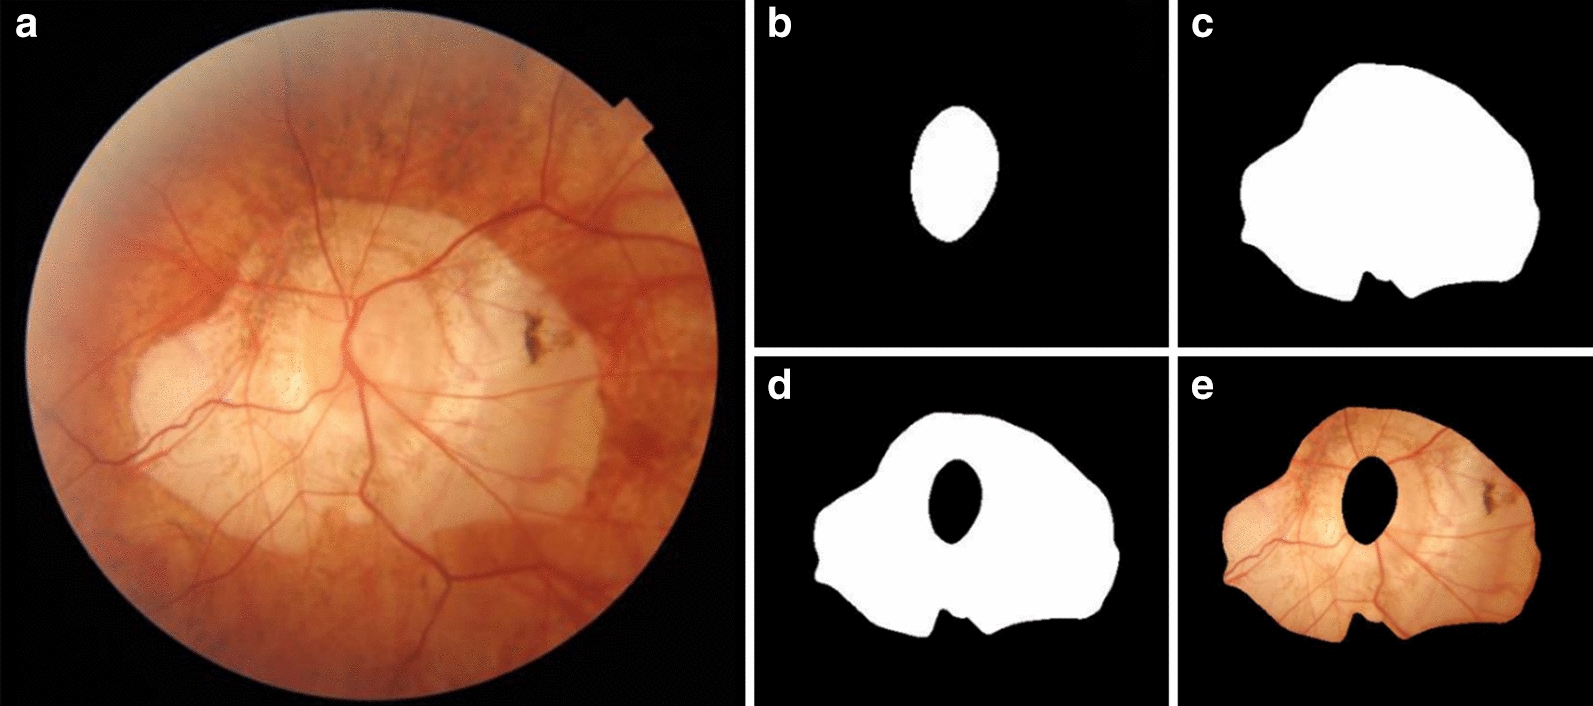
Delineation of ROI: a original fundus image; b mask of optic disc; c mask of contour of PPA with optic disc; d mask of PPA region and, e masked PPA
Construction of the feature pool
Before the feature extraction, all scans of left eyes were mirrored to conform to scans of right eyes. There were 316 high throughput features that were extracted and comprised 151 morphologic, 54 intensity and 111 texture features. All of the features were extracted from the ROI of images (Fig. 1). Various morphological characteristics of the optic disc region included regional properties, such as the Hausdorff distance and the curvatures of contours, and global properties, such as perimeters, central moments and moment invariants [28, 29]. Corresponding shape description operators were used to obtain these features. The intensity features described intensity distributions, such as mean value, variance, and statistics histograms. The definition of intensity and texture features was detailed in the website (https://pyradiomics.readthedocs.io/en/latest/). These features were extracted with the PyRadiomics package from R, G, B channels of color fundus images, separately [30].
Six shape features had been reported previously by ophthalmologists and regarded as possible MM-related candidates [31–33]. We termed these six features as clinic features which conducted clinic feature set. Among them, AreaPPA was defined as the area between the contour of PPA and the contour of optic disc. AreaDisc was defined as the area within the contour of optic disc. Tilt of optic disc was defined as the ratio of the short axis and the long axis of optic disc. Torsion referred to the angle between the long axis of optic disc and the line perpendicular to the line of macular and center of optic disc. Dist_MD referred to the distance of macular and center of optic disc. Angle_MD referred to the angle between horizontal and line of macular and center of optic disc. All of the indexes were counted in pixels. Since all of the color fundus images had the same size of 2032*1934 with 150 dpi, it has been ensured that these data were obtained under the same metric. These six clinic features were included into shape features subclass for further selection.
MM-related features selection
We selected MM-related features from 322 features based on evaluating their ability to classify patients with and without severe MM. The data in training dataset were normalized by Z-score in advance [34, 35]. First, mutual information and student’s t test were employed to filter out noisy and irrelevant features [36, 37]. Then, SFFS (Sequential Floating Forward Selection) algorithm with random forest classifier was used to select the optimal feature set [38, 39]. fivefold cross validation was employed to avoid over-fitting in SFFS procedure. Finally, a final feature set was selected according to the number of features, mean score and standard deviation of cross validation. A decision model was trained using this feature set by random forest classifier. ROC (Receiver Operating Characteristic) and AUC (Area Under the Curve) indexes were used to evaluate the feature set’s performance of classifying patients with or without severe MM.
Statistical analysis
The final feature set was termed new feature set. The features in the final feature set were termed new image features. To assess how the new feature set would generalize an independent data set, the performance of decision model was evaluated on the validation dataset. To assess the effectiveness of each new image feature, the classification ability and intra-class distribution property of these features were calculated on the whole dataset. The classification ability of new image features was assessed by the univariate performance using the logistic regression model under fivefold cross validation. The intra-class distribution of new image features was illustrated by boxplot on patients with and without severe MM. To evaluate the independence of the new image features, the correlation between new image features and clinic features was evaluated using the Pearson Correlation Coefficient. To put the results, in visualization, we selected five high univariate score features (AUC > 0.75) from new image features and the clinic feature set and visualized them in graphs. Furthermore, we displayed the mean value and standard deviation value of the five features on subclasses of META-PM Study Group.
Results and evaluation
The generalized estimating equation regression models revealed that there were no significant differences in ocular biometry between the two eyes; thus, no adjustment is needed for the associations between the two eyes. Therefore, the eyes, including those from a same person, were regarded as independent samples and were included in this study based on the inclusion criteria.
Features selection results
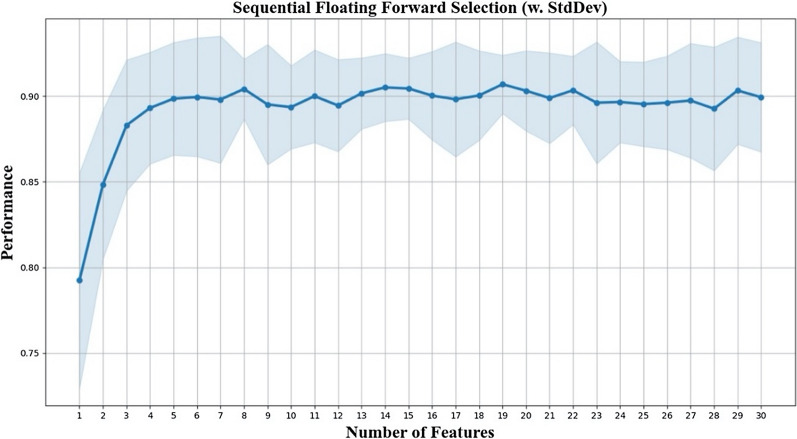
Among the 322 features, 220 had passed mutual information filter (threshold = 0.2), and 244 had passed independent student’s t test (p < 0.05). An intersection of 188 features retained after the filter method phase. Among the clinic features, AreaPPA and Tilt retained while the others had been filtered out. The maximal number of features evaluated by SFFS was set to 30. The mean score of classification performance were arising until the number of selected features increased to eight (Fig. 2). For a better trade-off between the classification performance and the refinement of our model, we chose these eight features as the new feature set.
Fig. 2.
SFFS algorithm feature selection result; as the number of selected features increases, average scores and standard deviation of discriminative power on patients with and without severe MM fluctuated
Performance of new image features and clinic features
The performance of new feature set in classifying severe MM was scored 0.8263 AUC on the validation dataset (Fig. 3). The performance of clinic feature set was scored 0.7925 AUC on validation dataset (Fig. 3). Finally, we combined the new image features and clinic features together to generate the union feature set. The union feature set got 0.8358 on validation dataset (Fig. 3).
Fig. 3.
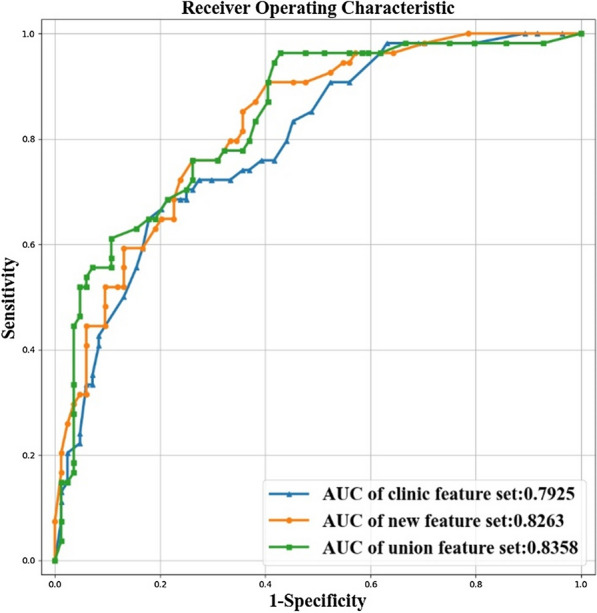
The ROC and AUC of new feature set, clinic feature set and union feature set on the validation dataset for classifying severe MM
The univariate performance of new image features and clinic features on the whole dataset as well as their definitions were listed in Table 2. Five new image features, including firstorder_Energy_R, firstorder_Entropy_B, Coarseness_NGTDM, PPAweight_u20R and glcm_shade_135, had the univariate AUC scores higher than 0.70. There was only one clinic feature, AreaPPA, had the individual AUC score higher than 0.70.
Table 2.
New image features–description and properties
| New image features | Clinic features | ||||
|---|---|---|---|---|---|
| FeatureIndex | Description | AUC | FeatureIndex | Description | AUC |
| Firstorder_Energy_R | The intensity distribution of PPA | 0.8471 ± 0.0023 | AreaPPA | The area of PPA | 0.8317 ± 0.0226 |
| Firstorder_Entropy_B | The intensity distribution of PPA | 0.8369 ± 0.0377 | Tilt | The tilt of optic disc | 0.6742 ± 0.0620 |
| Coarseness_NGTDM | The texture pattern of PPA | 0.8176 ± 0.0243 | Dist_MD | The distance between macula and optic disc | 0.6013 ± 0.0259 |
| PPAweight_u20R | The intensity distribution of PPA | 0.7886 ± 0.0356 | AreaDisc | The area of optic disc | 0.5670 ± 0.0683 |
| glcm_shade_135 | The texture pattern of PPA | 0.7085 ± 0.0339 | Angle_MD | The angle of the horizonal and Dist_MD | 0.5562 ± 0.0627 |
| PPAweight_u30R | The intensity distribution of PPA | 0.6727 ± 0.0807 | Torsion | The torsion of optic disc | 0.4649 ± 0.0362 |
| Fourier_Circularity_PPA | The shape of PPA | 0.6632 ± 0.0401 | |||
| DiscCurvature13 | The shape of optic disc | 0.6547 ± 0.0589 | |||
Statistics distribution of each feature on patients with and without severe MM
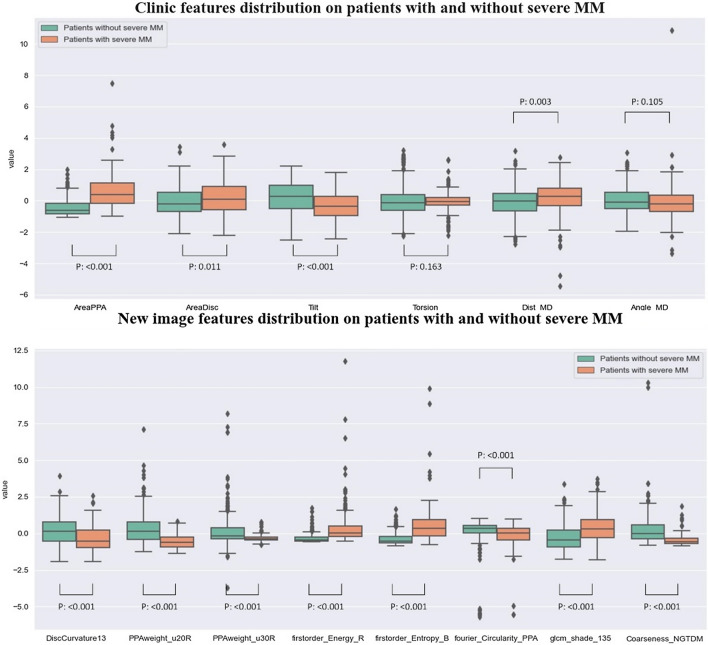
The feature selection phase has ensured the new image features had statistical discriminative power on patients with and without severe MM (student’s t test, p < 0.05). The boxplot figure has intuitively displayed the intra-class distribution of new image features and clinic features (Fig. 4) on patients with and without severe MM. All of the new image features and four clinic features (except for Torsion and Angle_MD) had significant differences between patients with and without severe MM (P < 0.05).
Fig. 4.
The boxplot of eight new image features and six clinic features
Correlation between new image features and clinic features
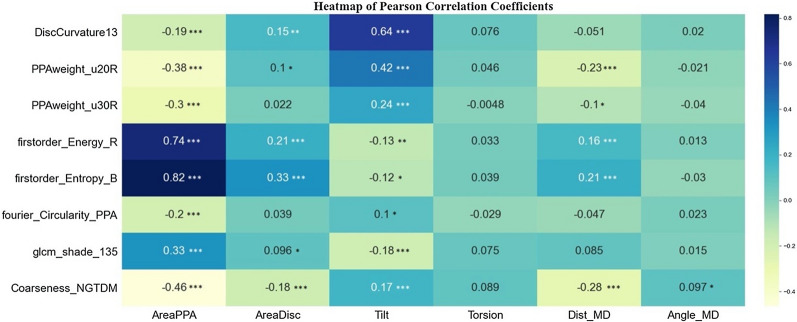
The correlation coefficients between new image features and clinic features were quantitatively evaluated by Pearson Correlation Coefficient and shown in Fig. 5. Among the new image features, firstorder_Energy_R and firstorder_Entropy_B had high correlation coefficient scores with AreaPPA. The feature firstorder_Energy_R occupied the PPA area factors, so it was thought to be dependent with AreaPPA. The feature firstorder_Entropy_B depicted the entropy of the region rarely effected by area, so it was thought to be an independent factor. The other pairs of new image features had little relevancy with the clinic features. Thus, they were thought to be new findings.
Fig. 5.
Correlation between new image features and clinical factors. (*p value < 0.05. **p value < 0.01. ***p value < 0.001. no marker: p value > 0.05)
Visualization of new image features and clinic features
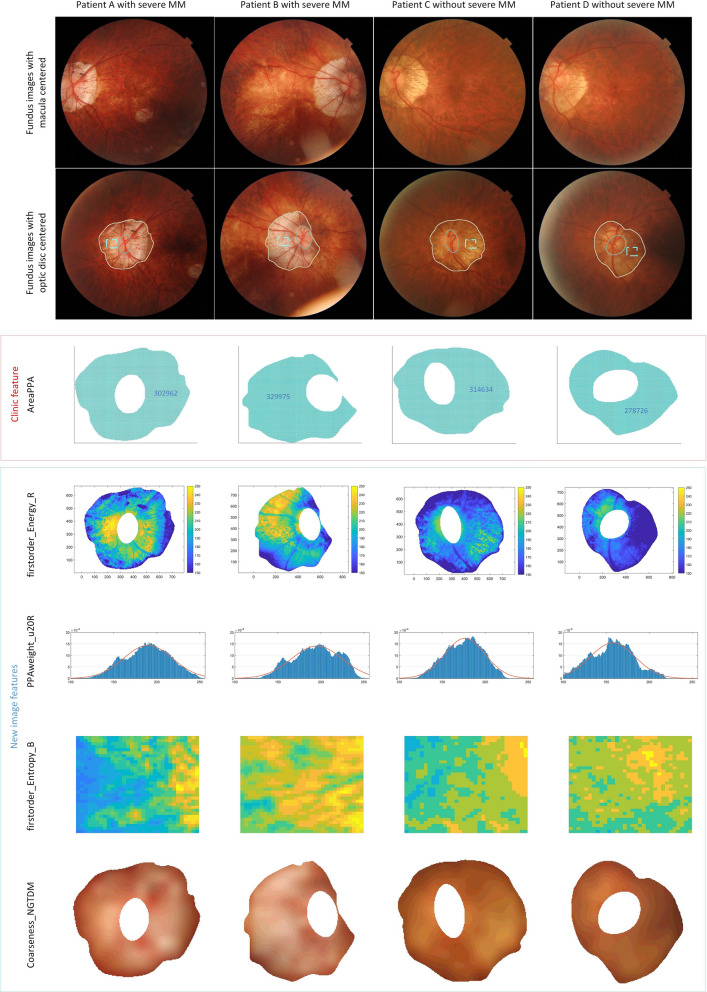
Four new image features (AUC > 0.75) and one clinic feature AreaPPA (AUC > 0.75) were visualized in four cases consisting of patients both with and without severe MM to help understanding (Fig. 6).
Fig. 6.
Visualization of new image features and clinic proposed features. Column 1 and 2: fundus images of two patients with severe MM. Column 3 and 4: fundus images of two patients without severe MM. The first row: the macula-centered fundus images. The second row: the corresponding optic disc-centered fundus images. The third row: AreaPPA (PPA areas. We chose patients with similar PPA areas as examples, only by counting areas could not distinguish if a patient had severe MM or not). The fourth row: firstorder_Energy_B (energy of PPA). Higher values of firstorder_Energy_B meant brighter intensity in PPA region. The fifth row: PPAweight_u20R (pixel distribution of PPA). Higher average values of PPAweight_u20R meant more rapid fluctuation of pixel values along broadwise direction of PPA region. The sixth row: firstorder_Entropy_B (entropy of PPA). Higher value of firstorder_Entropy_B meant more complexity pixel values distribution in PPA region (zoomed from the rectangular in row 2rd fundus images). The seventh row: Coarseness_NGTDM (Coarseness of PPA). Higher Coarseness_NGTDM values meant a lower spatial change rate and a locally less nonuniform texture
Analysis of subclass of MM
In the whole data set, patients were divided into six subclasses: C0, C1, PDCA, MDCA, C3, C4. We explored how the values of MM-related features would change along with these different subclasses. For the four new image features (AUC > 0.75) and one clinic feature AreaPPA (AUC > 0.75), their mean values and standard deviation in each subclass were estimated on the whole data set (all subclasses had been labeled based on clinical reports), as shown in Fig. 7. It showed that the mean values of these features changed significantly at two places: one was between C0 and C1, another was between PDCA and MDCA.
Fig. 7.
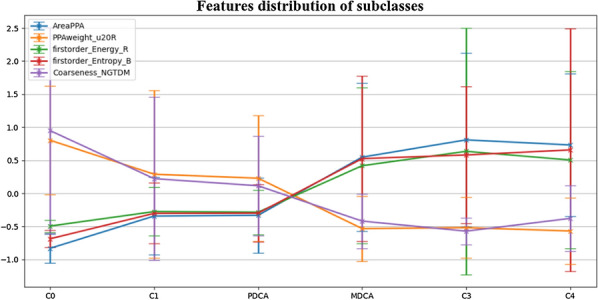
The mean values and standard deviation values of features changed among subclasses. Significant changes existed between C0 and C1, and PDCA and MDCA
Discussion
In this study, we applied radiomics method into the field of ophthalmology to explore comprehensive MM-related features. Our main findings were as follows: (a) eight new image features were discovered to have better performance than clinic features in classifying severe MM patients. These features were difficult to be perceived in clinic; (b) an effective machine learning tool for automatically extracting and decoding various MM-related image features was developed; (c) marked changes between PDCA and MDCA was discovered by both new image features and clinic features.
We have found eight new image features based on their performances for classifying patients with and without severe MM. The overall performance of the new feature set was higher than the clinic feature set. The highest score was achieved from the combination of these two sets, which implied that the new image features revealed more characteristics related to MM and had complementary values to clinic features. Supporting cases were shown in Fig. 6. The new image features enabled the right diagnosis to complex cases, while in comparison the conventional clinical factor of PPA area failed.
Most of the new image features were new findings. Among them, seven out of eight were completely new factors by pearson correlation analysis, while the only common factor was relevant to the area of PPA. This common factor consistently supported the previous study results that PPA area was a risk factor for the development of MM. The seven new image features indicated that changes of intensity and texture also occurred in optic disc region between patients with and without MM in the cohort. Specifically, the feature firstorder_Energy_R indicated that the PPA of MM cases were bigger and brighter than those without MM in this study. The feature firstorder_Entropy_B indicated that the color level of PPA of MM cases was denser. And the feature Coarseness_NGTDM indicated the PPA of MM cases had locally more non-uniform texture. The highest performance of new features was 0.8471 AUC, implying comparability to the classic indicator PPA area (0.8317 AUC).
The new image features provided a more comprehensive view for the characteristics of the development of MM. The intensity, texture and high order morphology properties revealed by those features could only be sensuously perceived but difficult to interpret by routine clinic. However, this subjective operator-dependent expertise and experience may often play critical role on making accurate diagnosis for complex cases. With the capacity of providing quantitative and descriptive imaging characteristics of MM status, our study thus would serve to transfer the experience of retinal specialists to practical indicators, which therefore might inspire standardizing the diagnosis.
Moreover, the feature extraction and screening approach in this study was highly automatic. Previously, several optic disc morphologic changes were reported to be significantly associated with the progression of high myopia and the development and progression of MM [5, 6, 31–33]. However, these clinic features were measured manually and separately, and highly depended on the ophthalmologists’ experience. In addition, with difficulty to access the retinal specialists, junior ophthalmologists lacking of experience might not always be able to make correct clinical decisions. In this research, the fundus images were only required to be annotated for ROI regions in advance. High throughput features were extracted in automatic processing manner via computer-aided technique and MM-related features were filtered out automatically via an AI model. Our approach illuminated capability for rapid population-based screening, by providing time- and labor- efficient, and objective and quantitative measurement.
Another interesting finding in the present study was that, when analyzing changes in mean values of new image features and clinic features between different subclasses, most of the features changed remarkably in two places. One was from C0 to C1, another was from PDCA to MDCA. The substantial change from C0 to C1 was not hard to understand and mainly because in C0 there normally no fundus changes, while in contrast, C1 tended to have tessellated fundus. Interestingly and surprisingly, our study found that there was also a distinctive variation from PDCA to MDCA among most features, including both new image features and clinic features; and in comparison, the changes from MDCA to C3 and C4 were relatively slight. To avoid the possibility that the variation of features from PDCA to MDCA might be a common result that they were separately categorized, we additionally categorized them into the same group and repeated our experiments. The new selected features also illustrated large variations from PDCA to MDCA (Please refer to the Additional file 1). Previous studies classified PDCA, MDCA and more serious grades as MM [4, 40].
Our study suggested that MM could be further subdivided. For patients with PDCA, the fundus changes were mainly around the optic disc, and no significant lesions were found in the macular region. Thereby, it was more appropriate to classify PDCA as mild MM. It was reported that patients with PDCA had thicker macular choroidal thickness and better BCVA than patients with MDCA and severer MM in elder patients [24]. However, whether the elder patients with PDCA would progress to MDCA had not been reported in the literature. Hence, MM might to be further subdivided so that PDCA would be classified as mild MM while MDCA along with more serious grades defined as severe MM for the elderly population. This suggested further classification might be helpful for prognostic evaluation and follow-up plan guidance for different age groups. In the future study, we would collect follow-up data to further test our hypothesis.
Conclusions
In conclusion, this study was the first effort on employing radiomics method to precisely quantify MM-related features that otherwise were difficult to be perceived in the routine clinic. And it was the first time to potentially substitute the subjective evaluation factors for the characteristics of different grades of MM based on retinal specialists’ experience with the objective and quantitative evaluation system. In the future, more follow-up studies are needed to prove that AI could help realize MM early prediction.
Supplementary Information
Additional file 1: Supplementary Material.
Acknowledgements
The authors thank all participants for their interest in the study. Supported by the Medical engineering cross project of Shanghai Jiao Tong University (YG2019ZDA26), Key Discipline of Public Health–Eye health in Shanghai (15GWZK0601), Shanghai Science and Technology Commission Research Project (17ZR1426900), the National Natural Science Foundation of China (81703287), and Overseas High-end Research Team–Eye health in Shanghai (GWTD2015S08).
Abbreviations
- MM
Myopic maculopathy
- PDCA
Peripapillary diffuse chorioretinal atrophy
- MDCA
Macular diffuse chorioretinal atrophy
- META-PM
International Photographic Classification and Grading System for myopic maculopathy
- C0
No macular lesions
- C1
Tessellated fundus
- C2
Diffuse chorioretinal atrophy
- C3
Patchy chorioretinal atrophy
- C4
Macular atrophy
- PPA
Peripapillary atrophy
- ROI
Regions of interest
- SFFS
Sequential Floating Forward Selection
- ROC
Receiver Operating Characteristic
- AUC
Area Under the Curve
Authors’ contributions
YD, QC and YF analyzed and interpreted the patient data regarding the MM progress and were the major contributors in writing the manuscript. JZ, JH and HZ provided the patient data. DS and BX helped design the experiment. DF, MF and XW revised the manuscript. LW and XX guided the whole work. All authors read and approved the final manuscript.
Funding
This study is supported by the Medical engineering cross project of Shanghai Jiao Tong University (Grant No.: YG2019ZDA26), Key Discipline of Public Health–Eye health in Shanghai (Grant No.: 15GWZK0601), Shanghai Science and Technology Commission Research Project (Grant No.: 17ZR1426900), the National Natural Science Foundation of China (Grant No.: 81703287), and Overseas High-end Research Team–Eye health in Shanghai (Grant No.: GWTD2015S08). The sponsors or funding organization had no role in the design or conduct of this research.
Availability of data and materials
The data that support the findings of this study are available from Shanghai General Hospital but restrictions apply to the availability of these data, which were used under license for the current study, and so are not publicly available. Data are however available from the authors upon reasonable request and with permission of Shanghai General Hospital.
Declarations
Ethics approval and consent to participate
The patients included in this study were recruited in the Shanghai High Myopia Study for Adults. The study protocol has been described in our previous study23 and was approved by the Medical Ethics Committee of Shanghai General Hospital, Shanghai Jiao Tong University School of Medicine, consistent with the Declaration of Helsinki. Written informed consent was obtained from all study participants. The study (# NCT03446300) was registered at http://www.clinicaltrials.gov.
Consent for publication
Not applicable.
Competing interests
The following authors have no proprietary or commercial interest in any materials discussed in this article: Yuchen Du, Qiuying Chen, Ying Fan, Jianfeng Zhu, Jiangnan He, Haidong Zou, Dazhen Sun, Bowen Xin, David Feng, Michael Fulham, Xiuying Wang, Lisheng Wang, Xun Xu. All authors attest that they have read and followed the Author Information at https://www.biomedcentral.com/getpublished/editorial-policies#competing+interests.
Footnotes
Publisher's Note
Springer Nature remains neutral with regard to jurisdictional claims in published maps and institutional affiliations.
Yuchen Du, Qiuying Chen and Ying Fan contributed equally as first authors
Contributor Information
Lisheng Wang, Email: lswang@sjtu.edu.cn.
Xun Xu, Email: drxuxun@sjtu.edu.cn.
References
- 1.Morgan IG, Ohno-Matsui K, Saw SM. Myopia. Lancet. 2012;379(9827):1739–1748s. doi: 10.1016/S0140-6736(12)60272-4. [DOI] [PubMed] [Google Scholar]
- 2.Ohno-Matsui K, Akiba M, Moriyama M, et al. Acquired optic nerve and peripapillary pits in pathologic myopia. Ophthalmology. 2012;119(8):1685–1692. doi: 10.1016/j.ophtha.2012.01.047. [DOI] [PubMed] [Google Scholar]
- 3.Fricke TR, Jong M, Naidoo KS, et al. Global prevalence of visual impairment associated with myopic macular degeneration and temporal trends from 2000 through 2050: systematic review, meta-analysis and modelling. Br J Ophthalmol. 2018;102(7):855–862. doi: 10.1136/bjophthalmol-2017-311266. [DOI] [PMC free article] [PubMed] [Google Scholar]
- 4.Ohno-Matsui K, Kawasaki R, Jonas JB, et al. International Photographic classification and grading system for myopic maculopathy. Am J Ophthalmol. 2015;159(5):877–883. doi: 10.1016/j.ajo.2015.01.022. [DOI] [PubMed] [Google Scholar]
- 5.Fang YX, Yokoi T, Nagaoka N, et al. Progression of myopic maculopathy during 18-year follow-up. Ophthalmology. 2018;125(6):863–877. doi: 10.1016/j.ophtha.2017.12.005. [DOI] [PubMed] [Google Scholar]
- 6.Yan YN, Wang YX, Yang Y, et al. Ten-year progression of myopic maculopathy the beijing eye study 2001–2011. Ophthalmology. 2018;125(8):1253–1263. doi: 10.1016/j.ophtha.2018.01.035. [DOI] [PubMed] [Google Scholar]
- 7.Chen QY, He JN, Yin Y, et al. Impact of the morphologic characteristics of optic disc on choroidal thickness in young myopic patients. Invest Ophthalmol Vis Sci. 2019;60(8):2958–2967. doi: 10.1167/iovs.18-26393. [DOI] [PubMed] [Google Scholar]
- 8.Aerts H, Velazquez ER, Leijenaar RTH, et al. Decoding tumour phenotype by noninvasive imaging using a quantitative radiomics approach. Nat Commun. 2014;5:8. doi: 10.1038/ncomms5006. [DOI] [PMC free article] [PubMed] [Google Scholar]
- 9.Gillies RJ, Kinahan PE, Hricak H. Radiomics: images are more than pictures they are data. Radiology. 2016;278(2):563–577. doi: 10.1148/radiol.2015151169. [DOI] [PMC free article] [PubMed] [Google Scholar]
- 10.Lambin P, Leijenaar RTH, Deist TM, et al. Radiomics: the bridge between medical imaging and personalized medicine. Nat Rev Clin Oncol. 2017;14(12):749–762. doi: 10.1038/nrclinonc.2017.141. [DOI] [PubMed] [Google Scholar]
- 11.Lambin P, Rios-Velazquez E, Leijenaar R, et al. Radiomics: Extracting more information from medical images using advanced feature analysis. Eur J Cancer. 2012;48(4):441–446. doi: 10.1016/j.ejca.2011.11.036. [DOI] [PMC free article] [PubMed] [Google Scholar]
- 12.Li H, Xu C, Xin B, et al. 18 F-FDG PET/CT Radiomic analysis with machine learning for identifying bone marrow involvement in the patients with suspected relapsed acute leukemia. Theranostics. 2019;9(16):4730. doi: 10.7150/thno.33841. [DOI] [PMC free article] [PubMed] [Google Scholar]
- 13.Zhou Y, Ma XL, Pu LT, et al. Prediction of overall survival and progression-free survival by the 18 F-FDG PET/CT radiomic features in patients with primary gastric diffuse large B-cell lymphoma. Contrast Media Mol Imaging. 2019;2019(5):1–9. doi: 10.1155/2019/5963607. [DOI] [PMC free article] [PubMed] [Google Scholar]
- 14.Wang L, Dong T, Xin B, et al. Integrative nomogram of CT imaging, clinical, and hematological features for survival prediction of patients with locally advanced non-small cell lung cancer. Eur Radiol. 2019;29(6):2958–2967. doi: 10.1007/s00330-018-5949-2. [DOI] [PubMed] [Google Scholar]
- 15.Vallières M, Freeman CR, Skamene SR, et al. A radiomics model from joint FDG-PET and MRI texture features for the prediction of lung metastases in soft-tissue sarcomas of the extremities. Phys Med Biol. 2015;60(14):5471–5496. doi: 10.1088/0031-9155/60/14/5471. [DOI] [PubMed] [Google Scholar]
- 16.Huang Y, Liang C, He L, et al. Development and validation of a radiomics nomogram for preoperative prediction of lymph node metastasis in colorectal cancer. J Clin Oncol. 2016;34:2157–2164. doi: 10.1200/JCO.2015.65.9128. [DOI] [PubMed] [Google Scholar]
- 17.Nie, Shi, LM, et al. Rectal Cancer: Assessment of Neoadjuvant Chemoradiation Outcome based on Radiomics of Multiparametric MRI. Clinical Cancer Research. 2016. [DOI] [PMC free article] [PubMed]
- 18.Li Z, He Y, Keel S, et al. Efficacy of a deep learning system for detecting glaucomatous optic neuropathy based on color fundus photographs. Ophthalmology. 2018;125(8):1199–1206. doi: 10.1016/j.ophtha.2018.01.023. [DOI] [PubMed] [Google Scholar]
- 19.Grassmann F, Mengelkamp J, Brandl C, et al. A deep learning algorithm for prediction of age-related eye disease study severity scale for age-related macular degeneration from color fundus photography. Ophthalmology. 2018;125(9):1410–1420. doi: 10.1016/j.ophtha.2018.02.037. [DOI] [PubMed] [Google Scholar]
- 20.Liu H, Li L, Wormstone IM, et al. Development and validation of a deep learning system to detect glaucomatous optic neuropathy using fundus photographs. JAMA Ophthalmol. 2019;137(12):1353–1360. doi: 10.1001/jamaophthalmol.2019.3501. [DOI] [PMC free article] [PubMed] [Google Scholar]
- 21.Ting DSW, Cheung CY-L, Lim G, et al. Development and validation of a deep learning system for diabetic retinopathy and related eye diseases using retinal images from multiethnic populations with diabetes. JAMA. 2017;318(22):2211–2223. doi: 10.1001/jama.2017.18152. [DOI] [PMC free article] [PubMed] [Google Scholar]
- 22.Parmar, C., P. Grossmann, J. Bussink, et al. Machine Learning methods for Quantitative Radiomic Biomarkers. Entific Reports. [DOI] [PMC free article] [PubMed]
- 23.Chen Q, He J, Hu G, et al. Morphological characteristics and risk factors of myopic maculopathy in an older high myopia population-based on the new classification system (ATN) Am J Ophthalmol. 2019;208:356–366. doi: 10.1016/j.ajo.2019.07.010. [DOI] [PubMed] [Google Scholar]
- 24.Fang YX, Du R, Nagaoka N, et al. OCT-based diagnostic criteria for different stages of myopic maculopathy. Ophthalmology. 2019;126(7):1018–1032. doi: 10.1016/j.ophtha.2019.01.012. [DOI] [PubMed] [Google Scholar]
- 25.Yokoi T, Jonas JB, Shimada N, et al. Peripapillary diffuse chorioretinal atrophy in children as a sign of eventual pathologic myopia in adults. Ophthalmology. 2016;123(8):1783–1787. doi: 10.1016/j.ophtha.2016.04.029. [DOI] [PubMed] [Google Scholar]
- 26.Yokoi T, Zhu D, Bi HS, et al. Parapapillary diffuse choroidal atrophy in children is associated with extreme thinning of parapapillary choroid. Invest Ophthalmol Vis Sci. 2017;58(2):901–906. doi: 10.1167/iovs.16-20652. [DOI] [PubMed] [Google Scholar]
- 27.de Barry PJ. Boor-Fix dual functionals and algorithms for Tchebycheffian B-spline curves. Constr Approx. 1996;12(3):385–408. doi: 10.1007/BF02433050. [DOI] [Google Scholar]
- 28.Hu MK. Visual Pattern Recognition by Moment Invariants. Information Theory Ire Transactions. 1962;8(2):179–187. doi: 10.1109/TIT.1962.1057692. [DOI] [Google Scholar]
- 29.Persoon, E.,K. S. Fu. Shape discrimination using Fourier descriptors. IEEE Trans System Man Cybernet Smc. 1977. [DOI] [PubMed]
- 30.van Griethuysen JJM, Fedorov A, Parmar C, et al. Computational Radiomics System to Decode the Radiographic Phenotype. Can Res. 2017;77(21):E104–E107. doi: 10.1158/0008-5472.CAN-17-0339. [DOI] [PMC free article] [PubMed] [Google Scholar]
- 31.Park HY, Lee K, Park CK. Optic disc torsion direction predicts the location of glaucomatous damage in normal-tension glaucoma patients with myopia. Ophthalmology. 2012;119(9):1844–1851. doi: 10.1016/j.ophtha.2012.03.006. [DOI] [PubMed] [Google Scholar]
- 32.Shin HY, Park HYL, Park CK. The effect of myopic optic disc tilt on measurement of spectral-domain optical coherence tomography parameters. Br J Ophthalmol. 2015;99(1):69–74. doi: 10.1136/bjophthalmol-2014-305259. [DOI] [PubMed] [Google Scholar]
- 33.Tay E, Seah SK, Chan SP, et al. Optic disk ovality as an index of tilt and its relationship to myopia and perimetry. Am J Ophthalmol. 2005;139(2):247–252. doi: 10.1016/j.ajo.2004.08.076. [DOI] [PubMed] [Google Scholar]
- 34.Zhang XD. Illustration of SSMD, z Score, SSMD*, z* Score, and t Statistic for Hit Selection in RNAi High-Throughput Screens. J Biomol Screen. 2011;16:775–785. doi: 10.1177/1087057111405851. [DOI] [PubMed] [Google Scholar]
- 35.Ellis KJ, Shypailo RJ, Hardin DS, Perez MD, Motil KJ, Wong WW, Abrams SA. Z score prediction model for assessment of bone mineral content in pediatric diseases. J Bone Mineral Res. 2001;16(9):1658–1664. doi: 10.1359/jbmr.2001.16.9.1658. [DOI] [PubMed] [Google Scholar]
- 36.Peng H, Long F, Ding C. Feature selection based on mutual information criteria of max-dependency, max-relevance, and min-redundancy. IEEE Trans Pattern Anal Mach Intell. 2005;27:1226–1238. doi: 10.1109/TPAMI.2005.159. [DOI] [PubMed] [Google Scholar]
- 37.Bruning, J.,B. L. Kintz. Computational Handbook of Statistics. 1968.
- 38.FJ Ferri P Pudil M Hatef et al 1994Comparative study of techniques for large-scale feature selection* *This work was suported by a SERC grant GR/E 97549. The first author was also supported by a FPI grant from the Spanish MEC, PF92 73546684. Machine Intelligence and Pattern Recognition. E. S. Gelsema and L. S Kanal, North-Holland 16 403 413
- 39.Pudil P, Novovičová J, Kittler J. Floating search methods in feature selection. Pattern Recogn Lett. 1994;15(11):1119–1125. doi: 10.1016/0167-8655(94)90127-9. [DOI] [Google Scholar]
- 40.Ohno-Matsui K, Lai TYY, Lai CC, et al. Updates of pathologic myopia. Prog Retin Eye Res. 2016;52:156–187. doi: 10.1016/j.preteyeres.2015.12.001. [DOI] [PubMed] [Google Scholar]
Associated Data
This section collects any data citations, data availability statements, or supplementary materials included in this article.
Supplementary Materials
Additional file 1: Supplementary Material.
Data Availability Statement
The data that support the findings of this study are available from Shanghai General Hospital but restrictions apply to the availability of these data, which were used under license for the current study, and so are not publicly available. Data are however available from the authors upon reasonable request and with permission of Shanghai General Hospital.


