

Abstract
Objectives
This study aimed to investigate whether child marriage had causal effects on unmet needs for modern contraception, and unintended pregnancy, by estimating the marginal (population-averaged) treatment effect of child marriage.
Design
This study used secondary data from the Nepal Demographic and Health Survey 2016. Applying one-to-one nearest-neighbour matching with replacement within a calliper range of ±0.01, 15–49 years old women married before the age of 18 were matched with similar women who were married at 18 or above to reduce selection bias.
Setting
Nationally representative population survey data.
Participants
The sample consisted of 7833 women aged 15–49 years who were married for more than 5 years.
Outcome measures
Unmet needs for modern contraception and unintended pregnancy.
Results
The matching method achieved adequate overlap in the propensity score distributions and balance in measured covariates between treatment and control groups with the same propensity score. Propensity score matching analysis showed that the risk of unmet needs for modern contraception, and unintended pregnancy among women married as children were a 14.3 percentage point (95 % CI 10.3 to 18.2) and a 10.1 percentage point (95 % CI 3.7 to 16.4) higher, respectively, than among women married as adults. Sensitivity analysis indicated that the estimated effects were robust to unmeasured covariates.
Conclusions
Child marriage appears to increase the risk of unmet needs for modern contraception and unintended pregnancy. These findings call for social development and public health programmes that promote delayed entry into marriage and childbearing to improve reproductive health and rights.
Keywords: reproductive medicine, sexual medicine, social medicine
Strengths and limitations of this study.
This study is the first analysis to estimate the causal effect of child marriage on reproductive health outcomes by using propensity score matching.
The matching method was instrumental in significantly reducing selection bias and imbalances between treatment groups.
Another strength of this study is the use of nationally representative data with a high response rate.
One limitation is that unmeasured predictors of the outcome variables might play a role in the relationship found in the present study; however, a sensitivity analysis for hidden bias indicated that the estimated effects were robust to unmeasured covariates.
Another limitation is that a few of the covariates used to estimate propensity scores may not be pretreatment variables.
Introduction
Access to family planning is recognised globally as a serious public health and human rights issue.1 The Sustainable Development Goals Target 3.7 calls for universal access to family planning methods, information and education by 2030. Family planning improves women’s health and saves lives by reducing high-risk pregnancy, unintended pregnancy and associated unsafe abortions.2 If all women wanting to avoid or delay childbearing used effective contraception, there would be a 90% reduction of abortion deaths3 and a 28% reduction of all maternal deaths.4 The cost of meeting the need for modern contraception in low-income and middle-income countries (LMICs) is estimated to be US$1.20 per capita per year.4
However, an estimated 214 million women had an unmet need for family planning in LMICs in 2017. Most of them (115 million) did not use any contraceptive methods. From that population segment, approximately 59 million women relied on traditional methods.5 Consequently, in these countries, 43% of all pregnancies were unintended, which either they occurred too soon or were unwanted.6 Unmet needs for family planning accounted for 84% of all unintended pregnancies.5
Nepal has made impressive progress in family planning. The country has shown a remarkable decline in the total fertility rate from 4.6 children per woman to 2.3 between 1996 and 2016.7 8 Modern contraceptive use among Nepali women increased from 26% to 43% in the same period.7 8 However, half of all pregnancies in the country were unintended in 2014.9 Moreover, the adolescent fertility rate remains high at 88 per 1000 women, and 17% of adolescents aged 15–19 years bore a child during adolescence. Unmet needs for family planning among adolescent married girls are considered to be a major driver for early pregnancy and unintended pregnancy.10 The contraceptive prevalence rate among adolescent married girls in Nepal is disproportionately low compared with married women aged 20–49 (15% vs 45%).8
Child marriage, defined as a formal marriage or informal union before the age of 18,11 is pervasive in Nepal. In the country, almost all adolescent pregnancies and childbirths occur within the context of child marriage. About one in two married women have their first child by the age of 19, usually soon after marriage.8 Despite the minimum legal marriage age of 20 years, approximately 40% of Nepali women aged 20–24 had been married before they reached the age of 18.8 In Nepal, a range of demographic and socioeconomic factors (eg, religion, ethnicity, ecological zone, economic status, education, place of residence) are associated with child marriage.12
Evidence suggests that child marriage may play a role in reproductive health. Several cross-sectional studies have found associations of child marriage with contraceptive non-use before first pregnancy,13 unintended pregnancy,13–15 rapid repeat births14 16 and terminated pregnancy.13–17 However, the effect of child marriage on these reproductive health outcomes appears inconclusive for two reasons. First, the model specification in previous studies may be considered inadequate. Researchers typically used a single set of control variables for several outcome variables, including fertility, in their regression models.13–17 As a result, parity that affects short birth intervals, unintended pregnancy, and terminated pregnancy was not controlled for in their analyses. Therefore, the results of previous studies could be biased due to residual confounding. Second, previous evidence is inconsistent. For instance, Kamal15 and Nasrulla et al14 reported positive associations between child marriage and unintended pregnancy in Bangladesh and Pakistan, whereas Raj et al16 and Godha et al13 did not find significant associations in India and Bangladesh. Moreover, causal relationships have been overlooked due to methodological limitations. Researchers claim that causality cannot be assumed in their regression analyses.13 14 16 Hence, the causal effects of child marriage on reproductive health outcomes are unclear in the literature. Furthermore, to the best of our knowledge, no researchers have examined the effect of child marriage on unmet needs for modern contraception.
This study aimed to investigate whether child marriage had causal effects on unmet needs for modern contraception, and unintended pregnancy, by estimating the marginal (population-averaged) treatment effect of child marriage.
Methods
Study design and data
This study used secondary data from the Nepal Demographic and Health Survey (NDHS) 2016, which was a cross-sectional study. The survey provides detailed information about socio-demographic characteristics, the levels and determinants of fertility, family planning, infant and child mortality, maternal and child health, and women’s empowerment.8 The survey sample represented the national and provincial levels. The sample was stratified and selected, using two-stage random sampling in rural areas and three-stage random sampling in urban areas. Complete interviews were conducted with 12 862 women of reproductive age (15–49 years) from the preselected households. No replacements were allowed to reduce bias. The response rate was 98%. In this study, 7833 women aged 15–49 years who were married for more than 5 years were included for analysis. For women who gave birth to more than one child, only the most recent pregnancy was analysed to minimise recall bias and missing data. The sample had no missing data except for 15 women who did not know their husband’s educational attainment.
Measures
The outcome variables were unmet needs for modern contraception, and unintended pregnancy. Unmet needs for modern contraceptive methods were defined as fecund, married women who had sex in the last 3 months and want to limit or delay childbearing at least 2 years, but who are not using any modern contraceptive methods. Modern methods of contraception include female and male sterilisation, oral hormonal pills, the intrauterine contraceptive device, male and female condoms, injectables, implants, vaginal barrier methods, standard days method, lactational amenorrhoea method and emergency contraception.18 Unintended pregnancy was defined as an unwanted or mistimed pregnancy or an unwanted or mistimed birth. This outcome was assessed by the question ‘At the time you became pregnant, did you want to become pregnant then, did you want to wait until later, or did you not want to have any (more) children at all?’ Analysis using this variable was restricted to pregnant women at the time of the survey and women who gave birth to a child in the 5 years preceding the survey.
The treatment variable was a formal marriage or informal union before the age of 18. This represents non-randomised self-selection into treatment and control groups. A dichotomous variable was created for child marriage, based on self-reported age at first marriage. The respondents were coded as ‘1’ if they were married or in a union before the age of 18, and ‘0’ if otherwise.
The demographic and socioeconomic variables known to be associated with child marriage and the outcome variables were selected as covariates. These were used to estimate the propensity score, which is the conditional probability of marrying before the age of 18, given covariates considered in this study. A directed acyclic graph was also drawn to depict the hypothesis of causal relationships relevant to this research and find a minimal sufficient adjustment set. The selected covariates were the women’s and husbands’ age (15–24, 25–34, >34); residence in urban areas; ecological zone (mountain, hill, lowlands); ethnic group (advantaged, disadvantaged); religion (Hindu, other); household economic status (poor, middle income, rich); the women’s and husbands’ levels of educational attainment (no education or primary level, secondary or higher level); the women’s occupation (no job or low skilled jobs, paid skilled jobs); and parity (0 or 1, 2 or 3, ≥4). The women’s occupation was categorised into two groups: (1) ‘no job or low skilled jobs’ (eg, agricultural job, and unskilled manual jobs) and (2) ‘paid skilled jobs’ (eg, professional, clerical or services job, and skilled manual jobs). Ethnic groups, such as Dalit, Janajati and Muslims, were categorised as ‘disadvantaged’ and other groups as ‘advantaged.’
Data analysis
This study used propensity score matching (PSM)19 to draw causal inferences about the effect of child marriage on unmet needs for modern contraception and unintended pregnancy. PSM is a way to reduce selection bias in treatment effect estimates due to confounding factors by creating and matching treatment and control groups that are as similar as possible on the observed background characteristics.20 PSM analysis in this study was comprised of five steps. First, the propensity scores were estimated, using the pscore Stata module20 while controlling for all the covariates mentioned above. In the second step, treatment and control units were matched by the closeness of their propensity scores, and units that without a match or with missing data were excluded. One-to-one nearest-neighbour matching with replacement within a calliper range of ±0.01 was performed using the psmatch2 Stata module.21 The third step was to compute mean differences in outcomes between the two groups, which represents the average treatment effect on the treated. To enhance accuracy, bootstrapping with 1000 replications was carried out to estimate CIs. In the fourth step, overlap and common support of propensity score distributions were checked through visual inspection. Using a kernel density plot, balance between the treatment and control groups was evaluated to identify the overlap of propensity scores. In the fifth step, balancing tests were performed in three different ways, using the pstest command. For each covariate included in the propensity score estimation model, standardised percentage bias before and after matching were assessed.22 Arbitrary cut-offs for balance diagnostics (eg, <±10% for the standardised percentage difference) are commonly used in the medical literature.23 Furthermore, t-test was used to compare each covariate distribution across the treatment and control groups. The overall measures of covariate imbalances before and after matching were also analysed, using the pseudo-R2 statistic.24 After matching, pseudo-R2 should be reasonably low (ie, below 0.05) to establish that there are no systematic differences in the covariate distributions between the two groups. All analyses were carried out, using Stata V.16 (StataCorp).
Sensitivity analysis for hidden bias
Sensitivity analysis was undertaken to assess the robustness of estimated treatment effects to an unmeasured confounder as PSM rests on the unconfoundedness (no confounding) assumption, which is untestable.25 This analysis was carried out, using a Mantel-Haenszel bounds procedure.26
Patient and public involvement
Participants and the public were not involved in the study design or planning of the data analysis.
Results
Characteristics of participants
The NDHS 2016 dataset generated a sample of 4731 currently married women who married before the age of 18 and 3102 currently married women who married at a later age. In this sample, the prevalence of child marriage was 58.9%. Table 1 shows the distribution of demographic and socioeconomic characteristics of the participants. The background characteristics differed between women married as children and those married as adults. The women who married as children were, on average, poorer, less educated and more disadvantaged in terms of ethnicity. They were also more likely to reside in lowland and rural areas and have either no job or a low-skilled job and higher parity.
Table 1.
Background characteristics of currently married Nepali women aged 15–49
| Variable | Participants (n=7833) | Child marriage (n=4731) | Adult marriage (n=3102) | |||
| Woman’s age | ||||||
| 15–24 years | 742 | (9.5) | 649 | (13.7) | 93 | (3.0) |
| 25–34 years | 3332 | (42.5) | 1920 | (40.6) | 1412 | (45.5) |
| >34 years | 3759 | (48.0) | 2162 | (45.7) | 1597 | (51.5) |
| Husband’s age | ||||||
| 15–24 years | 200 | (2.6) | 165 | (3.5) | 35 | (1.1) |
| 25–34 years | 2583 | (33.0) | 1576 | (33.3) | 1007 | (32.5) |
| >34 years | 5050 | (64.5) | 2990 | (63.2) | 2060 | (66.4) |
| Urban | 4980 | (63.6) | 2888 | (61.0) | 2092 | (67.4) |
| Ecological zone | ||||||
| Mountain | 552 | (7.1) | 319 | (6.7) | 233 | (7.5) |
| Hill | 3445 | (44.0) | 1917 | (40.5) | 1528 | (49.3) |
| Lowland | 3836 | (49.0) | 2495 | (52.7) | 1341 | (43.2) |
| Advantaged ethnic group | 4036 | (51.5) | 2361 | (49.9) | 1675 | (54.0) |
| Disadvantaged ethnic group | 3797 | (48.5) | 2370 | (50.1) | 1427 | (46.0) |
| Religion | ||||||
| Hindu | 6888 | (87.9) | 4130 | (87.3) | 2758 | (88.9) |
| Other religion | 45 | (12.1) | 601 | (12.7) | 344 | (11.1) |
| Economic status | ||||||
| Poor | 2243 | (28.6) | 1394 | (29.5) | 849 | (27.4) |
| Middle income | 2609 | (33.3) | 1740 | (36.8) | 869 | (28.0) |
| Rich | 2981 | (38.1) | 1597 | (33.8) | 1384 | (44.6) |
| Woman’s educational level | ||||||
| No education or primary education | 5353 | (68.3) | 3621 | (76.5) | 1732 | (55.8) |
| Secondary or higher education | 2480 | (31.7) | 1110 | (23.5) | 1370 | (44.2) |
| Husband’s educational level* | ||||||
| No education or primary education | 3339 | (42.7) | 2287 | (48.4) | 1052 | (34.0) |
| Secondary or higher education | 4479 | (57.3) | 2438 | (51.6) | 2041 | (66.0) |
| Occupation | ||||||
| No job or low skilled job | 6573 | (83.9) | 4118 | (87.0) | 2455 | (79.1) |
| Paid skilled job | 1260 | (16.1) | 613 | (13.0) | 647 | (20.9) |
| Parity | ||||||
| 0 or 1 | 1058 | (13.5) | 458 | (9.7) | 600 | (19.3) |
| 2 or 3 | 4344 | (55.5) | 2521 | (53.3) | 1823 | (58.8) |
| 4 or above | 2431 | (31.0) | 1752 | (37.0) | 679 | (21.9) |
Data are n (%).
*Fifteen women who did not know the level of their husband education were excluded.
Estimated propensity scores
Overall, the mean propensity score was 0.60 (SD=0.18). The mean propensity score was 0.66 (SD=0.17) for the treatment group and 0.52 (SD=0.18) for the control group. The region of common support was vast, ranging from 0.14 to 0.99 of the propensity score. The number of blocks was 10. Figure 1 illustrates the balance of the propensity score distributions between the treatment and control groups. The bars below the line show propensity scores for the women in the control group and ones above the line for the women in the treated group. The figure demonstrates adequate overlap in the propensity score distributions between the two groups, which included a total of 7761 observations. Off support in figure 1 represents 57 treated observations that are outside of common support, and thus were discarded in the final analysis.
Figure 1.
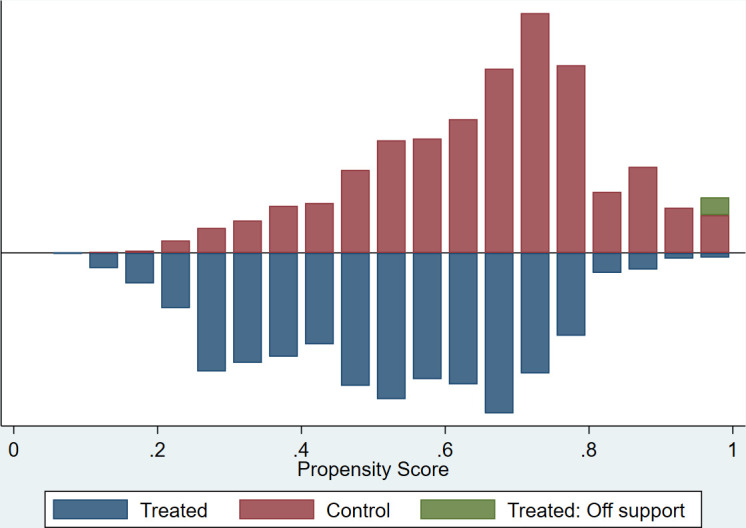
Histogram of propensity score distribution for women married as children (treated) and women married as adults (control).
Impact assessment
Table 2 shows the unmatched and matched estimates of the marginal effect of child marriage on each outcome of interest with the corresponding standard errors, t-statistic and 95% CIs. The unmatched analysis showed women married as children were 1.4% less likely to have unmet needs for modern contraception. Using the matching method, an ATT for unmet needs for modern contraception was estimated to be 0.143. That is, unmet needs for modern contraception among women married as children was a 14.3 percentage point (95 % CI 9.8 to 18.7) higher than among women married as adults. The unmatched analysis showed that the treated women were 4.8% more likely to have unintended pregnancy. The matched analysis found that unintended pregnancy among women married as children was 10.1 a percentage point (95 % CI 4.2 to 15.9) higher than among women married as adults. The ATTs for both of the outcomes were significant, as measured by the corresponding 95% CIs. Comparisons between matched and unmatched analyses indicate that the unmatched analysis underestimated the effect size due to selection bias.
Table 2.
Impact assessment of child marriage
| Treated | Control | Difference | SE | t-statistic | 95% CI* | |
| Unmet need for modern contraception | ||||||
| Unmatched (n=7833) | 0.211 | 0.224 | −0.014 | 0.010 | −1.47 | −0.032 to 0.005 |
| Matched (n=7761) | 0.209 | 0.066 | 0.143 | 0.021 | 6.80 | 0.098 to 0.187 |
| Unintended pregnancy | ||||||
| Unmatched (n=2808) | 0.218 | 0.170 | 0.048 | 0.015 | 3.10 | 0.018 to 0.078 |
| Matched (n=2747) | 0.219 | 0.119 | 0.101 | 0.025 | 4.02 | 0.042 to 0.159 |
*Based on the bootstrap.
Balancing test
The matching method achieved balance in measured covariate between treated and control groups with the same propensity score (table 3). After matching, the standardised percentage bias between the two groups was less than 10% for nearly all covariates. Figure 2 shows a graphical representation of the comparisons of the standardised percentage bias before and after matching. The results of the t-tests showed no systematic differences between the two groups in nearly all covariate distributions at the 5% significance level. Furthermore, the matching method reduced the pseudo-R2 value from 0.114 to 0.006. The distributions of the propensity scores adequately overlapped after matching (figure 3).
Table 3.
Covariate balance check and absolute bias reduction
| Variable | Mean | % bias | % reduction bias | T-test | |||
| Treated | Control | T | P value | ||||
| Woman’s age (15–24 years) | Unmatched | 0.14 | 0.03 | 39.4 | 79.6 | 16.06 | <0.001 |
| Matched | 0.13 | 0.10 | 8.0 | 3.30 | 0.001 | ||
| Woman’s age (25–34 years) | Unmatched | 0.41 | 0.46 | −10.0 | 56.8 | −4.34 | <0.001 |
| Matched | 0.41 | 0.43 | −4.3 | −2.10 | 0.036 | ||
| Woman’s age (>34 years) | Unmatched | 0.46 | 0.51 | −11.5 | 99.3 | −4.98 | <0.001 |
| Matched | 0.46 | 0.46 | −0.1 | −0.04 | 0.967 | ||
| Husband’s age (15–24 years) | Unmatched | 0.03 | 0.01 | 15.6 | 32.2 | 6.44 | <0.001 |
| Matched | 0.03 | 0.02 | 10.6 | 5.12 | <0.001 | ||
| Husband’s age (25–34 years) | Unmatched | 0.33 | 0.32 | 1.8 | 42.8 | 0.79 | 0.428 |
| Matched | 0.33 | 0.33 | 1.0 | 0.51 | 0.612 | ||
| Husband’s age (>34 years) | Unmatched | 0.63 | 0.66 | −6.7 | 35.1 | −2.89 | 0.004 |
| Matched | 0.64 | 0.66 | −4.4 | −2.10 | 0.036 | ||
| Urban | Unmatched | 0.61 | 0.67 | −13.4 | 98.3 | −5.77 | <0.001 |
| Matched | 0.61 | 0.61 | −0.2 | −0.11 | 0.915 | ||
| Mountain | Unmatched | 0.07 | 0.08 | −3.0 | 58.9 | −1.32 | 0.187 |
| Matched | 0.07 | 0.07 | −1.2 | −0.61 | 0.543 | ||
| Hill | Unmatched | 0.40 | 0.49 | −17.5 | 75.8 | −7.60 | <0.001 |
| Matched | 0.41 | 0.39 | 4.2 | 2.07 | 0.038 | ||
| Lowland | Unmatched | 0.53 | 0.43 | 19.0 | 81.2 | 8.23 | <0.001 |
| Matched | 0.52 | 0.54 | −3.6 | −1.72 | 0.085 | ||
| Advantaged ethnic group | Unmatched | 0.50 | 0.54 | −8.3 | 56.6 | −3.59 | <0.001 |
| Matched | 0.50 | 0.52 | −3.6 | −1.74 | 0.082 | ||
| Hindu | Unmatched | 0.87 | 0.89 | −5.0 | 96.0 | −2.14 | 0.033 |
| Matched | 0.87 | 0.87 | 0.2 | 0.09 | 0.926 | ||
| Poor | Unmatched | 0.29 | 0.27 | 4.8 | 49.5 | 2.07 | 0.039 |
| Matched | 0.30 | 0.29 | 2.4 | 1.16 | 0.246 | ||
| Middle income | Unmatched | 0.37 | 0.28 | 18.7 | 82.1 | 8.04 | <0.001 |
| Matched | 0.36 | 0.35 | 3.4 | 1.58 | 0.114 | ||
| Rich | Unmatched | 0.34 | 0.45 | −22.4 | 75.6 | −9.76 | <0.001 |
| Matched | 0.34 | 0.37 | −5.5 | −2.69 | 0.007 | ||
| Woman’s educational level (lower) | Unmatched | 0.77 | 0.56 | 45.0 | 91.6 | 19.77 | <0.001 |
| Matched | 0.76 | 0.78 | −3.8 | −1.99 | 0.046 | ||
| Woman’s educational level (higher) | Unmatched | 0.23 | 0.44 | −45.0 | 91.6 | −19.77 | <0.001 |
| Matched | 0.24 | 0.22 | 3.8 | 1.99 | 0.046 | ||
| Husband’s educational level (lower) | Unmatched | 0.48 | 0.34 | 29.5 | 91.2 | 12.71 | <0.001 |
| Matched | 0.48 | 0.47 | 2.6 | 1.22 | 0.221 | ||
| Husband’s educational level (higher) | Unmatched | 0.52 | 0.66 | −29.5 | 91.2 | −12.71 | <0.001 |
| Matched | 0.52 | 0.53 | −2.6 | −1.22 | 0.221 | ||
| No job or low skilled job | Unmatched | 0.87 | 0.79 | 21.3 | 87.3 | 9.38 | <0.001 |
| Matched | 0.87 | 0.88 | −2.7 | −1.47 | 0.142 | ||
| Parity (0 or 1) | Unmatched | 0.10 | 0.19 | −27.8 | 67.3 | −12.38 | <0.001 |
| Matched | 0.10 | 0.07 | 9.1 | 5.59 | <0.001 | ||
| Parity (2 or 3) | Unmatched | 0.53 | 0.59 | −11.2 | 37.2 | −4.82 | <0.001 |
| Matched | 0.53 | 0.57 | −7.0 | −3.37 | 0.001 | ||
| Parity (4 or above) | Unmatched | 0.37 | 0.22 | 33.9 | 98.0 | 14.42 | <0.001 |
| Matched | 0.37 | 0.37 | 0.7 | 0.30 | 0.764 | ||
Figure 2.
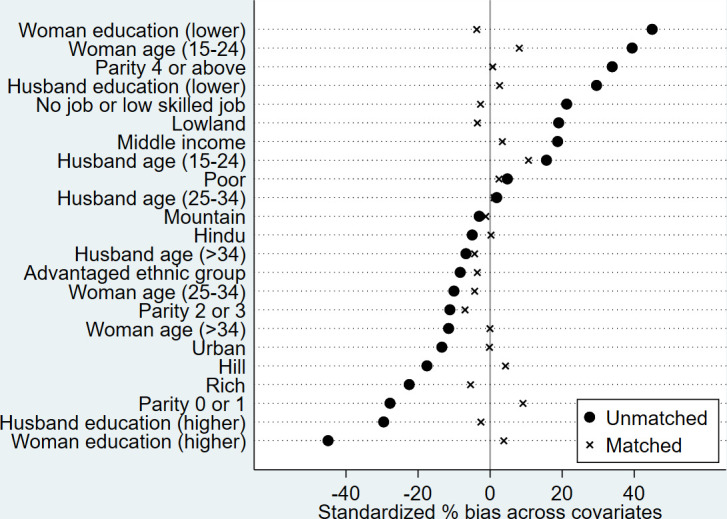
Standardised per cent bias in the distribution of confounders before and after matching.
Figure 3.
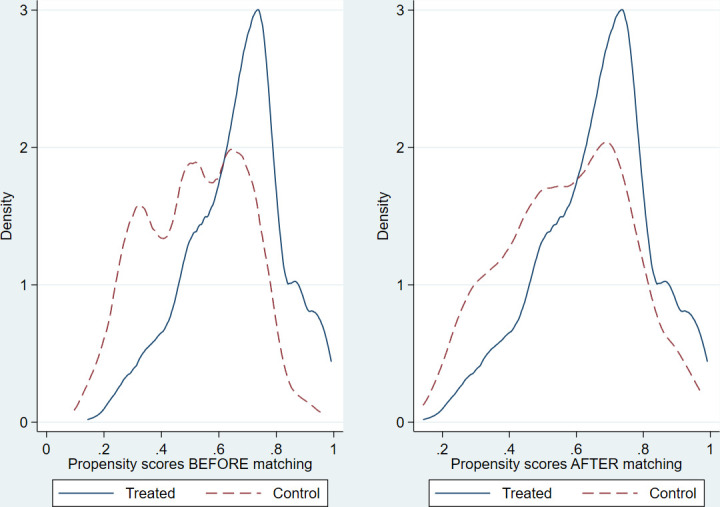
Kernel density plot of estimated propensity scores before and after matching.
Sensitivity analysis for hidden bias
The results of the sensitivity analysis showed the following gamma values for unmet needs for modern contraception (gamma=1.5), and unintended pregnancy (gamma=2.0). The CI would include zero at the 5% significance level if an unmeasured confounder caused the odds of treatment assignment to differ by 1.5. That is, the estimated effect on the former outcome would no longer be significant if hidden bias increase or decrease the odds of treatment assignment by 1.5.
Discussion
Using observational data, the PSM analysis in the present study showed that child marriage was associated with a higher risk of unmet needs for modern contraception, and unintended pregnancy among married women aged 15–49 in Nepal. The results of the balancing test indicated that successful matching of the propensity scores achieved exchangeability between the treated and control groups conditional on the measured covariates. Imbalance of a few of the covariates was minuscule. Therefore, overt biases are unlikely to have been introduced. With reference to gamma threshold values based on sensitivity analysis,27 the gamma values obtained in the present study can be interpreted as an evidence suggesting that the effect is very robust to residual confounding.
In this study, there was a strong, positive association between child marriage and unmet needs for modern contraception. Women who were married as children often face multifaceted barriers to adopting and continuing contraception. For instance, unmet needs for modern contraception might result from individual factors including limited knowledge and awareness about family planning,28–31 the fear of adverse side effects28 32 and shyness to discuss contraceptive use with husbands and healthcare providers.31 32 Partner and family-related factors include the husband’s refusal to use contraceptives,28 29 31 and the in-laws’ pressure to prove fertility soon after marriage.31 Service-providers-related factors include a lack of confidentiality and privacy, and unfriendliness of healthcare providers.33 As it was not known whether child marriage has any effects on unmet needs for modern contraception, the study has added to the paucity of empirical evidence on this issue.
In the present study, the effect of child marriage on the risk of unintended pregnancy remained significant after controlling for parity and other important confounders. The strength of confounding by parity was relatively weak. It is plausible that the higher risk of unintended pregnancy was driven by the same set of factors that are mentioned above, as unmet needs for modern contraception is the leading cause of unintended pregnancy.5 This finding provides added value to the literature as previous studies have reported contradictory results on the effect of child marriage on unintended pregnancy.
The methodological novelty of this study is a departure from the traditional regression-based approach, which is used to estimate conditional or stratum-specific effects. To the best of our knowledge, the present study is the first analysis to estimate the causal effect of child marriage using PSM analysis of observational data while addressing selection bias more robustly than previous studies. In the literature on the effect of child marriage, regression adjustment is the dominant approach for adjusting for confounding effects. However, one of its drawbacks is that it sometimes relies on untrustworthy extrapolation if covariate distributions are not balanced between treatment and control groups.34–38 Indeed, regression adjustment has proven to be unreliable when there is insufficient overlap in these covariate distributions.35 36 38 39 This may be of concern as this study included disproportionately fewer young observations in the control group. In previous studies, this issue possibly generated untrustworthy extrapolation and produced biased estimates. It is challenging to assess the covariate balance between treatment groups, using regression-based approaches. Standard diagnostics of regression adjustment do not involve assessing the degree of overlap between covariate distributions for the two groups.39 40
As stated in the introduction, our main aim was to address the issue of causation. We discuss rival explanations to strengthen the inference that the association observed in this study actually have a cause-effect basis. Hulley et al41 provided five possible explanations for an observed association between an exposure and an outcome in an observational study: chance (random error), bias (systematic error), effect-cause (reverse causality), confounding and cause-effect. The CIs obtained in this study show that the observed effects are very unlikely to be due to chance. The NDHS relied on self-reported data, which are prone to recall bias and social desirability bias, especially regarding the intendedness and wantedness of pregnancies.42 However, this potential error is likely to be at random between the treatment and control groups. Although observational studies like the NDHS, cannot provide evidence for the direction of causality, marriage chronologically precedes childbearing in Nepal. Thus, a temporal sequence between the treatment and the outcomes can be assumed, and the findings leave little room for reverse causality interpretation. It is possible that unmeasured predictors of the outcome variables (eg, contraceptive access) might play a role in the relationship that the present study investigated; however, the sensitivity analysis indicated that the estimated effects were robust to unmeasured covariates.
This study had several limitations. First, the PSM estimates rely on the unconfoundedness assumption meaning that no critical predictors of the treatment and outcome are left out of the model. As discussed above, while unmeasured predictors may exist, sensitivity analysis showed that the estimated effects are insensitive to violation of the unconfoundedness assumption. Also, unmeasured confounders tend to be related to measured covariates. Therefore, distribution of unmeasured covariates is expected to be balanced between the treatment and control groups. Second, a few of the covariates used to estimate the propensity scores (ie, education levels, occupation of women, parity) may not be pretreatment variables. However, most of the covariates in the present study were pretreatment variables. Third, while the exclusion of 57 unmatched observations from analysis might have some influence on the generalisability of the findings to the entire population in Nepal, its magnitude would be very limited. Finally, as discussed above, recall bias and social desirability bias may be a concern in the study methodology. However, only the most recent pregnancy was analysed to minimise recall bias. Despite these caveats, the strengths of this study include the use of nationally representative data with a high response rate, and minimisation of selection bias through a rigorous matching method.
Conclusion
Overall, this study provided insights into the causal effect of child marriage on unmet needs for modern contraception, and unintended pregnancy. In the absence of randomisation, there can be no guarantee that the effect observed in the present study represent a causal relationship. However, given that none of the other possible explanations are convincing, we feel confident to give a causal interpretation to the parameter estimates for the treatment, arguing that the small but significant increases in the risk of the outcomes in the treated group are likely due to child marriage. The findings underscored the detrimental impacts of child marriage, which require more attention from policymakers in the policy dialogue on ending child marriage and improving reproductive health. A holistic approach should be adopted to reduce the multidimensional vulnerabilities faced by women married as children. Such an approach includes educating the public about reproductive rights, influencing harmful traditional norms, and increasing demand for adolescent-friendly reproductive health services, including family planning. Further research is needed to elucidate the pathway between child marriage and the increased risk of unmet needs for modern contraception and unintended pregnancy. As the results of this study are not generalisable to other countries, future studies using PSM should be conducted for other populations.
Supplementary Material
Acknowledgments
The authors thank Macro International for providing free access to the NDHS 2016 dataset and Akira Shibanuma for his technical inputs. Sekine acknowledges the Foundation for Advanced Studies on International Development for financially supporting him while pursuing a Ph.D.
Footnotes
Contributors: KS: conceptualisation, study design, methodology, data analysis, interpretation, writing-original draft. RRC, KICO and AT: interpretation, writing-review and editing. MJ: supervision, interpretation, writing-review and editing. All authors provided critical revisions and have read and approved the final manuscript.
Funding: This study was part of the first author’s doctoral dissertation and was financially supported by the Foundation for Advanced Studies on International Development (5ki2017).
Competing interests: None declared.
Patient and public involvement: Patients and/or the public were not involved in the design, or conduct, or reporting, or dissemination plans of this research.
Provenance and peer review: Not commissioned; externally peer reviewed.
Data availability statement
Data are available in a public, open access repository. The data file used for this study is available at the DHS website and is accessible on request.
Ethics statements
Patient consent for publication
Not required.
Ethics approval
The study used a deidentified secondary dataset of the NDHS 2016, which was freely and publicly available. The research protocol, data collection tools, and procedures of the NDHS were approved by the Nepal Health Research Council, Kathmandu, and the ICF Macro Institutional Review Board in Calverton, Maryland, USA. Written informed consent to carry out the interviews was obtained from the heads of households before participation. Ethical approval was obtained for this study from the Research Ethics Committee of the University of Tokyo (2019032NI).
References
- 1.United Nations Population Fund (UNFPA) . Accelerating the promise: the report on the Nairobi summit on ICPD25. NY: UNFPA, 2019. [Google Scholar]
- 2.The Guttmacher Institute . Adding it up: the cost and benefits of investing in sexual and reproductive health 2014. New York: The Guttmacher Institute, 2014. [Google Scholar]
- 3.Collumbien M, Gerressu M, Cleland J. Non-use and use of ineffective methods of contraception. : Ezzati M, Lopez AD, Rodgers A, et al., . Comparative quantification of health risks: global and regional burden of disease attribution to selected major risk factors. Geneva: World Health Organization, 2004: 1255–320. [Google Scholar]
- 4.Singh S, Darroch JE, Ashford LS. Adding it up: the cost and benefits of investing in family planning and maternal and newborn health. New York: The Guttmacher Institute, 2009. [Google Scholar]
- 5.The Guttmacher Institute . Adding it up: investing in contraception and maternal and newborn health, 2017. New York: The Guttmacher Institute, 2017. [Google Scholar]
- 6.Bearak J, Popinchalk A, Alkema L, et al. Global, regional, and subregional trends in unintended pregnancy and its outcomes from 1990 to 2014: estimates from a Bayesian hierarchical model. Lancet Glob Health 2018;6:e380–9. 10.1016/S2214-109X(18)30029-9 [DOI] [PMC free article] [PubMed] [Google Scholar]
- 7.Pradhan A, Aryal RH, Regmi G. Nepal family health survey. Kathmandu, Nepal and Calverton. Maryland: Ministry of Health [Nepal], New Era, and Macro International Inc, 1997. [Google Scholar]
- 8.Ministry of Health (Nepal), New ERA, Micro International Inc . Nepal demographic and health survey 2016. Kathmandu, Nepal: Ministry of Health, Nepal, 2017. [Google Scholar]
- 9.Puri M, Singh S, Sundaram A, et al. Abortion incidence and unintended pregnancy in Nepal. Int Perspect Sex Reprod Health 2016;42:197–209. 10.1363/42e2116 [DOI] [PMC free article] [PubMed] [Google Scholar]
- 10.Målqvist M, Hultstrand J, Larsson M, et al. High levels of unmet need for family planning in Nepal. Sex Reprod Healthc 2018;17:1–6. 10.1016/j.srhc.2018.04.012 [DOI] [PubMed] [Google Scholar]
- 11.United Nations Population Fund (UNFPA) . Marrying too young: end child marriage. New York, USA: UNFPA, 2012. [Google Scholar]
- 12.Sah N. How useful are the demographic surveys in explaining the determinants of early marriage of girls in the Terai of Nepal? J Popul Res 2008;25:207–22. 10.1007/BF03031949 [DOI] [Google Scholar]
- 13.Godha D, Hotchkiss DR, Gage AJ. Association between child marriage and reproductive health outcomes and service utilization: a multi-country study from South Asia. J Adolesc Health 2013;52:552–8. 10.1016/j.jadohealth.2013.01.021 [DOI] [PubMed] [Google Scholar]
- 14.Nasrullah M, Muazzam S, Bhutta ZA, et al. Girl child marriage and its effect on fertility in Pakistan: findings from Pakistan demographic and health survey, 2006-2007. Matern Child Health J 2014;18:534–43. 10.1007/s10995-013-1269-y [DOI] [PubMed] [Google Scholar]
- 15.Kamal SMM. Decline in child marriage and changes in its effect on reproductive outcomes in Bangladesh. J Health Popul Nutr 2012;30:317–30. 10.3329/jhpn.v30i3.12296 [DOI] [PMC free article] [PubMed] [Google Scholar]
- 16.Raj A, Saggurti N, Balaiah D, et al. Prevalence of child marriage and its effect on fertility and fertility-control outcomes of young women in India: a cross-sectional, observational study. Lancet 2009;373:1883–9. 10.1016/S0140-6736(09)60246-4 [DOI] [PMC free article] [PubMed] [Google Scholar]
- 17.Kamal SMM, Hassan CH. Child marriage and its association with adverse reproductive outcomes for women in Bangladesh. Asia Pac J Public Health 2015;27:NP1492–506. 10.1177/1010539513503868 [DOI] [PubMed] [Google Scholar]
- 18.Croft TN, Aileen MJM, Courtney KA. Guide to DHS statistics. Rockville, Maryland: ICF, 2018. [Google Scholar]
- 19.Rosenbaum PR, Rubin DB. The central role of the propensity score in observational studies for causal effects. Biometrika 1983;70:41–55. 10.1093/biomet/70.1.41 [DOI] [Google Scholar]
- 20.Becker SO, Ichino A. Estimation of average treatment effects based on propensity scores. Stata J 2002;2:358–77. 10.1177/1536867X0200200403 [DOI] [Google Scholar]
- 21.PSMATCH2: Stata module to perform full Mahalanobis and propensity score matching, common support graphing, and covariate imbalance testing [program] 2017.
- 22.Rosenbaum PR, Rubin DB. Constructing a control group using multivariate matched sampling methods that incorporate the propensity score. Am Stat 1985;39:33–8. [Google Scholar]
- 23.Ali MS, Groenwold RHH, Belitser SV, et al. Reporting of covariate selection and balance assessment in propensity score analysis is suboptimal: a systematic review. J Clin Epidemiol 2015;68:122–31. 10.1016/j.jclinepi.2014.08.011 [DOI] [PubMed] [Google Scholar]
- 24.Sianesi B. An evaluation of the Swedish system of active labor market programs in the 1990s. Rev Econ Stat 2004;86:133–55. 10.1162/003465304323023723 [DOI] [Google Scholar]
- 25.Caliendo M, Kopeinig S. Some practical guidance for the implementation of propensity score matching. J Econ Surv 2008;22:31–72. 10.1111/j.1467-6419.2007.00527.x [DOI] [Google Scholar]
- 26.Becker SO, Caliendo M. Sensitivity analysis for average treatment effects. Stata J 2007;7:71–83. 10.1177/1536867X0700700104 [DOI] [Google Scholar]
- 27.Caliendo M, Hujer R, Thomsen S. The employment effects of job creation schemes in Germany: a Microeconometric evaluation. Institute of Labor Economics (IZA), 2005. [Google Scholar]
- 28.Ghule M, Raj A, Palaye P, et al. Barriers to use contraceptive methods among rural young married couples in Maharashtra, India: qualitative findings. Asian J Res Soc Sci Humanit 2015;5:18–33. 10.5958/2249-7315.2015.00132.X [DOI] [PMC free article] [PubMed] [Google Scholar]
- 29.Cherri Z, Gil Cuesta J, Rodriguez-Llanes JM, et al. Early marriage and barriers to contraception among Syrian refugee women in Lebanon: a qualitative study. Int J Environ Res Public Health 2017;14:836. 10.3390/ijerph14080836 [DOI] [PMC free article] [PubMed] [Google Scholar]
- 30.McClendon KA, McDougal L, Ayyaluru S, et al. Intersections of girl child marriage and family planning beliefs and use: qualitative findings from Ethiopia and India. Cult Health Sex 2018;20:799–814. 10.1080/13691058.2017.1383513 [DOI] [PubMed] [Google Scholar]
- 31.Shahabuddin ASM, Nöstlinger C, Delvaux T, et al. What influences adolescent girls’ decision-making regarding contraceptive methods use and childbearing? A qualitative exploratory study in Rangpur district, Bangladesh. PLoS One 2016;11:e0157664. 10.1371/journal.pone.0157664 [DOI] [PMC free article] [PubMed] [Google Scholar]
- 32.Mardi A, Ebadi A, Shahbazi S, et al. Factors influencing the use of contraceptives through the lens of teenage women: a qualitative study in Iran. BMC Public Health 2018;18:202. 10.1186/s12889-018-5116-3 [DOI] [PMC free article] [PubMed] [Google Scholar]
- 33.Sychareun V, Vongxay V, Houaboun S, et al. Determinants of adolescent pregnancy and access to reproductive and sexual health services for married and unmarried adolescents in rural Lao PDR: a qualitative study. BMC Pregnancy Childbirth 2018;18:219. 10.1186/s12884-018-1859-1 [DOI] [PMC free article] [PubMed] [Google Scholar]
- 34.Rubin DB. Estimating causal effects from large data sets using propensity scores. Ann Intern Med 1997;127:757–63. 10.7326/0003-4819-127-8_Part_2-199710151-00064 [DOI] [PubMed] [Google Scholar]
- 35.Dehejia RH, Wahba S. Causal effects in nonexperimental studies: reevaluating the evaluation of training programs. J Am Stat Assoc 1999;94:1053–62. 10.1080/01621459.1999.10473858 [DOI] [Google Scholar]
- 36.Dehejia RH, Wahba S. Propensity score-matching methods for non-experimental causal studies. Rev Econ Stat 2002;84:151–61. 10.1162/003465302317331982 [DOI] [Google Scholar]
- 37.King G, Zeng L. The dangers of extreme counterfactuals. Political Analysis 2006;14:131–59. 10.1093/pan/mpj004 [DOI] [Google Scholar]
- 38.DF H, Imai K, King G. Matching as nonparametric preprocessing for reducing model dependence in parametric causal inference. Political Analysis 2007;15:199–236. [Google Scholar]
- 39.Stuart EA. Matching methods for causal inference: a review and a look forward. Stat Sci 2010;25:1–21. 10.1214/09-STS313 [DOI] [PMC free article] [PubMed] [Google Scholar]
- 40.Stuart EA, Marcus SM, Horvitz-Lennon MV, et al. Using non-experimental data to estimate treatment effects. Psychiatr Ann 2009;39:719–28. 10.3928/00485713-20090625-07 [DOI] [PMC free article] [PubMed] [Google Scholar]
- 41.Hulley SB, Cummings SR, Browner WS. Designing clinical research. Philadelphia: Wolters Kluwer, 2013. [Google Scholar]
- 42.Bachrach CA, Newcomer S. Intended pregnancies and unintended pregnancies: distinct categories or opposite ends of a continuum? Fam Plann Perspect 1999;31:251–2. 10.2307/2991577 [DOI] [PubMed] [Google Scholar]
Associated Data
This section collects any data citations, data availability statements, or supplementary materials included in this article.
Supplementary Materials
Data Availability Statement
Data are available in a public, open access repository. The data file used for this study is available at the DHS website and is accessible on request.