

SUMMARY
Trained immunity, a functional state of myeloid cells, has been proposed as a compelling immune-oncological target. Its efficient induction requires direct engagement of myeloid progenitors in the bone marrow. For this purpose we developed a bone marrow-avid nanobiologic platform designed specifically to induce trained immunity. We established the potent anti-tumor capabilities of our lead candidate MTP10-HDL in a B16F10 mouse melanoma model. These anti-tumor effects result from trained immunity-induced myelopoiesis caused by epigenetic rewiring of multipotent progenitors in the bone marrow, which overcomes the immunosuppressive tumor microenvironment. Furthermore, MTP10-HDL nanotherapy in this melanoma model refractory to anti-PD-1 and anti-CTLA-4 therapy. Finally, we determined MTP10-HDL’s favorable biodistribution and safety profile in non-human primates. In conclusion, we show that rationally designed nanobiologics can promote trained immunity and elicit a durable anti-tumor response either as a monotherapy or in combination with checkpoint inhibitor drugs.
Keywords: Trained immunity, cancer, immunotherapy, checkpoint-inhibitors, melanoma, myeloid cells, innate immunity, nanomedicine, nanobiologics
Graphical Abstract

Introduction
In the last two decades, the immuno-oncology field has generated several significant breakthroughs in cancer therapy, including immunotherapies that have shown major clinical benefit in patients diagnosed with advanced metastatic cancer. These immunotherapies act primarily by stimulating an adaptive T cell response (Pardoll, 2012). Checkpoint blockade and chimeric antigen receptor (CAR)-T cell therapies are among the most advanced immunotherapies for cancer treatment. Checkpoint inhibitor drugs induce or restore T cells’ ability to mount an effective anti-tumor response by eliminating the breaks in these cells’ anti-tumor properties (Sharma and Allison, 2015). CAR-T therapy involves the adoptive transfer of T cells genetically modified to effectively seek and kill tumor cells in a major histocompatibility complex (MHC)-independent manner (Gross et al., 1989; Kalos et al., 2011). Exploiting the innate immune response in cancer therapy is beginning to gain traction but remains largely uncharted territory.
The innate immune system acts as a rapid first line of defense, triggered through recognition of either pathogens or endogenous danger signals by pattern recognition receptors (PRRs) (Janeway and Medzhitov, 2002). Upon detecting pathogen-associated molecular patterns (PAMPs) (Akira et al., 2006), PRRs initiate an innate immune response, which involves activating the subsequent adaptive immune system by antigen presentation (signal 1), co-stimulation (signal 2), and cytokine excretion (signal 3) (Kambayashi and Laufer, 2014; Murphy et al., 2012). In addition, PRRs also recognize damage-associated molecular patterns (DAMPs), leading to non-infectious inflammatory responses (Seong and Matzinger, 2004).
Though the innate immune system was long believed to lack memory, recent studies show that innate immune cells undergo metabolic and epigenetic rewiring, adjusting their functional programs in a process termed ‘trained immunity’ that is considered a de facto innate immune memory (Netea et al., 2016; Netea et al., 2011). Trained immunity is regulated and maintained through induction of training properties to progenitor cells in the bone marrow, resulting in durable reprogramming that exceeds the myeloid cell lifespan in the bloodstream (Mitroulis et al., 2018). Although trained immunity can be easily induced with a range of ‘training agents’ in cultured myeloid cells, its systemic induction requires bone marrow progenitor cell engagement. Towards this purpose, nanomaterials can be functionalized with trained immunity-inducing molecular structures and designed to exhibit high bone marrow avidity, in order to facilitate association with myeloid-biased progenitor cells (Braza et al., 2018). If appropriately designed, such nanomaterials can elicit a durable anti-cancer innate immune response by stimulating the production of trained myeloid cells and their resulting influx into the tumor microenvironment (TME). Simultaneously, these trained cells mobilize adaptive immune responses via enhanced T cell activation, primarily through the augmentation of signals 2 and 3 (Kambayashi and Laufer, 2014), but also through improved antigen presentation (Leentjens et al., 2015).
Here, we present the development and therapeutic application of trained immunity-inducing nanobiologics. Following a thorough screening of differently composed nanobiologics, we identified a lead candidate, named MTP10-HDL, for subsequent intravenous application in a mouse melanoma model. We studied this nanobiologic’s therapeutic benefits using a combination of tumor growth profiling, ATAC- and RNA sequencing, flow cytometry, and multiple imaging techniques. In addition to its application as monotherapy, MTP10-HDL therapy enhances the immune system’s susceptibility to checkpoint blockade immunotherapy and thereby improves therapeutic outcomes in a mouse melanoma model. MTP10-HDL therapy’s pharmacokinetics and safety profile were evaluated in mice and non-human primates.
Results
Developing trained immunity-promoting nanobiologics
Nanobiologics are nanomaterials bioengineered from natural carrier molecules, i.e., phospholipids and cholesterol, and apolipoprotein A-1 (apoA1) (Mulder et al., 2009). The latter is the main protein constituent of high-density lipoprotein (HDL). ApoA1 provides structural integrity to nanobiologics’ overall structure and through its ATP-Binding Cassette Transporter A1/G1 specificity also contributes to nanobiologics’ affinity for myeloid cells and their progenitors (Yvan-Charvet et al., 2010). We have previously shown that nanobiologics exhibit high bone marrow avidity (Braza et al., 2018; Perez-Medina et al., 2015) and that they can be functionalized with therapeutic moieties, such as peptidoglycan derivatives in this study. Peptidoglycans can induce trained immunity by activating the Nucleotide-binding oligomerization domain-containing protein 2 (NOD2) receptor (Kleinnijenhuis et al., 2012). The smallest immunoreactive peptidoglycan-derived molecular structure is muramyl dipeptide (MDP) (Kufer et al., 2006). L18-MDP, a 6-O-acyl MDP derivative with a stearoyl fatty acid, and muramyl tripeptide phosphatidylethanolamine (MTP-PE) are both known to induce trained immunity (Meyers, 2009; Mourits et al., 2018). These compounds exhibit amphiphilic properties favorable for their HDL incorporation. The resulting HDL nanobiologics have MDP or MTP exposed on their surfaces, essentially forming nanosized trained immunity-inducing microbial mimetics.
We created an MDP/MTP-HDL mini library comprising nanobiologics composed of human aopA1 and the phospholipid 1,2-dimyristoyl-sn-glycero-3-phosphatidylcholine (DMPC) that incorporated different molar quantities of either L18-MDP or MTP-PE (1.0 – 10 mol%). Additionally, we incorporated cholesterol (5.0 – 20 mol%) to improve nanobiologic stability. We then screened these nanobiologics by longitudinally measuring their size by dynamic light scattering (DLS) and establishing drug release kinetics as a function of cholesterol content. Concurrently, we investigated the nanobiologics’ trained immunity-promoting capacity in vitro on human and murine myeloid cells. The nanobiologics were additionally labeled with the radioisotope Zirconium-89 (89Zr) to quantitatively study, using gamma counting, their in vivo behavior in C57BL/6 mice. For ex vivo flow cytometric analyses, nanobiologics were labeled with lipophilic fluorophores (Figure 1A).
Figure 1. Nanobiologic screening and lead candidate selection.
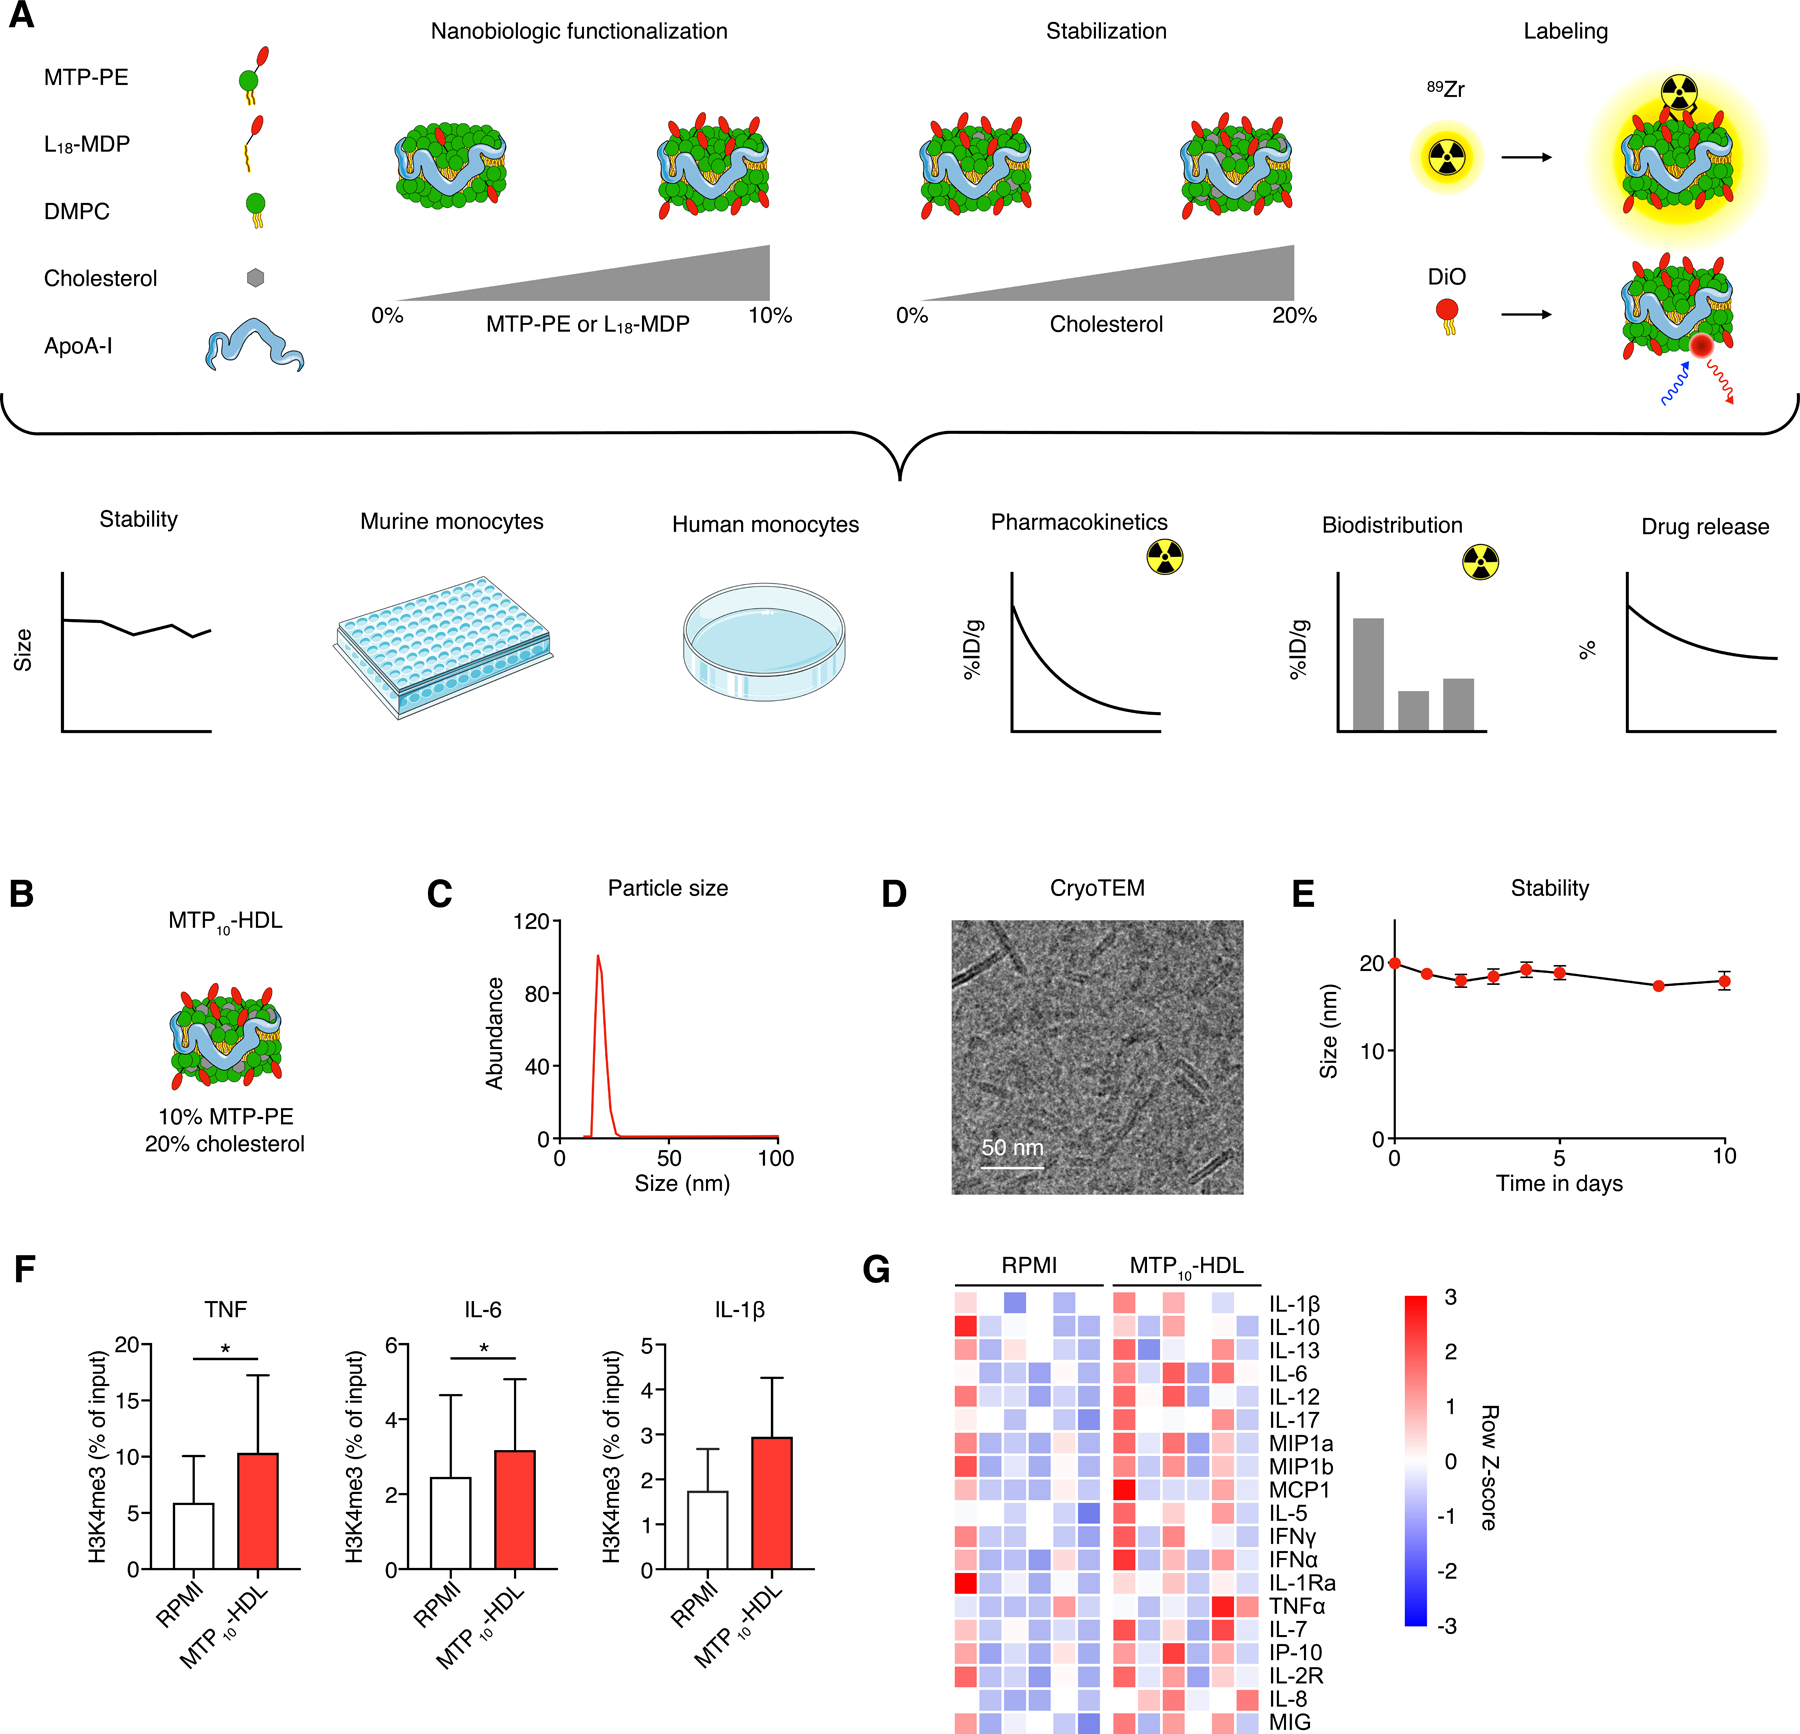
(A) (top) Schematic overview of nanobiologic library details. Individual nanobiologics are composed of human apoA1, the phospholipid DMPC and stabilized by cholesterol. Different surface densities of MDP or MTP are realized by varying the amount of L18-MDP or MTP-PE, respectively. The nanobiologics can be labeled with the radioisotope 89Zr or a fluorescent dye.
(bottom) The different methods that were deployed to screen nanobiologics, integrating longitudinal size stability measurements by DLS, drug retention assays, murine and human monocyte in vitro training assays, pharmacokinetics and biodistribution studies in mice that received an intravenous injection of 89Zr-MTP10-HDL.
(B) Schematic representation of the lead nanobiologic MTP10-HDL, consisting of 10 mol% MTP-PE and 20 mol% cholesterol relative to DMPC.
(C) Particle size of MTP10-HDL, as determined by DLS, is 20 nm.
(D) CryoTEM image of MTP10-HDL reveals a discoidal structure approximately 15 nm in diameter, with a thickness of 5 nm.
(E) DLS stability assay demonstrate that MTP10-HDL size remain stable for at least 10 days.
(F) ChIP-qPCR of human monocytes treated with MTP10-HDL and RPMI show increased H3K4 methylation on the TNFA, IL6 and IL1B promoters after MTP10-HDL treatment. (n=3)
(G) Heatmap of human monocyte cytokines production after in vitro training. A general increase of pro-inflammatory cytokines after MTP10-HDL training is observed. (n=6)
Data are presented as mean ± SD. P values were calculated using a Wilcoxon matched-pairs signed rank test, *p < 0.05.
The results of this comprehensive screen are presented in the Supplemental Information, and show that, while including cholesterol significantly improved the nanobiologics’ stability, the MDP/MTP surface density had little influence on blood clearance and biodistribution. For further studies, we therefore selected the most stable formulation with the highest MTP density, as this version allowed us to administer the relatively lowest nanobiologic dose (Figure S1 and S2).
Characterizing the lead nanobiologic candidate
The selected lead candidate, MTP10-HDL (Figure 1B), containing 10 mol% MTP-PE and 20 mol% cholesterol, has a mean hydrodynamic diameter of 20 nm ± 2 nm (Ð = 0.3) as measured by DLS (Figure 1C). We observed a discoidal morphology by cryogenic transmission electron microscopy (cryo-TEM, Figure 1D and S2D). Longitudinal size measurements established MTP10-HDL’s size stability in PBS for at least 10 days (Figure 1E). After determining MTP10-HDL’s physicochemical characteristics, we extensively studied its properties to induce trained immunity on human peripheral blood mononuclear cells (PBMCs). Cells were analyzed for epigenetic changes using chromatin immunoprecipitation qPCR (ChIP-qPCR), and medium was subjected to multiplex cytokine analysis after treatment with MTP10-HDL. ChIP-qPCR showed increased H3K4 methylation of both promotors of TNFA, IL6 and IL1B cytokine genes known to be cytokine biomarkers of trained immunity. In conjunction, the multiplex data showed increased production of inflammatory cytokines, including TNF-α, IL-6 and IFN-y, further corroborating that our lead candidate MTP10-HDL effectively trains cells in vitro (Figure 1F and 1G).
Following this extensive characterization, we radiolabeled MTP10-HDL with 89Zr to generate 89Zr-MTP10-HDL and studied its in vivo behavior in C57BL/6 mice bearing B16F10 melanoma. Using in vivo PET/CT imaging, we showed that 89Zr-MTP10-HDL accumulated in bone marrow and spleen at 24 hours post intravenous administration, with a relatively low liver uptake (Figure 2A). Blood clearance measurements revealed 89Zr-MTP-HDL’s weighted half-life (t½) to be 45.7 min (Figure 2B). 89Zr-MTP10-HDL’s avidity for hematopoietic organs was validated by ex vivo gamma counting and autoradiography. We determined a bone marrow uptake of 28 ± 6.5 percent injected dose per gram of tissue (%ID/g) and uptakes of 51 ± 17 %ID/g and 3.2 ± 1.0 %ID/g in the spleen and tumor, respectively (Figure 2C).
Figure 2. In vivo behavior of the MTP10-HDL nanobiologic.
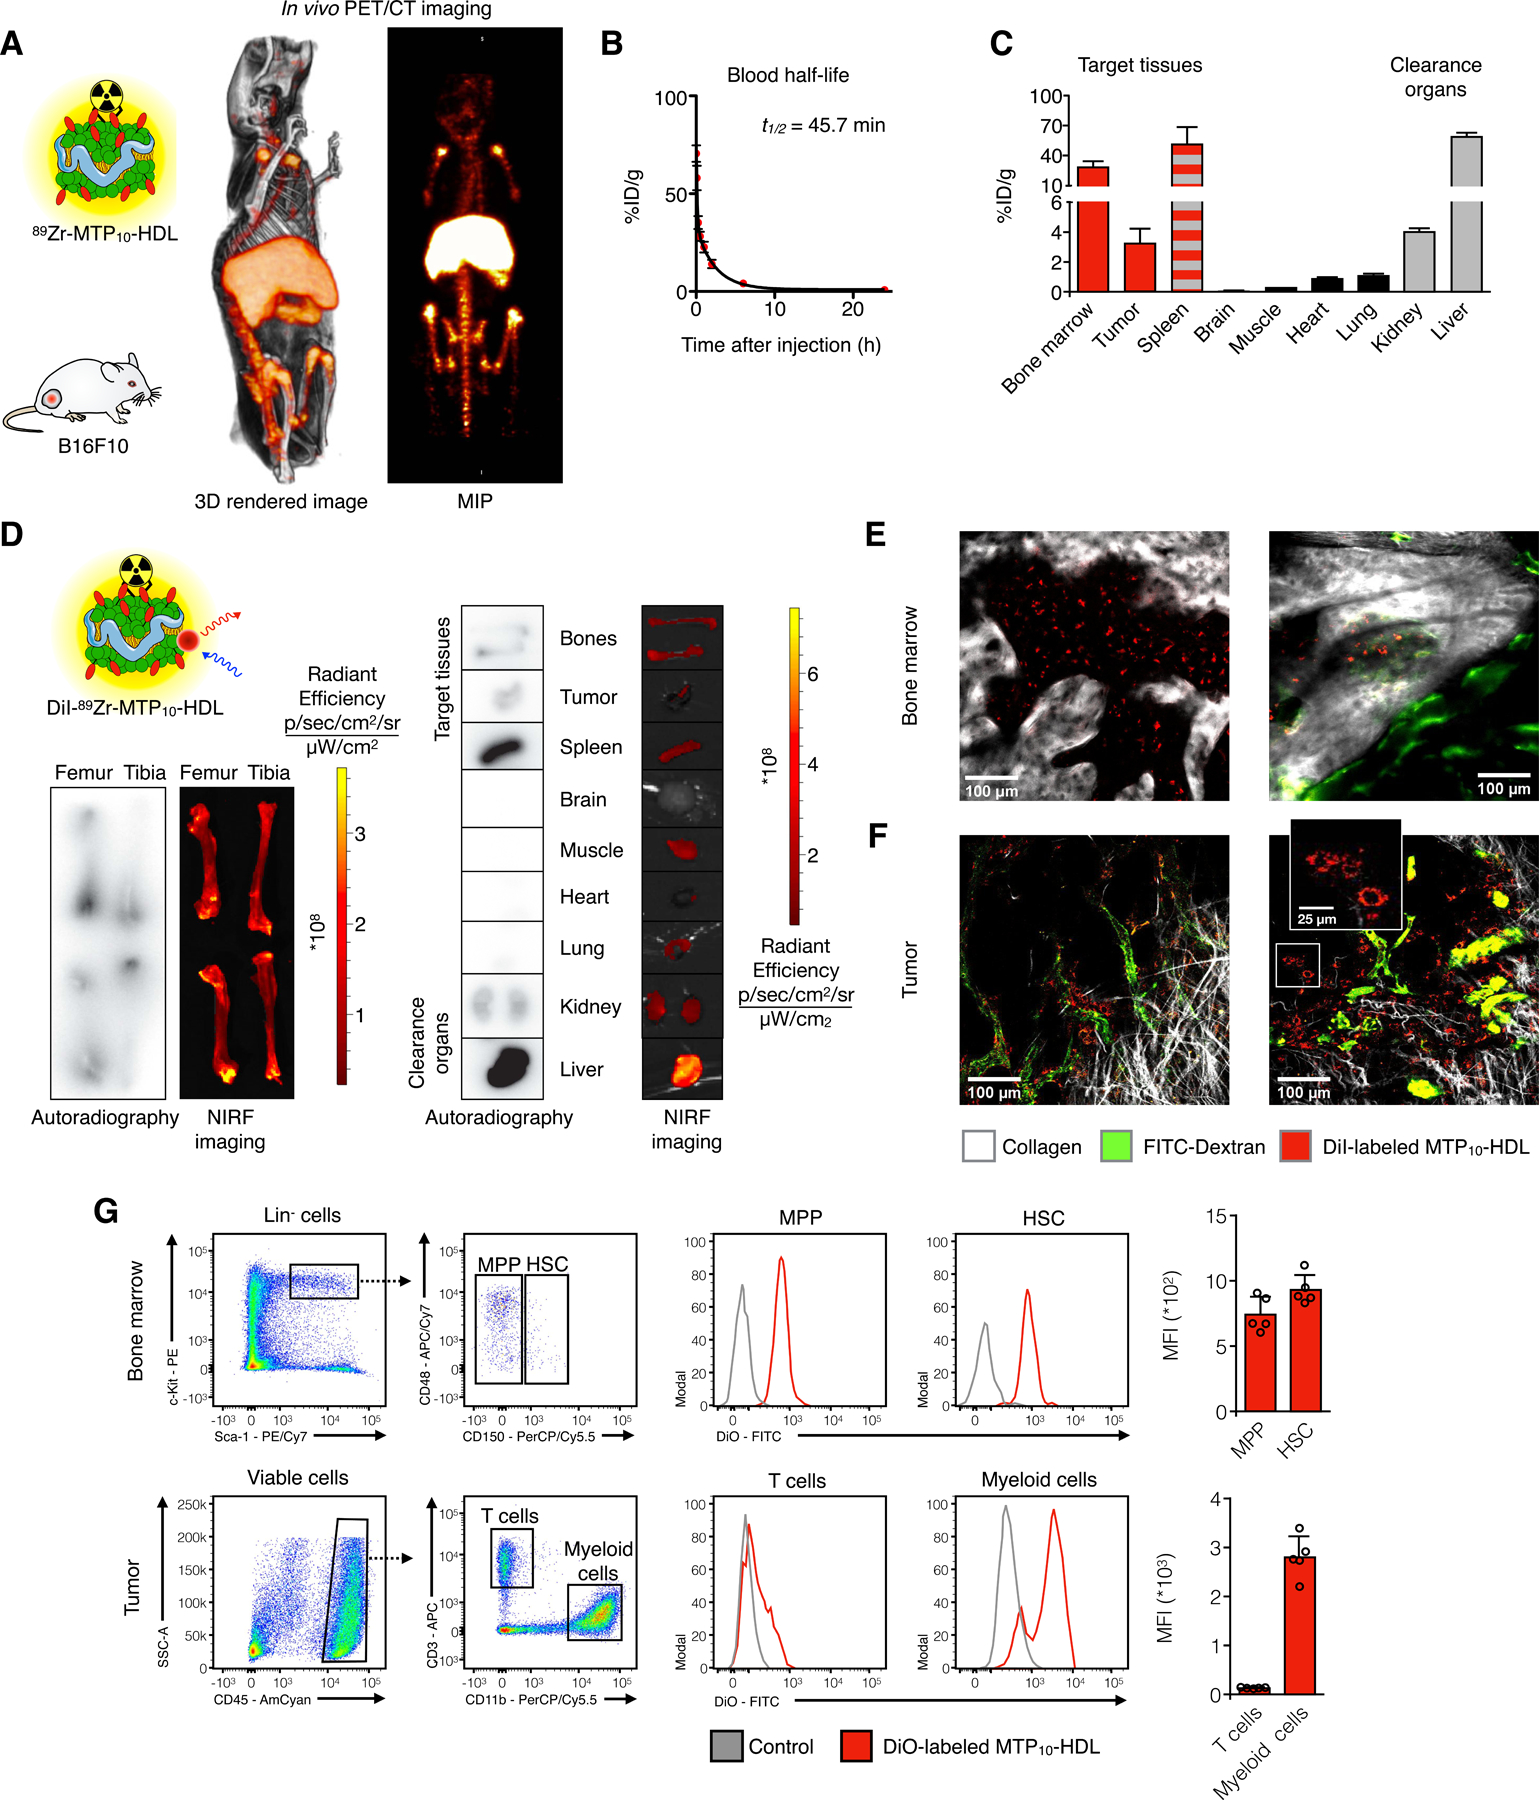
(A) Whole-body 3D-rendered and maximum intensity projection (MIP) of PET/CT at 24 hours after injection of 89Zr-MTP10-HDL displayed high uptake in the bone marrow (femur, tibia, and spine), liver, and spleen.
(B) 89Zr-MTP10-HDL has a blood half-life of 45.7 minutes. (n=5)
(C) Gamma counting of tissues from C57BL/6 mice 24 hours after 89Zr-MTP10-HDL injection. A favorable uptake in the spleen and the bone marrow was observed. (n=5) (D) Ex vivo NIRF imaging and autoradiography 24 hours after injection of dual labeled DiI-89Zr-MTP10-HDL show high uptake in the liver, spleen, and bone marrow. Bone marrow uptake is concentrated at the proximal and distal ends of the bone, where the red marrow is located. (n=5)
(E-F) Intravital microscopy of live animals C57BL/6 eight hours post DiI-MTP10-HDL administration. FITC-dextran was injected intravenously to display the vasculature.
(E) Intravital microscopy image of a live mouse calvarium eight hours post DiI-MTP10-HDL administration. Clear DiI-MTP10-HDL uptake can be seen throughout the bone marrow. FITC-dextran was injected intravenously to display the vasculature.
clearly show noticeable cellular uptake within bone marrow.
(F) Intravital microscopy image of a live mouse tumor eight hours post DiI-MTP10-HDL administration shows DiI-MTP10-HDL distribution around the tumor vasculature. The inset shows uptake of DiI-MTP10-HDL in TAMs. FITC-dextran was injected intravenously to display the vasculature.
(G) Flow cytometry of bone marrow and tumors 24 hours after DiO-MTP10-HDL administration. Identification of HSC and MPP (top) and T cells and myeloid cells (bottom) with representative histograms. Uptake was observed in bone marrow HSCs and MPPs as well as myeloid cells within the tumor, but not in T cells. (n=5)
For all panels, data are presented as mean ± SD. See also Figure S3.
Next, we incorporated the fluorescent labels DiIC18(3) and DiOC18(3) to generate DiI-MTP10-HDL and DiO-MTP10-HDL, respectively. Ex vivo near infrared fluorescence (NIRF) imaging of organs from mice injected with MTP10-HDL labeled with both DIlC18(3) and 89Zr (DiI-89Zr-MTP10-HDL) corroborated the nanobiologic’s bone marrow avidity. Autoradiography and NIRF imaging revealed marginal to undetectable uptake in muscle and vital organs, such as the brain and heart, and clearly showed DiI-89Zr-MTP10-HDL accumulation in the bone marrow, particularly in the proximal and distal parts where red marrow is located (Figure 2D). Live mice injected with DiI-MTP10-HDL as well as green fluorescent dextran were subjected to intravital microscopy (IVM). We observed DiI-MTP10-HDL’s association with myeloid cells throughout the spleen (Figure S3A) and the calvarium bone marrow (Figure 2E). In tumors, we found tumor-associated macrophages (TAMs) in the vicinity of tumor blood vessels had taken up DiI-MTP10-HDL (Figure 2F).
After deploying IVM to establish MTP10-HDL’s general proclivity for myeloid cells, we used flow cytometry to thoroughly investigate MTP10-HDL uptake by immune cell subsets. To that end, intravenously injected DiO-MTP10-HDL was allowed to circulate for 24 hours in tumor-bearing mice. In the femoral bone marrow, we observed DiO-MTP10-HDL uptake in hematopoietic stem cells (HSCs) and multipotent progenitors (MPPs) (Figure 2G) along with all other myeloid progenitors (Figure S3B). High myeloid cell uptake was also observed in blood and spleen (Figure S3C), as well as in tumors (Figure 2G), while lymphocytes showed minimal uptake in all investigated tissues (Figure 2G).
Before we ventured into therapeutic studies, we investigated MTP10-HDL’s toxicity profile in mice. We first performed ELISA on mouse serum at 6 and 24 hours after injection. At 6 hours post-injection, we found a moderate increase in serum TNF-α levels that were normalized after 24 hours, indicative of an initial immune response that did not result in a cytokine storm (Figure S4A). Furthermore, we performed blood chemistry of mice treated with MTP10-HDL and did not observe signs of renal toxicity or liver damage (Figure S4B). Histology of spleen and liver sections showed no pathological morphological changes (Figure S4C). Collectively, the in vitro trained immunity assays, in vivo biodistribution and toxicity experiments revealed MTP10-HDL’s favorable characteristics for immunotherapeutic studies.
MTP10-HDL treatment provokes trained immunity-mediated anti-tumor activity
We first investigated MTP10-HDL’s ability to suppress tumor growth. To that aim, we performed an in vivo dose response study in C57BL/6 mice that were subcutaneously injected with 1×10⁵ B16F10 melanoma cells. One week after tumor inoculation, when palpable tumors were established (~20 mm3), mice received either control phosphate-buffered saline (PBS) treatment or one of six different MTP10-HDL regimens, intravenously. The latter regimens consisted of one, two, or three intravenous injections of either a low (0.375 mg/kg) or high (1.5 mg/kg) MTP dose. Tumor size was monitored by daily caliper measurements. We observed clear dose- and regimen-dependent tumor growth inhibition without changes in bodyweight (Figures 3A and S4D). Significantly different tumor growth rates in the mice treated with intensive regimens (two and three MTP10-HDL injections at 1.5 mg/kg MTP), when compared to the PBS-treated group (p = 0.0126; p = 0.0039), were measured. We found the mean tumor volume of 604 ± 99 mm3 in the treatment group subjected to the most effective regimen to be nearly half of, and significantly different from, the control group (1099 ± 173 mm3, p = 0.0002).
Figure 3. MTP10-HDL treatment inhibits tumor growth and activates HSCs.
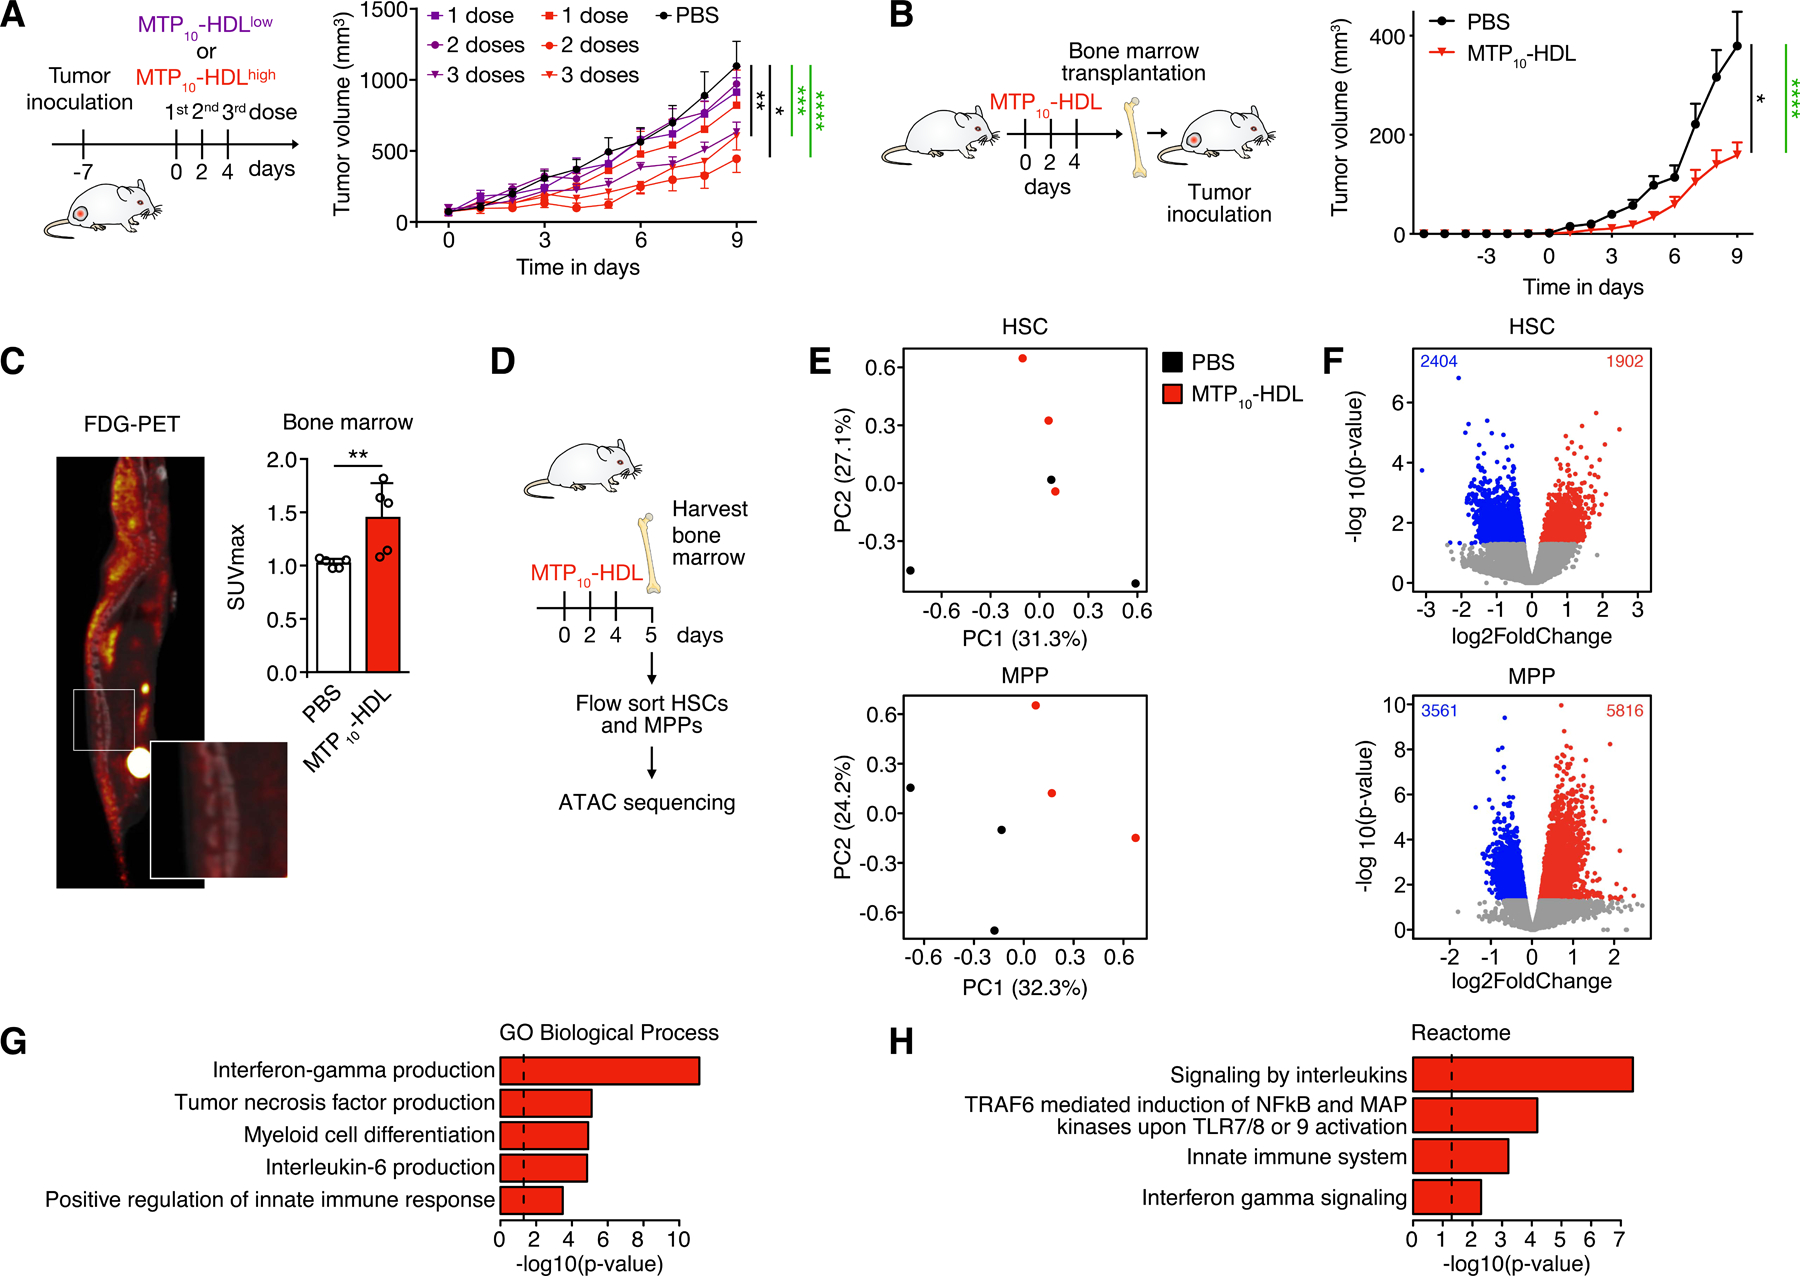
(A) In vivo tumor growth profiling in C57BL/6 mice inoculated with 1×10⁵ B16F10 tumor cells. Tumor growth curves of the different treatment groups are shown. Mice received either PBS or one, two, or three intravenous injections at either a low (0.375 mg/kg) or high (1.5 mg/kg) MTP10-HDL dose. A clear dose response was observed. (n=8–10 per group) Significance was calculated for tumor growth rate (black) and tumor size (green).
(B) Tumor growth curves in bone marrow transplantation study. Naïve radiated mice received bone marrow from donors treated PBS or MTP10-HDL. Tumor inoculation of 1×10⁵ B16F10 cells was performed after a 6-week recovery period. A significant reduction in tumor growth was observed in mice that received bone marrow from mice treated with MTP10-HDL. (n=8–10 per group) Significance was calculated for tumor growth rate (black) and tumor size (green).
(C) 18F-FDG-PET of C57BL/6 mice treated with MTP10-HDL. 18F-FDG was intravenously injected one hour before PET/CT imaging. A higher SUVmax of the bone marrow was observed in mice injected with MTP10-HDL, indicating increased metabolic activity. (n=5 per group)
(D) Schematic overview of the performed ATAC sequencing experiments. C57BL/6 mice were treated with either PBS or MTP10-HDL. At day 5, bone marrow was harvested and sorted for HSCs and MPPs and these cells were subsequently subjected to ATAC sequencing.
(E) Principle component analysis of ATAC-sequencing data shows clustering of different treatment conditions in MPPs and HSCs.
(F) Volcano plot displaying open chromatin loci as determined by ATAC sequencing in HSCs (top) and MPPs (bottom). Average signal is represented as log2 fold change. Significantly up- (non-adj. p value < 0.05, log2FC > 1) and downregulated (non-adj. p value < 0.05, log2FC < −1) peaks are shown.
(G-H) Overrepresented trained immunity-associated pathways that were upregulated in MPPs after MTP10-HDL treatment. Results from the Gene Ontology Biological Processes (G) and Reactome library (H) are displayed. Data are presented as mean ± SD and mean ± SEM for tumor growth experiments. P values were calculated using a Mann–Whitney U tests (two-sided) or an unpaired t-test (two-tailed). *p < 0.05, **p < 0.01, ***p < 0.001, ****p < 0.0001, ns= not significant. See also Figure S4.
In two separate animal cohorts, we performed additional control experiments. In the first experiment we compared free MDP- and non-functionalized (bare) HDL against PBS-treated animals. We found no significant differences in tumor growth rates. (Figure S4E). In a separate experiment, we found MTP10-HDL administered intraperitoneally to not exhibit favorable bone marrow accumulation (Figure S4F and S4G) and not to impact tumor growth (Figure S4H). Since mice tolerated intravenously MTP10-HDL treatments without weight loss or other signs of toxicity, we applied the most effective regimen, i.e., three injections of 1.5 mg/kg MTP10-HDL, in ensuing experiments (Figure 3A).
As described above, intravenously administered MTP10-HDL accumulates in the bone marrow (Figure 2A–E). The induction of myelopoiesis is an intrinsic part of the trained immunity phenotype and we therefore hypothesized that the bone marrow is critical for MTP10-HDL’s anti-tumor effect (Mitroulis et al., 2018). We therefore transplanted bone marrow from mice treated with either MTP10-HDL or PBS into non-treated (naïve) mice. In the first experiment, naïve mice received the bone marrow transplant directly after irradiation and were inoculated with 1×10⁵ B16F10 melanoma cells 6 weeks thereafter. In a similar experiment on non-irradiated mice, tumor cell inoculation was performed the day after bone marrow transplantation. Both experiments revealed a significant difference in tumor size at day 9, but the size difference was more pronounced in the irradiated mice (MTP10-HDL: 159 ± 25 mm3; PBS: 379 ± 69 mm3, p < 0.0001, Figure 3B) compared to the non-radiation experiment (MTP10-HDL: 362 ± 83 mm3; PBS: 613 ± 87 mm3, p < 0.0001, Figure S4I). In line with the differences in tumor size, we found a significant decrease in tumor growth rate in the irradiated mice that received bone marrow from treated mice as compared to control (p = 0.0359) (Figure 3B). These results are indicative of the bone marrow’s important contribution to MTP10-HDL nanoimmunotherapy’s anti-tumor effects.
MTP10-HDL treatment: mode-of-action
Next, we elucidated the mechanism underlying MTP10-HDL’s anti-tumor effect in C57BL/6 mice without tumors. Trained immunity is a state of hyperresponsiveness that results from myeloid cells’ metabolic rewiring, including heightened glycolysis (Arts et al., 2016). Because In vivo 18F-fluorodeoxyglucose (18F-FDG)-PET imaging can visualize and quantify metabolic activity, we intravenously injected C57BL/6 mice with 18F-FDG at day five after the first MTP10-HDL injection. PET imaging revealed a significantly higher 18F-FDG uptake in the bone marrow of MTP10-HDL treated animals. The mean maximum standardized uptake value (SUVmax) in this treatment group was 1.45 ± 0.31, while the control group had an SUVmax of 1.02 ± 0.04 (P = 0.017) (Figure 3C).
The critical hallmark of trained immunity is epigenetic rewiring of myeloid progenitor cells. To asses these cells’ epigenetic state following MTP10-HDL treatment, we used an assay transposase-accessible chromatin sequencing (ATAC sequencing) (Buenrostro et al., 2013). HSCs and MPPs from six mice were pooled and processed for library creation (Figure 3D). Principal component analysis shows a relationship between samples based on the chromatin structure (Figure 3E), which was stronger in the treatment group. We found MPPs to be significantly more affected by MTP10-HDL treatment than HSCs (Figure 3F). Pathway analysis of the MPP ATAC sequencing data (Figure 3G and 3H) revealed that chromatin became more accessible near promoters of genes regulating key cytokines like tumor necrosis factor and IL-6. In addition to epigenetic shifts in immune system regulation, we also found that MPPs of mice treated with MTP10-HDL showed a more open chromatin for genes regulating pathways related to myeloid activation and differentiation.
Transcriptomic changes in HSCs and MPPs were studied by RNA sequencing. Bone marrow from treated and untreated mice was harvested and the HSCs were isolated by flow sorting. HSCs from four mice were pooled and samples of total RNA were isolated for sequencing (Figure 3D). Principal component analysis and unsupervised hierarchical clustering showed that treatment with MTP10-HDL treatment causes a transcriptional shift in a wide range of genes (Figure S4J and S4K). Pathway analysis performed on both HSC and MPP data demonstrated that genes associated with innate immune function were significantly upregulated as well as several pathways associated with metabolic rewiring. By contrast, pathways involved in the adaptive immune system and B cell activation were overrepresented in the downregulated genes (Figure S4L and S4M).
The trained immunity-induced epigenetic and transcriptomic changes in HSCs and MPPs result in a myeloid cell production bias. To study myelopoiesis in detail, we first treated three groups of C57BL/6 mice with either PBS, bare HDL or MTP10-HDL and concurrently injected them with the thymidine analogue 5-bromo-2’-deoxyuridine (BrdU), a compound that incorporates into DNA during replication and is used to study cellular proliferation rates. Flow cytometry analyses revealed significantly more BrdU-positive hematopoietic stem cells (HSCs) and multipotent progenitors (MPPs), with increases of 259% (p = 0.0021) and 168% (p = 0.0003), respectively, in the MTP10-HDL-treated mice compared to PBS-treated mice (Figure 4A). These increased proliferation rates resulted in elevated MPP and HSC counts (Figure 4B) and increased numbers of the progenitor subsets MPP3 and MPP4 in MTP10-HDL-treated mice as compared to controls (Figures 4C and S5A).
Figure 4. MTP10-HDL treatment induces trained immunity in the bone marrow.
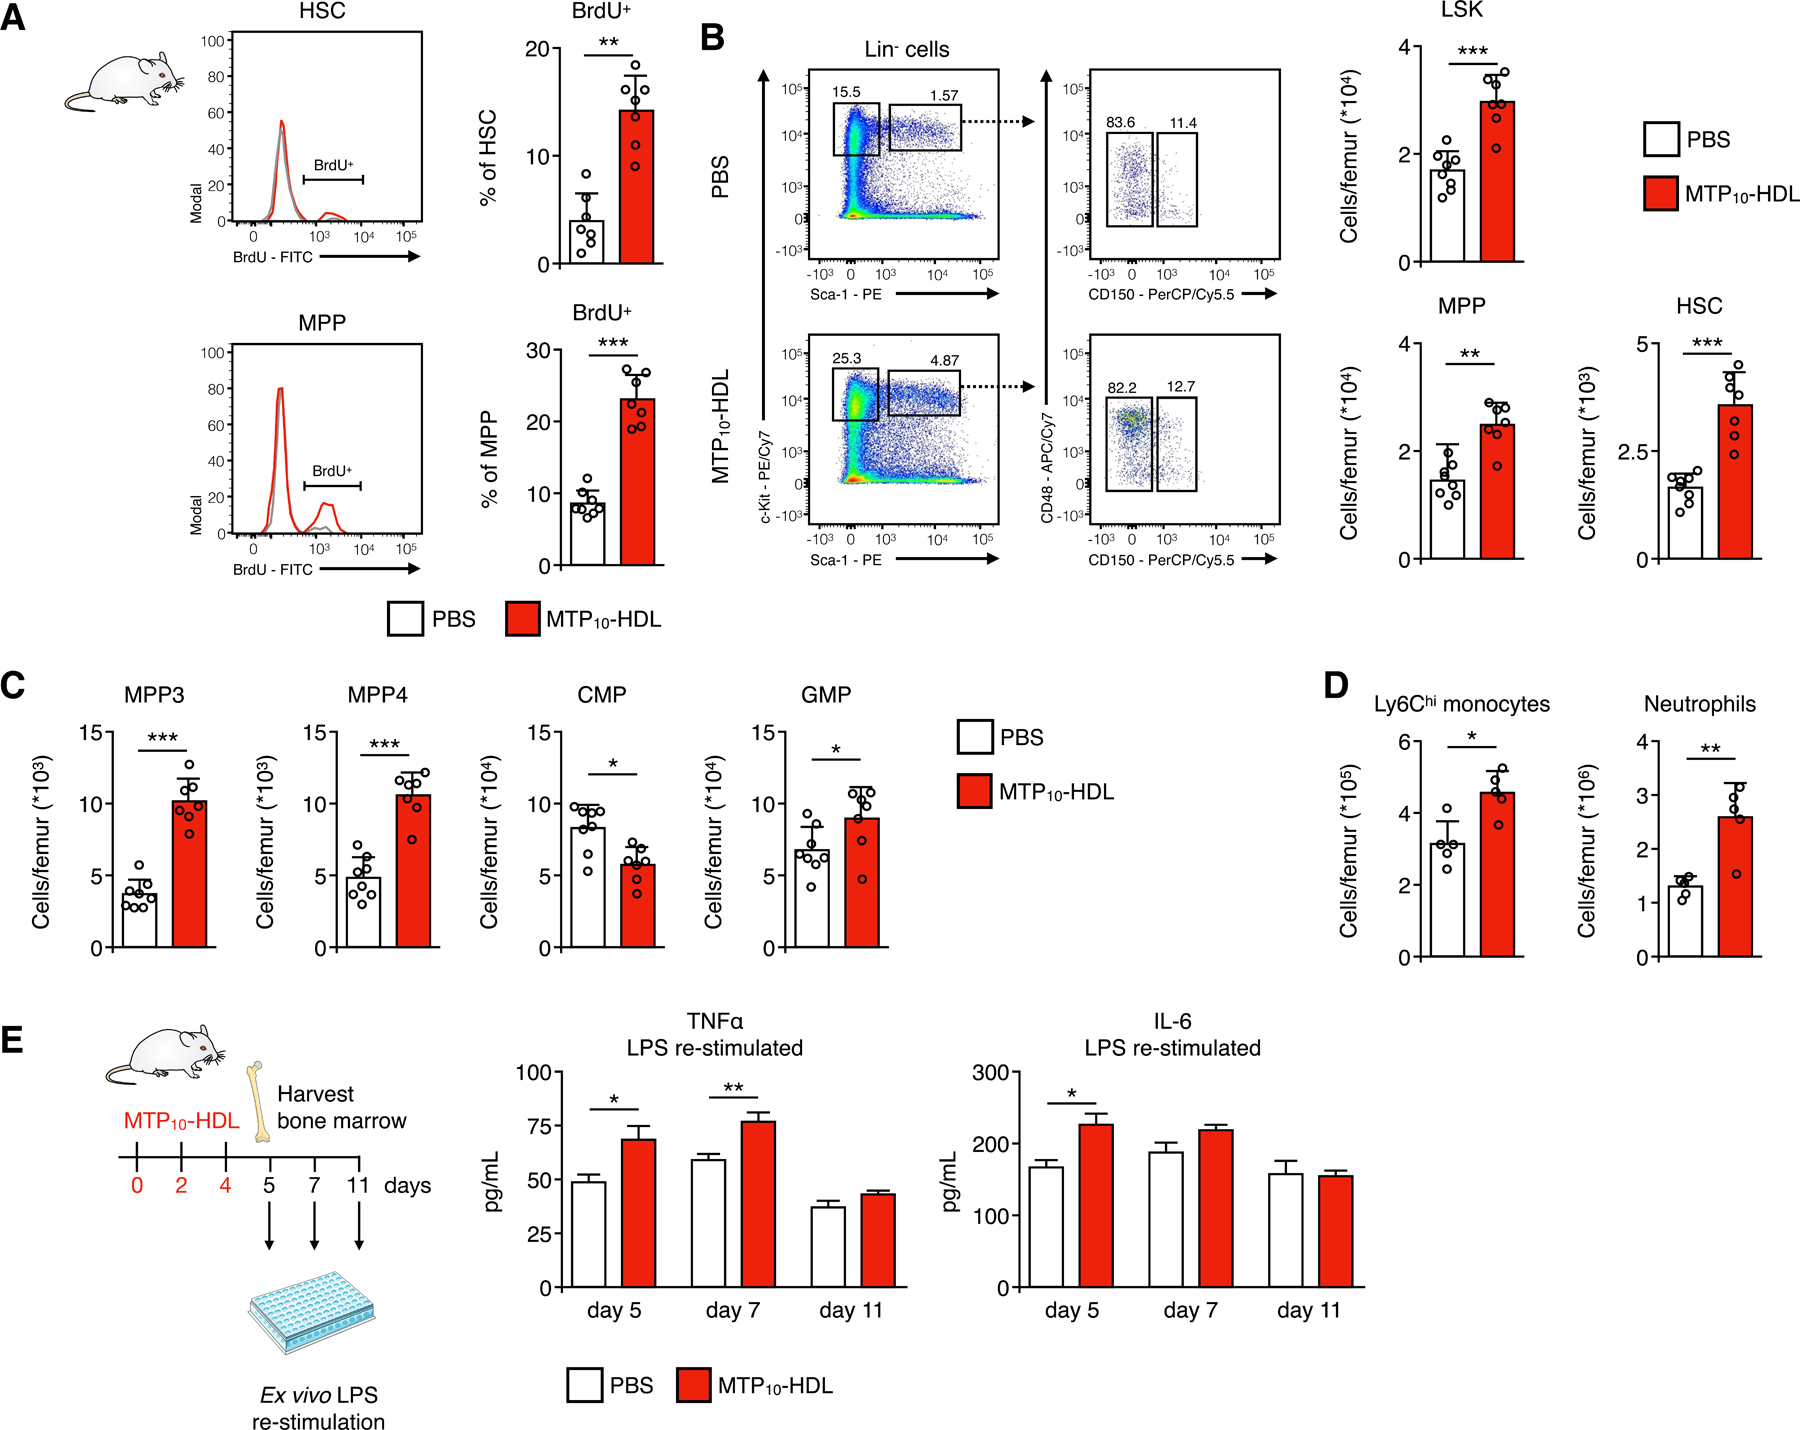
Representative flow cytometry plots of bone marrow harvested from C57BL/6 mice treated with MTP10-HDL or PBS (A) BrdU proliferation assay. Mice treated with either MTP10-HDL or PBS received a BrdU injection 48 hours before euthanization, after which bone marrow was harvested. BrdU-positive hematopoietic stem cells (HSCs) and multipotent progenitors (MPPs) increased by 259% and 168%, respectively, indicating increased proliferation. (n=7–8 per group)
(B-C) Representative flow cytometry plots of bone marrow harvested from C57BL/6 mice treated with MTP10-HDL or PBS and graphs showing the frequency of HSCs, MPPs, Lineage− Sca1+ c-kit− (LSK), MPP3, MPP4, granulocyte-monocyte progenitors (GMPs) significantly increases after MTP10-HDL. Whereas the amount of common myeloid progenitors (CMPs) significantly decreases. (n=7–8 per group)
(D) Frequency of Ly6Chi monocyte and neutrophil counts significantly increases after MTP10-HDL treatment. (n=5 per group)
(E) Cytokine concentrations in medium after restimulation of bone marrow cells harvested from C57BL/6 mice at day 5, 7 or 11 that were treated with either MTP10-HDL or PBS. At day 5, a significant increase in TNF-α and IL-6 was observed. (n=5–8 per group)
Data are presented as mean ± SD. P values were calculated using a Mann–Whitney U tests (two-sided) or an unpaired t-test (two-tailed). *p < 0.05, **p < 0.01, ***p < 0.001, ****p < 0.0001, ns= not significant. See also Figure S5.
Interestingly, we also found higher granulocyte-monocyte progenitor (GMP) numbers (PBS: 6.8×10⁴ ± 0.6×10⁴ cells/femur; MTP10-HDL: 9.0 ×10⁴ ± 0.8 ×10⁴ cells/femur, p = 0.0401) (Figures 4C and S5B), which likely result in an elevated monocyte count. To confirm this, we harvested bone marrow from femurs and tibia and quantified monocytes. This revealed that MTP10-HDL treatment significantly increased monocyte and neutrophil counts as compared to control (Figure 4D). Treatment with bare HDL did not result in significant changes in cell populations as compared to PBS, confirming that the observed myelopoietic response is MTP/NOD2 mediated (Figures S5C, S5D and S5E).
After establishing increased myelopoiesis, we assessed the training state of bone marrow cells following MTP10-HDL treatment by determining inflammatory cytokine production following ex vivo LPS re-stimulation. Mice were treated with MTP10-HDL or PBS after which bone marrow was harvested at days five, seven, and eleven. Bone marrow cells were plated and subsequently re-stimulated with LPS. We found elevated expression of TNF-α (p = 0.0148) and IL-6 (p = 0.0317) upon LPS restimulation at day five, thus confirming MTP10-HDL’s training capabilities (Figure 4E).
In summary, we demonstrated MTP10-HDL’s ability to inhibit tumor growth by engaging bone marrow progenitors in vivo and enhancing their proliferation and metabolism, thereby resulting in higher levels of myeloid cells with increased cytokine response upon heterologous stimulation, a phenotype associated with the induction of trained immunity.
MTP10-HDL treatment potentiates checkpoint inhibitor immunotherapy
Our in-depth analysis of MTP10-HDL treatment’s action mechanism revealed increased epigenetic rewiring underlying heightened expression of genes that regulate proliferation and glycolysis of HSC and myeloid cell progenitors in the bone marrow. These cells’ resulting increased proliferative activity induced myelopoiesis. At a systems level, we studied myeloid cells in vivo using CD11b-specific nanobodies radiolabeled with 89Zr to generate the 89Zr-CD11b-Nb radiotracer for immuno-PET imaging (Rashidian et al., 2017). C57BL/6 mice bearing B16F10 melanomas were treated with MTP10-HDL or PBS, while at day seven or fourteen the animals were administered 89Zr- CD11b-Nb (Figure 5A). Twenty-four hours after receiving 89Zr-CD11b-Nb administration, mice underwent PET/CT imaging (Figure 5B). We found a significantly higher SUV in the spleen one day post-treatment (day eight) (SUVmax MTP10-HDL: 2.9 ± 0.4; PBS: 1.8 ± 0.3, P = 0.0079) (Figure 5C). Bone marrow image analysis showed a trend towards increased CD11b+ cells at day eight (SUVmax MTP10-HDL: 1.6 ± 0.2; PBS: 1.5 ± 0.2, p = 0.1508), which became significant at day 15 (SUVmax MTP10-HDL: 4.2 ± 0.3; PBS: 3.6 ± 0.2, p = 0.0079).
Figure 5. Inducing trained immunity potentiates checkpoint blockade therapy.
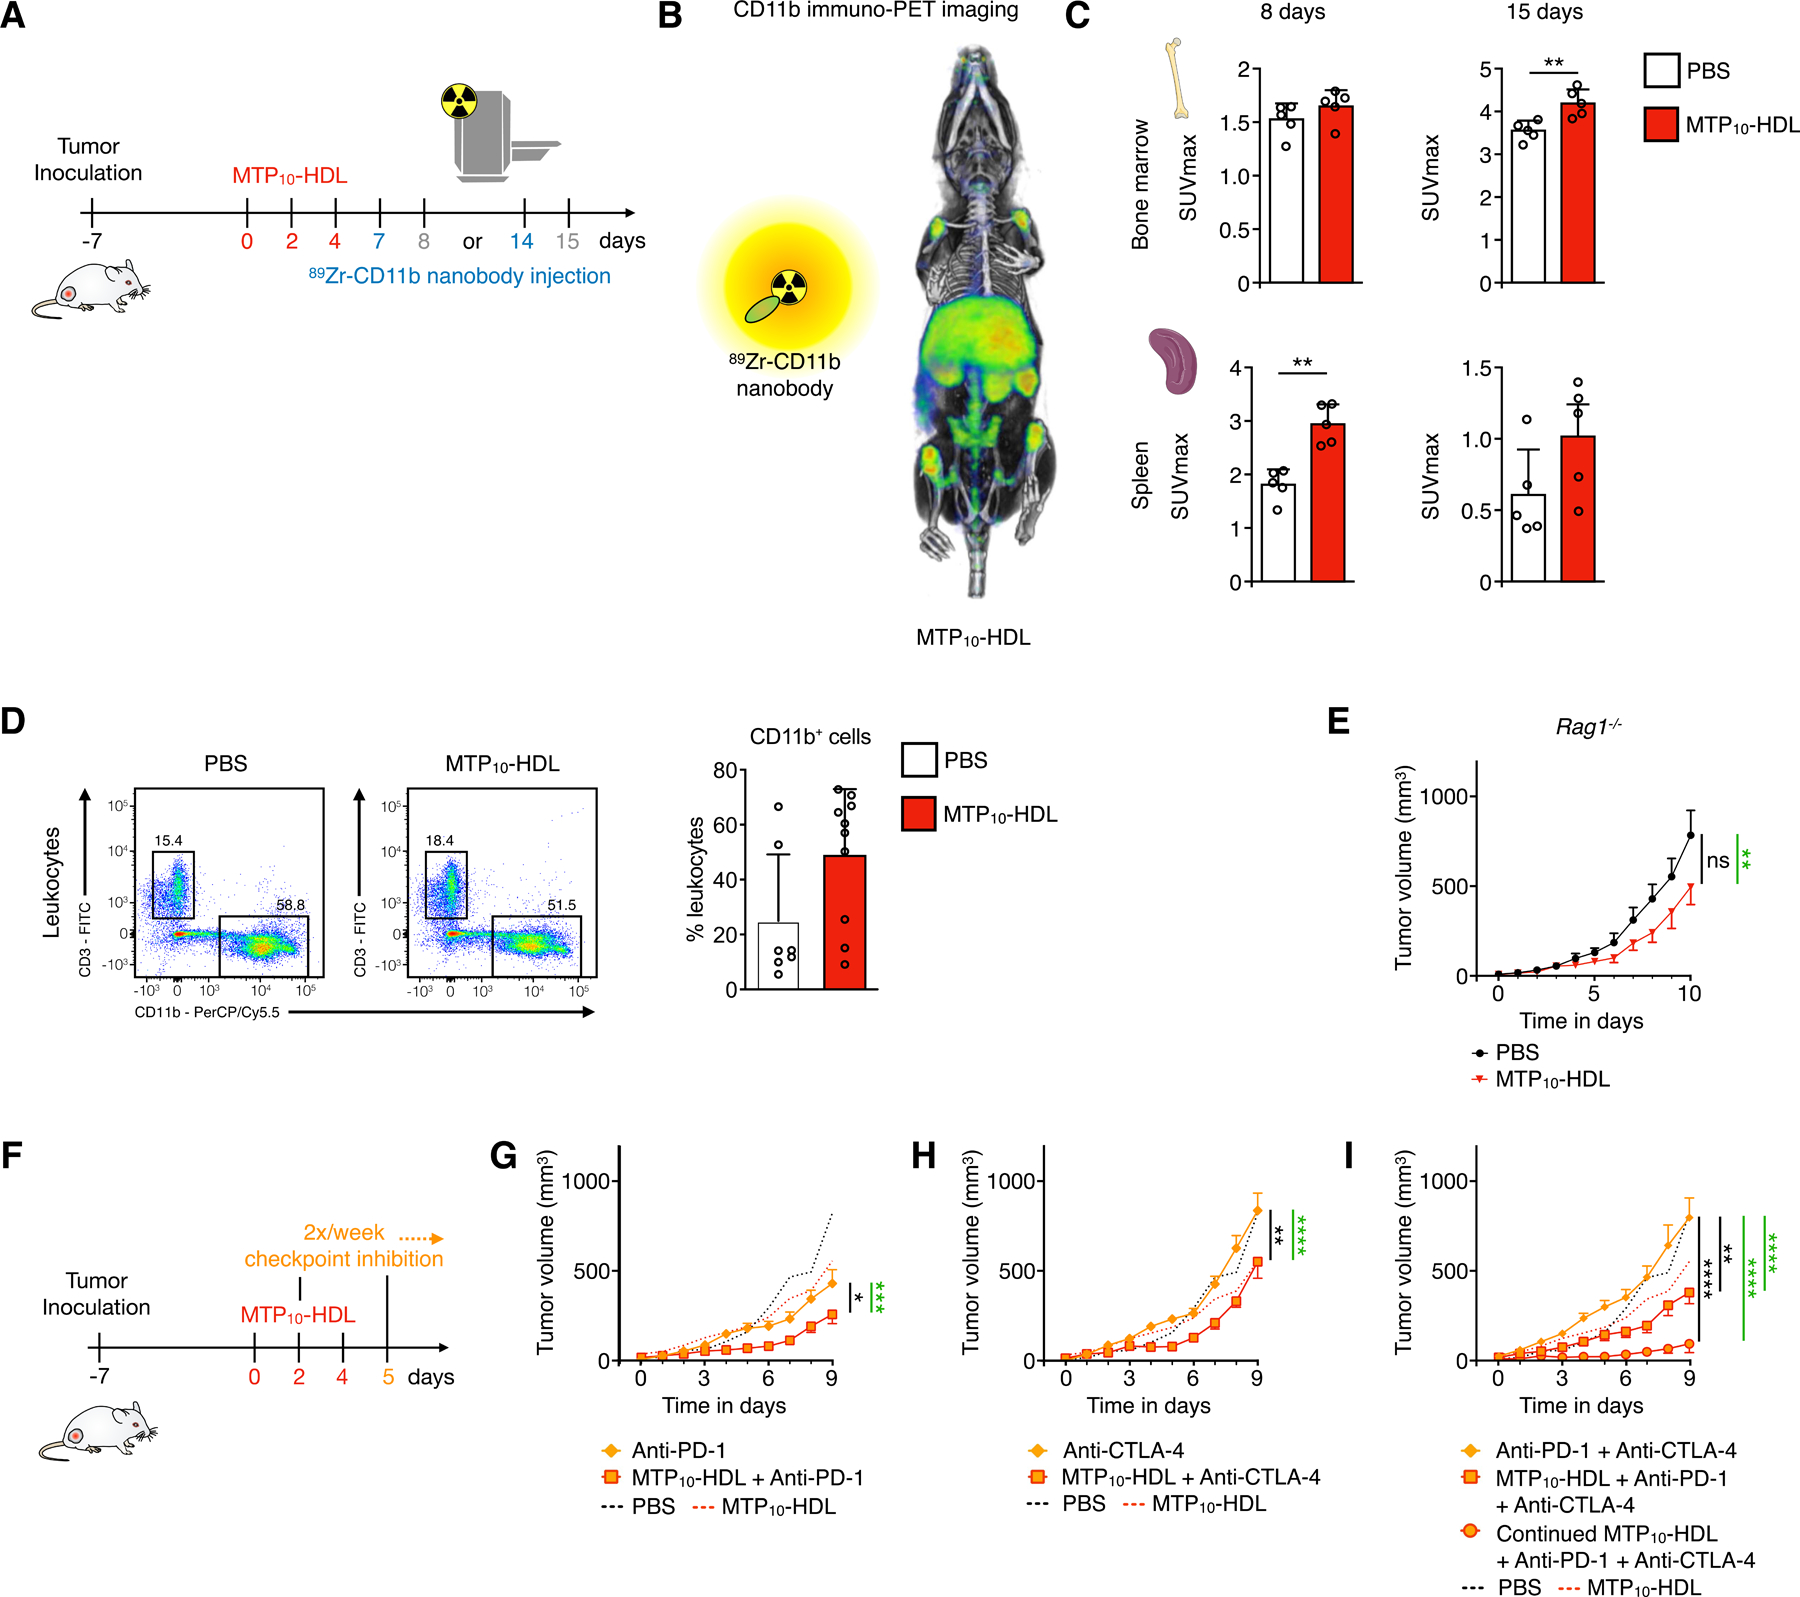
(A-C) C57BL/6 mice inoculated with 1×10⁵ B16F10 cells treated with either MTP10-HDL or PBS received an intravenous injection of 89Zr-CD11b-NB at day seven or day 14. 89Zr-CD11b-NB was allowed to circulate for 24 hours before PET/CT imaging was performed. There is a higher SUVmax in the bone marrow and the spleen indicating higher amounts of CD11b-expressing cells present. (n=5 per group)
(D) Flow cytometry gating strategy for tumors 24 hours after MTP10-HDL administration. Immune cells were isolated using Percoll gradient. A significant decrease in the amount of monocytes as a percentage of CD11b positive cells and an increase in neutrophils was observed. (n=7–10)
(E) Rag1−/− mice inoculated with 1×10⁵ B16F10 cells were treated with either MTP10-HDL or PBS and tumor size was measured daily. Treatment with MTP10-HDL shows significant tumor inhibition but no inhibition of tumor growth rate. Significance was calculated for tumor growth rate (black) and tumor size (green). (n=10 per group)
(F) Schematic overview of checkpoint inhibitor experiment. C57BL/6 mice inoculated with 1×10⁵ B16F10 cells were randomized into one of 7 treatment groups. PBS and MTP10-HDL results are shown in graphs’ dotted lines. Primary outcome was the comparison between checkpoint inhibitor immunotherapy alone versus in combination with MTP10-HDL. Significance was calculated for tumor growth rate (black) and tumor size (green).
(G) Anti-PD-1 shows no significant tumor growth rate inhibition but does significantly decrease in tumor size. Adding MTP10-HDL significantly inhibits tumor growth rate as compared to anti-PD-1.
(H) Anti-CTLA-4 does not significantly inhibit tumor growth rate or size, but combination with MTP10-HDL does significantly inhibit tumor growth rate and size.
(I) Combining anti-PD-1 + anti-CTLA-4 has no significant effect on tumor growth rate and tumor size. Adding MTP10-HDL dramatically decreases the tumor growth rate, an effect that is even more pronounced after the MTP10-HDL regimen rises from three to six injections.
Data are presented as mean ± SD and mean ± SEM for tumor growth experiments. P values were calculated using a Mann–Whitney U tests (two-sided) or an unpaired t-test (two-tailed). *p < 0.05, **p < 0.01, ***p < 0.001, ****p < 0.0001, ns= not significant.
These results combined with our transplantation study show that MTP10-HDL treatment modulates the myeloid compartment resulting in tumor growth inhibition. Therefore, we excised B16F10 tumors after the last MTP10-HDL treatment and isolated the immune cells for further flow cytometric analysis. Although we found a decrease of the monocyte population relative to the myeloid cells with a concurrent increase of neutrophils, their absolute numbers did not change (Figure 5D and S5F).
To study innate and adaptive immunity’s contributions to the anti-tumor effect, we performed experiments in C57BL/6 Rag-1 knockout (Rag1−/−) mice that lack mature T cells and B cells. Although we observed a significantly smaller mean tumor size in the MTP10-HDL-treated group as compared to the PBS-treated control group at day 10 (p = 0.0039) (Figure 5E), the tumor growth rates did not differ significantly (p = 0.0874). This demonstrates that myeloid cell activation is crucial for the observed antitumor effects, but optimal therapeutic activity requires engagement with adaptive immune cells.
In order to explore this, we investigated MTP10-HDL’s ability to modulate the immunosuppressive tumor microenvironment and potentiate checkpoint blockade immunotherapy (Anderson et al., 2017; Pitt et al., 2016). To that aim, we performed an extensive comparative tumor growth study in C57BL/6 mice bearing B16F10 melanoma. Seven days after 1×10⁵ tumor cell injections, when established tumors were present, mice were randomized and allocated one of seven treatment groups. The seven treatment groups consisted of one MTP10-HDL monotherapy group, three checkpoint inhibitor groups (anti-PD-1, anti-CTLA-4, or the combination anti-PD-1 + anti-CTLA-4), and three groups in which MTP10-HDL treatment was combined with the three different checkpoint inhibitor regimens. Checkpoint inhibitors were administered intraperitoneally at a dose of 200 μg, twice a week, starting at day two of the experiment (Figure 5F). The primary focus in these experiments was to compare checkpoint inhibitor immunotherapy offered alone versus in combination with our trained immunity-inducing MTP10-HDL therapy.
Anti-PD-1 monotherapy displayed a small anti-tumor effect as compared to the PBS control (p < 0.0001) (Figure 5G). Combining anti-PD-1 with MTP10-HDL treatment displayed a significantly lower tumor growth rate than anti-PD-1 monotherapy (p = 0.0161). We did not observe anti-tumor effects for anti-CTLA-4 monotherapy, but the combination with MTP10-HDL treatment significantly inhibited tumor growth rate (p = 0.0090) (Figure 5H). Most interestingly, while anti-PD-1 + anti-CTLA-4 treatment did not show any anti-tumor effects, combining it with MTP10-HDL strongly suppressed tumor growth rate (p = 0.0048) (Figure 5I). At day nine, the mean tumor volume was half that of PBS- and anti-PD-1 + anti-CTLA-4-treated mice (MTP10-HDL and anti-PD-1 + anti-CTLA-4: 382 ± 62 mm3; PBS: 822 ± 161 mm3, p < 0.0001). Finally, and motivated by a good MTP10-HDL tolerability, one group of mice received six MTP10-HDL injections, combined with anti-PD-1 + anti-CTLA-4 treatment. This resulted in a more than eightfold reduction in mean tumor volume, as compared to control, at day nine (MTP10-HDL: 95 ± 49 mm3; PBS: 822 ± 161 mm3, p < 0.0001) (Figure 5I).
MTP10-HDL treatment modifies the tumor microenvironment
After establishing that MTP10-HDL treatment rebalances the immune cell populations in the bone marrow and the spleen, a change that suppresses tumor growth and primes the immune system’s susceptibility to checkpoint blockade therapy, we used flow cytometry to further examine leukocyte population changes. Tumor-bearing C57BL/6 mice were treated with either PBS, MTP10-HDL monotherapy, anti-PD-1 + anti-CTLA-4, or combined MTP10-HDL and anti-PD-1 + anti-CTLA-4. We focused on the latter group because anti-PD-1 + anti-CTLA-4 treatment had no effect on tumor growth, but combining it with MTP10-HDL resulted in a strong anti-tumor response. At day five, animals were sacrificed, and single cell suspensions were generated from several tissues, i.e., bone marrow, tumor, blood, and spleen. We employed an extensive multicolor flow cytometry panel that combined myeloid cell markers, including CD11b, Ly6G, and F4/80, as well as T and B lymphocyte markers, including CD3, CD4, CD8, and CD45R (B220). The resulting high-dimensional data set was visualized using the viSNE algorithm, while we used unsupervised clustering to group the cells in phenotypically distinct subsets in a truly unbiased fashion (Figure 6A and 6B).
Figure 6. Trained immunity causes a systemic shift towards myeloid cells.
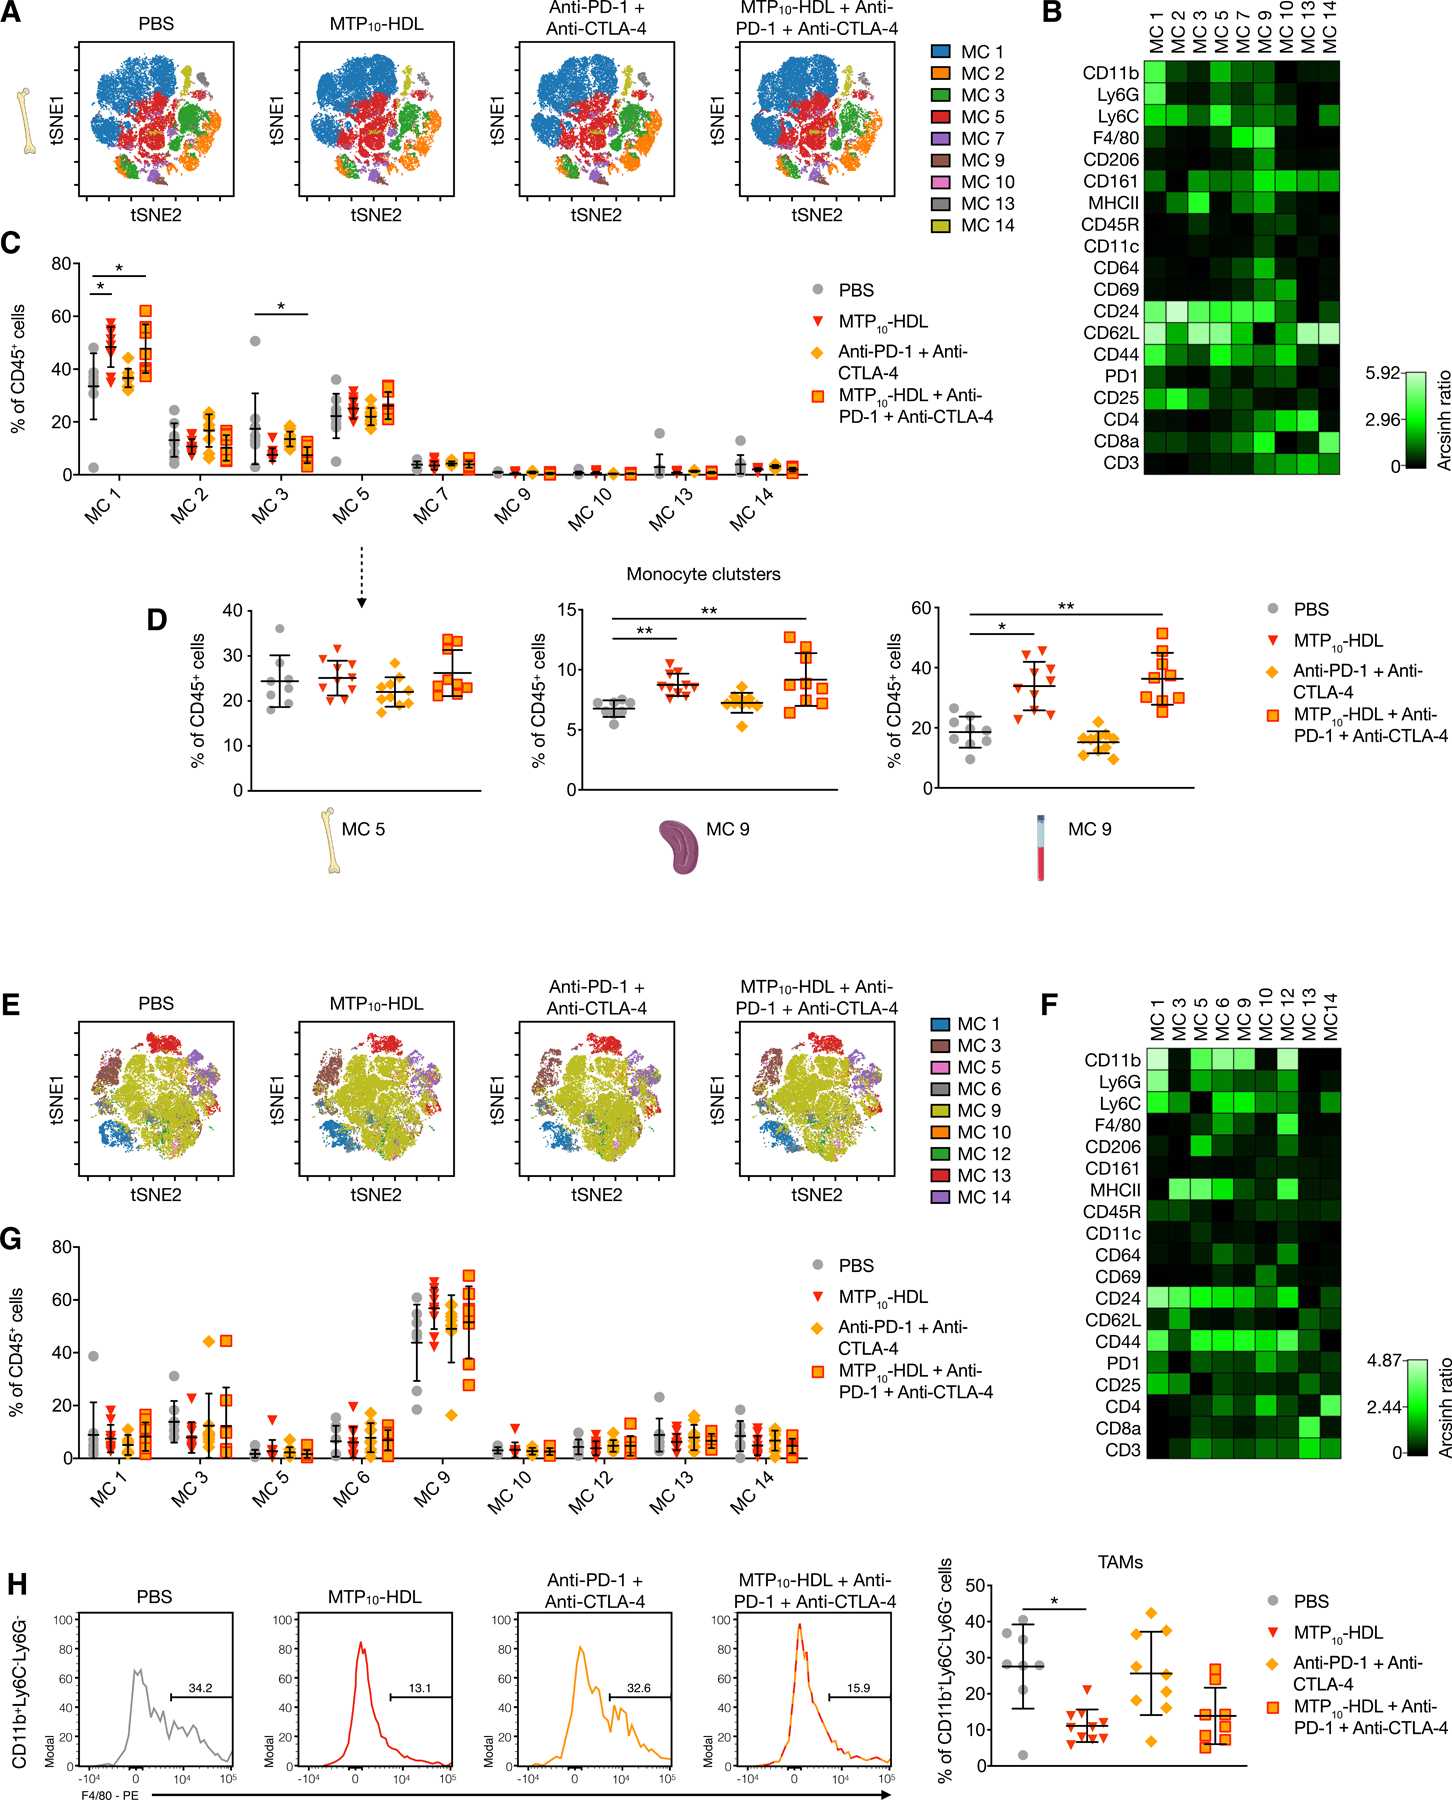
Tumor-bearing C57BL/6 mice were treated with PBS, MTP10-HDL, anti-CTLA-4 + anti-PD-1, or MTP10-HDL combined with anti-CTLA-4 + anti-PD-1. Leukocyte populations in the bone marrow, spleen, and blood were analyzed at day five.
(A) Top panels show viSNE-plots from concatenated bone marrow samples per treatment group. (n=8–10 per group) Pie charts show cell distribution within each metacluster. Metaclusters containing less than 0.5% of total cells were excluded.
(B) Heatmap shows the relative expression of different immune cell markers in each metacluster. Results were normalized by the row’s minimum. MC1: neutrophils, MC5: monocytes, MC13: CD4+ T cells, MC14: CD8+ T cells.
(C) Quantification of cells within each metacluster as a percentage of CD45+ cells. Metacluster 1 shows a significant increase when MTP10-HDL was used as a treatment.
(D) CD11b+, Ly6G−, Ly6C+ metaclusters were selected from bone marrow, spleen, and blood. Marginal increase was observed in the bone marrow’s percentage of monocytes. However, spleen and blood show significant higher monocyte percentages than does control.
(E) Top panels show viSNE-plots from all concatenated tumor samples.
(F) Heatmap shows the relative expression of different immune cell markers in each metacluster. Results were normalized by the row’s minimum.
(G) Percentage of CD45+ cells within each metacluster as a percentage of CD45+ cells.
(H) Histograms of concatenated samples, per treatment group, showing F4/80 expression in CD11b+, Ly6C−, Ly6G− cells and quantification of F4/80+ TAMs per treatment group.
Data are presented as mean ± SD. P values were calculated using a Mann–Whitney U tests (two-sided). *p < 0.05, **p < 0.01, ***p < 0.001, ****p < 0.0001, ns= not significant. See also Figure S6.
Using this method, we observed that MTP10-HDL immunotherapy, as a monotherapy and in combination with anti-PD-1 + anti-CTLA-4 treatment, significantly increased the myeloid cell compartment in the bone marrow, spleen, and blood (Figure 6C, 6D and S6), which is in line with the activation of HSCs and myeloid-biased progenitors, reported in Figure 4A and 4B.
Concurrently, we focused on analyzing tumor leukocyte subpopulations changes that result from the different treatments (Figure 6E–G). Importantly, the regimens involving MTP10-HDL treatment lowered the amount TAMs (Figure 6H). The reduction in this population is likely one of the underlying mechanism for MTP10-HDL’s anti-tumor effects and its ability to prime the immune system for effective checkpoint blockade therapy.
Biodistribution and safety profile of MTP10-HDL in non-human primates
Compared to humans, mice are much more resilient to immunostimulation, which can hinder the translation of newly developed immunotherapies (Warren et al., 2010). Non-human primates are widely considered to be a superior model to investigate the toxicity profile and biodistribution of immunotherapies (Herodin et al., 2005; Lameijer et al., 2018). We therefore injected two non-human primates with 89Zr-labeled MTP10-HDL and subjected them to full body PET with magnetic resonance imaging (PET/MRI) to study biodistribution in live non-human primates. Following intravenous 89Zr-MTP10-HDL administration, dynamic PET/MRI imaging (Figure 7A) showed fast bone marrow and spleen accumulation, as well as liver uptake (Figure 7B). At 48 hours post injection, we did not observe 89Zr -MTP10-HDL uptake in vital organs such as the brain. Similar to what we observed in mice, 89Zr -MTP10-HDL was found predominantly accumulated in the bone marrow and spleen to relatively favorable levels as compared to the liver (Figure 7C and 7D).
Figure 7. In vivo behavior of the MTP10-HDL nanobiologic in a non-human primate.
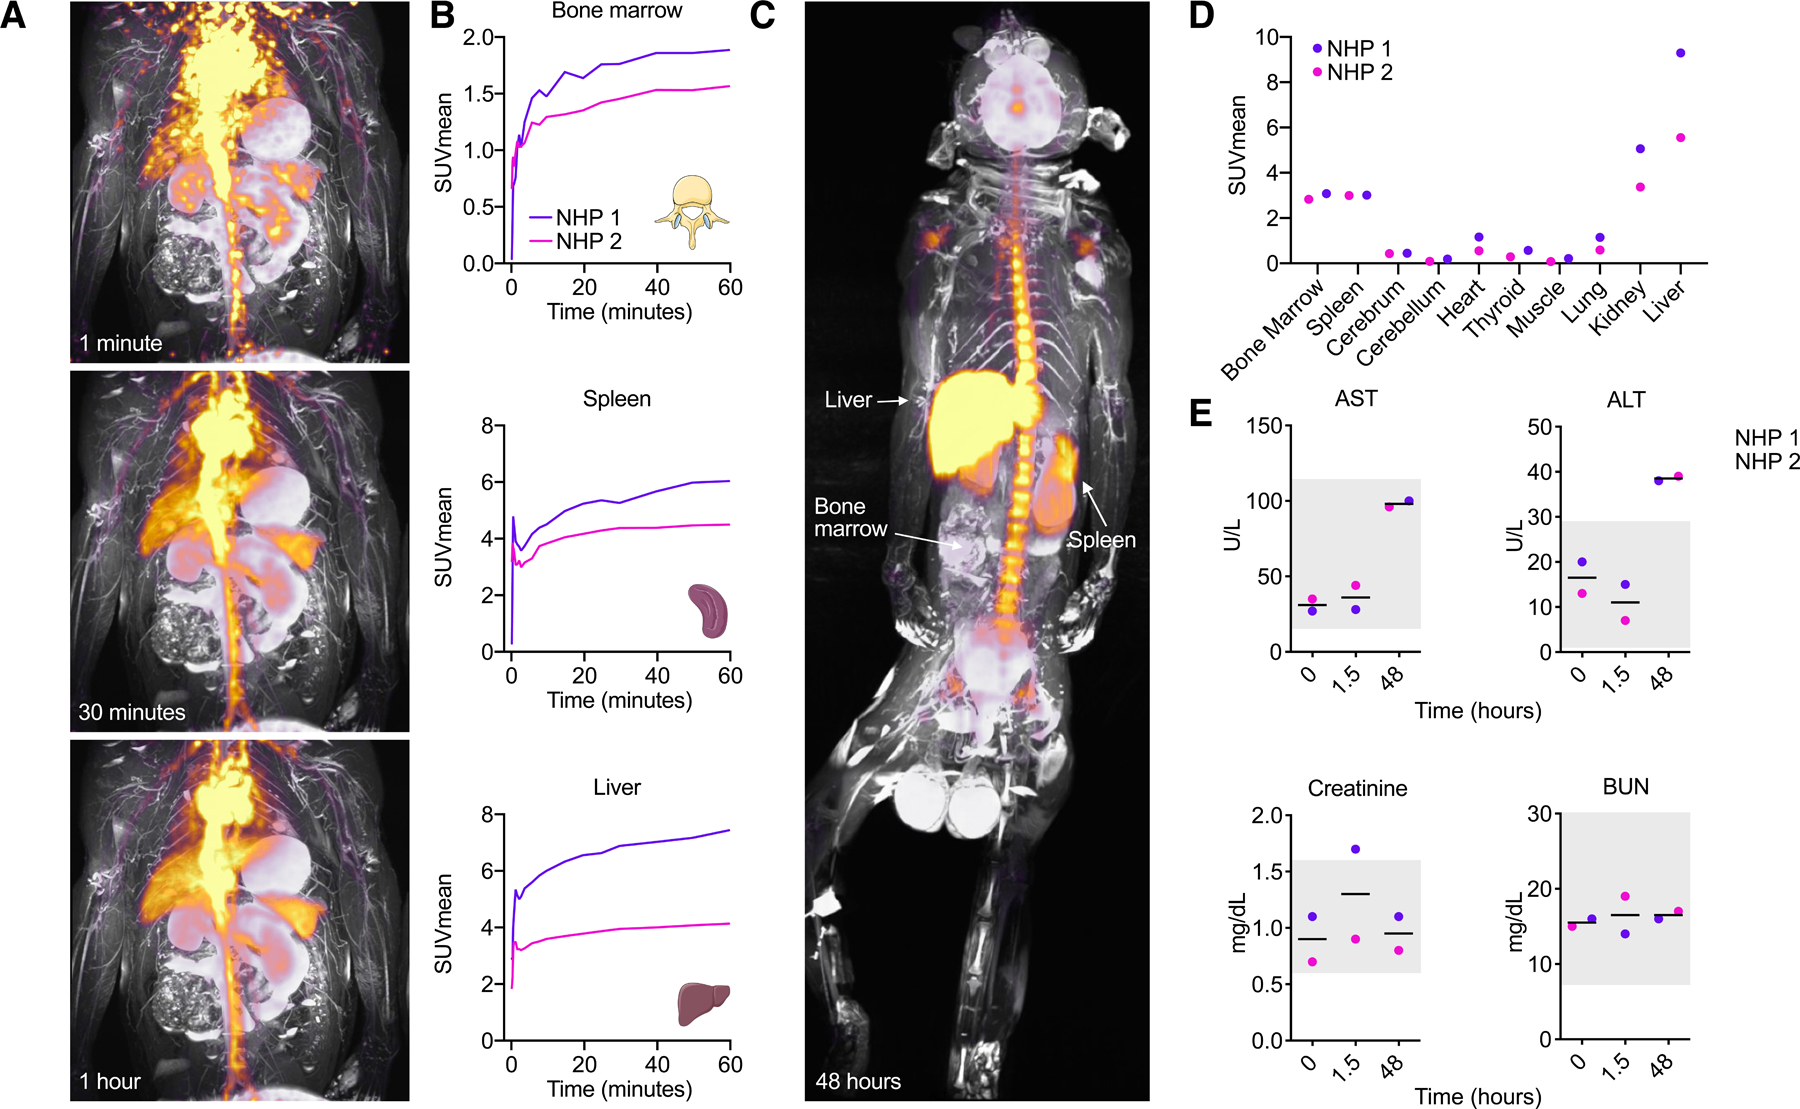
Two adult male non-human primates (Macaca fascicularis) were injected with 89Zr-MTP10-HDL at a dose of 0.0549 mg/kg and subjected to full body PET/MRI to investigate biodistribution. Blood measurements were done to investigate toxicity. (n=2)
(A) Dynamic PET/MRI scans of a non-human primate 1, 30 and 60 minutes after injection of 89Zr-MTP10-HDL. Fast bone marrow and spleen accumulation, as well as liver uptake can be observed.
(B) Organ SUVmean measurements over time revealed rapid uptake in the bone marrow, spleen and liver.
(C) PET/MRI scan after 48 hours after 89Zr-MTP10-HDL injection displays a favorably high bone marrow and spleen accumulation relative to the liver.
(D) Organ specific SUVmean after 48 hours shows high uptake in the bone marrow, spleen and liver. No uptake is found in the brain.
(E) Blood chemistry performed on non-human primate serum taken at 0, 1.5 and 48 hours after 89Zr-MTP10-HDL administration. The grey box indicates reference values. ALT, AST, creatine, BUN levels show no signs of severe toxicity.
Data are presented as mean ± SD. P values were calculated using a Mann–Whitney U tests (two-sided). *p < 0.05, **p < 0.01, ***p < 0.001, ****p < 0.0001, ns= not significant.
Simultaneously, blood was collected at three different time points to assess toxicity. The first hours following 89Zr-MTP10-HDL injection, non-human primates were monitored for hemodynamic instability. No significant changes in heart frequency or electrocardiogram were observed. Blood chemistry revealed acceptable changes in ALT, AST, creatinine and BUN, indicating that MTP10-HDL treatment is well tolerated (Koo et al., 2019) (Figure 7E). Collectively, these results indicate that the biodistribution and toxicity profile of MTP10-HDL treatment were very similar in mice and non-human primates, underlining the translational potential of our nanobiologic immunotherapy.
Discussion
In this study, we showed that inducing trained immunity with a bone marrow-avid nanoimmunotherapeutic potently suppresses tumor growth and primes the immune system’s responsiveness to checkpoint blockade therapy. Although immunotherapy has revolutionized cancer treatment, the currently available approaches have several major limitations. For example, single-agent checkpoint blockade therapy benefits only a small fraction of patients and is associated with severe adverse effects (Sharma and Allison, 2015). Numerous immunotherapy combination trials seeking to overcome these challenges are now underway (Tang et al., 2018). Many of these strategies focus solely on T cell responses and are not designed to concurrently engage the innate immune system. For example, bladder cancer treatment with Bacillus Calmette-Guérin (BCG) may be mediated through trained immunity, a process based on epigenetic reprogramming of myeloid cells (Buffen et al., 2014; Kleinnijenhuis et al., 2012), leading to ameliorated lymphocyte responses by augmented antigen presentation (Leentjens et al., 2015). Therefore, it was proposed that trained immunity-based treatments amplify the capabilities of checkpoint inhibition (Netea et al., 2017).
Our approach aims to specifically modulate the innate immune system by inducing trained immunity, which causes the tumor microenvironment to shift from an immunosuppressive to a pro-inflammatory anti-tumor state. Several key findings in this study elucidate the mechanisms behind this shift. We found that MTP10-HDL’s anti-tumor effect is transferable through bone marrow transplantation, which indicates that its therapeutic action originates from HSC and MPP engagement. In this experiments, tumor cells were inoculated 6 weeks after bone marrow transplantation, indicative of the durability of trained immunity induction.
MTP10-HDL treatment causes epigenetic rewiring of HSC and MPP and results in increased myelopoiesis, which is a hallmark of trained immunity (Figure 3) (Mitroulis et al., 2018). Through advanced imaging techniques, we found the trained immunity-induced myelopoiesis causes a systemwide increase of myeloid cells that is both rapid and durable (Figure 5B and 5C). We hypothesize that the elevation in trained monocytes boosts antigen-presenting cells in the tumor microenvironment (signal 1). Furthermore, our results show that myeloid cell hyperresponsiveness, another hallmark of trained immunity, raises cytokine production in vitro and in vivo (signal 3) (Figure 1F and 4E), an effect we expect also occurs within the tumor microenvironment. Together, these factors likely enhance the effect of checkpoint blockade immunotherapy (signal 2, Figure 5F–I). Another aspect of carcinogenesis is the presence of immunosuppressive cells, like TAMs (Mantovani et al., 2008), in the tumor immune microenvironment (DeNardo and Ruffell, 2019). Flow cytometry analyses showed that MTP10-HDL treatment significantly shrank the TAM populations (Figure 5D and 6H), a result that benefits checkpoint inhibitor treatment (Sharma et al., 2017). The latter changes, combined with increasing myelopoiesis by inducing trained immunity, are likely the immunological driving force behind the dramatic tumor growth suppression. Numerous other tumor types, such as glioblastoma multiforme and pancreatic cancer (Lim et al., 2018; Neoptolemos et al., 2018), exhibit an immunoparalyzed or ‘cold’ TME and are therefore insensitive to immunotherapy. The combination of innate immune activation through trained immunity may be used to treat these malignancies, particularly in combination with checkpoint inhibition.
Our carefully designed nanobiologic platform comprises surface-functionalized HDL-based nanodiscs, which are inherently biocompatible and exhibit high in vivo tolerability. The safety of unfunctionalized reconstituted HDL has been established in cardiovascular disease trials (Tardif et al., 2014). MDP and MTP, the incorporated trained immunity compounds, are also well tolerated and their toxicity profiles are well studied (Ogawa et al., 2011). Monotherapy with MTP10-HDL did not affect renal function (Figure S4B), body weight, behavior, and macroscopic features (Langford et al., 2010). While PET imaging displayed liver accumulation, no toxicity was observed in blood chemistry and the liver remained morphologically unaltered (Figure S4B and S4C). MTP10-HDL biodistribution and toxicity were also monitored in non-human primates. Importantly, a similar favorable safety profile was recorded in this translational model. We therefore foresee a direct pathway to clinical translation.
The platform’s flexibility enables the inclusion of different MDP/MTP surface payloads, thus allowing the creation of a trained immunity-promoting nanobiologic library (Tang et al., 2016). Based on a comprehensive screen that simultaneously integrates stability measurements, in vitro trained immunity assays, and in vivo biodistribution studies, we selected MTP10-HDL as the lead candidate. We analyzed MTP10-HDL’s potent anti-tumor properties using a broad approach that integrated RNA sequencing, flow cytometry, and a variety of in vivo imaging modalities. The acquired insights into MTP10-HDL’s anti-tumor mechanism motivated us to combine it with checkpoint inhibition. We found the combination regimen results in an augmented anti-tumor immune response. Our study paves the way for exploiting trained immunity induction as an in vivo cell therapy to treat cancer, both as monotherapy and in combination with other immunotherapeutics.
Limitations and future directions
Our works has limitations. Based on bone marrow transplantation studies, we concluded that MTP10-HDL therapy has a durable anti-tumor effect. However, an extensive longitudinal epigenetic and immunological profiling follow-up study is warranted. This study would entail the transplantation of MTP10-HDL-treated and untreated bone marrow cells into radiated recipient mice. At different time points the recipient bone marrow should be investigated to untangle trained immunity’s durability, its dynamics and how long it exerts anti-tumor effects. The current study focuses on MTP10-HDL treatment’s effects on tumor growth using a B16F10 mouse melanoma model. This model is widely used in cancer immunotherapy research and is known to be resistant to checkpoint inhibitor therapy. Clinically, melanomas in general are immunogenic tumors. We therefore started exploring MTP10-HDL treatment’s effects on tumors with lower immunogenicity. MTP10-HDL treatment can be employed as an anti-tumor monotherapy and has great potential sensitizing less immunogenic tumors to checkpoint inhibitor therapy. The non-human primate data demonstrate that MTP10-HDL avidity for hematopoietic organs is preserved across species and displays a favorable safety profile, paving the way for clinical translation.
STAR Methods
RESOURCE AVAILABILITY
Lead contact
Further information and requests for resources and reagents should be directed to and will be fulfilled by the Lead Contact, Willem J.M. Mulder (willem.mulder@mssm.edu).
Materials availability
This study did not generate new unique reagents
Data and Code availability
Data are available upon request to the Lead Contact. RNA sequencing and ATAC sequencing data are available at the Gene Expression Omnibus (GEO) database (GEO series number GSE126793).
EXPERIMENTAL MODEL AND SUBJECT DETAILS
Inbred mice strains
Female C57BL/6 and B6.129S7-Rag1tm1Mom/J (Rag1−/−) mice were purchased from The Jackson Laboratory. All animal experiments were performed in accordance with Icahn School of Medicine at Mount Sinai Institutional Animal Care and Use Committee (IACUC) and VU University Medical Center Dierexperimentencommissie (DEC) guidelines as well as Dutch requirements and laws on animal experimentation. Mice were co-housed and allowed to acclimate to the housing facility for at least 1 week. All mice had free access to food and water and were randomly assigned to experimental groups.
Tumor inoculation and treatment regimen
7-week-old female C57BL/6 and Rag1−/− mice were purchased from The Jackson Laboratory. Mice weight was 17 to 21 grams. For tumor experiments, 1×10⁵ tumor cells in 100 μL PBS supplemented with 0.5% fetal bovine serum (FBS) were injected subcutaneously in the flank on day −7. On day 0, mice were randomized and treatment began. For the dose response experiment, treatment consisted of 1, 2, or 3 intravenous injections of either 0.375 mg/kg or 1.5 mg/kg MTP10-HDL on day 0, 2, and 4 and a control group consisting of intravenous PBS treatment. In addition to a PBS treated group in the dose response experiment and bone marrow flow cytometry experiments, another control group consisted of mice that were treated with nonfunctional HDL nanobiologics. In a separate experiment, mice were intraperitoneally injected with 3 doses at 1.5 mg/kg MTP10-HDL. MTP10-HDL treatment for all other experiments consisted of 3 doses of 1.5 mg/kg MTP10-HDL on day 0, 2, and 4. One treatment arm comprised an extended MTP10-HDL treatment regimen with six injections of 1.5 mg/kg MTP10-HDL. For experiments involving checkpoint inhibition therapy, checkpoint inhibitors were injected intraperitoneally twice a week using doses of 200 μg anti-CTLA-4 (clone, 9H10, BioXcell) and/or 200 μg anti-PD-1 (clone, RMP1–14, BioXcell). Treatment started at day 2 and continued until the end of the experiment. Tumors were measured daily by caliper and tumor volume was calculated as (width × width × height) × 0.52. At time of sacrifice for analysis, mice were euthanized using CO2 and underwent subsequent cervical dislocation.
Bone marrow transplantation experiments
For bone marrow transplantation experiments, 7-week-old female C57BL/6 were treated with 3 injections of either PBS or MTP10-HDL, as described above, and bone marrow was harvested after the last injection. In the first experiment, mice received a radiation dose of two times 600 cGy and were subsequently injected with the harvested bone marrow. After 6 weeks, mice received a subcutaneous injection of 1×10⁵ tumor cells in 100 μL PBS supplemented with 0.5% FBS. For the second experiment, non-radiated mice received an injection of the harvested bone marrow and received a subcutaneous injection of 1×10⁵ tumor cells in 100 μL PBS supplemented with 0.5% FBS the following day. Tumor growth was measured daily, in a blinded fashion.
Non-human primate studies
Two adult male cynomolgus monkeys (Macaca fascicularis) were used for the non-human primate studies. The weight of the animals was 6.4 and 9.84 kg, respectively. Monkeys were pair-housed when possible in climate-controlled conditions with 12-hour light/dark cycles. Monkeys were provided water ad libitum and fed Teklad Global 20% Protein Primate Diet.
Cell lines
The B16F10-Fluc-Neo/eGFP-Puro cell line was purchased from Imanis Life Sciences and the B16F10 murine melanoma cell line was kindly provided by Dr. I.J. Fidler (Houston, TX). Both the B16F10-Fluc-Neo/eGFP-Puro cell line and B16F10 cell line are male derived. B16F10 murine melanoma cells were cultured in Dulbecco’s modified Eagle’s medium (DMEM)(Gibco) supplemented with 10% FBS and 1% penicillin/streptomycine (P/S). B16F10-Fluc-Neo/eGFP-Puro murine melanoma cells were cultured in DMEM (Gibco) supplemented with 10% FBS, 0.8 mg/mL G418 (Invivogen), 1 μg/mL puromycin (Invivogen), and 1% P/S. Harvested murine bone marrow cells and isolated monocytes of female mice were cultured in Roswell Park Memorial Institute medium (RPMI)(Gibco) supplemented with 10% FBS, 1% P/S, 20 mM HEPES (Gibco), L-glutamine (Gibco), and MEM Non-essential amino acids (Milipore Sigma).
METHOD DETAILS
Materials
1,2-dimyristoyl-sn-glycero-3-phosphocholine (DMPC) was obtained from Avanti Lipids. apoA1 was purified in house from human HDL obtained from Biosource Technology. All dyes were obtained from Thermo-Scientific. apoA1 was isolated from human HDL concentrates and purified as previously reported (Braza et al., 2018). All other chemicals were obtained from Sigma Aldrich. Vivaspin tubes were obtained from Sartorius Biotech and PD-10 columns were purchased from General Electric (Sephadex G-25 M). A 150 V/T ultrasonic homogenizer working at 70% power output was used for tip sonication. DLS measurements were performed on a Brookhaven Instrument Corporation ZetaPals analyzer. 89Zr oxalate was made at Memorial Sloan Kettering Cancer Center using an EBCO TR19/9 variable beam energy cyclotron using the 89Y(p,n)89Zr reaction and purified using a method from the literature (Holland et al., 2009). SEC radio-HPLC analyses were performed on a Shimadzu system equipped with a Superdex 10/300 SEC column using a flow rate of 1 mL/min and demiwater as the eluent. A Lablogic Scan-RAM radio-TLC/HPLC detector was used. Dialysis experiments were performed using 10 kDa Slide-a-Lyzer dialysis cassettes from Thermo-Scientific.
Formulating the nanobiologics
1,2-dimyristoyl-sn-glycero-3-phosphocholine (DMPC, 5 mg, 7.37 μmol), cholesterol (0.57 mg, 1.47 μmol), and MTP-PE (Mifamurtide) (0.91 mg, 0.74 μmol) were dissolved in chloroform (2 mL) and placed in a 20 mL vial. Chloroform was evaporated under vacuum to form a thin lipid film, to which apoA1 (2 mg) and PBS (5 mL) were added and the mixture sonicated using an ultrasonic bath for 5 minutes, followed by incubation at 37 °C for 20 minutes. The opaque solution was sonicated using a tip sonicator for 30 minutes while cooling in an ice-water bath. The transparent solution was transferred to a 10kDa MWCO Vivaspin tube and centrifuged at 4000 rpm at 4 °C until a volume of ~1 mL remained. PBS (1 mL) was added and the tube was again centrifuged until 1 mL remained; this was repeated twice. The resulting solution was filtered using a 0.22 μm PES syringe filter to obtain the finished MTP10-HDL particles.
For the particles with other DMPC and MTP or cholesterol molar ratios the same method was used with the corresponding amounts of Mifamurtide or cholesterol incorporated in the lipid mix. To include DiLC18(3) and DiOC18(3) dyes in the nanobiologics, 0.5 mg of the desired dye was dissolved in the chloroform solution used to prepare the lipid film. To prepare the DFO-89Zr radiolabeled nanobiologics, 50 μg of DPSE-DFO, made according to a procedure from the literature (Perez-Medina et al., 2014), was incorporated in the lipid film.
Radiolabeling nanobiologics
A solution of 89Zr oxalate in 1M oxalic acid was neutralized using a 1M sodium carbonate solution until a pH between 6.8–7.4 was reached. The 89Zr solution was added to the DSPE-DFO-containing nanobiologics and incubated at 37 °C using a thermomixer (600 rpm) for 30–60 minutes. The resulting solution was purified using a PD-10 column with PBS as eluent. The radiolabeled nanobiologics’ radiochemical purity was typically over 95%, as assessed by SEC radio-HPLC.
Determining particle size by DLS
Particle size was determined using a Zeta PALS analyzer (Brookhaven Instruments Corporation). An aliquot (10 μL) of the purified nanobiologic solution was diluted with PBS (1 mL), filtered using a 0.22 μm PES syringe filter, and analyzed by dynamic light scattering to determine the mean of the number average size distribution.
Determining drug concentration
The MTP-PE or L18-MDP concentration in the nanobiologic solutions was determined using a colorimetric assay to detect N-acetylglucosamine, as reported by Reissig et al. (Reissig et al., 1955). Calibrants containing muramyl dipeptide (0–100 μg/mL) in PBS were made. Both these and the MTP10-HDL or L18-MDP-HDL solution were transferred to Eppendorf tubes (125 μL of each solution), and aqueous potassium tetraborate solution (0.8 M, 25 μL) was added. The tubes were heated at 100 °C for 3 minutes, then allowed to cool to room temperature, and an aliquot of each tube (25 μL) was transferred to a 96-well plate. Subsequently, 150 μL of a solution containing concentrated hydrochloric acid (1.19 mL), acetic acid (10 mL), and 4-(dimethylaminobenzaldehyde) (114.3 mg) was added, at which point the solution turned purple. The well plate was incubated at 37 °C for 20 minutes, after which the samples’ absorption was measured at 544 nm.
Measuring L18-MDP/MTP-PE release kinetics
Release kinetics studies of L18-MDP and MTP-PE from HDL nanobiologics were performed. Nanobiologic solutions were loaded into dialysis bags (10,000 MWCO) and placed inside PBS (4 °C), fetal bovine serum (37 °C), and 10% FBS (37 °C). At predetermined time points (0, 15, 30, 60, 120 and 240 minutes), L18-MDP/MTP-PE concentration was determined using the colorimetric assay described above.
Pharmacokinetics and biodistribution
C57BL/6 mice were injected with 89Zr-MTP10-HDL nanoparticles (6.1 ± 0.2 μCi) in 150–200 μL PBS via tail-vein injection. At predetermined time points (2, 15, and 30 minutes, and 1, 4, 8, and 24 hours) blood samples (5–10 μL) were taken, weighed, and measured for radioactivity content using a Wizard2 2480 automatic gamma counter (Perkin Elmer). Data were converted to %ID/g, plotted in a time-activity curve, and fitted using a non-linear two-phase decay regression in Prism GraphPad (GraphPad Software Inc.). Finally, a weighted blood radioactivity t1/2 was calculated. At 24 hours, animals were euthanized and extensively perfused with PBS. Tissues of interest (liver, kidneys, spleen, lungs, muscle, heart, aorta, bone, and brain) were collected, blotted, and weighed before radioactivity counting on a Wizard2 2480 automatic gamma counter (Perkin Elmer,). Radioactivity values were corrected for decay and normalized to tissue weight to express radioactivity concentration as percentage injected dose per gram (%ID/g).
Non-human primate biodistribution
After an overnight fast, non-human primates were anaesthetized with ketamine (5 mg/kg) and dexmedetomidine (0.0075–0.015 mg/kg), and blood was collected from the femoral vein. The animals were injected with 15.4 and 25.1 MBq 89Zr-MTP10-HDL at a dose of 0.0549 mg/kg. Dynamic PET imaging was performed during the first 60 min after infusion. Additional PET/MRI scans were performed at 1 and 48 hours after injection. PET and MRI images were acquired on a combined 3T PET/MRI system (Biograph mMR, Siemens Healthineers). On day 1, dynamic PET imaging was performed for 60 minutes using one bed position covering the chest and abdomen, directly after injection with 89Zr-MTP10-HDL. MR imaging parameters were as follows: acquisition plane, coronal; repetition time, 1,000 ms; echo time, 79 ms; number of slices, 144; number of averages, 4; spatial resolution of 0.5 × 0.5 × 1.0 mm3 and acquisition duration, 42 min and 42 s. After dynamic PET image acquisition, static whole-body PET images were acquired from the cranium to the pelvis, using 4 consecutive bed positions of 15 min each. Simultaneously with each bed, MR images were acquired as described above, except using only 1.4 signal averages, number of slices 160, and spatial resolution 0.6 × 0.6 × 1.0 mm3 (acquisition duration, 14 min 56 s per bed). Whole-body PET and MR imaging was also performed at 48 hours after injection, using 4 PET bed positions of 30 minutes each, with MR parameters as follows: acquisition plane, coronal; repetition time, 1,000 ms; echo time, 79 ms; number of slices, 224; number of averages, 2; spatial resolution of 0.6 × 0.6 × 1.0 mm3; acquisition duration, 29 min and 56 s. Whole-body MR images from each bed were automatically collated together by the scanner. After acquisition, PET raw data from each bed were reconstructed and collated together offline using the Siemens proprietary e7tools with an Ordered Subset Expectation Maximization (OSEM) algorithm with Point Spread Function (PSF) correction for 3 iterations and 24 subsets. Also, Gaussian filter of 4 mm was applied to the images. A three-compartment (soft tissue, lung and air) attenuation map was used for attenuation.
Toxicology
Non-tumor-bearing C57BL/6 mice were sacrificed 6 and 24 hours after injection with MTP10-HDL or PBS. Blood was collected by cardiac puncture and centrifuged at 2000 g for 10 minutes. Serum was collected and TNF-α levels were measured by ELISA. Spleen and livers were harvested and frozen directly in Tissue-Tek OCT (Sakura), and stored at −80 °C in preparation for staining. Sections of 8mm were cut using a Leica 1900CM cryomicrotome. Liver and spleens were stained with H&E. Images were taken on a Zeiss AxioImager Z2M.
In non-human primates, blood was collected before and at 1.5 and 48 hours after 89Zr-MTP10-HDL infusion. The collected blood was centrifuged at 2000 g for 10 minutes. Serum was analyzed with a Beckman AU680 chemistry analyzer.
Autoradiography
Tissues were placed in a film cassette against a phosphorimaging plate (BASMS-2325, Fujifilm) at −20 °C to determine the radioactivity distribution. The plates were read at a pixel resolution of 25 μm with a Typhoon 7000IP plate reader (GE Healthcare).
Near infrared fluorescence imaging
Mice received a single intravenous injection with DiI-MTP10-HDL. 24 hours later, mice were sacrificed and tissues were collected for NIRF imaging. Fluorescent images were acquired using an IVIS 200 system (Xenogen), with an 11 second exposure time, using a 535 nm excitation filter and a 580 nm emission filter.
CryoTEM
Vitrified thin films for CryoTEM analysis containing MTP10-HDL nanoparticles were prepared using an automated vitrification robot (FEI Vitrobot Mark III) by plunge vitrification in liquid ethane. Before vitrification, a 200-mesh copper grid covered with a Quantifoil R 2/2 holey carbon film (Quantifoil Micro Tools GmbH) was surface plasma treated for 40 seconds using a Cressington 208 carbon coater. CryoTEM imaging was performed with the Technische Universiteit Eindhoven/FEI cryoTITAN equipped with a field emission gun (FEG), a post-column Gatan energy filter (GIF) and a post-GIF 2k × 2k Gatan charge-coupled-device camera. The microscope was operated at 300 kV acceleration voltage in zero-loss energy filtering mode at a nominal magnification of 24.000 × and at a dose rate of 4.5 electrons/A2·s with a 1s image acquisition time. Representative CryoTEM micrographs show the presence of disc shaped nanoparticles in random orientations which show the highest contrast when viewed edge on resembling a line.
Human monocyte trained immunity assay
All human primary cells were isolated from healthy male and female volunteers who gave written informed consent (Sanquin Blood Bank). PBMCs were isolated by density centrifugation on Ficoll-Paque (GE Healthcare), washed three times in PBS, and resuspended in culture medium (RPMI) (Gibco) supplemented with 5 μg/mL gentamicin (Centraform), 2mM L-glutamin (Gibco), and 1mM pyruvate (Gibco). Percoll monocytes were isolated by layering hyper-osmotic Percoll solution (48,5% Percoll (Sigma-Aldrich)), 41,5% sterile H2O, 0.16M filter sterilized NaCl) on PBMCs. After 15 minutes of centrifugation at 580 × g, the interphase layer was isolated, and then cells were washed with PBS and resuspended in culture medium. To increase the purity of Percoll-isolated monocytes, the monocytes were adhered to polystyrene flat bottom plates (Corning) for 1h at 37°C followed by washing with warm PBS. Next, cells were pre-incubated with culture medium supplemented with 10% human pooled serum together with the nanobiologics for 1 hour. Subsequently, culture medium supplemented with 10% human pooled serum added as a control or combined with either 2 μg/mL β-glucan, 10 μg/mL Bacillus Calmette-Guérin (BCG), or 5 μg/mL muramyl dipeptide (MDP). After 24h, cells were washed with warm PBS and culture medium was added. After 3 days, culture medium was refreshed. On day 6, cells were restimulated with RPMI (Gibco) or LPS (10 ng/mL)(Sigma Aldrich). After 24 hours, supernatants were collected and stored at −20°C until further use.
Murine monocyte trained immunity assay
Bone marrow was flushed with PBS from the femurs of C57BL/6 mice, filtered through a 70 μm cell strainer (BD Falcon), incubated with Red Blood Cell (RBC) Lysis buffer (BioLegend) for 30 seconds, and washed with PBS containing 0.5% FBS. Cells were resuspended in complex RPMI (Gibco) medium supplemented with 50 mL FBS and 5 mL Pen-Strep, 5 mL L-Glutamine solution (Gibco), 5 mL MEM Non-essential amino acids (Gibco), and 5 mL HEPES buffer (Gibco) substituted with recombinant GM-CSF (20 ng/mL) and IL-4 (20 ng/mL) (both Peprotech), counted, and plated in a 96 well flat bottom plate (50.000 cells/well). Cells were cultured for 3 days, after which medium was refreshed and cells were cultured another 3 days. Cells were stimulated with β-glucan (Sigma Aldrich), free MDP, empty HDL, or nanobiologic (0.0001, 0.001, 0.01, 0.1, 1, 10, 100 μM) for 24 hours. Subsequently, cells were washed with 200 uL PBS and fresh medium was added. After 48 hours, cells were restimulated with LPS (10 ng/mL)(Sigma Aldrich) for 24h. Supernatant was collected after 24 hours and stored at −80 °C until further use.
In vitro bone marrow re-stimulation
Non tumor bearing C57BL/6 mice were sacrificed 1, 3, or 7 days after treatment. In sterile conditions, femur and tibia were removed and bone marrow was flushed out. Bone marrow cells were incubated with RBC Lysis buffer (BioLegend) for 4 minutes, washed with PBS containing 0.5% FBS, and subsequently resuspended in complex RPMI (Gibco). Total cell numbers were determined and diluted to 7.5 × 10⁵ cells per mL. Cells were seeded at 1.5 × 10⁶ cells per well and left to adhere for 1 hour at 37 °C. LPS (Sigma Aldrich) was added to a concentration of 10 ng/mL. Supernatant was collected after 24 hours and stored at −80 °C until further use.
Chromatin immunoprecipitation
Human monocytes were isolated by using Percoll solution as described above, and 10×106 cells were seeded into 10 cm Petri dishes (Corning). Cells were trained as described above. On day 6, cells were harvested and cross-linked in methanol free 1% formaldehyde, followed by sonication and immunoprecipitation using 1ug of antibody against H3K4me3 (Diagenode). Immunoprecipitated chromatin was processed further for qRT-PCR analysis using MiniElute DNA purification kit (Qiagen). The primes used are listed below. Samples were measured on StepOne PLUS qPCR machine (Applied Biosystems) using SYBR green (Invitrogen) in accordance with the manufacturer’s instruction. The following primers were used: IL-1β-1 FW: AATCCCAGAGCAGCCTGTTG; RV: AACAGCGAGGGAGAAACTGG; IL-1β-2 FW: CATGGCTGCTTCAGACACCT; RV: ACACATGAACGTAGCCGTCA; Myoglobulin FW: AGCATGGTGCCACTGTGCT; RV: GGCTTAATCTCTGCCTCATGAT; GAPDH FW: CCCCGGTTTCTATAAATTGAGC; RV: AAGAAGATGCGGCTGACTGT; TNF-1 FW: CAGGCAGGTTCTCTTCCTCT; RV: GCTTTCAGTGCTCATGGTGT; TNF-2 FW: GTGCTTGTTCCTCAGCCTCT; RV: ATCACTCCAAAGTGCAGCAG; IL-6–1 FW: AGGGAGAGCCAGAACACAGA; RV: GAGTTTCCTCTGACTCCATCG; IL-6–2 FW: TCGTGCATGACTTCAGCTTT; RV: GCGCTAAGAAGCAGAACCAC;
Cytokine measurements
Cytokine production was determined in supernatants using commercial ELISA (ThermoFisher Scientific and R&D Systems, MN, USA) ELISA kits for human or mouse TNF-α and IL-6, following the manufacturer’s instructions. Sample absorbance was measured at 450 nm with a GloMax-Multi+ plate reader (Promega). Analyses were performed according to the manufacturer’s protocols. Luminex assay was performed according to the manufacturer’s instructions (ProcartaPlex ThermoFisher) on the Luminex Magpix Instrument.
Labeling nanobodies with 89Zr
CD11b single-domain antibody fragments were generously gifted to us by Rashidian and Ploegh (Rashidian et al., 2017). Nanobodies were radiolabeled similarly to the nanobiologics. A solution of 89Zr oxalate in 1M oxalic acid was neutralized using a 1M sodium carbonate solution until a pH between 6.8–7.4 was reached. The 89Zr solution was added to the nanobodies in PBS and incubated at 25 °C using a thermomixer (600 rpm) for 30 minutes. The obtained solution was purified using a PD-10 column with PBS as eluent. The radiolabeled nanobodies’ radiochemical purity was assessed using radio-TLC with an aqueous EDTA solution (50 mM) as eluent, in which the nanobodies stayed at the baseline. A radiochemical purity of well above 95% was typically obtained.
PET/CT experiments
For 18FDG /PET, tumor-free C57BL/6 mice were fasted for 8 hours before injection. 18F-FDG (9.3 ± 1.1 MBq, n=5, in 100 μL PBS solution) was administered via tail vein and allowed to circulate for 30 minutes before PET/CT imaging. For biodistribution studies, C57BL/6 mice bearing B16F10 tumors were injected with 89Zr-MTP10-HDL nanoparticles (6.1 ± 0.2 MBq, n=5, in 100 μL PBS solution) via tail vein. 89Zr-MTP10-HDL was allowed to circulate for 24 hours, after which mice were imaged by PET/CT. For 89Zr-labeled CD11b (Nb) imaging, 3 groups of 5 C57BL/6 mice bearing B16F10-Luc-GFP tumors were treated with either PBS, MTP10-HDL, or MTP10-HDL combined with anti-CTLA-4/anti-PD-1 (both BioXcell). At day 12, mice were intravenously injected with either 89Zr- CD11b-Nb (2.2 ± 0.2 MBq, n=5 per group, in 100 μL PBS solution), which were allowed to circulate for 24 hours.
Before the scan, animals were anesthetized with isoflurane (Baxter Healthcare)/oxygen gas mixture (2% for induction, 1 % for maintenance) and subsequently imaged on a Mediso nanoScan PET/CT scanner (Mediso). PET/CT acquisition time was 30 minutes for 18F-FDG and 89Zr-MTP10-HDL experiments and 20 minutes for nanobody experiments. A whole-body CT scan was performed (energy 50 kVp, current 180 μAs, isotropic voxel size at 0.25 mm3) followed by a PET scan. The coincidences were filtered with an energy window between 400 – 600 keV. The voxel size was isotropic, 0.6 mm3 in width, and the reconstruction was applied for two full iterations, 6 subsets per iteration. PET data were reconstructed using CT-based attenuation correction. Reconstruction was performed using the TeraTomo 3D reconstruction algorithm from the Mediso Nucline software. Immediately after the PET/CT scan, animals were euthanized and perfused with PBS. Tissues of interest (spleen, blood, tumor, lymph nodes, and femurs) were collected, blotted, and weighed before radioactivity counting on a Wizard2 2480 automatic gamma counter (Perkin Elmer). Radioactivity values were corrected for decay and normalized to tissue weight to express radioactivity concentration as percentage injected dose per gram (%ID/g).
Preparing single cell suspensions
Blood was collected by cardiac puncture and mice were subsequently perfused with 20 mL cold PBS. Spleen, tumor, iliac lymph nodes, and femurs were harvested. Blood was incubated with red RBC Lysis buffer (BioLegend) for 4 minutes and washed with PBS containing 0.5% FBS. Spleens were mashed, filtered through a 70 μm cell strainer (BD Falcon), incubated with RBC Lysis buffer (BioLegend) for 4 minutes, and washed with PBS containing 0.5% FBS. Bone marrow was flushed out of the femur with PBS, filtered through a 70 μm cell strainer (BD Falcon), incubated with RBC Lysis buffer (BioLegend) for 30 seconds, and washed with PBS containing 0.5% FBS. Lymph node and tumor were pushed through a 70 μm cell strainer (BD Falcon) and washed with PBS containing 0.5% FBS.
Depleting the lineage-committed cells
Bone marrow cells were incubated with biotin-conjugated antibodies (all BD Bioscience): anti-Ter-119, anti-CD11b (clone M1/70), anti-CD5 (clone 53–7.3), anti-CD4 (clone RM4–5), anti-CD8a (clone 53–6.7), anti-CD45R (clone RA3–6B2), and anti-Ly6G/C (clone RB6–8C5). Antibodies were added at a concentration of 1:100 for 30 minutes at 4 °C. Cells were subsequently washed with PBS containing 0.5% BSA and incubated with MACS streptavidin-conjugated microbeads (Miltenyi) for 30 minutes at 4 °C. Depleting the lineage-committed cells was performed by magnetic bead separation using LS columns and MACS® Separator (both Miltenyi).
Cellular specificity flow cytometry
For cellular specificity, mice were injected with DiO-MTP10-HDL that was allowed to circulate for 24 hours. Subsequently, mice were sacrificed and single cell suspensions were created from blood, spleen, bone marrow, or tumor cells as previously described. Cell suspensions were incubated with several antibody cocktail variants. Blood and spleen suspensions were incubated with anti-CD115 (clone AFS98), anti-Ly6C (clone Al-21), anti-Ly6G (clone 1A8), anti-CD11b (clone M1/70), anti-CD19 (clone 1D3), and anti-CD90.2 (clone 53–2.1). For bone marrow anti-CD48 (clone HM48–1), anti-CD150 (clone TC15–12F12.2), anti-CD135 (clone A2F10), anti-CD117 (c-Kit) (clone 2B8), anti-Sca-1 (Ly6-A/E) (clone E13–161.7), anti-CD16/32 (clone 93), anti-CD34 (clone RAM34), and a lineage cocktail (Lin) containing anti-CD90.2 (clone 53–2.1), anti-Ter119 (clone TER119), anti-NK1.1 (clone PK136), anti-CD49b (clone DX5), anti-CD45R (clone RA3–6B2) and anti-Ly6G (clone 1A8) was added. For the tumor tissues, cells were incubated with anti-CD3e (clone 145–2C11), anti-CD45 (clone 30-F11), anti-CD11b (clone M1/70), anti-F4/80 (clone BM8), and anti-CD31 (clone MEC13.3). Cells were subsequently washed and resuspended in FACS-buffer. All data were acquired on an LSRFortessa flow cytometer (BD Biosciences). DiO-MTP10-HDL was detected in the FITC channel.
Progenitor and BrdU flow cytometry
For progenitor flow cytometry, bone marrow cells were incubated with the following antibodies: anti-CD117 (c-Kit) (clone 2B8), anti-Sca-1 (Ly6-A/E) (clone E13–161.7), anti-CD48 (clone HM48–1), anti-CD150 (clone TC15–12F12.2), anti-CD135 (clone A2F10), anti-CD16/32 (clone 93), anti-CD34 (clone RAM34), and a lineage cocktail as described above. For BrdU labeling, C57BL/6 mice were intraperitoneally injected with 1 mg of BrdU (10mg/mL in PBS) at day 3 (48h before sacrifice). Bone marrow was subsequently harvested and depleted of lineage-committed cells. The remaining cells were incubated with Streptavidin-APC-Cy7, anti-c-Kit (clone 2B8,), anti-Sca-1 (clone D7), anti-CD150 (clone mShad150), and anti-CD48 (clone HM48–1). All antibodies were added at a concentration of 1:100 and incubated for 30 minutes at 4 °C. Cells were subsequently washed and resuspended in FACS buffer. For BrdU flow cytometry, BrdU staining was performed using the BrdU staining kit, following manufacturer’s instructions. All data were acquired on an LSRFortessa flow cytometer (BD Biosciences).
Tumor flow cytometry
For flow cytometry tumors were excised and weighed. Tumors were digested for 60 minutes at 37 °C using liberase digestion buffer consisting of DNaseI (40 U/mL)(Sigma-Aldrich), Hyaluronidase (60 U/ml)(Sigma-Aldrich), Liberase TH (4 U/mL)(Roche) in PBS. After straining through a 70 μm cell strainer (BD Falcon) cells were washed and resuspended in 40% Percoll (Sigma-Aldrich). An 80% Percoll (Sigma-Aldrich) solution was pipetted beneath and the suspension was centrifuged for 23 minutes at 325g at room temperature. Interface was collected and washed. Subsequently cells were stained with the following monoclonal antibodies: anti-CD45 (clone 30-F11), anti-CD11b (clone M1/70), anti-Ly6C (clone AL-21), anti-Ly6G (clone 1A8), anti-F4/80 (clone BM8), anti-CD3 (clone 145–2C11). All antibodies were added at a concentration of 1:100 for 30 minutes at 4 °C. Cells were subsequently washed and resuspended in FACS buffer. 10 μL DAPI was added for viability staining. All data were acquired on an LSRFortessa flow cytometer (BD Biosciences).
Aurora
Single cell suspensions of all 5 tissues noted above were stained with the following monoclonal antibodies: anti-CD117 (c-Kit)(clone 2B8), anti-Sca-1 (Ly6-A/E)(clone E13–161.7), anti-CD48 (clone HM48–1), anti-CD150 (clone TC15–12F12.2), anti-CD135 (clone A2F10), anti-CD45 (clone 30-F11), anti-CD3 (clone 17A2), anti-CD4 (clone GK1.5), anti-CD8a (clone 53–6.7), anti-CD69 (clone H1.2F3), anti-CD25 (clone 3C7), anti-CD62L (clone MEL-14), anti-CD44 (clone IM7), anti-CD45R (clone RA3–6B2), anti-CD161 (clone 2D9), anti-CD11b (clone M1/70), anti-Ly-6C (clone HK1.4), anti-Ly-6G (clone 1A8), anti-CD11c (clone N418), anti-F4/80 (clone BM8), anti-PD-1 (clone 29F.1A12), anti-CD64 (clone AT152–9), anti-CD24 (clone M1/69), anti-MHC II (clone M5/114.15.2), and anti-Mannose Receptor (clone C068C2). All antibodies were added at a concentration of 1:100 for 30 minutes at 4 °C. Cells were subsequently washed and resuspended in FACS buffer. ZombieNIR (0.005mg) (BioLegend) was added for viability staining to 10 × 106 cells. Data were acquired on a Cytek Aurora (CytekBio).
Sorting
For HSC sorting, the lineage-committed cells were depleted as described above and the remaining cells were incubated with Streptavidin-APC-Cy7, anti-c-Kit (clone 2B8), anti-Sca-1 (clone D7), anti-CD150 (clone mShad150), and anti-CD48 (clone HM48–1) (all 1:100), all of which were added and incubated at 4 °C for 30 minutes. ZombieNIR (0.005mg) (BioLegend) was added for viability staining to 10 × 106 cells right before sorting on a BD FACSAria Sorter. For RNA sequencing HSCs and MPPs were collected in LoBind tubes containing 1 mL sterile PBS with 0.5% BSA (cell culture grade). Cells were subsequently spun down at 800g at 4 °C for 20 minutes and resuspended in 100 μL TRI reagent (Zymo Research). Samples were vortexed briefly every 3 minutes for a total of 15 min and stored in −80 °C until RNA isolation. For ATAC-seq HSCs and MPPs were collected in 15 mL Falcon tubes containing complete RPMI medium and were used immediately for library creation.
RNA sequencing
Total RNA was isolated from HSCs and MPPs using a Direct-zol RNA Kit (Zymo Research) with DNase treatment. For HSCs RNA amplification and cDNA generation were performed using Ovation RNA-Seq System V2 (NuGEN). Libraries were constructed using Ovation Ultralow V2 DNA-Seq Library Preparation Kit following the manufacturer’s instructions (NuGEN). Samples were pooled and diluted to 10 nM and sequenced on an Illumina HiSeq 4000 instrument (Illumina) to a depth of ± 20 million single-ended 50 bp reads. For MPPs RNA with RIN greater than 7 underwent polyA selection. Insect carrier RNA Was added to allow low-input RNA library prep. Furthermore, samples were reverse transcribed to cDNA. cDNA libraries were prepared using 50–100ng of total RNA using the Nextflex Rapid Direction RNA-Seq kit (Perkin-Elmer). cDNA libraries were sequenced on the Illumina Nextseq 500 platform to obtain 75-bp single-end reads.
ATAC sequencing
Omni-ATAC was performed as previously described (Corces et al., 2017) with optimization suited for both MPP cells (50,000 per sample) and HSCs (10,000 per sample). Cell pellets were resuspended in 50 μl of ATAC-seq RSB containing 0.1% NP40, 0.1% Tween-20, and 0.01% digitonin and allowed to lyse for 3 minutes on ice. After lysis, 1 ml of ATAC-seq RSB containing 0.1% Tween-20 (without NP40 or digitonin) was added, and the tubes were inverted to mix. Nuclei were centrifuged for 10 minutes at 500 rcf at 4 °C. Nuclei were resuspended in 50 μl of transposition mix [25 μl 2× TD buffer, transposase (1.75 uL for MPP – 1 uL for HSC), 16.5 μl PBS, 0.5 μl 1% digitonin, 0.5 μl 10% Tween-20, and water (5.75 uL for MPP – 6.5 uL for HSC)] by pipetting up and down six times. Transposition reactions were incubated at 37 °C for 30 minutes in a thermomixer with shaking at 1,000 rpm. Reactions were cleaned with a Qiagen MinElute Reaction Cleanup kit. The following ATAC-seq library preparation was performed as previously described (Buenrostro et al., 2015). Multiplexed libraries were sequenced at 4 nM on an Illumina NextSeq 500 (PE 75bp reads).
Intravital multiphoton microscopy
Intravital multiphoton microscopy (IVM) of B16F10 tumor-bearing mice was performed with methods similar to those in previous studies (Patsialou et al., 2013) using an Olympus FV1000-MPE microscope with a 25X, 1.05NA water immersion objective with correction collar. Excitation at 880 nm was performed using a standard femtosecond-pulsed laser system (Mai Tai HP with DeepSee, Newport/Spectra-Physics). Red and green fluorescence and second-harmonic signals were collected simultaneously with three separate photomultiplier-tube (PMT) detectors.
To qualitatively appreciate MTP10-HDL particle biodistribution and uptake by immune cells homing to the tumor, mice (n=3) were injected with DiI- MTP10-HDL particles labeled with red dye 8 hours prior to imaging. Right before imaging, 70 kDa FITC dextran was injected to visualize vessels. For all 3 mice, B16F10 melanoma, spleen, and bone marrow were scanned in vivo and several representative images were captured. Tumor was imaged at different depths to better represent the distribution. Additionally, as control, mice (n=3) bearing B16F10 tumor were injected with 70 kDa Texas Red dextran, known to stain tissue macrophages.
QUANTIFICATION AND STATISTICAL ANALYSIS
Flow Cytometry
Aurora high dimensional cytometry data were visualized using viSNE and implemented using Cytobank (Amir el et al., 2013; Chen and Kotecha, 2014). viSNE plots were generated separately for each tissue, incorporating all samples in concatenated files for each tissue. Single cell data were clustered within and across samples. FlowSOM clustering analyses were performed using the respective tools on Cytobank (Van Gassen et al., 2015). viSNE and FlowSOM analyses were performed using all markers except CD45 and Live/Dead discrimination. To generate heatmap displays, marker expression was normalized by dividing by the minimum cluster median value for each parameter. Clusters with less than 0.5% of total number of events were not displayed in the heatmaps to increase figure clarity. This cut-off was chosen to protect against population misidentification. Notably, none of these low-frequency populations were significantly modulated by checkpoint blockade treatment, and other populations’ frequencies were not altered to reflect their omission from display.
ATAC sequencing analysis
First, NextSeq adapter sequences were trimmed from the FASTQ files with NGmerge 0.1 (Gaspar, 2018). Reads were mapped to the mouse genome mm10 with bowtie2 2.2.8 (Langmead and Salzberg, 2012) using the -X 2000 setting. BAM files were subsequently filtered for MAPQ > 30 with SAMTools 1.9 (Li et al., 2009) and duplicate reads were removed with picard 2.2.4. Reads mapping to the mitochondrial genome were removed from downstream analyses. Consensus peaks for HSC and MPP samples were called separately with MACS 2.1 (Zhang et al., 2008) using the following parameters: --nomodel --nolambda --keep-dup all --slocal 10000. The top 50% peaks sorted by the −log10(p-value) reported by MACS were selected for downstream analyses. Selected peaks were annotated with ChIPseeker 1.20 (Yu et al., 2015) using the TxDb.Mmusculus.UCSC.mm10.knownGene annotation in an R 3.6.1 environment. Differential peak accessibility between PBS and MTP10-HDL-treated samples was assessed with DiffBind 2.12 by comparing the number of reads mapped within ±500bp of each peak summit using DESeq2 (Love et al., 2014). PCA plots were generated using sklearn 0.21.3 in a Python 3.7.4 environment from a matrix containing log10(RPKM+1) and Z-score normalized values of the top 75,000 peaks ranked by the differential expression p-value reported by DiffBind. Enrichment analysis was performed using g:Profiler (Raudvere et al., 2019) by submitting ENSEMBL IDs of genes annotated to differentially accessible peaks with p-value < 0.05. Results from the Gene Ontology Biological Processes and Reactome libraries were reported.
RNA sequencing analysis
Reads were aligned to the mouse genome mm10 by STAR 2.7.2a with default settings (Dobin et al., 2013). Differential expression between PBS and MTP10-HDL-treated samples was assessed using the DESeq2 1.24 bioconductor package in an R 3.6.1 environment. PCA plots were generated using sklearn 0.21.3 in a Python 3.7.4 environment from a matrix containing expression levels of the top 10,000 genes ranked by the differential expression p-value reported by DESeq2. Heatmaps were generated from a matrix containing expression levels of the top 2,500 genes ranked by differential expression p-value. For both PCA plots and heatmaps, gene expression counts were normalized using the variance Stabilizing Transformation function from DESeq2 followed by Z-score transformation. Enrichment analysis was performed using g:Profiler by submitting ENSEMBL IDs of differentially expressed genes with p-value < 0.05. Results from the Gene Ontology Biological Processes library were reported.
Statistical analysis
All data are presented as mean ± standard deviation (SD) except for tumor growth experiments where mean ± standard error of the mean (SEM) is presented. Number (n) and type (biological or technical) of replicates are indicated in the figure legends. Tumor growth curves were analyzed by growth rate analysis as described by Hathers et al. (Hather et al., 2014). Data were tested using a two-tailed Student’s t test (when comparing two groups) or one-way ANOVA followed by Bonferroni’s post hoc comparison (to test multiple groups) in GraphPad Prism version 7.0 software, as indicated in the figure legends. p values < 0.05 were considered significant, with levels of significance as follows: *p < 0.05; **p < 0.01; ***p < 0.001; ****p < 0.001; ns, not significant.
Supplementary Material
Figure S1. Library screening. Related to Figure 1.
In vitro screening of a library consisting of nanobiologics with varying surface densities of MDP or MTP, ranging from 0.5% to 10%.
(A) Stability assays performed with DLS show the size of all nanobiologic formulations in our library remain stable for at least 10 days.
(B, C) In vitro trained immunity assays performed on (B) murine and (C) human monocytes. Cells were treated in vitro with medium (RPMI), β-glucan, MDP, bare HDL or different nanobiologics at the displayed concentration (1, 10 or 100 μM), and restimulated with LPS after 6 days. IL-6 and TNF-α concentrations were measured in culture medium by ELISA after 24 hours.
Figure S2 – Pharmacokinetics library screening. Related to Figure 1.
(A-B) In vivo screening of a library consisting of nanobiologics with varying surface densities of MDP or MTP, ranging from 1% to 10%.
(A) Blood half-lives of different nanobiologics labeled with 89Zr were derived from the blood decay curves.
(B) Ex vivo gamma counting of tissues excised from mice in which 89Zr-nanobiologics were allowed to circulate for 24 hours.
(C) Drug release assays for the assessment of nanobiologic stability at three different conditions (PBS at 4 °C and 37 °C, and PBS + 10% serum at 37 °C). Three different amounts of cholesterol (5%, 10% or 20%) were incorporated in formulations exposing either 10% MDP or 10% MTP on their surface. Results show that MTP particles with 20% cholesterol incorporated were most stable in all conditions.
(D) CryoTEM images of MTP10-HDL.
Figure S3. In vivo characteristics of MTP10-HDL. Related to Figure 2.
(A) Intravital microscopy of spleens from live animals 8 hours post administration of DiI-MTP10-HDL. FITC-dextran was injected intravenously to display the vasculature.
(B) Flow cytometry gating strategy 24 hours post administration of DiO-MTP10-HDL to identify CMP and GMP cell populations in the bone marrow. Representative histograms show the amount of DiO-MTP10-HDL positive cells. (n=5 per group)
(C) Flow cytometry gating strategy for bone marrow, spleen, and blood 24 hours post administration of either PBS (grey) or DiO-MTP10-HDL (red). Identification of lymphocytes (I), neutrophils (II), and Ly6Chi monocytes (III) with representative histograms showing little uptake of DiO- MTP10-HDL in lymphocytes (I), low to moderate uptake in neutrophils (II) and high uptake in Ly6Chi monocytes (III). (n=5 per group)
For all panels, data are presented as mean ± SD.
Figure S4. Tumor growth control. Related to Figure 3.
(A) Serum TNF-α concentrations as determined by ELISA in mouse serum 6 and 24 hours after treatment with PBS or MTP10-HDL. An increase in TNF-α after 6 hours van be observed that normalizes after 24 hours. (n=5 per group)
(B) Blood biochemistry on serum of C57BL/6 mice treated with PBS or MTP10-HDL shows no increase of ALT, AST or BUN after treatment with MTP10-HDL. (n=5 per group)
(C) H&E stained histology of spleen and liver of C57BL/6 treated with PBS or MTP10-HDL at 6 and 24 hours after last administration shows no changes in morphology.
(D) Body weight of mice from the dose response experiment as shown in Figure 3A. Mice were injected with MTP-HDLhigh or MTP-HDLlow at 1, 2 or 3 doses. No decrease in bodyweight was observed in any of the treatment groups indicating no severe toxicity. (n=8–10 per group)
(E) Tumor growth curve of C57BL/6 mice inoculated with 1 × 10⁵ B16F10 cells and treated with either PBS, free MDP, bare HDL, or MTP10-HDL. There is no statistical significance in tumor growth rate. Tumor size at day 9 is significant for MTP10-HDL (green). (n=8–10 per group)
(F) Blood activity levels in mice that were intraperitoneally injected with 89Zr-MTP10-HDL. (n=5)
(G) Gamma counting of tissues from C57BL/6 mice injected intraperitoneally with 89Zr-MTP10-HDL. Nanobiologics were allowed to circulate for 24 hours. In contrast to intravenous administration, an unfavorable bone marrow uptake as compared to liver uptake was observed. (n=5)
(H) Tumor growth curve comparing intraperitoneal MTP10-HDL treatment with PBS treatment. No significant difference in tumor growth was found. (n=10 per group)
(I) Tumor growth curves of bone marrow transplantation study with non-irradiated recipient mice. Bone marrow donating mice were treated with PBS or MTP10-HDL. Recipient mice subsequently received a subcutaneous injection of 1×10⁵ B16F10 cells. Mice that received bone marrow from mice treated with MTP10-HDL had a significantly smaller tumor at day 9. Significance was calculated for tumor growth rate (black) and tumor size (green). (n=9–10 per group).
(J) Principle component analysis of RNA sequencing data displays clustering of different treatment groups in both HSCs and MPPs
(K) Heatmaps displaying expression data of HSCs (top) and MPPs (bottom) of mice treated with either PBS or MTP10-HDL. HSCs (n= 6–7 per group) MPPs n=2–3 per group)
(L) Significantly upregulated (red) or downregulated (blue) pathways of genes in HSCs with differentially expressed genes (p-value < 0.01 and −1 > Log2FC > 1;).
(M) Significantly upregulated (red) or downregulated (blue) pathways of genes in MPPs (p-value < 0.01 and −1 > Log2FC > 1;).
For all panels, data are presented as mean ± SD and mean ± SEM for tumor growth experiments. *p < 0.05, **p < 0.01, ***p < 0.001, ****p < 0.0001, ns= not significant.
Figure S5. Gating strategy of bone marrow progenitors. Related to Figure 4.
(A-E) Flow cytometry of bone marrow from C57BL/6 mice treated with bare HDL or PBS. Bone marrow was harvested at day 5.
A) Representative flow cytometry plots identifying MPP4s (Flt3+CD150−CD48+) and MPP3s (Flt3−CD150−CD48+) in bone marrow from mice treated with PBS (top) or MTP10-HDL (bottom).
(B) Representative flow cytometry plots for the myeloid progenitors (MyP) identifying CMPs (CD16/32−CD34−) and GMPs (CD16/32+CD34−+) in bone marrow from mice treated with PBS (top) or MTP10-HDL (bottom).
(C) BrdU proliferation assay. Mice received a BrdU injection 48 hours before euthanization. No significant difference in BrdU-positive hematopoietic stem cells (HSCs) and multipotent progenitors (MPPs) was found. (n=4 per group)
(D-E) Frequency of HSCs, MPPs, Lineage− Sca1+ c-kit− (LSK), Ly6Chi monocytes and neutrophils. No significant change was found between groups. (n=6 per group)
(F) Flow cytometry analysis for tumors 24 hours after MTP10-HDL administration displayed as monocytes and neutrophils per mg tumor and as percentage of CD11b+ cells. Immune cells were isolated using Percoll gradient. (n=7–10)
For all panels, data are presented as mean ± SD. *p < 0.05, **p < 0.01, ***p < 0.001, ****p < 0.0001, ns= not significant.
Figure S6. Flow cytometry analyses of blood and spleen. Related to Figure 6.
Tumor-bearing C57BL/6 mice were treated with PBS, MTP10-HDL, anti-CTLA-4 + anti-PD-1, or MTP10-HDL combined with anti-CTLA-4 + anti-PD-1. Leukocyte populations in blood and spleen were analyzed at day 5. (n=10 per group)
(A/D) Top panels show viSNE-plots from all concatenated blood and spleen samples. Metaclusters containing less than 0.5% of events were excluded. The results displayed are from the (A) blood or (D) spleen.
(B/E) Heatmap shows the relative expression of different immune cell markers in each metacluster. Results were normalized by the minimum of the row. Important clusters in (B) and (E) include MC1: Neutrophils, MC9: Monocytes, MC13: CD4+ T cells, MC14: CD8+ T cells.
(C/F) Quantification of cells within each metacluster as a percentage of total CD45+ cells.
Data are presented as mean ± SD. P values were calculated using a Mann–Whitney U tests (two-sided). *p < 0.05, **p < 0.01, ***p < 0.001, ****p < 0.0001, ns= not significant.
We have developed a trained immunity-inducing nanobiologic therapeutic named MTP-HDL
MTP-HDL favorably accumulates in hematopoietic organs of mice and non-human primates
MTP-HDL nanotherapy induces trained immunity through bone marrow progenitors in vivo
MTP-HDL nanotherapy inhibits tumor growth and potentiates immune checkpoint inhibition
A bone marrow targeted nanobiologic platform that is designed to elicit trained immunity responses has the ability to reduce tumor growth and augment immune checkpoint blockade.
ACKNOWLEDGEMENTS
The authors thank the Icahn School of Medicine and the Amsterdam University Medical Centre. They would also like to extend their gratitude to the following Mount Sinai core facilities: flow cytometry core, microscopy core, CCMS, and TMII’s preclinical imaging core as well as the animal facility at the Free University Amsterdam. We thank Kaley Joyes for editing the manuscript.
This work was supported by National Institutes of Health (NIH) grants R01 CA220234, R01 HL144072, P01 HL131478, and NWO/ZonMW Vici 91818622 (all to W.J.M.M.); NIH grants R01 HL143814 and P01HL131478 (Z.A.F.); R01 AI139623 (J.O.). B.P. was supported by the AMC PhD Scholarship. A.W.G. was supported by a grant from the Dutch Cancer Society (AngioSWITCH, KWF-11651); M.G.N. was supported by a Spinoza grant from the Netherlands Organization for Scientific Research; S.H. and A.M.S. are supported by grants from the Central Norway Regional Health Authorities; J.J.B.C. is supported by an NCI Career Transition Award (K22CA196750) and NCI Cancer Center Support Grant P30-CA19652; M.R. is supported by American Cancer Society postdoctoral fellowship (1K22CA226040-01); M.P.J.d.W. is supported by The Netherlands Heart Foundation (CVON 2011/ B019 and CVON 2017-20); L.A.B.J. was supported by a Competitiveness Operational Programme grant of the Romanian Ministry of European Funds (P_37_762, MySMIS 103587).
Footnotes
Publisher's Disclaimer: This is a PDF file of an unedited manuscript that has been accepted for publication. As a service to our customers we are providing this early version of the manuscript. The manuscript will undergo copyediting, typesetting, and review of the resulting proof before it is published in its final form. Please note that during the production process errors may be discovered which could affect the content, and all legal disclaimers that apply to the journal pertain.
DECLARATION OF INTEREST
W.J.M.M., L.A.B.J., J.O., Z.A.F. and M.G.N. are scientific co-founders of and have equity in Trained Therapeutix Discovery. W.J.M.M. and Z.A.F. have consulting agreements with Trained Therapeutix Discovery.
References
- Akira S, Uematsu S, and Takeuchi O (2006). Pathogen recognition and innate immunity. Cell 124, 783–801. [DOI] [PubMed] [Google Scholar]
- Amir el AD, Davis KL, Tadmor MD, Simonds EF, Levine JH, Bendall SC, Shenfeld DK, Krishnaswamy S, Nolan GP, and Pe’er D (2013). viSNE enables visualization of high dimensional single-cell data and reveals phenotypic heterogeneity of leukemia. Nat Biotechnol 31, 545–552. [DOI] [PMC free article] [PubMed] [Google Scholar]
- Anderson KG, Stromnes IM, and Greenberg PD (2017). Obstacles Posed by the Tumor Microenvironment to T cell Activity: A Case for Synergistic Therapies. Cancer Cell 31, 311–325. [DOI] [PMC free article] [PubMed] [Google Scholar]
- Arts RJ, Joosten LA, and Netea MG (2016). Immunometabolic circuits in trained immunity. Semin Immunol 28, 425–430. [DOI] [PubMed] [Google Scholar]
- Braza MS, van Leent MMT, Lameijer M, Sanchez-Gaytan BL, Arts RJW, Perez-Medina C, Conde P, Garcia MR, Gonzalez-Perez M, Brahmachary M, et al. (2018). Inhibiting Inflammation with Myeloid Cell-Specific Nanobiologics Promotes Organ Transplant Acceptance. Immunity 49, 819–828. [DOI] [PMC free article] [PubMed] [Google Scholar]
- Buenrostro JD, Giresi PG, Zaba LC, Chang HY, and Greenleaf WJ (2013). Transposition of native chromatin for fast and sensitive epigenomic profiling of open chromatin, DNA-binding proteins and nucleosome position. Nat Methods 10, 1213–1218. [DOI] [PMC free article] [PubMed] [Google Scholar]
- Buenrostro JD, Wu B, Chang HY, and Greenleaf WJ (2015). ATAC-seq: A Method for Assaying Chromatin Accessibility Genome-Wide. Curr Protoc Mol Biol 109, 21 29 21–21 29 29. [DOI] [PMC free article] [PubMed] [Google Scholar]
- Buffen K, Oosting M, Quintin J, Ng A, Kleinnijenhuis J, Kumar V, van de Vosse E, Wijmenga C, van Crevel R, Oosterwijk E, et al. (2014). Autophagy controls BCG-induced trained immunity and the response to intravesical BCG therapy for bladder cancer. PLoS Pathog 10, e1004485. [DOI] [PMC free article] [PubMed] [Google Scholar]
- Chen TJ, and Kotecha N (2014). Cytobank: providing an analytics platform for community cytometry data analysis and collaboration. Curr Top Microbiol Immunol 377, 127–157. [DOI] [PubMed] [Google Scholar]
- Corces MR, Trevino AE, Hamilton EG, Greenside PG, Sinnott-Armstrong NA, Vesuna S, Satpathy AT, Rubin AJ, Montine KS, Wu B, et al. (2017). An improved ATAC-seq protocol reduces background and enables interrogation of frozen tissues. Nat Methods 14, 959–962. [DOI] [PMC free article] [PubMed] [Google Scholar]
- DeNardo DG, and Ruffell B (2019). Macrophages as regulators of tumour immunity and immunotherapy. Nat Rev Immunol. [DOI] [PMC free article] [PubMed] [Google Scholar]
- Dobin A, Davis CA, Schlesinger F, Drenkow J, Zaleski C, Jha S, Batut P, Chaisson M, and Gingeras TR (2013). STAR: ultrafast universal RNA-seq aligner. Bioinformatics 29, 15–21. [DOI] [PMC free article] [PubMed] [Google Scholar]
- Gaspar JM (2018). NGmerge: merging paired-end reads via novel empirically-derived models of sequencing errors. BMC Bioinformatics 19, 536. [DOI] [PMC free article] [PubMed] [Google Scholar]
- Gross G, Waks T, and Eshhar Z (1989). Expression of immunoglobulin-T-cell receptor chimeric molecules as functional receptors with antibody-type specificity. Proc Natl Acad Sci U S A 86, 10024–10028. [DOI] [PMC free article] [PubMed] [Google Scholar]
- Hather G, Liu R, Bandi S, Mettetal J, Manfredi M, Shyu WC, Donelan J, and Chakravarty A (2014). Growth rate analysis and efficient experimental design for tumor xenograft studies. Cancer Inform 13, 65–72. [DOI] [PMC free article] [PubMed] [Google Scholar]
- Herodin F, Thullier P, Garin D, and Drouet M (2005). Nonhuman primates are relevant models for research in hematology, immunology and virology. Eur Cytokine Netw 16, 104–116. [PubMed] [Google Scholar]
- Holland JP, Sheh Y, and Lewis JS (2009). Standardized methods for the production of high specific-activity zirconium-89. Nucl Med Biol 36, 729–739. [DOI] [PMC free article] [PubMed] [Google Scholar]
- Janeway CA Jr., and Medzhitov R (2002). Innate immune recognition. Annu Rev Immunol 20, 197–216. [DOI] [PubMed] [Google Scholar]
- Kalos M, Levine BL, Porter DL, Katz S, Grupp SA, Bagg A, and June CH (2011). T cells with chimeric antigen receptors have potent antitumor effects and can establish memory in patients with advanced leukemia. Sci Transl Med 3. [DOI] [PMC free article] [PubMed] [Google Scholar]
- Kambayashi T, and Laufer TM (2014). Atypical MHC class II-expressing antigen-presenting cells: can anything replace a dendritic cell? Nat Rev Immunol 14, 719–730. [DOI] [PubMed] [Google Scholar]
- Kleinnijenhuis J, Quintin J, Preijers F, Joosten LA, Ifrim DC, Saeed S, Jacobs C, van Loenhout J, de Jong D, Stunnenberg HG, et al. (2012). Bacille Calmette-Guerin induces NOD2-dependent nonspecific protection from reinfection via epigenetic reprogramming of monocytes. Proc Natl Acad Sci U S A 109, 17537–17542. [DOI] [PMC free article] [PubMed] [Google Scholar]
- Koo B-S, Lee D-H, Kang P, Jeong K-J, Lee S, Kim K, Lee Y, Huh J-W, Kim Y-H, Park S-J, et al. (2019). Reference values of hematological and biochemical parameters in young-adult cynomolgus monkey (Macaca fascicularis) and rhesus monkey (Macaca mulatta) anesthetized with ketamine hydrochloride. Laboratory Animal Research 35, 7. [DOI] [PMC free article] [PubMed] [Google Scholar]
- Kufer TA, Banks DJ, and Philpott DJ (2006). Innate immune sensing of microbes by Nod proteins. Ann N Y Acad Sci 1072, 19–27. [DOI] [PubMed] [Google Scholar]
- Lameijer M, Binderup T, van Leent MMT, Senders ML, Fay F, Malkus J, Sanchez-Gaytan BL, Teunissen AJP, Karakatsanis N, Robson P, et al. (2018). Efficacy and safety assessment of a TRAF6-targeted nanoimmunotherapy in atherosclerotic mice and non-human primates. Nat Biomed Eng 2, 279–292. [DOI] [PMC free article] [PubMed] [Google Scholar]
- Langford DJ, Bailey AL, Chanda ML, Clarke SE, Drummond TE, Echols S, Glick S, Ingrao J, Klassen-Ross T, Lacroix-Fralish ML, et al. (2010). Coding of facial expressions of pain in the laboratory mouse. Nat Methods 7, 447–449. [DOI] [PubMed] [Google Scholar]
- Langmead B, and Salzberg SL (2012). Fast gapped-read alignment with Bowtie 2. Nat Methods 9, 357–359. [DOI] [PMC free article] [PubMed] [Google Scholar]
- Leentjens J, Kox M, Stokman R, Gerretsen J, Diavatopoulos DA, van Crevel R, Rimmelzwaan GF, Pickkers P, and Netea MG (2015). BCG Vaccination Enhances the Immunogenicity of Subsequent Influenza Vaccination in Healthy Volunteers: A Randomized, Placebo-Controlled Pilot Study. J Infect Dis 212, 1930–1938. [DOI] [PubMed] [Google Scholar]
- Li H, Handsaker B, Wysoker A, Fennell T, Ruan J, Homer N, Marth G, Abecasis G, Durbin R, and Genome Project Data Processing, S. (2009). The Sequence Alignment/Map format and SAMtools. Bioinformatics 25, 2078–2079. [DOI] [PMC free article] [PubMed] [Google Scholar]
- Lim M, Xia Y, Bettegowda C, and Weller M (2018). Current state of immunotherapy for glioblastoma. Nat Rev Clin Oncol 15, 422–442. [DOI] [PubMed] [Google Scholar]
- Love MI, Huber W, and Anders S (2014). Moderated estimation of fold change and dispersion for RNA-seq data with DESeq2. Genome Biol 15, 550. [DOI] [PMC free article] [PubMed] [Google Scholar]
- Mantovani A, Allavena P, Sica A, and Balkwill F (2008). Cancer-related inflammation. Nature 454, 436–444. [DOI] [PubMed] [Google Scholar]
- Meyers PA (2009). Muramyl tripeptide (mifamurtide) for the treatment of osteosarcoma. Expert Rev Anticancer Ther 9, 1035–1049. [DOI] [PubMed] [Google Scholar]
- Mitroulis I, Ruppova K, Wang B, Chen LS, Grzybek M, Grinenko T, Eugster A, Troullinaki M, Palladini A, Kourtzelis I, et al. (2018). Modulation of Myelopoiesis Progenitors Is an Integral Component of Trained Immunity. Cell 172, 147–161. [DOI] [PMC free article] [PubMed] [Google Scholar]
- Mourits VP, Wijkmans JC, Joosten LA, and Netea MG (2018). Trained immunity as a novel therapeutic strategy. Curr Opin Pharmacol 41, 52–58. [DOI] [PubMed] [Google Scholar]
- Mulder WJ, Strijkers GJ, van Tilborg GA, Cormode DP, Fayad ZA, and Nicolay K (2009). Nanoparticulate assemblies of amphiphiles and diagnostically active materials for multimodality imaging. Acc Chem Res 42, 904–914. [DOI] [PMC free article] [PubMed] [Google Scholar]
- Murphy K, Travers P, Walport M, and Janeway C (2012). Janeway’s immunobiology, 8th edn (New York: Garland Science; ). [Google Scholar]
- Neoptolemos JP, Kleeff J, Michl P, Costello E, Greenhalf W, and Palmer DH (2018). Therapeutic developments in pancreatic cancer: current and future perspectives. Nat Rev Gastroenterol Hepatol 15, 333–348. [DOI] [PubMed] [Google Scholar]
- Netea MG, Joosten LA, Latz E, Mills KH, Natoli G, Stunnenberg HG, O’Neill LA, and Xavier RJ (2016). Trained immunity: A program of innate immune memory in health and disease. Science 352. [DOI] [PMC free article] [PubMed] [Google Scholar]
- Netea MG, Joosten LAB, and van der Meer JWM (2017). Hypothesis: stimulation of trained immunity as adjunctive immunotherapy in cancer. J Leukoc Biol 102, 1323–1332. [DOI] [PubMed] [Google Scholar]
- Netea MG, Quintin J, and van der Meer JW (2011). Trained immunity: a memory for innate host defense. Cell Host Microbe 9, 355–361. [DOI] [PubMed] [Google Scholar]
- Ogawa C, Liu YJ, and Kobayashi KS (2011). Muramyl dipeptide and its derivatives: peptide adjuvant in immunological disorders and cancer therapy. Curr Bioact Compd 7, 180–197. [DOI] [PMC free article] [PubMed] [Google Scholar]
- Pardoll DM (2012). Immunology beats cancer: a blueprint for successful translation. Nat Immunol 13, 1129–1132. [DOI] [PMC free article] [PubMed] [Google Scholar]
- Patsialou A, Bravo-Cordero JJ, Wang Y, Entenberg D, Liu H, Clarke M, and Condeelis JS (2013). Intravital multiphoton imaging reveals multicellular streaming as a crucial component of in vivo cell migration in human breast tumors. Intravital 2, e25294. [DOI] [PMC free article] [PubMed] [Google Scholar]
- Perez-Medina C, Abdel-Atti D, Zhang Y, Longo VA, Irwin CP, Binderup T, Ruiz-Cabello J, Fayad ZA, Lewis JS, Mulder WJ, et al. (2014). A modular labeling strategy for in vivo PET and near-infrared fluorescence imaging of nanoparticle tumor targeting. J Nucl Med 55, 1706–1711. [DOI] [PMC free article] [PubMed] [Google Scholar]
- Perez-Medina C, Tang J, Abdel-Atti D, Hogstad B, Merad M, Fisher EA, Fayad ZA, Lewis JS, Mulder WJ, and Reiner T (2015). PET Imaging of Tumor-Associated Macrophages with 89Zr-Labeled High-Density Lipoprotein Nanoparticles. J Nucl Med 56, 1272–1277. [DOI] [PMC free article] [PubMed] [Google Scholar]
- Pitt JM, Vetizou M, Daillere R, Roberti MP, Yamazaki T, Routy B, Lepage P, Boneca IG, Chamaillard M, Kroemer G, et al. (2016). Resistance Mechanisms to Immune-Checkpoint Blockade in Cancer: Tumor-Intrinsic and -Extrinsic Factors. Immunity 44, 1255–1269. [DOI] [PubMed] [Google Scholar]
- Rashidian M, Ingram JR, Dougan M, Dongre A, Whang KA, LeGall C, Cragnolini JJ, Bierie B, Gostissa M, Gorman J, et al. (2017). Predicting the response to CTLA-4 blockade by longitudinal noninvasive monitoring of CD8 T cells. J Exp Med 214, 2243–2255. [DOI] [PMC free article] [PubMed] [Google Scholar]
- Raudvere U, Kolberg L, Kuzmin I, Arak T, Adler P, Peterson H, and Vilo J (2019). g:Profiler: a web server for functional enrichment analysis and conversions of gene lists (2019 update). Nucleic Acids Res 47, W191–W198. [DOI] [PMC free article] [PubMed] [Google Scholar]
- Reissig JL, Storminger JL, and Leloir LF (1955). A modified colorimetric method for the estimation of N-acetylamino sugars. J Biol Chem 217, 959–966. [PubMed] [Google Scholar]
- Seong SY, and Matzinger P (2004). Hydrophobicity: an ancient damage-associated molecular pattern that initiates innate immune responses. Nat Rev Immunol 4, 469–478. [DOI] [PubMed] [Google Scholar]
- Sharma P, and Allison JP (2015). The future of immune checkpoint therapy. Science 348, 56–61. [DOI] [PubMed] [Google Scholar]
- Sharma P, Hu-Lieskovan S, Wargo JA, and Ribas A (2017). Primary, Adaptive, and Acquired Resistance to Cancer Immunotherapy. Cell 168, 707–723. [DOI] [PMC free article] [PubMed] [Google Scholar]
- Tang J, Baxter S, Menon A, Alaarg A, Sanchez-Gaytan BL, Fay F, Zhao Y, Ouimet M, Braza MS, Longo VA, et al. (2016). Immune cell screening of a nanoparticle library improves atherosclerosis therapy. Proc Natl Acad Sci U S A 113, E6731–E6740. [DOI] [PMC free article] [PubMed] [Google Scholar]
- Tang J, Shalabi A, and Hubbard-Lucey VM (2018). Comprehensive analysis of the clinical immuno-oncology landscape. Ann Oncol 29, 84–91. [DOI] [PubMed] [Google Scholar]
- Tardif JC, Ballantyne CM, Barter P, Dasseux JL, Fayad ZA, Guertin MC, Kastelein JJ, Keyserling C, Klepp H, Koenig W, et al. (2014). Effects of the high-density lipoprotein mimetic agent CER-001 on coronary atherosclerosis in patients with acute coronary syndromes: a randomized trial. Eur Heart J 35, 3277–3286. [DOI] [PMC free article] [PubMed] [Google Scholar]
- Van Gassen S, Callebaut B, Van Helden MJ, Lambrecht BN, Demeester P, Dhaene T, and Saeys Y (2015). FlowSOM: Using self-organizing maps for visualization and interpretation of cytometry data. Cytometry A 87, 636–645. [DOI] [PubMed] [Google Scholar]
- Warren HS, Fitting C, Hoff E, Adib-Conquy M, Beasley-Topliffe L, Tesini B, Liang X, Valentine C, Hellman J, Hayden D, et al. (2010). Resilience to bacterial infection: difference between species could be due to proteins in serum. J Infect Dis 201, 223–232. [DOI] [PMC free article] [PubMed] [Google Scholar]
- Yu G, Wang LG, and He QY (2015). ChIPseeker: an R/Bioconductor package for ChIP peak annotation, comparison and visualization. Bioinformatics 31, 2382–2383. [DOI] [PubMed] [Google Scholar]
- Yvan-Charvet L, Pagler T, Gautier EL, Avagyan S, Siry RL, Han S, Welch CL, Wang N, Randolph GJ, Snoeck HW, et al. (2010). ATP-binding cassette transporters and HDL suppress hematopoietic stem cell proliferation. Science 328, 1689–1693. [DOI] [PMC free article] [PubMed] [Google Scholar]
- Zhang Y, Liu T, Meyer CA, Eeckhoute J, Johnson DS, Bernstein BE, Nusbaum C, Myers RM, Brown M, Li W, et al. (2008). Model-based analysis of ChIP-Seq (MACS). Genome Biol 9, R137. [DOI] [PMC free article] [PubMed] [Google Scholar]
Associated Data
This section collects any data citations, data availability statements, or supplementary materials included in this article.
Supplementary Materials
Figure S1. Library screening. Related to Figure 1.
In vitro screening of a library consisting of nanobiologics with varying surface densities of MDP or MTP, ranging from 0.5% to 10%.
(A) Stability assays performed with DLS show the size of all nanobiologic formulations in our library remain stable for at least 10 days.
(B, C) In vitro trained immunity assays performed on (B) murine and (C) human monocytes. Cells were treated in vitro with medium (RPMI), β-glucan, MDP, bare HDL or different nanobiologics at the displayed concentration (1, 10 or 100 μM), and restimulated with LPS after 6 days. IL-6 and TNF-α concentrations were measured in culture medium by ELISA after 24 hours.
Figure S2 – Pharmacokinetics library screening. Related to Figure 1.
(A-B) In vivo screening of a library consisting of nanobiologics with varying surface densities of MDP or MTP, ranging from 1% to 10%.
(A) Blood half-lives of different nanobiologics labeled with 89Zr were derived from the blood decay curves.
(B) Ex vivo gamma counting of tissues excised from mice in which 89Zr-nanobiologics were allowed to circulate for 24 hours.
(C) Drug release assays for the assessment of nanobiologic stability at three different conditions (PBS at 4 °C and 37 °C, and PBS + 10% serum at 37 °C). Three different amounts of cholesterol (5%, 10% or 20%) were incorporated in formulations exposing either 10% MDP or 10% MTP on their surface. Results show that MTP particles with 20% cholesterol incorporated were most stable in all conditions.
(D) CryoTEM images of MTP10-HDL.
Figure S3. In vivo characteristics of MTP10-HDL. Related to Figure 2.
(A) Intravital microscopy of spleens from live animals 8 hours post administration of DiI-MTP10-HDL. FITC-dextran was injected intravenously to display the vasculature.
(B) Flow cytometry gating strategy 24 hours post administration of DiO-MTP10-HDL to identify CMP and GMP cell populations in the bone marrow. Representative histograms show the amount of DiO-MTP10-HDL positive cells. (n=5 per group)
(C) Flow cytometry gating strategy for bone marrow, spleen, and blood 24 hours post administration of either PBS (grey) or DiO-MTP10-HDL (red). Identification of lymphocytes (I), neutrophils (II), and Ly6Chi monocytes (III) with representative histograms showing little uptake of DiO- MTP10-HDL in lymphocytes (I), low to moderate uptake in neutrophils (II) and high uptake in Ly6Chi monocytes (III). (n=5 per group)
For all panels, data are presented as mean ± SD.
Figure S4. Tumor growth control. Related to Figure 3.
(A) Serum TNF-α concentrations as determined by ELISA in mouse serum 6 and 24 hours after treatment with PBS or MTP10-HDL. An increase in TNF-α after 6 hours van be observed that normalizes after 24 hours. (n=5 per group)
(B) Blood biochemistry on serum of C57BL/6 mice treated with PBS or MTP10-HDL shows no increase of ALT, AST or BUN after treatment with MTP10-HDL. (n=5 per group)
(C) H&E stained histology of spleen and liver of C57BL/6 treated with PBS or MTP10-HDL at 6 and 24 hours after last administration shows no changes in morphology.
(D) Body weight of mice from the dose response experiment as shown in Figure 3A. Mice were injected with MTP-HDLhigh or MTP-HDLlow at 1, 2 or 3 doses. No decrease in bodyweight was observed in any of the treatment groups indicating no severe toxicity. (n=8–10 per group)
(E) Tumor growth curve of C57BL/6 mice inoculated with 1 × 10⁵ B16F10 cells and treated with either PBS, free MDP, bare HDL, or MTP10-HDL. There is no statistical significance in tumor growth rate. Tumor size at day 9 is significant for MTP10-HDL (green). (n=8–10 per group)
(F) Blood activity levels in mice that were intraperitoneally injected with 89Zr-MTP10-HDL. (n=5)
(G) Gamma counting of tissues from C57BL/6 mice injected intraperitoneally with 89Zr-MTP10-HDL. Nanobiologics were allowed to circulate for 24 hours. In contrast to intravenous administration, an unfavorable bone marrow uptake as compared to liver uptake was observed. (n=5)
(H) Tumor growth curve comparing intraperitoneal MTP10-HDL treatment with PBS treatment. No significant difference in tumor growth was found. (n=10 per group)
(I) Tumor growth curves of bone marrow transplantation study with non-irradiated recipient mice. Bone marrow donating mice were treated with PBS or MTP10-HDL. Recipient mice subsequently received a subcutaneous injection of 1×10⁵ B16F10 cells. Mice that received bone marrow from mice treated with MTP10-HDL had a significantly smaller tumor at day 9. Significance was calculated for tumor growth rate (black) and tumor size (green). (n=9–10 per group).
(J) Principle component analysis of RNA sequencing data displays clustering of different treatment groups in both HSCs and MPPs
(K) Heatmaps displaying expression data of HSCs (top) and MPPs (bottom) of mice treated with either PBS or MTP10-HDL. HSCs (n= 6–7 per group) MPPs n=2–3 per group)
(L) Significantly upregulated (red) or downregulated (blue) pathways of genes in HSCs with differentially expressed genes (p-value < 0.01 and −1 > Log2FC > 1;).
(M) Significantly upregulated (red) or downregulated (blue) pathways of genes in MPPs (p-value < 0.01 and −1 > Log2FC > 1;).
For all panels, data are presented as mean ± SD and mean ± SEM for tumor growth experiments. *p < 0.05, **p < 0.01, ***p < 0.001, ****p < 0.0001, ns= not significant.
Figure S5. Gating strategy of bone marrow progenitors. Related to Figure 4.
(A-E) Flow cytometry of bone marrow from C57BL/6 mice treated with bare HDL or PBS. Bone marrow was harvested at day 5.
A) Representative flow cytometry plots identifying MPP4s (Flt3+CD150−CD48+) and MPP3s (Flt3−CD150−CD48+) in bone marrow from mice treated with PBS (top) or MTP10-HDL (bottom).
(B) Representative flow cytometry plots for the myeloid progenitors (MyP) identifying CMPs (CD16/32−CD34−) and GMPs (CD16/32+CD34−+) in bone marrow from mice treated with PBS (top) or MTP10-HDL (bottom).
(C) BrdU proliferation assay. Mice received a BrdU injection 48 hours before euthanization. No significant difference in BrdU-positive hematopoietic stem cells (HSCs) and multipotent progenitors (MPPs) was found. (n=4 per group)
(D-E) Frequency of HSCs, MPPs, Lineage− Sca1+ c-kit− (LSK), Ly6Chi monocytes and neutrophils. No significant change was found between groups. (n=6 per group)
(F) Flow cytometry analysis for tumors 24 hours after MTP10-HDL administration displayed as monocytes and neutrophils per mg tumor and as percentage of CD11b+ cells. Immune cells were isolated using Percoll gradient. (n=7–10)
For all panels, data are presented as mean ± SD. *p < 0.05, **p < 0.01, ***p < 0.001, ****p < 0.0001, ns= not significant.
Figure S6. Flow cytometry analyses of blood and spleen. Related to Figure 6.
Tumor-bearing C57BL/6 mice were treated with PBS, MTP10-HDL, anti-CTLA-4 + anti-PD-1, or MTP10-HDL combined with anti-CTLA-4 + anti-PD-1. Leukocyte populations in blood and spleen were analyzed at day 5. (n=10 per group)
(A/D) Top panels show viSNE-plots from all concatenated blood and spleen samples. Metaclusters containing less than 0.5% of events were excluded. The results displayed are from the (A) blood or (D) spleen.
(B/E) Heatmap shows the relative expression of different immune cell markers in each metacluster. Results were normalized by the minimum of the row. Important clusters in (B) and (E) include MC1: Neutrophils, MC9: Monocytes, MC13: CD4+ T cells, MC14: CD8+ T cells.
(C/F) Quantification of cells within each metacluster as a percentage of total CD45+ cells.
Data are presented as mean ± SD. P values were calculated using a Mann–Whitney U tests (two-sided). *p < 0.05, **p < 0.01, ***p < 0.001, ****p < 0.0001, ns= not significant.
Data Availability Statement
Data are available upon request to the Lead Contact. RNA sequencing and ATAC sequencing data are available at the Gene Expression Omnibus (GEO) database (GEO series number GSE126793).