Abstract
Introduction:
Public health surveillance of smoking prevalence is essential in gauging the magnitude of the problem, identifying groups most affected, and evaluating polices. However, little attention has focused on how prevalence is measured, particularly in low-and middle-income countries, where smoking patterns may not mirror those in high-income countries and where the burden of tobacco use is rapidly growing. Mexico provides a unique opportunity to gauge how the questions used to define established smokers can affect prevalence estimates. This study assesses how using the 100-cigarette lifetime question to define smoking status affects estimates of smoking prevalence.
Methods:
We consider data from four nationally representative surveys in Mexico, from 2002 to 2016. These surveys ask about current smoking even for adults who do not indicate having smoked 100 cigarettes in their lifetime. We compare estimates of daily and nondaily smoking prevalence by age and gender with and without the 100-cigarette screen.
Results:
The relative difference in prevalence estimates with and without the screen was greater for nondaily than daily smoking and for females than males. The difference was especially pronounced for nondaily smokers aged 15–24, where there was a 50%−75% relative difference in estimates, albeit smaller discrepancies (20–49% relative difference) were also found among older smokers. In recent years, the relative difference was greatest at lower levels of educational attainment.
Conclusions:
With the growth in nondaily smoking, using the 100-cigarettes screen to define smoking status can have important implications regarding size of smoking population. Further research is warranted in other countries.
Keywords: Smoking prevalence, daily, nondaily, someday, measurement
INTRODUCTION
The World Health Organization’s Framework Convention on Tobacco Control (WHO-FCTC) emphasizes the importance of ongoing surveillance to understand the gravity of the tobacco epidemic and the effectiveness of policies to combat it.(1) In 2013, WHO and its Member States set a voluntary global target of a 30% relative reduction in current tobacco prevalence by 2025 (1). Measures of smoking prevalence play a central role in establishing the extent of the tobacco problem, understanding trends in use, and setting the policy agenda. Monitoring prevalence also helps to identify groups at highest risk of tobacco-related disease (e.g., by age or socio-economic status), as well as to evaluate the impact and effectiveness of tobacco control policies (2), which are now promoted by the United Nations’ sustainable development goals (3).
In furthering these aims, WHO has promoted the Global Adult Tobacco Survey (GATS), funding at least one survey for 22 of the largest low-and middle-income countries (LMICs). Studies using GATS and other surveys have compared smoking rates and trends across LMICs (4–8). However, little attention has been given to how prevalence is measured in LMICs, particularly in the global context, where the burden of tobacco use is rapidly growing and where patterns may not mirror past trends in high-income countries.
One of the factors that may influence estimates of smoking prevalence is the criteria used to define smoking. In high-income countries (HICs), adults are often classified as established smokers if they report having smoked 100 cigarettes in their lifetime and currently smoke cigarettes (9). This screening question is often used to exclude those who have tried relatively few cigarettes from the category of established smokers (9). However, this screen may have a major influence on prevalence estimates, particularly among young adults for whom smoking is a less well-established behavior (10).
Nondaily smoking may be particularly sensitive to the use of the 100-cigarettes screen. While nondaily smoking is less regular than daily smoking, a relatively large percentage of smokers maintain nondaily smoking patterns over time (11, 12). Nondaily smoking is a particularly pronounced pattern in many middle income countries, such as Brazil, India, Indonesia, Thailand, and Mexico (13–16), as well as in many high income countries (12, 17–20). In Mexico, nondaily smoking prevalence rates of those age 15–65 increased from 12.3% in 2002 (21) to 18.4% in in 2016 (22) among males, and from 1.7% in 2002 (21) to 6.0% in 2016 (22) among females.
Mexico provides a unique opportunity to consider how questions used to define established smoking can affect prevalence estimates, particularly as they relate to the distinction between daily and nondaily smokers. Mexico has several nationally-representative surveys that assess smoking (23). Some surveys ask whether the individual has smoked 100 cigarettes in their lifetime, but then still proceed with questions about current smoking even if the 100-cigarettes criterion is not met (24, 25). This study examines the effect of the 100-cigarette screen on estimates of adult smoking prevalence. We distinguish daily and nondaily smoking prevalence by gender, age and education level.
METHODS
We considered all nationally representative surveys in Mexico since 2002 (see Supplement 1), including only those that queried both whether the participant had smoked 100 cigarettes in their lifetime and current smoking behavior, whether the respondent reported smoking 100 cigarettes or not. Four surveys met these criteria: three National Surveys on Addiction (NSAs or ENA in Spanish: 2002 N=10,418 (21); 2011 N=14,298 (26); 2016 N=50,252 (22)) and the 2012 National Health and Nutrition Survey (NHNS or ENSANUT in Spanish: N=50,364 (27)). All were household surveys conducted in person, with a multi-stage stratified sampling approach, but use different sampling frames (see Supplement 1). While the 2002 and 2011 NSA are nationally representative, the 2016 NSA survey is larger to produce nationally and state representative estimates.
We confined the analysis to the 15–65 year old population, since all surveys included participants in this age group. We considered variations by gender and age (15–24, 25–44, and 45–65) and by educational group (primary or less, middle school, high school, and university or more). For our analysis by educational status, we only consider the 2002, 2011 and 2016 NSA estimates, because the 2012 questions were not comparable.
Prevalence estimates of daily and nondaily smokers were developed based on two definitions: NoScreen is the reported smoking daily/nondaily during the last 30 days; WithScreen is the reported smoking daily/nondaily prevalence rate in the last 30 days and reported having smoked at least 100-cigarettes in their lifetime. We measured the sensitivity of the 100-cigarettes screen in terms of the relative difference of the WithScreen from the NoScreen rates, i.e., (NoScreen-WithScreen)/NoScreen.
We calculated the weighted means and confidence intervals by gender for the 15–65 year old, as well as the 15–24 year old, 25–44 year old and the 45–65 year old age groups. Differences between the WithScreen and NoScreen estimates were considered statistically significant if the WithScreen point prevalence estimate was outside the 95% confidence interval of the NoScreen prevalence estimate. All statistical analyses were performed using STATA 15.
RESULTS
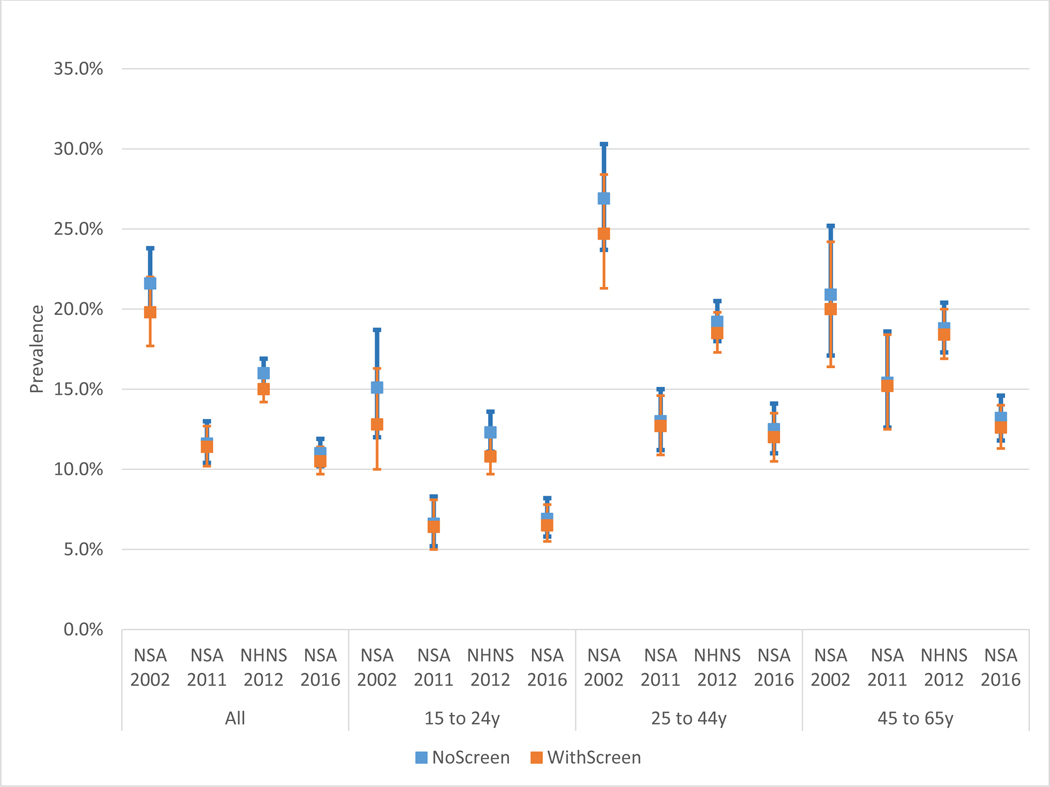
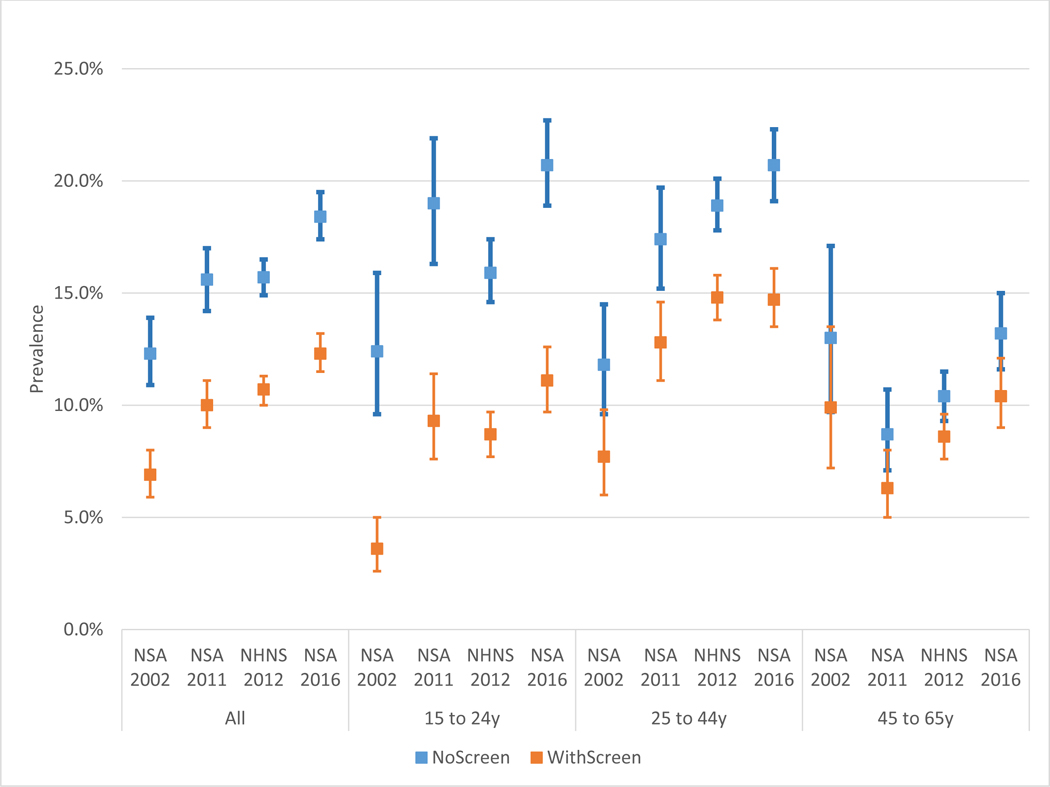
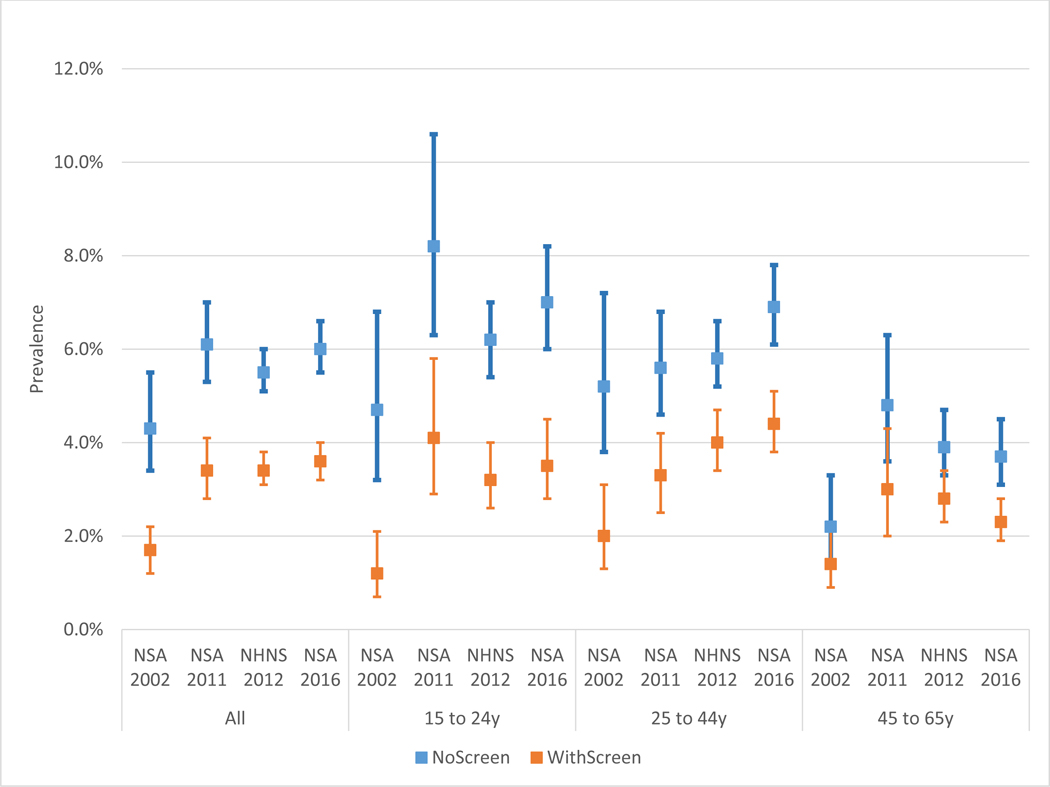
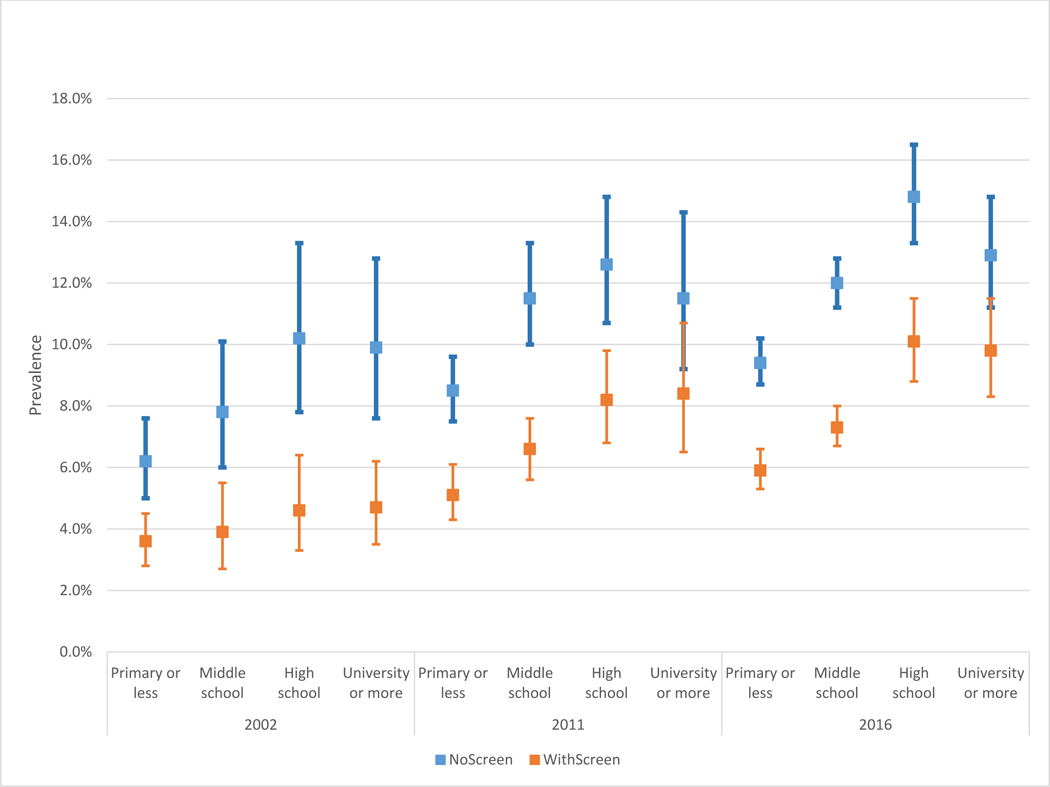
Figures 1a and 1b show the NoScreen (without 100-cigarettes screen) and WithScreen (with 100-cigarettes screen) prevalence estimates for daily smokers among males and females, respectively. Figures 2a and 2b show the NoScreen and WithScreen estimates respectively for male and female nondaily smokers. Figures 3a and 3b show the NoScreen and WithScreen estimates by educational group respectively for daily and nondaily smokers. Specific point estimates and the relative difference in measures can be found in Supplement 2.
Figure 1a.

Prevalence of Male Daily Smokers by Age, Year, and Definition
Notes: NoScreen = without 100-cigarettes lifetime screen, WithScreen = with 100-cigarettes lifetime screen
Figure 1b.

Prevalence of Female Daily Smokers by Age, Year, and Definition
Notes: NoScreen = without 100-cigarettes lifetime screen, WithScreen = with 100-cigarettes lifetime screen
Figure 2a.

Prevalence of Male Nondaily Smokers by Age,Year,and Definition
Notes: NoScreen = without 100-cigarettes lifetime screen, WithScreen = with 100-cigarettes lifetime screen
Figure 2b.

Prevalence of Female Nondaily Somkers by Age,Year,and Definition
Notes: NoScreen = without 100-cigarettes lifetime screen, WithScreen = with 100-cigarettes lifetime screen
Figure 3a.

Prevalence of Daily Smokers by Educational Attainment,Year,and Definition
Notes: NoScreen = without 100-cigarettes lifetime screen, WithScreen = with 100-cigarettes lifetime screen
Figure 3b.

Prevalence of Nondaily Smokers by Educational Attainment,Year,and Definition
Notes: NoScreen = without 100-cigarettes lifetime screen, WithScreen = with 100-cigarettes lifetime screen
Daily Smoking Prevalence
Using the NSA, the WithScreen rates (19.8% for males and 6.3% for females) were lower than the NoScreen rates (21.6% and 7.1% for females) by 8% for males and by 11% for females in 2002, although closer (2% in 2011 and 4.5% in 2016 for males and 2.5% in 2011 and 3% in 2016 for females) in the later years. The 2012 NHNS daily NoScreen prevalence was 16.0% for males and 5.4% for females, with the WithScreen estimates 6%−7% lower than NoScreen estimates. Although the WithScreen daily rates were consistently lower than the NoScreen rates, the differences were not significant.
Similar patterns are seen by age group. For estimates of daily smoking among ages 15–24 using NSA, the WithScreen were below NoScreen rates by 15% for males and 16% for females in 2002, by 3% for males and 9% for females in 2011, and by 6% for males and 5% for females in 2016. Using the 2012 NHNS, WithScreen rates were below NoScreen rates by 12% for males and by 19% for females for ages 18–24. For ages 25–44, WithScreen rates were lower than NoScreen rates by 8% for males and 11% for females in 2002, and by 3%−4% for males and 3%−5% for females in the years 2011, 2012, and 2016. For ages 45–65, WithScreen rates were still lower than NoScreen rates by 4% for males and 9% for females for in 2002, 1% for males and 8% for females in 2011, by 2% for males and 4% for females in 2012, and by 5% for males and 9% for females in 2016. Although the WithScreen daily rates were consistently lower than the NoScreen rates, the differences were not significant.
In terms of educational attainment, the relative difference between the NoScreen and WithScreen daily prevalence rates did not show consistent variation between educational groups. Although the relative difference was higher than in lower education groups, the differences were not significant.
Nondaily Smoking Prevalence
WithScreen rates were lower than NoScreen rates by 44% for males and 61% for females in 2002, with slightly smaller discrepancies in 2011 (36% and 44%) and 2016 (33% and 40%). In all cases, WithScreen estimates were below the confidence intervals of the NoScreen estimates. The Nondaily 2012 NHNS WithScreen prevalence was below NoScreen rates by 32% for males and 38% for females. The WithScreen nondaily prevalence rates were significantly different from the NoScreen rates for both genders in all years.
Aged 15–24 nondaily NSA, WithScreen rates were much lower than NoScreen rates for both genders (about 75% in 2002 and about 50% in 2011 and 2016). NHNS 2012 aged 15–24 WithScreen was lower NoScreen by 45% for males and 48% for females. Aged 25–44 NSA nondaily WithScreen was below NoScreen by 35% for males and 62% for females in 2002, by 26% for males and 41% for females in 2011, by 22% for males and 31% for females in 2012 and by 29% for males and 36% for females in 2016. Aged 45–65 NSA WithScreen were lower than NoScreen rates by 24% for males and 29% for females in 2002, by 28% for males and 39% for females in 2011, and by 21% for males and 36% for females in 2016. The 2012 female NHNS WithScreen below NoScreen rates by 21% for males and 38% for females. The WithScreen nondaily prevalence rates were different from the NoScreen rates for both genders in the age 15–24 and 25–44 age groups, but only among females in the 45–65 age group for the year 2016.
The nondaily relative differences between the 2002 WithScreen and NoScreen groups increased from 42% among those in primary school to 50% among those with middle school education and 54% among those with a university education. Meanwhile, the relative difference tended to decline with educational attainment in 2011 and 2016. In 2016, the relative difference was 37% for primary school, 39% for middle school, 32% for high school and 24% for university level.
DISCUSSION
This study found that applying the commonly-used screen of having smoked 100 cigarettes lifetime to define smoking status has a major impact on smoking prevalence estimates. The relative difference in the estimated prevalence with and without the screen was greater for nondaily than daily smoking prevalence, and for females compared to males. The variation was especially large among nondaily smokers aged 15–24, with as much as a 75% difference in prevalence with and without the screen. However, substantial variations were even found for older nondaily smokers (ages 25 and above), who were likely to have initiated smoking two or more decades prior to the surveys and therefore were very likely to have smoked more than 100 cigarettes. The results indicated some variation even for daily smokers, albeit to a lesser extent than for nondaily smokers and not different between the NoScreen and WithScreen rates.
Our findings are consistent with a US study (10), which also found that a significant proportion of respondents claimed that they had not smoked 100 cigarettes even though they subsequently reported that they currently smoked. While the relative differences were less than those reported above for Mexico, the authors found higher rates among the younger and Hispanic populations.
The sensitivity of smoking prevalence to the 100-cigarette screen suggests that a substantial number of nondaily smokers may not consider themselves smokers (10) or may still be at an experimental stage where their smoking is still uncertain (e.g., youth or young adults). Also, according to the 2016 NSA, the variation between NoScreen and WithScreen in nondaily smokers is greater among those with lower educational attainment (37%) than those with higher educational attainment (24%), suggesting that lower health literacy may contribute to difficulties in calculating lifetime exposure (28) or that other education-related issues may lead to misunderstanding the question (e.g., that it applies to 100 cigarettes within a limited time period). Such concerns may help explain why most GATS countries (17/22) decided to not include the 100-cigarette question (29).
While use of the 100-cigarettes screen appears to underestimate the number of smokers, it is not clear that the 100-cigarette criterion should be discarded. The screen is commonly used to distinguish regular, established smokers from more transient smokers, since the 100-cigarettes screen helps to identify those in a population who are more likely to suffer the greater health harms of smoking than lighter or non-consumers. Nevertheless, other questions might better distinguish established smokers, including questions about smoking duration and intensity (e.g., days smoked in the past month, cigarettes per day), or questions about frequent smoking in the past. In gauging the public health impacts of smoking, it is important to ask further questions of those claiming to not have smoked 100 cigarettes, Thereby, the public health benefits can be better assessed.
This study has several limitations. Information quality could differ across surveys. The survey length and specific questions asked could also affect the findings (see Supplement 1) (30, 31). The surveys included different topics. NSA focused on tobacco, illegal drugs, alcohol and violence behaviors, although questions on tobacco are asked before questions on illegal behaviors, potentially decreasing concerns regarding social desirability. NHNS is a general health survey and questions on smoking are asked later in the survey, but before querying about alcohol use. However, we primarily contrasted smoker definitions within each survey, so issues across surveys are not likely to affect our conclusions.
Our results should be generalized cautiously to other nations since Mexico has an unusually high percentage of nondaily smokers (65% in 2016 (27)). However, some other Latin American countries have similar smoking patterns (29). Therefore, our results are likely relevant for the Latin American region as well as for the U.S., where Latinos are the largest ethnic minority, of which almost two-thirds are of Mexican heritage, and where the proportion of nondaily smokers has been increasing in the general population (32).
In conclusion, our analysis demonstrates that using the question on 100 cigarettes lifetime to screen and define established smoking can have a considerable impact on the magnitude of national prevalence estimates. In Mexico, the difference is particularly relevant among nondaily smokers. As nondaily smoking becomes more common around the world, it will be important to carefully consider the use of the 100 cigarettes screen, and, when possible, report prevalence estimates with and without the screen. For the purpose of comparability across surveys, surveys not including the 100-cigarettes question should consider adding it but continue asking questions on smoking independent of the answer. In addition, questions about smoking duration, intensity, and prior engagement in regular smoking should be asked to allow for more precise differentiation of established versus experimental smoking.
Supplementary Material
Key Messages.
Little attention has focused on how prevalence is measured, particularly in low-and middle-income countries, where smoking patterns may not mirror those in high-income countries and where the burden of tobacco use is rapidly growing.
This study assesses how using the 100-cigarette lifetime question to screen smoking status affects estimates of smoking prevalence.
The relative difference in prevalence estimates with and without the screen was greater for nondaily than daily smoking, with a maximum 71% (75%) relative difference in estimates for aged 15–24 male (female) nondaily smokers in 2002 and a minimum 17% (28%) for age 45–65 male (female) nondaily smokers in 2012.
Further research is warranted on the 100-cigarette lifetime question, and whether another criterion might be better suited to measure regular smoking patterns.
Acknowledgments
Funding
This work was supported by the US National Institutes of Health National Cancer Institute grant # U01CA199284-01 and Fogarty International Center grant # R01 TW010652. The content is solely the responsibility of the authors and does not necessarily represent the official views of the National Institutes of Health.
Footnotes
Competing Interests
None declared
References
- 1.World Health Organization. WHO discussion paper: a comprehensive global monitoring framework and voluntary global targets for the prevention and control of NCDs. comprehensive global monitoring framework including indicators and a set of voluntary global targets for the prevention and control of NCDs. Geneva: World Health Organization; 2013. [cited 2015. Available from: http://www.who.int/nmh/events/2012/consultation_april_2012/en/. [Google Scholar]
- 2.Levy DT, Tam J, Kuo C, Fong GT, Chaloupka F. The Impact of Implementing Tobacco Control Policies: The 2017 Tobacco Control Policy Scorecard. J Public Health Manag Pract. 2018;24(5):448–57. [DOI] [PMC free article] [PubMed] [Google Scholar]
- 3.United Nations Development Programme. United Nations Sustainable Development Goals Geneva 2018. [ [Google Scholar]
- 4.Song Y, Zhao L, Palipudi KM, Asma S, Morton J, Talley B, et al. Tracking MPOWER in 14 countries: results from the Global Adult Tobacco Survey, 2008–2010. Glob Health Promot. 2016;23(2 Suppl):24–37. [DOI] [PubMed] [Google Scholar]
- 5.Giovino GA, Mirza SA, Samet JM, Gupta PC, Jarvis MJ, Bhala N, et al. Tobacco use in 3 billion individuals from 16 countries: an analysis of nationally representative cross-sectional household surveys. Lancet. 2012;380(9842):668–79. [DOI] [PubMed] [Google Scholar]
- 6.Ng M, Freeman MK, Fleming TD, Robinson M, Dwyer-Lindgren L, Thomson B, et al. Smoking prevalence and cigarette consumption in 187 countries, 1980–2012. JAMA. 2014;311(2):183–92. [DOI] [PubMed] [Google Scholar]
- 7.Collaborators GBDT. Smoking prevalence and attributable disease burden in 195 countries and territories, 1990–2015: a systematic analysis from the Global Burden of Disease Study 2015. Lancet. 2017;389(10082):1885–906. [DOI] [PMC free article] [PubMed] [Google Scholar]
- 8.Bilano V, Gilmour S, Moffiet T, d’Espaignet ET, Stevens GA, Commar A, et al. Global trends and projections for tobacco use, 1990–2025: an analysis of smoking indicators from the WHO Comprehensive Information Systems for Tobacco Control. Lancet. 2015;385(9972):966–76. [DOI] [PubMed] [Google Scholar]
- 9.Bondy SJ, Victor JC, Diemert LM. Origin and use of the 100 cigarette criterion in tobacco surveys. Tob Control. 2009;18(4):317–23. [DOI] [PubMed] [Google Scholar]
- 10.Ryan H, Trosclair A, Gfroerer J. Adult current smoking: differences in definitions and prevalence estimates--NHIS and NSDUH, 2008. J Environ Public Health. 2012;2012:918368. [DOI] [PMC free article] [PubMed] [Google Scholar]
- 11.Hassmiller KM, Warner KE, Mendez D, Levy DT, Romano E. Nondaily smokers: who are they? Am J Public Health. 2003;93(8):1321–7. [DOI] [PMC free article] [PubMed] [Google Scholar]
- 12.Schauer GL, Malarcher AM, Mowery P. National Trends in Frequency and Amount of Nondaily Smoking, and Relation to Quit Attempts, 2000–2012. Nicotine Tob Res. 2016;18(6):1539–44. [DOI] [PubMed] [Google Scholar]
- 13.Formagini TDB, Gomide HP, Perales J, Colugnati FAB. Prevalence and correlates of light and non-daily smoking in Brazil: Results from a nationwide representative survey. Drug Alcohol Depend. 2017;178:15–9. [DOI] [PubMed] [Google Scholar]
- 14.Swayampakala K, Thrasher J, Carpenter MJ, Shigematsu LM, Cupertio AP, Berg CJ. Level of cigarette consumption and quit behavior in a population of low-intensity smokers--longitudinal results from the International Tobacco Control (ITC) survey in Mexico. Addict Behav. 2013;38(4):1958–65. [DOI] [PMC free article] [PubMed] [Google Scholar]
- 15.Swayampakala K, Thrasher JF, Hardin JW, Titus AR, Liu J, Fong GT, et al. Factors associated with changing cigarette consumption patterns among low-intensity smokers: Longitudinal findings across four waves (2008–2012) of ITC Mexico Survey. Addict Behav Rep. 2018;8:154–63. [DOI] [PMC free article] [PubMed] [Google Scholar]
- 16.CDC Foundation, World Health Foundation. The GATS Atlas: Global Adult Tobacco Survey. Brighton, UK: Myriad Editions; 2015. [Google Scholar]
- 17.Kilgore EA, Mandel-Ricci J, Johns M, Coady MH, Perl SB, Goodman A, et al. Making it harder to smoke and easier to quit: the effect of 10 years of tobacco control in New York City. Am J Public Health. 2014;104(6):e5–8. [DOI] [PMC free article] [PubMed] [Google Scholar]
- 18.Kotz D, Fidler J, West R. Very low rate and light smokers: smoking patterns and cessation-related behaviour in England, 2006–11. Addiction. 2011. [DOI] [PubMed] [Google Scholar]
- 19.Pulvers K, Romero DR, Blanco L, Sakuma KL, Ahluwalia JS, Trinidad DR. Light and intermittent smoking among California Black, Hispanic/Latino, and non-Hispanic White men and women. Nicotine Tob Res. 2015;17(6):755–9. [DOI] [PubMed] [Google Scholar]
- 20.Lund M, Lund KE, Kvaavik E. Hardcore smokers in Norway 1996–2009. Nicotine Tob Res. 2011;13(11):1132–9. [DOI] [PMC free article] [PubMed] [Google Scholar]
- 21.Mexico National Institute of Public Health. National Addictions Survey 2002 Cuernavaca, Mexico 2016. [Available from: ghdx.healthdata.org/record/mexico-national-addictionsurvey-2002.
- 22.Instituto Nacional de Psiquiatría Ramón de la Fuente Muñiz; Instituto Nacional de Salud Pública CNClA, Secretaría de Salud. . Encuesta Nacional de Consumo de Drogas, Alcohol y Tabaco 2016–2017: Reporte de Tabaco. Reynales-Shigematsu LM. Zavala-Arciniega L, Paz-Ballesteros WC, Gutiérrez-Torres DS, García-Buendía JC, Rodriguez-Andrade MA, Gutiérrez-Reyes J, Franco-Núñez A, Romero-Martínez M. y Mendoza-Alvarado L. de México Ciudad, México: INPRFM; 2017. [Google Scholar]
- 23.Global Adult Tobacco Survey Collaborative Group. Global Adult Tobacco Survey (GATS): Core Questionnaire with Optional Questions, Version 2.0. Atlanta: Centers for Disease Control and Prevention; 2010. [Available from: http://www.who.int/tobacco/surveillance/en_tfi_gats_corequestionnairewithoptionalquestions_v2_FINAL_03Nov2010.pdf. [Google Scholar]
- 24.Gutierrez J, Rivera-Dommarco J, Shamah-Levy T, Villalpando-Hernandez S, Franco A C-N L., Romero-Martinez M, et al. Encuesta Nacional de Salud y Nutricion 2012. Resultados Nacionales. . In: (MX) INdSP, editor. Cuernavaca, Mexico: 2012. [Google Scholar]
- 25.Instituto Nacional de Psiquiatría Ramón de la Fuente Muñiz; Instituto Nacional de Salud Pública CNClA, Secretaría de Salud,. Encuesta Nacional de Consumo de Drogas, Alcohol y Tabaco 2016–2017: Reporte de Tabaco Ciudad de México, México: INPRFM; 2017. [Available from: https://www.gob.mx/salud%7Cconadic/acciones-y-programas/encuesta-nacional-de-consumo-de-drogas-alcohol-y-tabaco-encodat-2016-2017-136758.
- 26.Mexico National Institute of Public Health. National Addictions Survey 2011 Cuernavca, Mexico: INSP; 2016. [Available from: ghdx.healthdata.org/record/mexico-national-addictionsurvey-2011.
- 27.Mexico National Institute of Public Health. Mexico National Survey of Health and Nutrition 2011–2012 Cuenavaca, Mexico 2016. [Available from: ghdx.healthdata.org/record/mexico-national-survey-health-andnutrition-2011-12.
- 28.Martin LT, Haas A, Schonlau M, Derose KP, Rosenfeld L, Rudd R, et al. Which literacy skills are associated with smoking? J Epidemiol Community Health. 2012;66(2):189–92. [DOI] [PMC free article] [PubMed] [Google Scholar]
- 29.World Health Organization. The GATS Atlas: Global Adult Tobacco Survey 2019. [updated January 23, 2019. Available from: https://www.who.int/tobacco/surveillance/survey/gats/en/.
- 30.Pierannunzi C, Hu SS, Balluz L. A systematic review of publications assessing reliability and validity of the Behavioral Risk Factor Surveillance System (BRFSS), 2004–2011. BMC Med Res Methodol. 2013;13:49. [DOI] [PMC free article] [PubMed] [Google Scholar]
- 31.Delnevo CD, Bauer UE. Monitoring the tobacco use epidemic III: The host: data sources and methodological challenges. Prev Med. 2009;48(1 Suppl):S16–23. [DOI] [PubMed] [Google Scholar]
- 32.Centers for Disease Control and Prevention (CDC). Current Cigarette Smoking Among Adults —United States, 2005–2014. . MMWR Morb Mortal Wkly Rep. 2015;66(44):1233–40. [DOI] [PubMed] [Google Scholar]
Associated Data
This section collects any data citations, data availability statements, or supplementary materials included in this article.


