Abstract
BACKGROUND
Patients with p16+ oropharyngeal squamous cell carcinoma (OPSCC) are potentially cured with definitive treatment. However, there are currently no reliable biomarkers of treatment failure for p16+ OPSCC. Pathologist-based visual assessment of tumor cell multinucleation (MN) has been shown to be independently prognostic of disease-free survival (DFS) in p16+ OPSCC. However, its quantification is time intensive, subjective, and at risk of interobserver variability.
METHODS
We present a deep-learning–based metric, the multinucleation index (MuNI), for prognostication in p16+ OPSCC. This approach quantifies tumor MN from digitally scanned H&E-stained slides. Representative H&E-stained whole-slide images from 1094 patients with previously untreated p16+ OPSCC were acquired from 6 institutions for optimization and validation of the MuNI.
RESULTS
The MuNI was prognostic for DFS, overall survival (OS), or distant metastasis–free survival (DMFS) in p16+ OPSCC, with HRs of 1.78 (95% CI: 1.37–2.30), 1.94 (1.44–2.60), and 1.88 (1.43–2.47), respectively, independent of age, smoking status, treatment type, or tumor and lymph node (T/N) categories in multivariable analyses. The MuNI was also prognostic for DFS, OS, and DMFS in patients with stage I and stage III OPSCC, separately.
CONCLUSION
MuNI holds promise as a low-cost, tissue-nondestructive, H&E stain–based digital biomarker test for counseling, treatment, and surveillance of patients with p16+ OPSCC. These data support further confirmation of the MuNI in prospective trials.
FUNDING
National Cancer Institute (NCI), NIH; National Institute for Biomedical Imaging and Bioengineering, NIH; National Center for Research Resources, NIH; VA Merit Review Award from the US Department of VA Biomedical Laboratory Research and Development Service; US Department of Defense (DOD) Breast Cancer Research Program Breakthrough Level 1 Award; DOD Prostate Cancer Idea Development Award; DOD Lung Cancer Investigator-Initiated Translational Research Award; DOD Peer-Reviewed Cancer Research Program; Ohio Third Frontier Technology Validation Fund; Wallace H. Coulter Foundation Program in the Department of Biomedical Engineering; Clinical and Translational Science Award (CTSA) program, Case Western Reserve University; NCI Cancer Center Support Grant, NIH; Career Development Award from the US Department of VA Clinical Sciences Research and Development Program; Dan L. Duncan Comprehensive Cancer Center Support Grant, NIH; and Computational Genomic Epidemiology of Cancer Program, Case Comprehensive Cancer Center. The content is solely the responsibility of the authors and does not necessarily represent the official views of the NIH, the US Department of VA, the DOD, or the US Government.
Keywords: Oncology
Keywords: Head and neck cancer
Introduction
The continued increase in the incidence of oropharyngeal squamous cell carcinoma (OPSCC) in the setting of declining rates of tobacco use has been attributed to HPV, with almost 70% of all OPSCCs being HPV+ (1–3). HPV-related OPSCC has now overtaken cervical cancer as the most common HPV-related malignancy in the US (1, 2). HPV positivity has been well demonstrated to confer favorable survival for patients with OPSCC (4, 5). This has led to separate tumor, node, metastasis (TNM) staging systems for HPV-related (p16+) and HPV-unrelated OPSCC patients in the new 8th edition of the American Joint Commission on Cancer/Union for International Cancer Control (AJCC/UICC) guidelines (3), with p16 IHC currently recognized as a suitable surrogate marker for HPV in these patients (4–6).
Clinically, tumor and lymph node (T/N) status along with smoking have previously been shown to influence the risk of recurrence and/or death for patients with p16+ OPSCC (4, 5). However, these clinical parameters fail to capture intrinsic biological characteristics of p16+ OPSCC that may be relevant to treatment sensitivity and thus a clinical response. Machczynski et al. nicely discuss the limitations of even the new 8th edition of the AJCC guidelines regarding staging for p16+ OPSCC (7). Wuerdemann et al. found that the 8th edition’s staging system did not discriminate well between patients with HPV+ stage II OPSCC and those with HPV+ stage III OPSCC (8). Similarly, no significant differences in OS have been found between the 8th edition’s guidelines for (9) stage I versus stage II and (10) stage II versus stage III OPSCC.
Currently, the biomarker landscape for HPV-related OPSCC has largely focused on finding single- or multigene prognostic signatures. Verma et al. showed that the lack of STAT3 expression along with the increased expression of AP1 and NF-κB were associated with a better prognosis in p16+ OPSCC (11). Similarly, Balermpas et al. demonstrated that the presence of CD8+ and FOXP3+ T cells was prognostic of overall survival (OS) and disease-free survival (DFS) in p16+ OPSCC (n = 130; ref. 12). Consequently, some investigators have used genomic, epigenetic, and gene expression data to generate complex signatures of aggressive p16+ OPSCC biology (6, 13, 14). Unfortunately, the potential for clinical adoption of these studies is limited because of the lack of independent validation cohorts and very small sample sizes. In addition, these strategies rely on tissue-destructive sampling or require expensive methods for gene expression profiling. To date, however, no single signature has been validated as a practical predictor of DFS, OS, or distant metastasis–free survival (DMFS) in multiple cohorts, a critical step toward translating the signature into a clinical test. Reliable and sensitive prognostic tools for p16+ OPSCC could support clinical decision making. For instance, in high-risk patients, a safe de-escalation of treatment may not be possible, whereas, conversely, very low-risk patients could benefit from de-escalation and thus avoid adverse effects related to unnecessary intensive therapy (5).
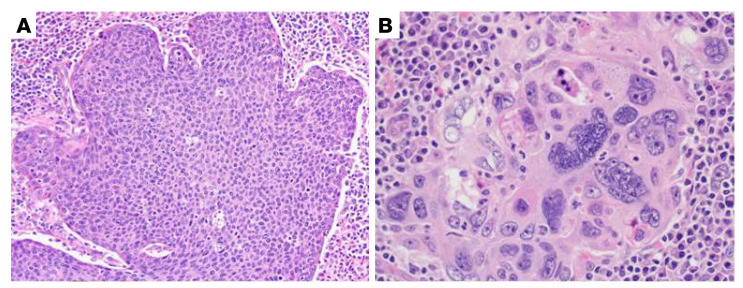
Traditionally, tissue morphology and architecture within the tumor microenvironment (TME) have been shown to be reflective of tumor characteristics and to carry rich prognostic and predictive information across myriad histologic types (15–17). For head and neck squamous cell carcinoma (HNSCC), Hartman et al. reported that high numbers of tumor-infiltrating CD8+ T cells in the TME are associated with oropharyngeal localization and limited tumor growth and that the patients with high infiltration of CD8+ T cells also have significantly better outcomes (18). Lewis et al. previously visually identified anaplasia and multinucleation (MN) in the TME as novel prognostic and independently associated features in patients with p16+ OPSCC (Figure 1 and ref. 19). However, the recognition and quantification of morphologic features is time intensive and requires human interpretation, leading to interobserver variability and bias.
Figure 1. Example of tumor cell MN.
(A) Typical nonkeratinizing SSC, for comparison, which has fusiform, high nuclear/cytoplasmic ratios with inconspicuous nucleoli and brisk mitotic activity. The nuclei are relatively consistent in size across the whole tumor (original magnification, ×20). (B) Tumor with an area of MN, in which cells have 3 or more nuclei (original magnification, ×40).
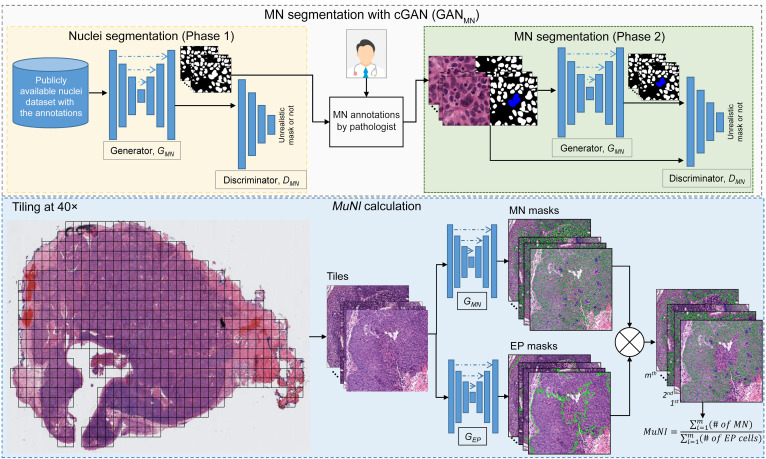
In this work, we present a computerized metric called the multinucleation index (MuNI), a quantification of MN density in epithelial (EP) regions, to risk-stratify patients with p16+ OPSCC for DFS, OS, and DMFS. Two machine-learning networks, specifically, conditional generative adversarial networks (cGANs) (20), were used for the MuNI calculations: (a) GANMN to segment MN events and (b) GANEP to segment cancer nuclei in EP regions in digitized H&E-stained whole-slide images (WSIs). By calculating the ratio of the MN events to the total number of EP nuclei identified on the slide image, we calculated a MuNI for every slide and every patient with p16+ OPSCC (Figure 2). A large cohort of 1094 previously untreated patients with p16+ OPSCC obtained from 6 institutions was used to validate the prognostic ability of the MuNI. We performed univariate and multivariable analyses using DFS, OS, and DMFS as the clinical endpoints. The prognostic ability of the MuNI to predict the same endpoints was also evaluated within the individual stage I, II, and III groups, as defined by the AJCC’s 8th edition.
Figure 2. Overall flowchart of the image analysis pipeline.
The training step involved building MN and EP segregators. The same deep-learning architecture, cGAN, was used to build the segregators. Each block in the cGAN models consisted of convolution, BatchNorm, and ReLU layers. The MuNI calculation phase started with the extraction of tiles from tissue regions. The tiles were then input into the MN and EP models separately. Finally, the MuNI was calculated automatically, which was the ratio of MNs within EP regions to EP cells.
Results
Patient demographics.
Details on patient demographics for all cohorts from the individual sites are provided in Supplemental Table 1 (supplemental material available online with this article; https://doi.org/10.1172/JCI145488DS1). Patients were followed for a mean and median of 63 and 59 months, respectively (range, 1–200 months). Briefly, the median age for the entire set was 58 years; 66% of patients were current or former smokers; and 93.4% of patients were White. The Non-White races consisted of Black (5.3%) and Asian (0.4%). Supplemental Table 1 provides statistical differences in the clinical variables and MuNI across the cohorts.
Experiment 1: association between the MuNI and OS, DFS, and DMFS in all patients.
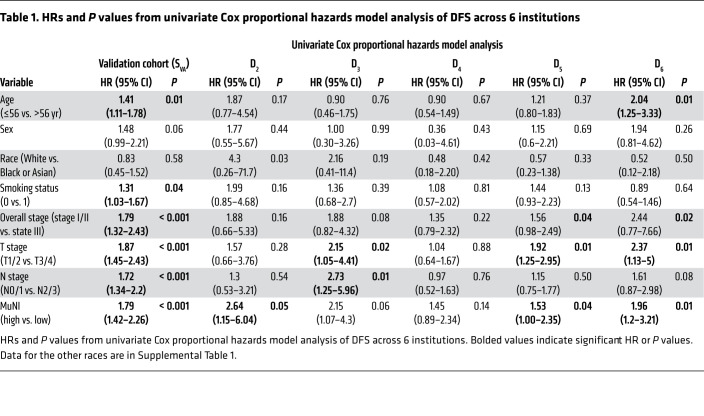
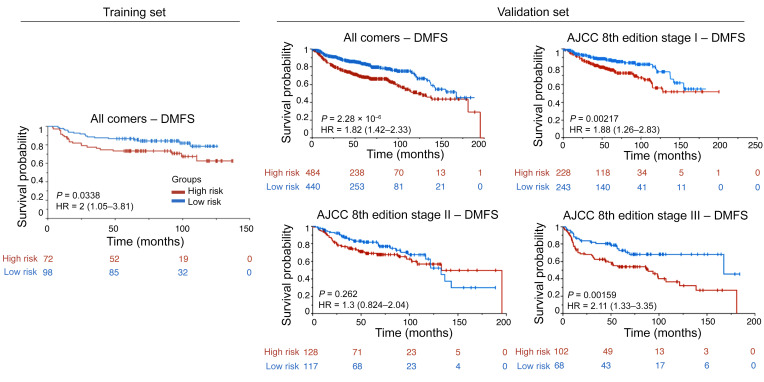
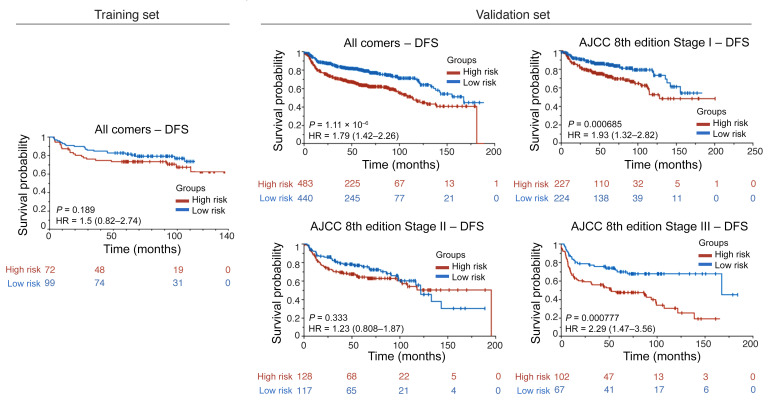
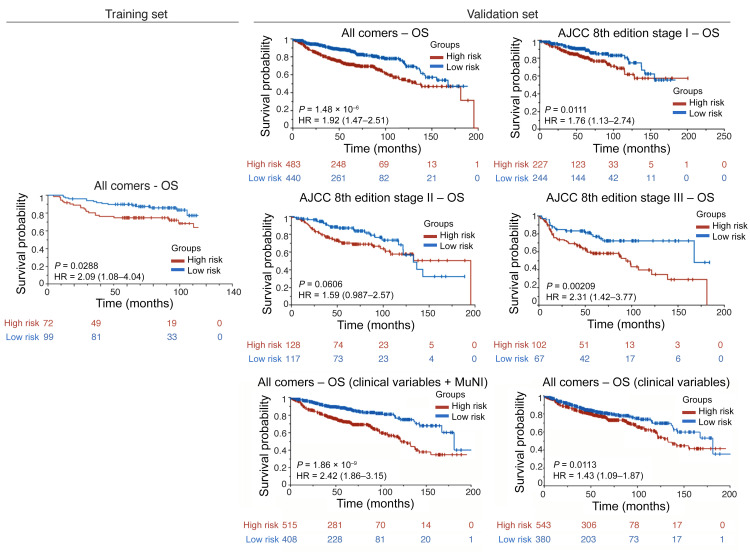
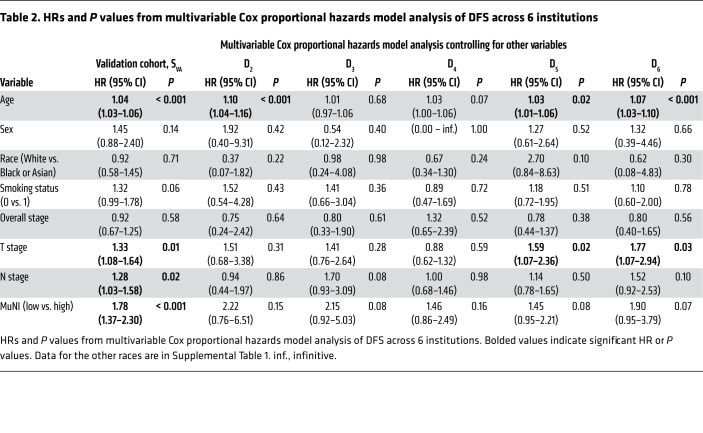
Table 1 provides the results of the univariate analysis for the major clinical and pathologic features and for the computerized detection of MN in different cohorts. Kaplan-Meier (KM) survival curves for MuNIs in the training and validation cohorts are presented in Figures 3, 4, and 5. Cohort-specific KM curves are provided in the supplemental material (Supplemental Figures 5–7). In the training set (STR) cohort, the HRs for OS and DFS were 2.09 (95% CI: 1.08–4.04, P < 0.03) and 1.50 (95% CI: 0.82–2.74, P < 0.19), respectively. In the validation set (SVA) cohort, we found that the MuNI was prognostic, showing that the patients with a high MuNI had significantly worse OS, DFS, and DMFS. The HRs in SVA were 1.92 (95% CI: 1.47–2.79, P < 0.001), 1.79 (95% CI: 1.42–2.26, P < 0.001), and 1.82 (95% CI: 1.42–2.33, P < 0.001) for OS, DFS, and DMFS, respectively. On multivariable analysis in the entire SVA cohort, controlling for relevant clinical parameters, the MuNI was independently prognostic of OS (HR: 1.94, 95% CI: 1.44–2.60, P < 0.001), DFS (HR: 1.78, 95% CI: 1.37–2.30, P < 0.001), and DMFS (HR: 1.88, 95% CI: 1.43–2.47, P < 0.001) (Table 2). Visual examples of 3 high-risk and low-risk samples identified by MuNI are shown in Supplemental Figure 10.
Table 1. HRs and P values from univariate Cox proportional hazards model analysis of DFS across 6 institutions.
Figure 3. KM DMFS curves.
KM DMFS curves for all patients in the training/validation cohorts and groups of patients at different cancer stages in the validation cohort according to the AJCC 8th edition’s definition.
Figure 4. KM DFS curves.
KM DFS curves for all patients in the training/validation cohorts and groups of patients at different cancer stages in the validation cohort according to the AJCC 8th edition’s definition.
Figure 5. KM OS curves.
KM OS curves for all patients in the training/validation cohorts and groups of patients at different cancer stages in the validation cohort according to the AJCC 8th edition’s definition. The last row presents KM OS curves for all patients in the validation cohort using an integrated classifier comprising clinical variables for predicting OS.
Table 2. HRs and P values from multivariable Cox proportional hazards model analysis of DFS across 6 institutions.
Experiment 2: association between the MuNI and OS, DFS, and DMFS in the AJCC 8th edition’s defined stage groups.
The prognostic ability of the MuNI was evaluated for patients within the AJCC 8th edition’s defined stage groups. On univariate and multivariable analyses, we found that the MuNI was prognostic for DFS, OS, and DMFS for the SVA patients with stage I and stage III tumors, respectively. The HRs for predicting DFS, OS, and DMFS on univariate analysis were 1.93 (95% CI: 1.32–2.82, P < 0.001), 1.76 (95% CI: 1.13–2.74, P < 0.01), and 1.88 (CI: 1.26–2.83, P < 0.02), respectively, for stage I tumors, and 2.29 (CI: 1.47–3.56, P <0.001), 2.31 (CI: 1.42–3.77, P < 0.02), and 2.11 (CI: 1.33–3.35, P < 0.01), respectively, for stage III tumors. For the patients with stage II tumors, the HRs for predicting DFS, OS, and DMFS on univariate analysis were 1.23 (CI: 0.81–1.87, P < 0.33), 1.59 (CI: 0.99–2.57, P < 0.06), and 1.3 (CI: 0.82–2.04, P < 0.26), respectively (Figures 3–5). The HRs for predicting DFS, OS, and DMFS on multivariable (Cox) regression, controlling for age, sex, race, smoking status, and T/N stages were 1.82 (95% CI: 1.38–2.32, P < 0.001), 1.94 (CI: 1.44–2.61, P <0.001), and 1.89 (CI: 1.44–2.50, P < 0.001), where the patients were stratified by overall tumor stage.
Experiment 3: an integrated classifier comprising the MuNI and clinical variables for predicting OS.
A Cox regression model via Lasso was trained on STR using age, sex, smoking status, TNM stage, and the MuNI to predict OS. We calculated the risk score for each patient for risk stratification. The median of the risk scores in the STR group was defined as the cutoff to dichotomize low- and high-risk patients, and the same cutoff was used in the SVA group. The HR value for predicting OS on univariate analysis was 2.42 (95% CI: 1.86–3.15, P < 0.001) for SVA (Figure 5). We conducted the same experiments using the clinical variables only, without the MuNI, and the corresponding HR was 1.43 (CI: 1.09–1.87, P < 0.01).
Experiment 4: evaluating the resilience of the MuNI against batch effects to account for site-specific preanalytic variations.
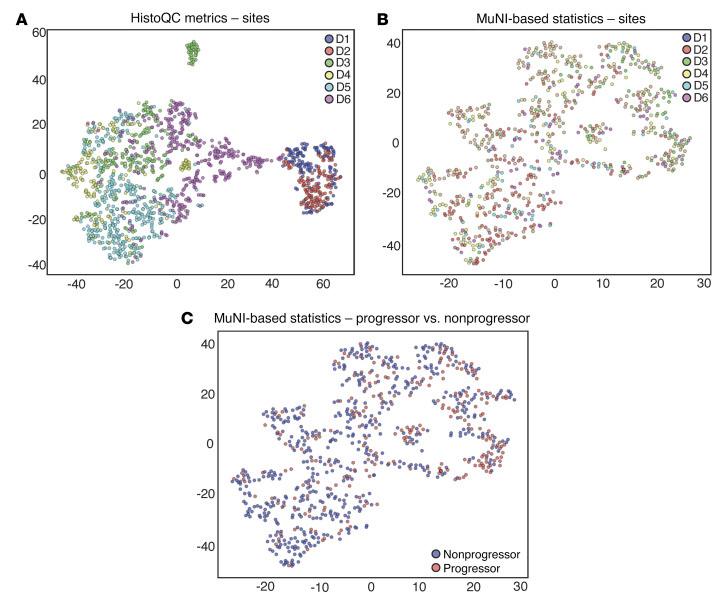
We performed qualitative analysis of the MuNI resilience against batch effects. As a baseline, for each WSI coming from any of the 6 sites, image metrics related to image brightness and contrast were calculated using HistoQC. The features were then embedded into 2D space for visualization using the t-distributed stochastic neighbor embedding (t-SNE) algorithm (Figure 6A). Likewise, we performed t-SNE mapping to calculate MuNI-specific statistics (Figure 6, B and C). We assessed a total of 8 different statistics (MuNI of the entire WSI, mean, median, SD, minimum, maximum, and 33rd–66th percentiles) for the MuNI from across every tile of the WSI.
Figure 6. Patients in the entire set were embedded into 2D feature space and then plotted using t-SNE.
The x and y axes refer to t-SNE dimensions 1 and 2, respectively. Embedment was performed using (A) low-level image features such as color and texture extracted via HistoQC and (B) the MuNI and (C) MuNI-derived metrics. Each dot represents a patient, and the dots are colored according to (A and B) the site they originated from or (C) their progressor or nonprogressor label. (A) Each site clusters separately because of the differences in patient demographics between the sites. Despite the differences, (B) no site was clustered away from the others, indicating that the MuNI-derived metrics were reproducible across sites. (C) Separation between progressor and nonprogressor patients using the MuNI metrics.
Discussion
Given the improved treatment response of patients with p16+ OPSCC, concerted efforts have been directed toward developing precision oncology approaches that include targeted de-intensification of radiation and chemotherapy doses and regimens (21, 22). However, the unpredictable clinical behavior of p16+ OPSCC results in a significant risk that some patients will be over- or undertreated. The majority of patients with p16+ OPSCC are cured with current treatments, which include primary radiation, primary chemoradiation, or primary surgery with or without adjuvant radiation or chemoradiation. However, these patients experience substantial toxicity and morbidity from these therapies. Consequently, there is a clear need to develop a quantifiable and reproducible biomarker to stratify high- and low-risk patients with p16+ OPSCC (23). Low-risk patients might then potentially benefit from therapy de-intensification, whereas high-risk patients would continue standard or intensified management.
Lewis et al. previously identified anaplasia and MN as novel prognostic features in patients with p16+ OPSCC (19). These were strongly and independently associated with disease recurrence and death from the disease and also correlated with DFS in a cohort of surgically treated patients with OPSCC (n = 149). However, identification of the above-mentioned morphologic features is pathologist dependent, and, although no specific study in the literature documents it, implies subjectivity and potential bias (24). We found specific examples difficult to discern and quantify, such as overlapping nuclei from separate cells that were not truly multinucleated and large, anaplastic, irregular nuclei that were also not truly multinucleated. Additionally, the study was performed at a single institution in a cohort of only surgically treated patients, for whom all slides of resected tumor, including lymph node metastases, were reviewed. Interestingly, in this study, the pathologist’s quantification of MNs on the single H&E-stained slides for 478 patients with p16+ OPSCC was not found to be prognostic for the other institutions’ cohorts (Supplemental Method 3), probably because of undersampling of the phenomenon on just a representative tumor slide.
The computerized MuNI presented in this work focused on addressing the issues related to tumor sampling and to subjectivity and inter-reader variability in MN interpretation. More critically, though, the MuNI is an independent prognostic marker of major clinical outcomes, OS, DFS, and DMFS. We validated the MuNI in a set of 1094 patients from 6 different institutions and found it to be strongly associated with DFS, OS, and DMFS. We identified a strong association between the predictions of the MuNI and OS, DFS, as well as DMFS among the AJCC 8th edition’s defined stage I and stage III patients in both univariate and multivariable analyses. If confirmed in a prospective clinical trial setting, we believe this finding could have major implications for clinical practice. Patients with stage I disease, currently the target of de-escalation treatment strategies, could be further stratified using the MuNI to exclude those who might have a high chance of treatment failure resulting in recurrence (25). Although multiple clinical trials are currently exploring therapeutic de-intensification strategies, they are limited by a dependence on clinical parameters to identify appropriate patients at low risk of disease recurrence (12). The identification of biologically meaningful markers of a good prognosis is of critical importance. Similarly, patients with stage III disease who are further categorized as high risk by the MuNI may merit the maintenance of treatment intensity by incorporating surgical resection, consistently utilizing concurrent chemotherapy, or intensifying chemoradiotherapy. Taken together, this would represent a novel, viable precision oncology approach to treating patients with p16+ OPSCC in the modern era.
In spite of the differences in clinical and pathological data between the sites (Supplemental Table 1), the MuNI was prognostic across the different sites using a single threshold cutoff learned from a single site, although with modest HRs for death. In Figure 6, the t-SNE of low-level image features such as color and texture extracted via HistoQC shows that each site clustered separately, indicating a large batch effect. On the other hand, the t-SNE using MuNI-specific statistics showed that slides from different sites were interspersed with one another, reflecting the resilience of the MuNI against site-specific preanalytic variations and batch effects. Additionally, as illustrated in Figure 6C, the MuNI was also able to enrich for patients who would develop tumor progression (progressors) versus those who would not (nonprogressors). MuNIs for the progressor group were also found to be statistically and significantly larger than those for the nonprogressor group (Supplemental Figure 8).
Quantitative histomorphometric (QH) approaches for the prognostication of disease outcomes have been previously proposed for many cancers. These approaches fall into 2 major categories: hand-crafted (or domain-inspired) and deep-learning– or neural network–based approaches. We have previously introduced 2 hand-crafted–based approaches, OHbIC (26) and QuHbIC (27), to stratify the risk of patients with head and neck carcinomas using H&E-stained tumor microarrays (TMAs). The first study showed the independent prognostic value of OHbIC, which utilizes nuclear shape and texture features for predicting disease-specific survival, in a cohort (n = 115) of patients with oral cavity squamous cell carcinoma (SCC). The latter showed that QuHbIC could predict the risk of recurrence in a cohort (n = 160) of patients with p16+ OPSCC by quantizing the spatial distribution of cell clusters. A second class of approaches of neural network–based deep-learning classifiers have become popular for cancer detection (28), diagnosis (29, 30), and prognosis (31). Bulten et al. presented a grading system for prostate biopsies using deep-learning models and evaluated its performance in a set of 550 biopsies (29). Skrede et al. trained multiple deep-learning models at different magnifications and fused their output to predict the prognosis for colorectal cancer (n = 2042) (31). These approaches utilize deep networks to learn best representations for predicting prognosis categories of interest without requiring a pathologist’s input. However, because of the multilayered, nonlinear structure of deep-learning models, they are considered black boxes, and their output is not interpretable by pathologists or translatable into any directly visual form. Interestingly, unlike these models, the method presented here utilizes the power of deep learning with the interpretability of hand-crafted (i.e., visually identified) features. In other words, deep learning was used not to make a direct prognostic prediction but rather to quantify MNs in WSIs and derive a prognostic metric based on the number of MNs identified on the WSIs. As demonstrated in experiment 4, the hybrid approach to identify a computational pathology–based biomarker was found to be resilient against batch effects.
Our study has some limitations. The cohorts from different institutions were found to have significant differences in their MuNIs, as well as in certain clinical and pathologic parameters (Supplemental Table 1 and Supplemental Figure 9). Nonetheless, we found that the MuNI was prognostic for the entire set of validation cohorts in both univariate and multivariable analyses, although it was not consistently prognostic for each of the separate cohorts. A possible explanation could be related to MN segmentation performance resulting in variants in the generated MuNIs across the different cohorts. Further evaluation of the sensitivity of the MuNI segmentation across sites is necessary. The MuNI was most strongly prognostic of outcomes in patients with stage III disease. This could be related to the number of patients within each stage. Since stage I and II patients had much better survival outcomes, irrespective of MN, it was more challenging to identify a difference between the high- and low-risk patients in these groups. A modest difference between the high- and low-risk groups could be observed among patients with stage I disease, since there were 471 patients, whereas in the group with stage II disease, which included 245 patients, that difference was not apparent. In the group of patients with stage III disease, whose overall prognosis was much worse, we could detect the difference, even though there were only 169 patients. Finally, this study was based on retrospectively collected data. Analyses of slides from completed multi-institutional, prospective clinical trials, or better yet, a prospective clinical trial with the MuNI embedded within it, are required to validate the findings, minimize the potential for bias, and determine whether the MuNI can specifically predict a patient’s response to treatment.
In conclusion, the MuNI is a tissue-nondestructive, reproducible, rapid, and cost-efficient artificial intelligence–enabled (AI-enabled) biomarker with the potential to risk-stratify patients with p16+ OPSCC. The MuNI only relies on the quantitative measurement of MN tumor cells in digitized H&E-stained tissue from primary tumors, without the need for visual or manual segmentation of tumor versus nontumor regions. These specimens are already consistently obtained from patients with OPSCC in routine practice. This makes the MuNI potentially widely introducible into clinical practice at US institutions and useful in low- and middle-income countries, where the costs associated with genomics-based tests make them difficult to adopt and implement. Given that the MuNI is tissue nondestructive, further validation in retrospective clinical trials or prospective validation could make it a useful biomarker to guide the treatment of p16+ OPSCC.
Methods
Patient selection
H&E-stained slides from oropharyngeal primary tumors were reviewed by pathologists at the respective institutions to confirm the diagnosis of OPSCC. Immunochemistry for p16 had been performed at the respective institutions in routine clinical practice, and only those tumor specimens that were classified as p16+ by nationally accepted pathologic standards (extensive nuclear and cytoplasmic staining present in 70% or more of the tumor specimen with at least moderate to strong intensity) were included (32). H&E-stained glass slides from the primary tumors of each patient were re-reviewed by the collaborating pathologists for the selection of the most representative tumor slide. If the patient was treated with primary surgery, this slide was from the resection specimen or, if treated with primary (chemo)radiation, then the best representative biopsy slides were selected.
Data set preparation
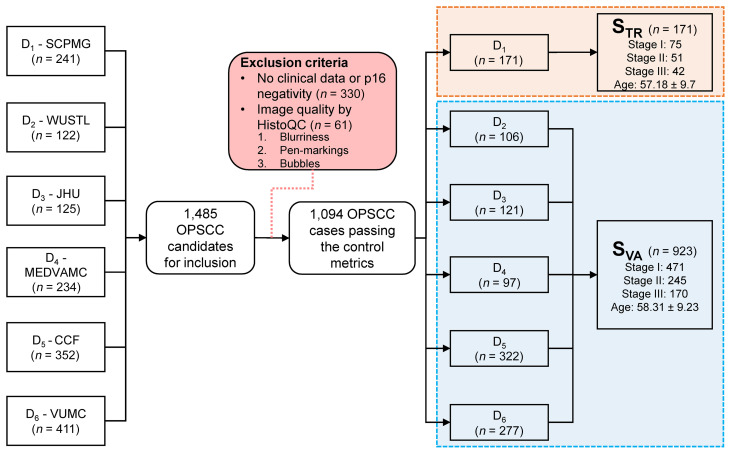
Data on a total of 1485 patients with OPSCC were collected from the 6 institutions. For simplicity, each institution was labeled Di, where i corresponds to the index of the site of origin. After reviewing the clinical data and p16 status, 391 of the patients were excluded from the study, 330 of whom were excluded because of their negative or equivocal p16 status or missing follow-up data (Figure 7). Slides were sent to Case Western Reserve University, where they underwent WSI scanning at ×40 resolution (0.25 μm/pixel resolution) using a Ventana iScan HT slide scanner. WSI quality checking was performed using HistoQC (33), an automatic, rapid, and quantifiable quality control tool for computational pathology that excluded an additional 61 patients’ specimens because of poor image quality. Finally, 1094 specimens remained for the analysis. The patients were divided into training and validation sets, STR and SVA, respectively. D1 comprised STR (n = 171), which was used to build the segmentation models and to define the cutoff threshold for risk stratification. SVA (n = 923) was used for independent validation of the prognostic ability of the MuNI (D2 = 106, D3 = 121, D4 = 97, D5 = 322, D6 = 277).
Figure 7. Inclusion and exclusion criteria for the study.
Data on a total of 1485 patients with OPSCC were gathered from the 6 institutions. After reviewing the clinical data and WSI image quality, 391 of the patients were excluded. A total of 1094 specimens remained for the analysis. SCPMG, Southern California Permanente Medical Group; WUSTL, Washington University in St. Louis; JHU, Johns Hopkins University; MEDVAMC, Michael E. DeBakey VA Medical Center; CCF, Cleveland Clinic Foundation; VUMC, Vanderbilt University Medical Center.
Tissue morphology analysis
The first step in calculating the MuNI was to automatically segment the WSI into EP and stromal regions, since MN is normalized by the total number of cancer cells identified within the EP. The segmentation was performed by means of a cGAN (20). The EP segmentation model (GANEP) was built and evaluated using a set of 6 cases from STR. A total of 153 image patches, each corresponding to 512 × 512 pixels, were cropped at ×10 magnification and then annotated by a pathologist. Of these, 102 were used for training GANEP. Its performance was then evaluated quantitatively on the remaining 51 images and yielded a pixel-level F1 score of 0.88.
Automated detection and segmentation of MN
MNs were segmented using another cGAN model (GANMN) that involved 2 steps. Training of the GANMN for nuclei segmentation was done using 30 images from a public data set corresponding to multiple organs (34). Patches of 256 × 256 pixels were extracted from these images at ×40 magnification and fed into the model during training. Segmentation performance was quantitatively and qualitatively verified to be suitable for MN segmentation. For independent validation of GANMN, another publicly available data set corresponding to patients with triple-negative breast cancer was used (35). The pixel-level F1 score of GANMN was 0.93 for this public data set.
In the second phase, GANMN was trained to detect any cells, independent of the cell type, and was subsequently fine-tuned for the differentiation of MNs from other cell types such as EP cells and lymphocytes. MNs were annotated by a collaborating pathologist using 12 WSIs from STR, which resulted in 1002 annotations. Nine WSIs with a total of 668 MNs were used for model training and the remaining 334 MNs for validation. The MN segmentation model yielded a pixel-level F1 score of 0.76 for the validation images. An empirically defined size threshold was used to identify and eliminate false-positive MN exemplars, given that MNs are typically larger compared with EP cells and lymphocytes. A detailed description of the network architecture and validation of GANMN is provided in the supplemental material (Supplemental Method 1).
MuNI
Utilizing GANEP and GANMN, EP and MN masks were extracted for each WSI. For a WSI, m was used to denote the number of tiles extracted from the WSI and  and
and  corresponded to the number of detected MNs and EP cells in tile i extracted from the WSI, respectively. The normalized MuNI for the WSI was then defined as the ratio of total MNs to EP cells.
 Equation 1
Additionally, different variants of the MuNI were also analyzed in terms of their prognostic ability. Further details are provided in the supplemental material (Supplemental Method 2).
Learning cutoff for the MuNI for the stratification of patients with high- or low-risk p16+ OPSCC.
The MuNI is a continuous variable, necessitating a cutoff to stratify patients into low- and high-risk categories. A cutoff was determined as the mean value of MuNIs within the modeling set STR and then applied to SVA to obtain dichotomized MuNIs.
Statistics
The similarity of clinical and pathologic variables between different institutional cohorts was calculated using ANOVA. Associations between the dichotomized MuNIs and the other categorical clinical and pathologic variables were determined by a 2-sided Fisher’s exact test. KM survival curves and univariate log-rank tests were applied to correlate DFS, OS, and DMFS with the MuNI. Multivariable Cox proportional hazards models were also used to investigate the independent prognostic ability of MuNI for DFS, OS, and DMFS after accounting for age, sex, race, smoking status, treatment type, and T/N categories. The same univariate and multivariable analyses were further performed for each cancer stage group defined by the AJCC’s 8th edition. The prognostic power of the MuNI, together with other clinical variables, was analyzed using Cox regression via Lasso. HRs associated with 95% CIs and P values from Wald tests were reported. All tests were 2 tailed, with the significance level set at 0.05.
Study approval
The present studies in humans were reviewed and approved by the IRBs of Washington University in St. Louis, Missouri, USA, Johns Hopkins University in Baltimore, Maryland, USA, Vanderbilt University Medical Center in Nashville, Tennessee, USA, the Cleveland Clinic Foundation in Cleveland, Ohio, USA, Case Western Reserve University in Cleveland, Ohio, USA, the Southern California Permanente Medical Group in Los Angeles, California, USA, and the Michael E. DeBakey VA Medical Center in Houston, Texas, USA.
Author contributions
CFK and CL contributed to the methodology, experiments, and writing of the manuscript. ZZ and JX contributed to the methodology and reviewed the manuscript. KB, PAT, GC, and PF helped review the manuscript. DC, WLT, FF, JAB, MM, PDC, AGS, LDRT, RDC, KALK, JL, VS, DJA, and SK contributed to data collection and reviewed the manuscript. JSL and AM contributed to the methodology, experiments, and writing of the manuscript.
Supplementary Material
Acknowledgments
This work was supported by the NCI, NIH (1U24CA199374-01, R01CA202752-01A, R01CA208236-01A1, R01CA216579-01A1, R01CA220581-01A1, 1U01CA239055-01); the National Institute for Biomedical Imaging and Bioengineering, NIH (1R43EB028736-01); the National Center for Research Resources, NIH (1C06RR12463-01); a VA Merit Review Award (IBX004121A) from the US Department of VA Biomedical Laboratory Research and Development Service; a US DOD Breast Cancer Research Program Breakthrough Level 1 Award (W81XWH-19-1-0668); a US DOD Prostate Cancer Idea Development Award (W81XWH-15-1-0558); a US DOD Lung Cancer Investigator-Initiated Translational Research Award (W81XWH-18-1-0440); the US DOD Peer Reviewed Cancer Research Program (W81XWH-16-1-0329); the Ohio Third Frontier Technology Validation Fund; the Wallace H. Coulter Foundation Program in the Department of Biomedical Engineering; a CTSA award to Case Western Reserve University; NCI Cancer Center Support Grant P30CA125123, NIH; Career Development Award 1 IK2 CX001953 from the US Department of VA Clinical Sciences Research and Development Program; Dan L. Duncan Comprehensive Cancer Center Support Grant (NCI-CA125123), NIH; and the Computational Genomic Epidemiology of Cancer Program at Case Comprehensive Cancer Center (T32CA094186). The content is solely the responsibility of the authors and does not necessarily represent the official views of the NIH, the US Department of VA, the DOD, or the US Government.
Version 1. 03/02/2021
In-Press Preview
Version 2. 04/15/2021
Electronic publication
Version 3. 04/26/2021
Spelled out Farhoud Faraji in author list
Funding Statement
This work was supported by the National Cancer Institute of the National Institutes of Health (under award numbers 1U24CA199374-01, R01CA202752-01A, R01CA208236-01A1, R01 CA216579-01A1, R01 CA220581-01A1, 1U01 CA239055-01), the National Institute for Biomedical Imaging and Bioengineering (1R43EB028736-01), the National Center for Research Resources (1 C06 RR12463-01), the VA Merit Review Award (IBX004121A) from the United States Department of Veterans Affairs Biomedical Laboratory Research and Development Service, the DoD Breast Cancer Research Program Breakthrough Level 1 Award (W81XWH-19-1-0668), the DOD Prostate Cancer Idea Development Award (W81XWH-15-1-0558), the DOD Lung Cancer Investigator-Initiated Translational Research Award (W81XWH-18-1-0440), the DOD Peer Reviewed Cancer Research Program (W81XWH-16-1-0329), the Ohio Third Frontier Technology Validation Fund, the Wallace H. Coulter Foundation Program in the Department of Biomedical Engineering, and the Clinical and Translational Science Award Program (CTSA) at Case Western Reserve University and Dan L Duncan Comprehensive Cancer Center Support Grant (NCI-CA125123). The content is solely the responsibility of the authors and does not necessarily represent the official views of the National Institutes of Health, the U.S. Department of Veterans Affairs, the Department of Defense, or the United States Government.
Footnotes
Conflict of interest: AM is an equity holder in Elucid Bioimaging and in Inspirata Inc. In addition, he has served as a scientific advisory board member for Inspirata Inc, AstraZeneca, Bristol Myers Squibb, and Merck. Currently he serves on the advisory board of Aiforia Inc. He also has sponsored research agreements with Philips and Bristol Myers Squibb. His technology has been licensed to Elucid Bioimaging. He is also involved in a NIH U24 grant with Pathcore Inc and 3 R01 grants with Inspirata Inc. SK is a consultant for Merck and Regeneron Pharmaceuticals Inc, he has sponsored research agreements with Bristol Myers Squibb and Merck, and he receives honoraria from UpToDate.
Copyright: © 2021, American Society for Clinical Investigation.
Reference information: J Clin Invest. 2021;131(8):e145488. https://doi.org/10.1172/JCI145488.
See the related Commentary at Artificial intelligence for automating the measurement of histologic image biomarkers.
Contributor Information
Can F. Koyuncu, Email: cfk29@case.edu.
Cheng Lu, Email: cxl884@case.edu.
Kaustav Bera, Email: kxb413@case.edu.
Zelin Zhang, Email: zxz833@case.edu.
Jun Xu, Email: jxx108@case.edu.
Deborah Chute, Email: chuted@ccf.org.
Pingfu Fu, Email: pxf16@case.edu.
Wade L. Thorstad, Email: thorstad@wustl.edu.
Justin A. Bishop, Email: Justin.Bishop@UTSouthwestern.edu.
Mitra Mehrad, Email: mitra.mehrad@vumc.org.
Patricia D. Castro, Email: pcastro@bcm.edu.
Andrew G. Sikora, Email: AGSikora@mdanderson.org.
Krystle A. Lang Kuhs, Email: Krystle.kuhs@vumc.org.
Jingqin Luo, Email: jingqinluo@wustl.edu.
David J. Adelstein, Email: ADELSTD@ccf.org.
Shlomo Koyfman, Email: KOYFMAS@ccf.org.
James S. Lewis, Jr., Email: james.lewis@vumc.org.
Anant Madabhushi, Email: anant.madabhushi@case.edu.
References
- 1.Gillison ML, et al. Epidemiology of human papillomavirus–positive head and neck squamous cell carcinoma. J Clin Oncol. 2015;33(29):3235–3242. doi: 10.1200/JCO.2015.61.6995. [DOI] [PMC free article] [PubMed] [Google Scholar]
- 2.Chaturvedi AK, et al. Human papillomavirus and rising oropharyngeal cancer incidence in the United States. J Clin Oncol. 2011;29(32):4294–4301. doi: 10.1200/JCO.2011.36.4596. [DOI] [PMC free article] [PubMed] [Google Scholar]
- 3. O’Sullivan B. HPV-mediated (p16+) oropharyngeal cancer. In: Greene FL, et al., eds. AJCC Cancer Staging Manual. Springer; 2017:113–121. [Google Scholar]
- 4.Ang KK, et al. Human papillomavirus and survival of patients with oropharyngeal cancer. N Engl J Med. 2010;363(1):24–35. doi: 10.1056/NEJMoa0912217. [DOI] [PMC free article] [PubMed] [Google Scholar]
- 5.O’Sullivan B, et al. Development and validation of a staging system for HPV-related oropharyngeal cancer by the International Collaboration on Oropharyngeal cancer Network for Staging (ICON-S): a multicentre cohort study. Lancet Oncol. 2016;17(4):440–451. doi: 10.1016/S1470-2045(15)00560-4. [DOI] [PubMed] [Google Scholar]
- 6.Benson E, et al. The clinical impact of HPV tumor status upon head and neck squamous cell carcinomas. Oral Oncol. 2014;50(6):565–574. doi: 10.1016/j.oraloncology.2013.09.008. [DOI] [PMC free article] [PubMed] [Google Scholar]
- 7.Machczyński P, et al. A review of the 8th edition of the AJCC staging system for oropharyngeal cancer according to HPV status. Eur Arch Otorhinolaryngol. 2020;277(9):2407–2412. doi: 10.1007/s00405-020-05979-9. [DOI] [PMC free article] [PubMed] [Google Scholar]
- 8.Wuerdemann N, et al. Risk factors for overall survival outcome in surgically treated human papillomavirus-negative and positive patients with oropharyngeal cancer. Oncol Res Treat. 2017;40(6):320–327. doi: 10.1159/000477097. [DOI] [PubMed] [Google Scholar]
- 9.Gupta P, et al. Validation and assessment of discordance of the 8th edition AJCC (American Joint Committee on Cancer) clinical and pathologic staging systems in patients with p16+ oropharyngeal cancer treated with surgery and adjuvant radiation at a single institution. Oral Oncol. 2018;83:140–146. doi: 10.1016/j.oraloncology.2018.06.024. [DOI] [PMC free article] [PubMed] [Google Scholar]
- 10.van Gysen K, et al. Validation of the 8th edition UICC/AJCC TNM staging system for HPV associated oropharyngeal cancer patients managed with contemporary chemo-radiotherapy. BMC Cancer. 2019;19(1):674. doi: 10.1186/s12885-019-5894-8. [DOI] [PMC free article] [PubMed] [Google Scholar]
- 11.Verma G, et al. Characterization of key transcription factors as molecular signatures of HPV-positive and HPV-negative oral cancers. Cancer Med. 2017;6(3):591–604. doi: 10.1002/cam4.983. [DOI] [PMC free article] [PubMed] [Google Scholar]
- 12.Balermpas P, et al. Tumor-infiltrating lymphocytes favor the response to chemoradiotherapy of head and neck cancer. Oncoimmunology. 2014;3(1):e27403. doi: 10.4161/onci.27403. [DOI] [PMC free article] [PubMed] [Google Scholar]
- 13.Mizumachi T, et al. Confirmation of the eighth edition of the AJCC/UICC TNM staging system for HPV-mediated oropharyngeal cancer in Japan. Int J Clin Oncol. 2017;22(4):682–689. doi: 10.1007/s10147-017-1107-0. [DOI] [PubMed] [Google Scholar]
- 14.Würdemann N, et al. Prognostic impact of AJCC/UICC 8th edition new staging rules in oropharyngeal squamous cell carcinoma. Front Oncol. 2017;7:129. doi: 10.3389/fonc.2017.00129. [DOI] [PMC free article] [PubMed] [Google Scholar]
- 15.Ali S, et al. Selective invocation of shape priors for deformable segmentation and morphologic classification of prostate cancer tissue microarrays. Comput Med Imaging Graph. 2015;41:3–13. doi: 10.1016/j.compmedimag.2014.11.001. [DOI] [PMC free article] [PubMed] [Google Scholar]
- 16.Lee G, et al. Nuclear shape and architecture in benign fields predict biochemical recurrence in prostate cancer patients following radical prostatectomy: preliminary findings. Eur Urol Focus. 2017;3(4–5):457–466. doi: 10.1016/j.euf.2016.05.009. [DOI] [PMC free article] [PubMed] [Google Scholar]
- 17.Gurcan MN, et al. Histopathological image analysis: a review. IEEE Rev Biomed Eng. 2009;2:147–171. doi: 10.1109/RBME.2009.2034865. [DOI] [PMC free article] [PubMed] [Google Scholar]
- 18.Hartman DJ, et al. Utility of CD8 score by automated quantitative image analysis in head and neck squamous cell carcinoma. Oral Oncol. 2018;86:278–287. doi: 10.1016/j.oraloncology.2018.10.005. [DOI] [PMC free article] [PubMed] [Google Scholar]
- 19.Lewis JS, et al. Tumor cell anaplasia and multinucleation are predictors of disease recurrence in oropharyngeal squamous cell carcinoma, including among just the human papillomavirus-related cancers. Am J Surg Pathol. 2012;36(7):1036–1046. doi: 10.1097/PAS.0b013e3182583678. [DOI] [PMC free article] [PubMed] [Google Scholar]
- 20.Mahmood F, et al. Deep adversarial training for multi-organ nuclei segmentation in histopathology images. IEEE Trans Med Imaging. 2020;39(11):3257–3267. doi: 10.1109/TMI.2019.2927182. [DOI] [PMC free article] [PubMed] [Google Scholar]
- 21.Adelstein DJ, et al. Role of treatment deintensification in the management of p16+ oropharyngeal cancer: ASCO provisional clinical opinion. J Clin Oncol. 2019;37(18):1578–1589. doi: 10.1200/JCO.19.00441. [DOI] [PubMed] [Google Scholar]
- 22.Contreras JA, et al. Eliminating postoperative radiation to the pathologically node-negative neck: long-term results of a prospective phase II study. J Clin Oncol. 2019;37(28):2548–2555. doi: 10.1200/JCO.19.00186. [DOI] [PubMed] [Google Scholar]
- 23.Eze N, et al. Biomarker driven treatment of head and neck squamous cell cancer. Cancers Head Neck. 2017;2:6. doi: 10.1186/s41199-017-0025-1. [DOI] [PMC free article] [PubMed] [Google Scholar]
- 24.Ranganathan K, et al. Intra-observer and inter-observer variability in two grading systems for oral epithelial dysplasia: a multi-centre study in India. J Oral Pathol Med. 2020;49(9):984–955. doi: 10.1111/jop.13056. [DOI] [PubMed] [Google Scholar]
- 25.Ma DJ, et al. Phase II evaluation of aggressive dose de-escalation for adjuvant chemoradiotherapy in human papillomavirus–associated oropharynx squamous cell carcinoma. J Clin Oncol. 2019;37(22):1909–1918. doi: 10.1200/JCO.19.00463. [DOI] [PMC free article] [PubMed] [Google Scholar]
- 26.Lu C, et al. An oral cavity squamous cell carcinoma quantitative histomorphometric-based image classifier of nuclear morphology can risk stratify patients for disease-specific survival. Mod Pathol. 2017;30(12):1655–1665. doi: 10.1038/modpathol.2017.98. [DOI] [PMC free article] [PubMed] [Google Scholar]
- 27.Lewis JS, et al. A quantitative histomorphometric classifier (QuHbIC) identifies aggressive versus indolent p16-positive oropharyngeal squamous cell carcinoma. Am J Surg Pathol. 2014;38(1):128–137. doi: 10.1097/PAS.0000000000000086. [DOI] [PMC free article] [PubMed] [Google Scholar]
- 28.Bera K, et al. Artificial intelligence in digital pathology — new tools for diagnosis and precision oncology. Nat Rev Clin Oncol. 2019;16(11):703–715. doi: 10.1038/s41571-019-0252-y. [DOI] [PMC free article] [PubMed] [Google Scholar]
- 29.Bulten W, et al. Automated deep-learning system for Gleason grading of prostate cancer using biopsies: a diagnostic study. Lancet Oncol. 2020;21(2):233–241. doi: 10.1016/S1470-2045(19)30739-9. [DOI] [PubMed] [Google Scholar]
- 30.Ström P, et al. Artificial intelligence for diagnosis and grading of prostate cancer in biopsies: a population-based, diagnostic study. Lancet Oncol. 2020;21(2):222–232. doi: 10.1016/S1470-2045(19)30738-7. [DOI] [PubMed] [Google Scholar]
- 31.Skrede OJ, et al. Deep learning for prediction of colorectal cancer outcome: a discovery and validation study. Lancet. 2020;395(10221):350–360. doi: 10.1016/S0140-6736(19)32998-8. [DOI] [PubMed] [Google Scholar]
- 32.Begum S, et al. Detection of human papillomavirus in cervical lymph nodes: a highly effective strategy for localizing site of tumor origin. Clin Cancer Res Off J Am Assoc Cancer Res. 2003;9(17):6469–6475. [PubMed] [Google Scholar]
- 33.Janowczyk A, et al. HistoQC: an open-source quality control tool for digital pathology slides. JCO Clin Cancer Inform. 2019;3:1–7. doi: 10.1200/CCI.18.00157. [DOI] [PMC free article] [PubMed] [Google Scholar]
- 34.Kumar N, et al. A dataset and a technique for generalized nuclear segmentation for computational pathology. IEEE Trans Med Imaging. 2017;36(7):1550–1560. doi: 10.1109/TMI.2017.2677499. [DOI] [PubMed] [Google Scholar]
- 35.Naylor P, et al. Segmentation of nuclei in histopathology images by deep regression of the distance map. IEEE Trans Med Imaging. 2019;38(2):448–459. doi: 10.1109/TMI.2018.2865709. [DOI] [PubMed] [Google Scholar]
Associated Data
This section collects any data citations, data availability statements, or supplementary materials included in this article.


