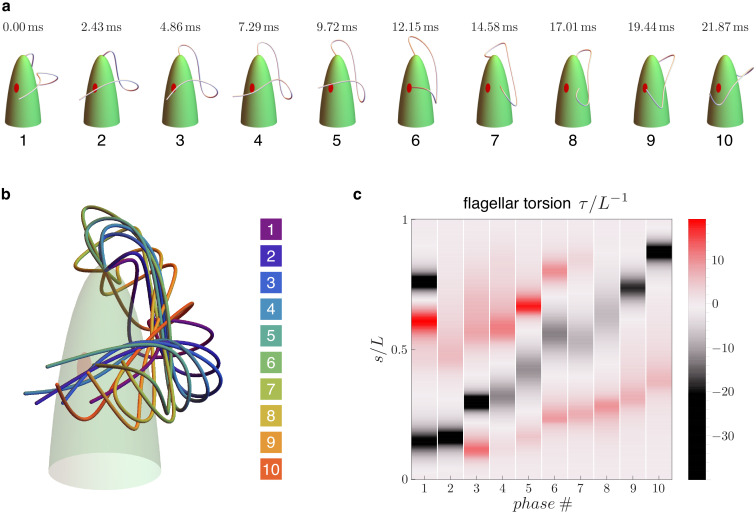
Figure 2. Flagellar beat kinematics of freely swimming Euglena gracilis.
(a) flagellar configurations in evenly spaced instants (phases) within a periodic beat. (b) The same configurations overlapped and color coded according to their phases. (c) Computed torsion as a function of the flagellar arc length . The plot is presented in terms of the normalized quantities and , where is the total length of the flagellum. Panels (a-b) are adapted from Figure 5.E of Rossi et al., 2017.

