Abstract
Brown adipose tissue (BAT) and beige fat function in energy expenditure in part due to their role in thermoregulation, making these tissues attractive targets for treating obesity and metabolic disorders. While prolonged cold exposure promotes de novo recruitment of brown adipocytes, the exact sources of cold-induced thermogenic adipocytes are not completely understood. Here, we identify Trpv1-positive vascular smooth muscle (VSM) cells as previously unidentified brown adipocyte progenitors. Analysis of single-cell RNA sequencing from interscapular brown adipose depots reveals, in addition to the previously-known Pdgfra-expressing mesenchymal progenitors, a previously-unidentified VSM-derived adipocyte progenitor (APC) population, which expresses the temperature-sensitive cation channel, Trpv1. Using flow cytometry and lineage tracing, we demonstrate that the Trpv1-positive VSM-APCs are distinct from the Pdgfra-positive progenitors, and can give rise to thermogenic adipocytes in response to cold. Together, these findings illustrate the landscape of the thermogenic adipose niche at the single cell resolution and identify a new cellular origin for the development of brown and beige adipocytes.
Introduction
Brown adipose tissue (BAT) and related beige fat are specialized for energy expenditure, and thus the classical brown and inducible beige adipocytes are collectively called thermogenic adipocytes. Considering the immense capacity of BAT for energy expenditure and its role in fatty acid and glucose metabolism, strategies leading to increased mass or enhanced activity of BAT can potentially be utilized to combat obesity and its sequelae1. The main cell type in adipose tissue that stores or consumes energy is the mature adipocyte. Because mature adipocytes are postmitotic, tissue expansion requires proliferation and differentiation of adipocyte precursor cells to form new mature adipocytes both during development and throughout life2. In addition to mature adipocytes, adipose tissue is composed of adipocyte progenitors, vascular cells, immune cells, neurons, and other cell types that form the stromal vascular fraction (SVF) of adipose tissue. Although adipocytes play the major role in maintaining energy balance, cells in the SVF form the adipocyte niche and regulate adipose tissue function. The orchestrated function of cells in the adipose niche is essential for maintaining tissue homeostasis and metabolic health3,4.
During development in mice, mature adipocytes in classical BAT arise almost exclusively from precursor cells in the dermomyotome that are defined by expression of the transcription factor Pax3/7 and myogenic factor 5 (Myf5)5-7. This is in contrast to different white adipose tissue depots, where the majority of mature adipocytes arise from cells that lack expression of Myf58. During adulthood, adipose depots undergo dynamic remodeling in response to environmental stimuli such as nutritional load and temperature9,10. In rodents, prolonged cold exposure increases BAT activity by enhancing the thermogenic capacity of pre-existing brown adipocytes and inducing de novo recruitment of brown adipocytes from the adipose niche in the SVF2,11,12. A previous study using the Platelet derived growth factor receptor alpha (Pdgfrα) reporter mouse model revealed the contribution of Pdgfrα-expressing adipocyte progenitor cells (Sca1pos Pdgfrαpos APCs) to de novo brown adipogenesis in the first week of cold acclimation13. Lee et al. showed that cold triggers the proliferation of Pdgfrαpos APCs followed by the induction of brown adipogenesis. Additionally, it has demonstrated that APCs expressing smooth muscle lineage markers, such as Acta2 (αSMA) and Myh11, can differentiate into beige, but not brown adipocytes14,15.
The present study reveals a cellular origin of thermogenic brown adipocytes which is distinct from the previously identified APCs. Using unbiased single-cell RNA-sequencing (scRNA-seq) analyses, we unravel a high degree of heterogeneity of vascular smooth muscle (VSM) and the critical contribution of VSM to cold-induced brown adipogenesis. Importantly, we identify the expression of transient receptor potential cation channel subfamily V member 1 (Trpv1) as a specific characteristic of VSM-derived APCs. Trpv1 is a heat-activated ion channel predominantly expressed in afferent sensory neurons in the dermal and epidermal layers of the skin, the oral and nasal mucosa, joints, sensory ganglia, and a few discrete brain regions16,17. Trpv1pos neurons play important roles in nociception and thermosensation17,18. Lineage tracing experiments reveal the contribution of Trpv1pos VSM-APCs to brown adipogenesis and establish these cells as a previously unknown source of de novo brown adipocyte recruitment in response to cold. Brown adipocytes originated from Trpv1pos APCs express higher levels of thermogenic genes compared with those derived from Trpv1neg lineage. Additionally, Trpv1pos VSM-APCs give rise to beige adipocytes in inguinal white adipose tissue (ingWAT) of mice in cold. These results suggest a cell source for thermogenic adipocytes that could be used to design therapeutic strategies to increase the number of thermogenic adipocytes to combat obesity, diabetes, and related metabolic disorders.
Results
scRNA-seq provides a cellular map of brown adipose niche
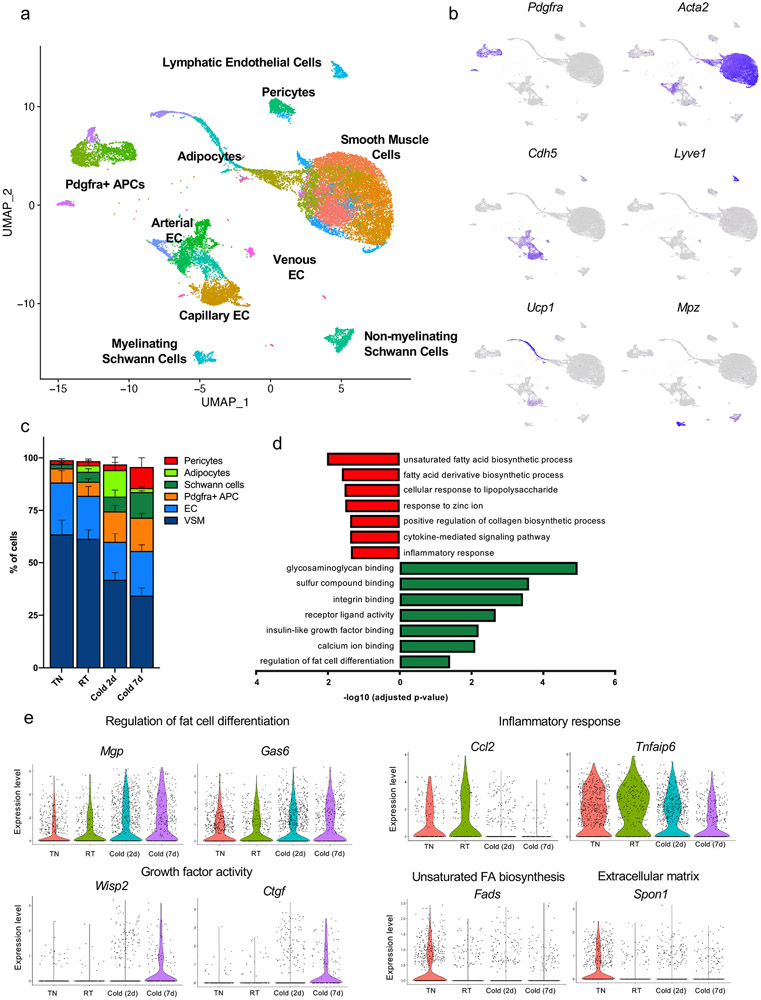
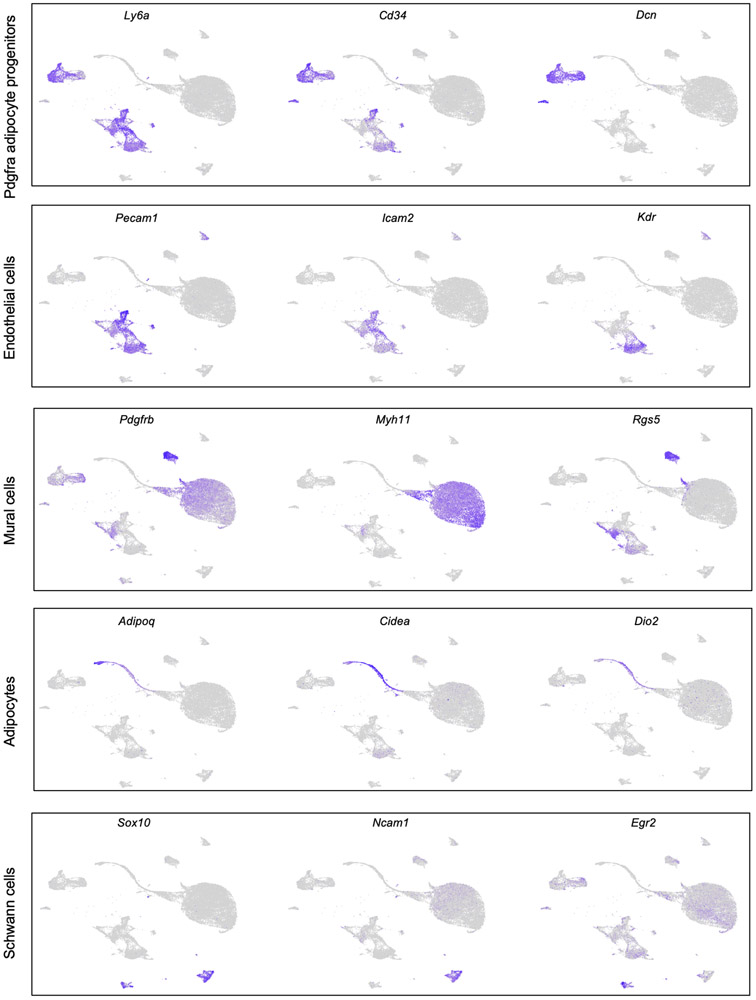
To characterize the cellular composition of the BAT niche during cold-induced remodeling, we applied scRNA-seq to cells isolated from the stromal vascular fraction of BAT (BAT-SVF) from mice housed at either thermoneutral (TN: 30 °C for 1 week), room temperature (RT: 22 °C) or cold (5 °C for 2 days or 7 days). We sequenced 105,228 high-quality cells including both hematopoietic lineage positive and negative cells. Using a graph-based approach (Seurat)19, we assigned the cells into different clusters based on their gene expression similarities, then used known cell identity markers to identify specific cell types. After removal of all hematopoietic lineage positive cells followed by re-clustering of 24,498 non-hematopoietic cells and visualizing of the clusters using Uniform Manifold Approximation and Projection (UMAP) method20, we identified eight major non-immune cell types present in BAT (Figure 1a and Supplementary Data 1). This unsupervised clustering of gene expression profiles also revealed the heterogeneity within each cell type, illustrated by the presence of multiple distinct clusters for each cell type. Using a combination of known markers, we identified Pdgfrα-expressing adipose progenitors (Pdgfrαpos APC), vascular and lymphatic endothelial cells, vascular smooth muscle cells, pericytes, adipocytes, as well as myelinating- and non-myelinating Schwann cells (Figure 1b and Extended Data Figure 1).
Figure 1. Single cell RNA-sequencing reveals the remodeling of brown adipocyte niche by cold.
(a) Unsupervised clustering of 24,498 non-immune cells from the BAT-SVF of 9-week old male C57BL/6J mice housed at TN (30 °C, 7 days), RT (22 °C), Cold (5 °C, 2 and 7 days) represented on a UMAP. (b) Individual gene UMAP plots showing the expression levels and distribution of representative marker genes. (c) The percentage of cells present in each cluster at different housing conditions. N=4 biologically independent animals examined in one experiment. Data are presented as Means ± SEM. (d) Gene ontology (GO) enrichment analysis of the transcripts significantly upregulated (green) and downregulated (red) by cold in Pdgfrαpos adipocyte progenitors. (e) Violin plots showing the expression levels and distribution of representative transcripts for the selected GO terms.
Cell-type-specific events in cold-induced remodeling of BAT
Previous studies have shown that cold exposure activates de novo recruitment of brown adipocytes to increase maximal thermogenic activity9,11,12. To test the hypothesis that mature adipocyte recruitment would change the frequency of any potential adipocyte progenitor population, we compared the frequency of each cell type in the four different conditions (Figure 1c). 7 days of cold exposure increased the percentage of Pdgfrαpos APCs (p= 0.0453, Cold 7d vs TN) and Schwann cells (p= 0.0280, Cold 7d vs TN), while it reduced the percentage of VSMs (p< 0.0001, Cold 2d vs TN and Cold 7d vs TN). Although we used a density-based fractionation of BAT to separate the mature lipid-laden adipocytes from the SVF, we could detect a number of cells expressing markers of brown adipocytes including Ucp1, Adipoq, Cidea, and Dio2 (Figure 1b and Extended Data Figure 1). These cells are likely differentiating adipocytes with low lipid content and higher density than fully mature adipocytes. The frequency of these cells was significantly higher in the 2 days cold group (Figure 1c, p= 0.0124, Cold 2d vs TN), supporting the notion that cold exposure induces de novo adipogenesis in BAT.
The presence of differentiating adipocytes enabled us to explore the origin and adipogenic trajectory of brown adipocytes differentiated upon cold exposure. Given that previous studies have revealed the contribution of Ly6a (Sca-1)pos Pdgfrαpos APCs to cold-induced brown adipocyte differentiation13, we first examined the effect of cold exposure on gene expression in Pdgfrαpos APCs. To do so, we used a pseudo-bulk approach that requires aggregation of the single cell counts to the sample level for each cluster21 (Supplementary Table 2). Gene ontology analysis of the transcripts upregulated in Pdgfrαpos APCs by cold identified significant enrichments of glycosaminoglycan and integrin binding, insulin-like growth factor binding, and regulation of fat cell differentiation processes, all of which are known to be associated with adipogenesis22,23. The transcripts significantly downregulated by cold in Pdgfrαpos APCs were involved in unsaturated fatty acid biosynthesis, response to lipopolysaccharide, collagen biosynthesis, and inflammatory response processes (Figure 1d-e). Together, these analyses revealed that cold triggers a multi-layered gene program in Pdgfrαpos APCs which support their adipogenic differentiation.
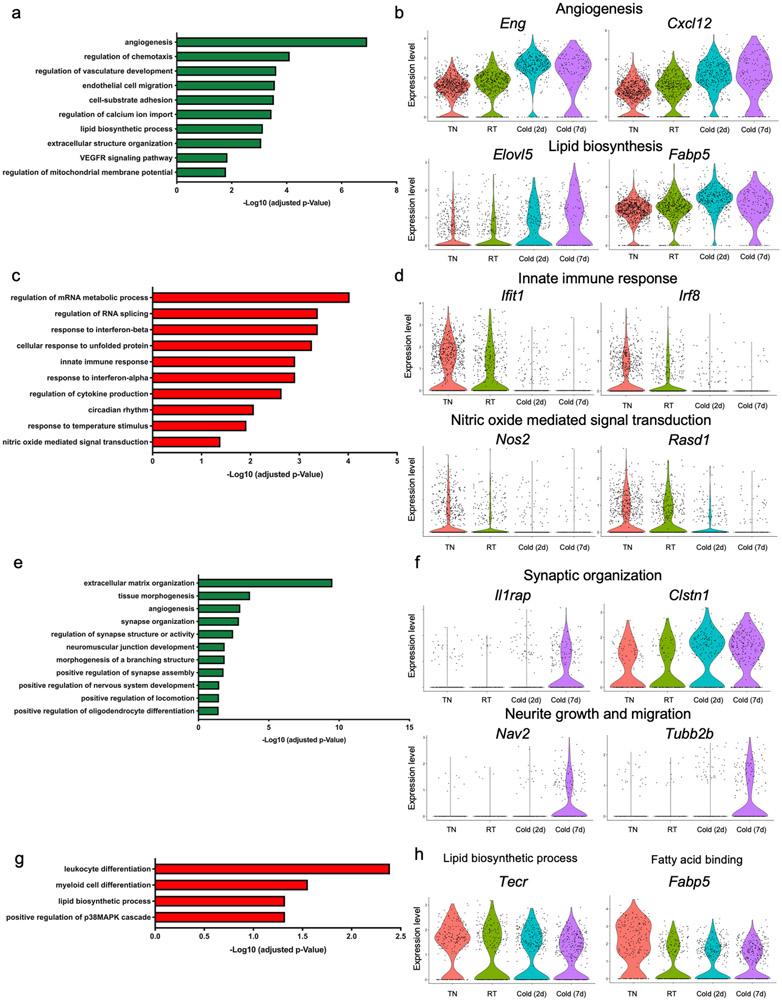
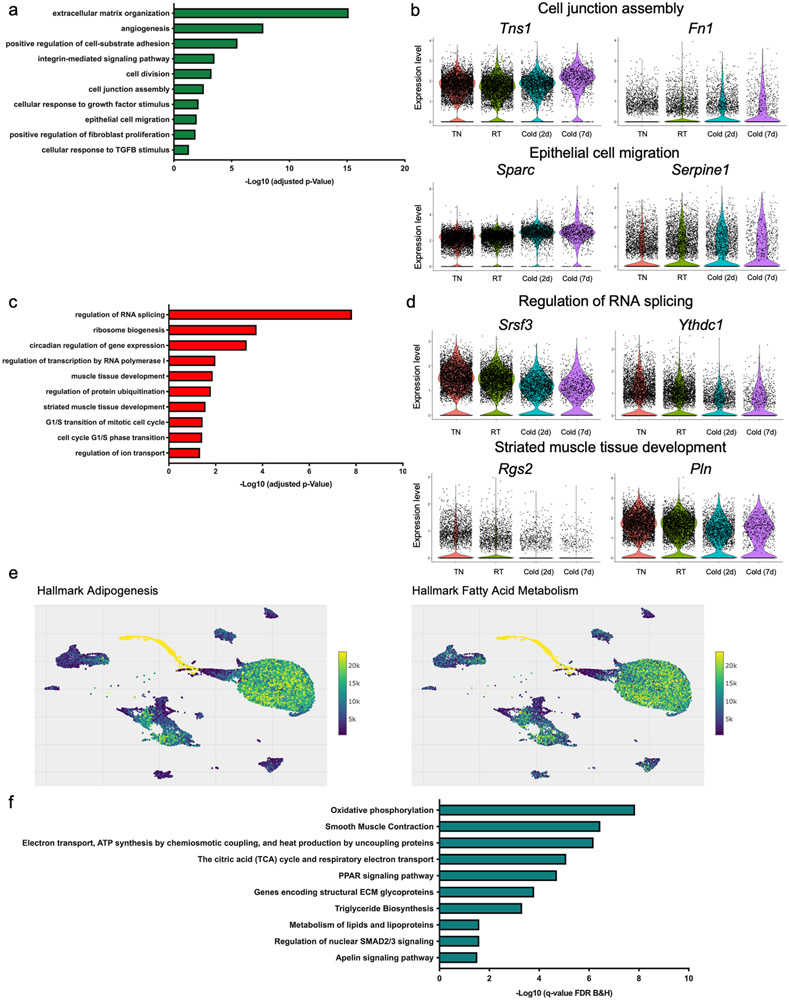
Using a similar strategy, we examined the effects of cold exposure on other cell types present in BAT (Supplementary Data 2). In capillary endothelial cells, cold exposure upregulated the expression of transcripts involved in angiogenesis, chemotaxis, endothelial cell migration, and lipid biosynthesis. This is consistent with previous studies reporting increased angiogenesis and expansion of vascular networks in BAT upon cold exposure24. On the other hand, cold exposure downregulated the expression of genes related to mRNA metabolism, response to unfolded protein, innate immune response, cytokine production, and Nitric oxide mediated signal transduction in capillary endothelial cells (Extended Data Figure 2a-d). In Schwann cells, the transcripts upregulated by cold belong to biological processes including extracellular matrix organization, regulation of synapse structure or activity, positive regulation of synapse assembly, and oligodendrocyte differentiation. The activation of these pathways enables the appropriate expansion of Schwann cells and potentially sympathetic neurites to promote norepinephrine-mediated activation of brown adipocytes by cold. The transcripts downregulated by cold were involved in leukocyte differentiation, lipid biosynthesis, and positive regulation of p38MAPK cascade (Extended Data Figure 2e-h). In VSMs, extracellular matrix organization, angiogenesis, cell division, cell junction assembly, epithelial cell migration, and response to TGFB stimulus were significantly over-represented in the transcripts whose expression was upregulated by cold (Extended Data Figure 3a-b). In the transcripts downregulated in cold, regulation of RNA splicing, ribosome biogenesis, striated muscle development, and G1/S transition of cell cycle were significantly over-represented (Extended Data Figure 3c-d).
The contribution of Trpv1pos VSMs to brown adipogenesis
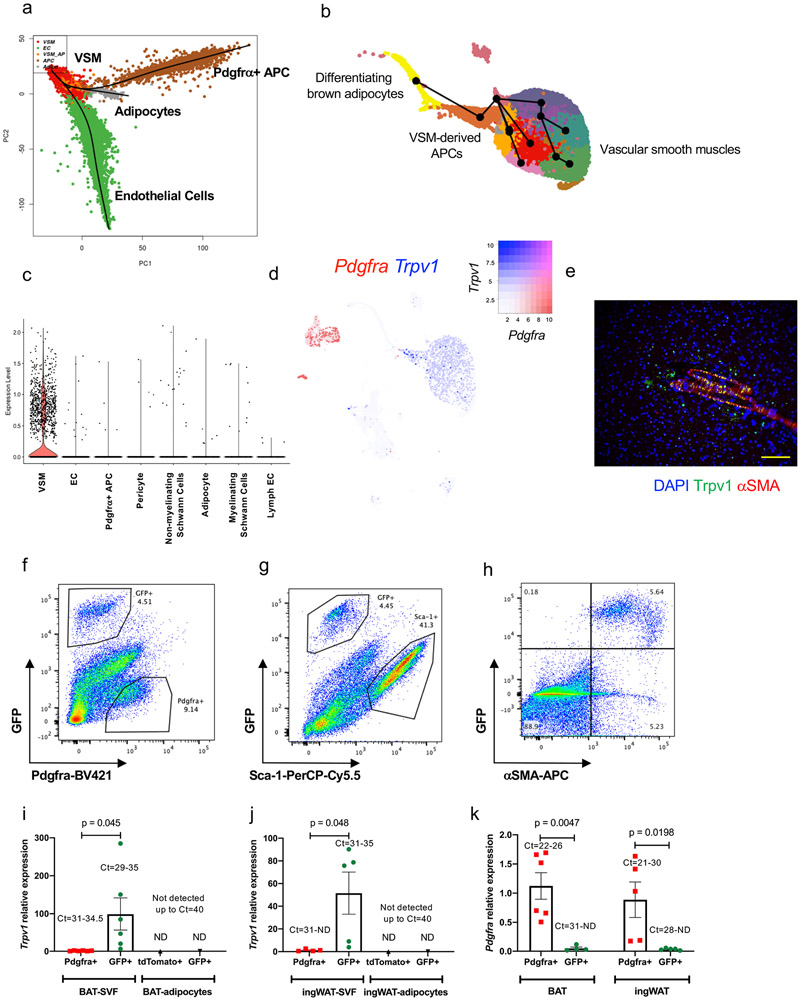
Intriguingly, the UMAP cluster visualization showed the close relationship between differentiating brown adipocytes and VSMs (Figure 1a). This prompted us to interrogate the cellular origin of these differentiating adipocytes using an in silico cell trajectory analysis method called Slingshot25, which is designed to infer cell lineages and model developmental trajectories from single-cell gene expression data. Consistent with Seurat clustering, pseudotemporal analysis predicted the VSMs to be the most likely origin of the differentiating brown adipocytes found in BAT-SVF (Figure 2a). Furthermore, we used Vision to examine the coordinated expression of genes involved in known biological processes26. Consistently, we found high scores for adipogenesis and fatty acid metabolism gene signatures in VSMs (Extended Data Figure 3e), further supporting their role as adipose precursors.
Figure 2. Lineage trajectory analysis predicts the contribution of Trpv1pos VSMs to brown adipogenesis.
(a) Lineage trajectory analysis using Slingshot. Trajectories were calculated for the merged Seurat cell clusters, specifying the adipocyte cluster as the end state. (b) Pseudotime curves calculated by the Slingshot method using the UMAP coordinates and cell clusters for the vascular smooth muscle cells and adipocytes. (c) Violin plots showing the Trpv1 expression in different cell types present in BAT. (d) UMAP plot showing the expression of Trpv1 and Pdgfrα in BAT-SVF. (e) Immunohistochemistry for Trpv1 and αSMA in BAT. Scale bar=10 μm. N=4 biologically independent animals examined in 3 independent experiments. (f-h) Representative flow cytometry analysis of BAT-SVF derived from Trpv1cre Rosa26mTmG mice stained with (f) Pdgfrα, (g) Sca-1, and (h) αSMA. (i,j) Gene expression of Trpv1 in Pdgfrαpos and GFPpos cells in SVF and tdTomatopos and GFPpos mature adipocyte isolated from (i) BAT and (j) ingWAT of Trpv1cre Rosa26mTmG mice. N=6 per group. Data are presented as Means ± SEM and analyzed by unpaired two-sided t-test. (k) Gene expression of Pdgfrα in tdtomatopos and GFPpos cells in SVF isolated from BAT and ingWAT of Trpv1cre Rosa26mTmG mice. N=6 per group. Two-way ANOVA with Sidak's multiple comparisons test.
Although several studies have demonstrated that VSM-derived progenitors in white adipose tissue can differentiate into white or beige adipocytes14,15,27-29, lineage tracing experiments demonstrate that the Myh11-expressing15 or αSMA- expressing14 VSM cells do not give rise to the classical brown adipocytes. To identify the sub-populations of VSM with adipogenic potential and predict the adipogenic trajectory, we used the Slingshot trajectory analysis to order the progression of VSM cells to adipocyte progenitors and differentiating adipocytes (Figure 2b). Pathway enrichment analysis of the top 100 genes correlated with the adipogenic trajectory (pseudotime genes) showed the enrichment of oxidative phosphorylation, heat production by uncoupling protein, TCA cycle, Ppar signaling, and triglyceride biosynthesis pathways (Extended Data Figure 3f).
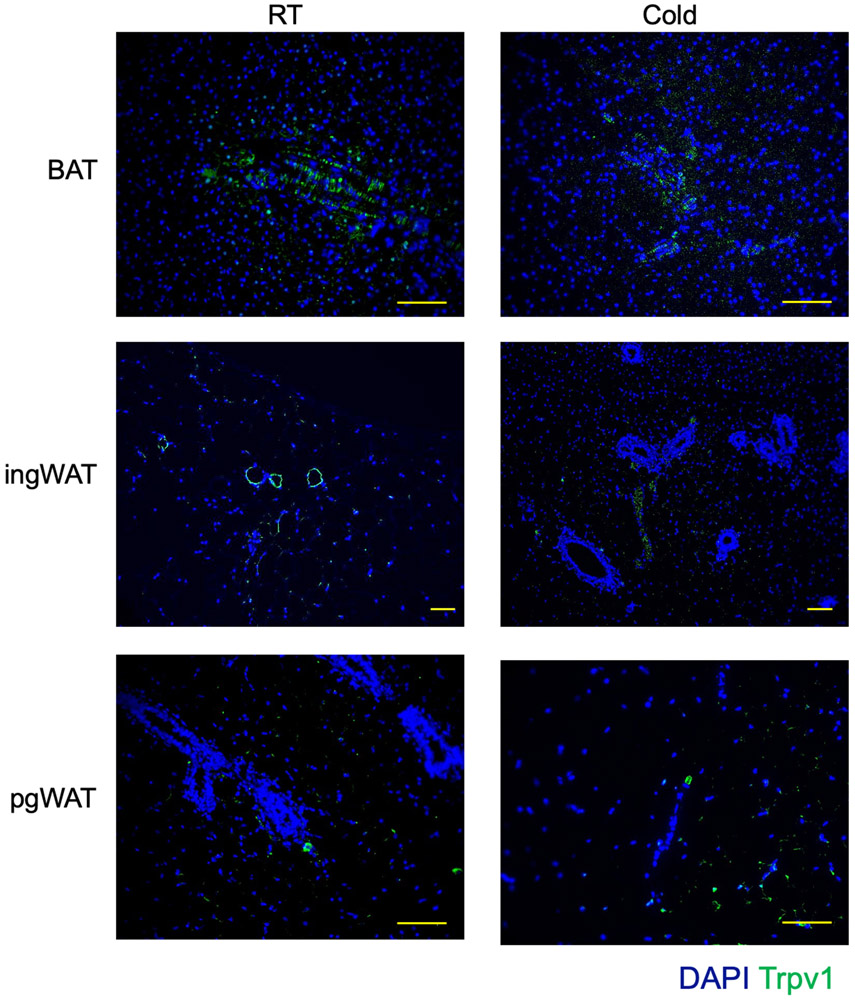
To identify a specific marker to track the fate of VSM in BAT, we searched the cell type-specific scRNA-seq data and identified Trpv1 as one of the most exclusively expressed transcripts in the VSM cells with high expression in the predicted VSM-derived APCs (Figure 2c-d). The scRNA-seq data suggested that Trpv1pos VSMs are a distinct population of cells in BAT and they do not have any overlap with the Pdgfrαpos APCs (Figure 2d). Staining of adipose tissue from mice housed at room temperature or in cold for 7 days with a Trpv1 antibody revealed that the Trpv1 expression is specific to vascular structures with no differences in the staining of cold exposed animal (Figure 2e, Extended Data Figure 4).
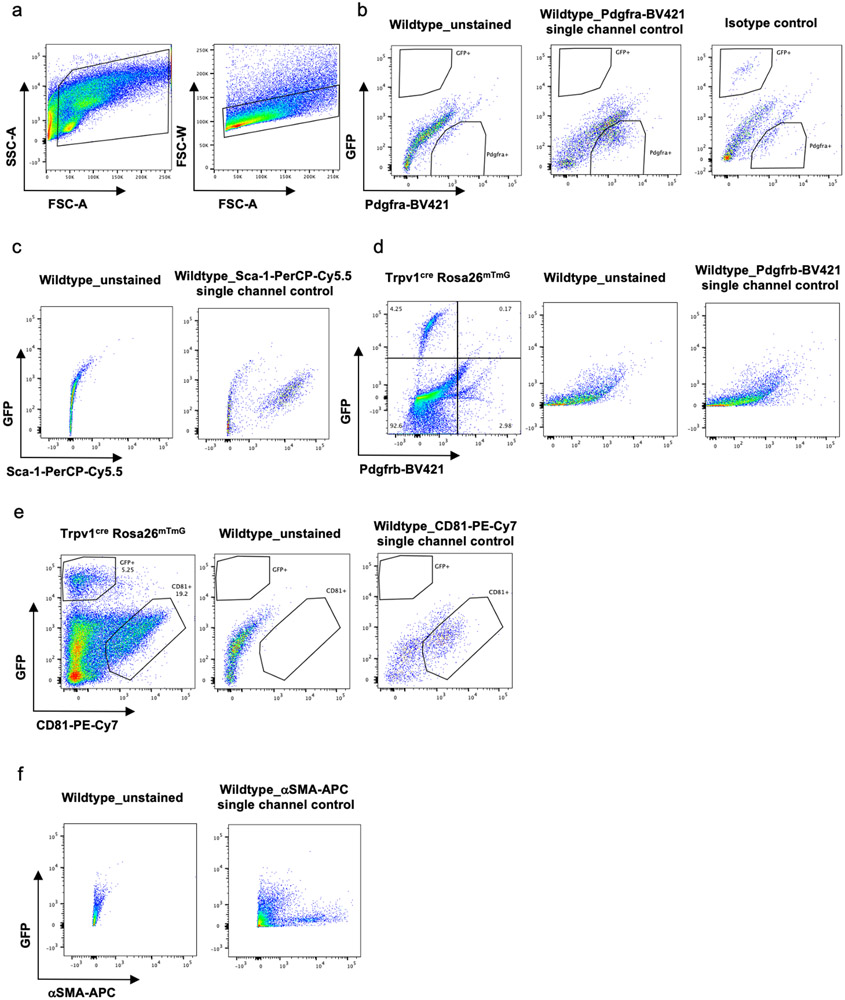
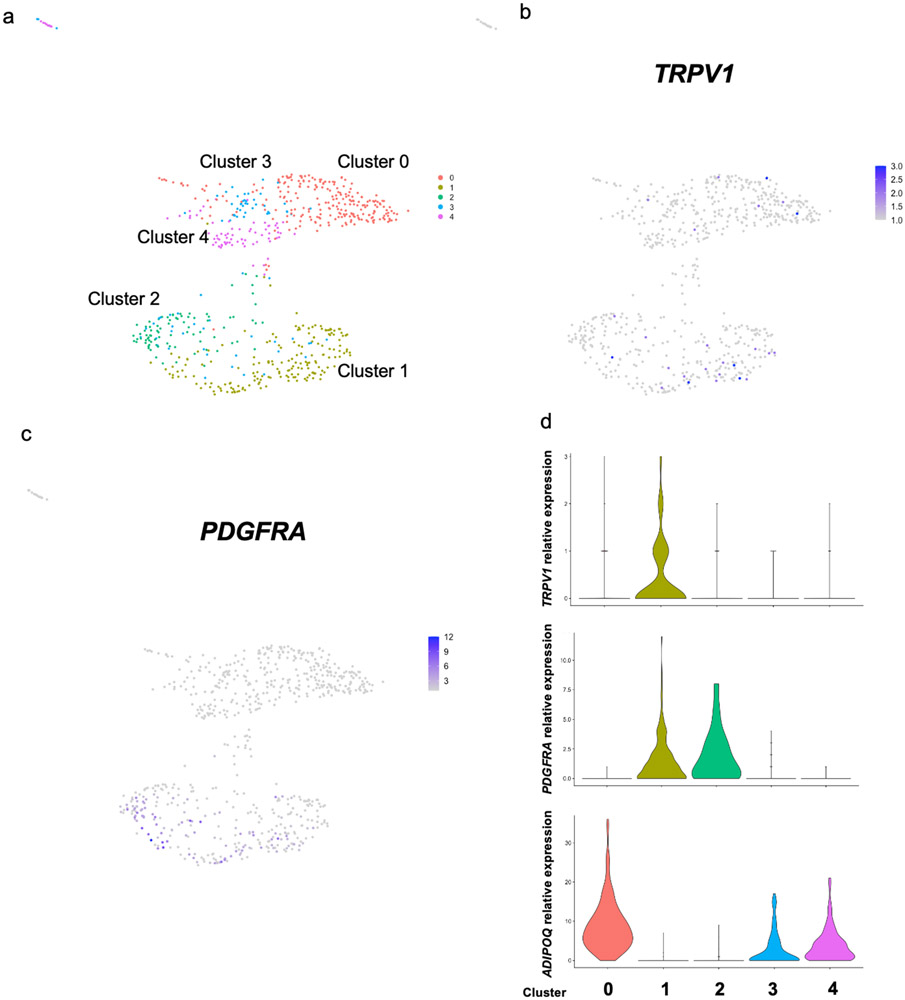
To validate these findings, we generated a Trpv1 reporter mouse model by crossing the Trpv1-cre mice with the Rosa26-mTmG reporter strain (Trpv1Cre Rosa26mTmG). In the absence of cre recombinase, the membranes of all the cells are labeled with tdTomato. Cells that express Trpv1 undergo cre-mediated recombination and their membranes are permanently labeled with GFP. Flow cytometry analysis of cells in the BAT-SVF from Trpv1Cre Rosa26mTmG mice revealed that the GFPpos population was mutually exclusive from cells that stained positive for Pdgfrα (Figure 2f, Extended Data Figure 5a-b) or other previously identified adipocyte progenitor markers such as Sca-130, Pdgfrβ31, or Cd8132 (Figure 2g, Extended Data Figure 5c-e). However, GFPpos cells also expressed αSMA (Figure 2h, Extended Data Figure 5f), indicating the Trpv1pos cells in BAT are derived from the VSM lineage and distinct from putative Pdgfrαpos adipocyte progenitor cells. Gene expression analysis in sorted cells confirmed that Trpv1 and Pdgfrα are enriched in the GFPpos and Pdgfrαpos cells isolated from the SVF, respectively (Figure 2i-k). Additionally, similar to Pdgfrα, Trpv1 expression is restricted to the progenitor cell populations in the SVF of BAT and ingWAT and is not detected in mature brown or white adipocytes (Figure 2e, i, j and Extended Data Figure 4). Finally, analysis of a publicly available single cell gene expression database of human deep neck fat33 uncovered two populations of putative progenitor cells; one marked by expression of both Pdgfrα and Trpv1 and the other marked exclusively by Pdgfrα expression (Extended Data Figure 6).
Trpv1pos VSM-APCs give rise to brown and white adipocytes
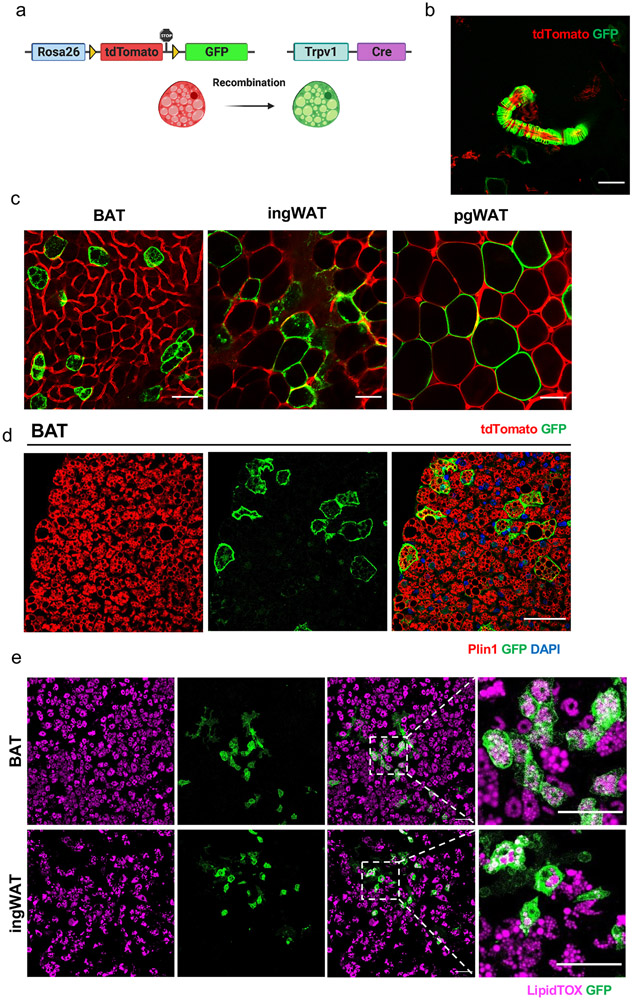
The lineage trajectory analysis predicted that Trpv1-expressing VSMs are the cellular origin of differentiating brown adipocytes. To test this hypothesis and examine the adipogenic potential of Trpv1-expressing cells in vivo, we performed lineage tracing studies using the Trpv1Cre Rosa26mTmG mouse model (Figure 3a). These mice express cre recombinase as a fusion transcript with the endogenous Trpv1 allele. Consistent with the Trpv1 immunohistochemistry results and previous reports34, we could confirm cre-mediated recombination in vascular smooth muscle cells (Figure 3b). Given the absence of Trpv1 expression in adipocytes and the indelible nature of the GFP labeling, we reasoned that the presence of GFP-labeled adipocytes would mean that Trpv1pos VSMs differentiate into adipocytes. Examining GFP and tdTomato fluorescence in BAT of male and female Trpv1Cre Rosa26mTmG mice housed at room temperature demonstrated the presence of GFP-labeled adipocytes in BAT (Figure 3c). Immunohistochemistry using GFP and Perilipin (Plin1) antibodies confirmed the colocalization of GFP and Plin1 on the same cells, confirming that the GFP-labeled cells are in fact mature adipocytes (Figure 3d). Interestingly, we found that Trpv1pos progenitors also contribute to the white adipocytes in inguinal (ingWAT) and perigonadal WAT (pgWAT), as evidenced by the presence of GFP-labeled adipocytes in both WAT depots of the Trpv1Cre Rosa26mTmG mice (Figure 3c). Furthermore, we validated the adipogenic potential of Trpv1pos progenitors in culture by isolating SVF, subjecting them to a standard adipogenic differentiation cocktail, and demonstrating the GFPpos cells in the BAT- and ingWAT-SVF could differentiate into lipid-laden adipocytes (Figure 3e). Together, these results identified a population of Trpv1pos adipocyte progenitors derived from the vascular smooth muscle cells in brown and white adipose tissue that give rise to mature adipocytes in vivo and in vitro.
Figure 3. Genetic lineage tracing confirms that Trpv1pos cells give rise to brown and white adipocytes.
(a) Scheme of Trpv1cre Rosa26mTmG lineage tracing model. (b) Representative whole-mount microscopy image of BAT showing the GFP labeling of VSMs. Scale bar=50 μm (c) Whole-mount microscopy for GFP and tdTomato fluorescence in BAT, ingWAT, and pgWAT in Trpv1cre Rosa26mTmG mice. Scale bar=50 μm. (d) Immunohistochemistry staining for GFP and Plin1 in BAT. Scale bar=50 μm. Experiments in b-d were repeated in at least eight independent expeiments. (e) LipidTOX and GFP staining in the in vitro differentiated primary SVF cells isolated from the BAT and inWAT of Trpv1cre Rosa26mTmG mice. Scale bar=100 μm. N=3 biologically independent animals examined in one experiment.
Trpv1pos APCs differentiate to highly thermogenic adipocytes
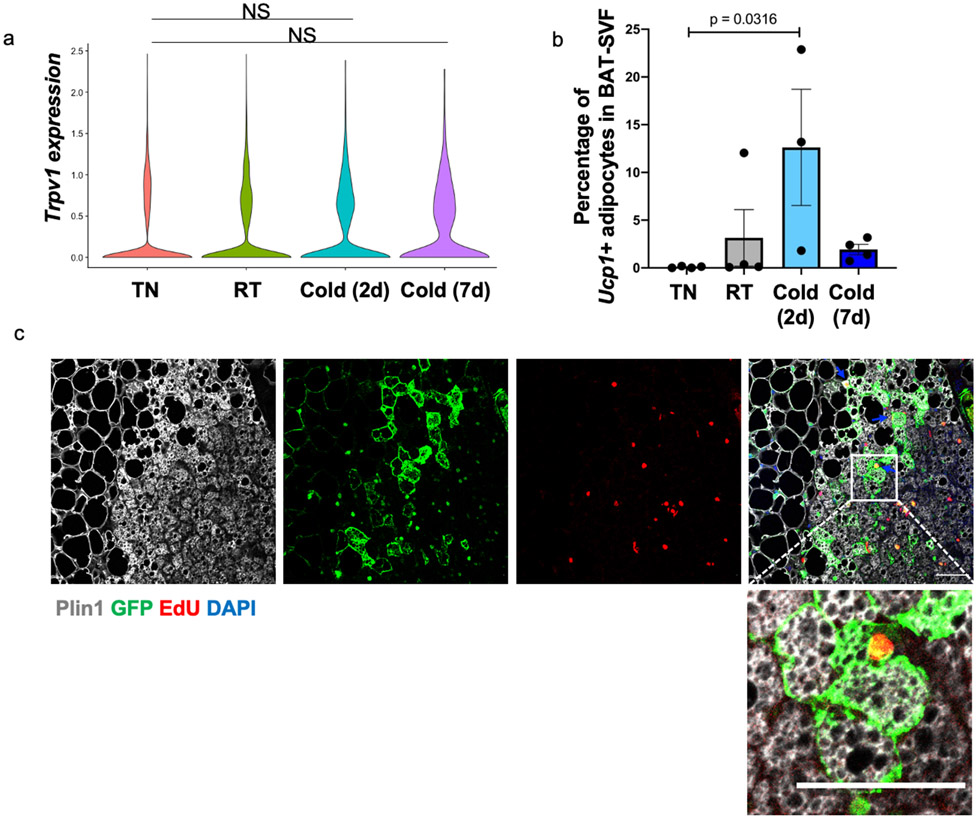
Although cold exposure (2 days or 7 days) did not change the expression of Trpv1 in the VSMs of BAT (Extended Data Figure 7a), we observed a significant increase in the number of differentiating adipocytes in the BAT of mice housed in cold for 2 days (Extended Data Figure 7b). This prompted us to investigate if cold exposure induces the proliferation of Trpv1pos cells and increases the number of brown adipocytes derived from the Trpv1pos lineage.
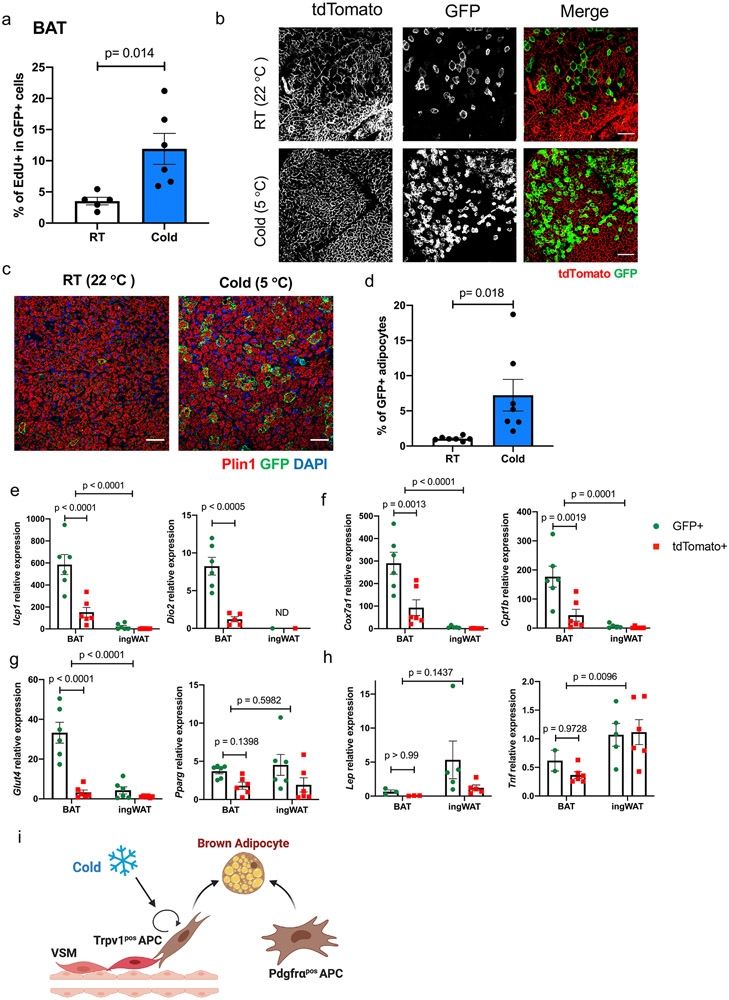
To quantify the proliferation rate of Trpv1pos cells in BAT, we housed Trpv1Cre Rosa26mTmG mice at RT or 5 °C cold for 7 days with the continuous administration of thymidine analog EdU in drinking water. Flow cytometry analysis of EdU labeling demonstrated that cold exposure significantly increases the proliferation rate of Trpv1pos cells (Figure 4a). A previous study has documented the increased proliferation of Pdgfrαpos adipocyte progenitors in BAT in response to short-term cold exposure13. To determine if cold exposure increases the recruitment of brown adipocytes from the Trpv1pos progenitors, we housed Trpv1Cre Rosa26mTmG mice at 5 °C cold for 7 days. We observed a robust increase in GFPpos adipocytes in BAT by cold stimulation compared to BAT from the control mice kept at RT (Figure 4b). Immunohistochemistry staining with the GFP and Plin1 antibodies followed by the quantification of adipocytes revealed that GFPpos adipocytes make up about 1% of adipocytes in BAT at RT (Figure 4c-d) Importantly, cold exposure significantly increases the percentage of GFPpos adipocytes in BAT to 7.2% (Figure 4c-d). Tracking EdU labeling in adipocytes confirmed that GFP-positive brown adipocytes arose from proliferating progenitors, suggesting they are new adipocytes resulting from adipogenesis (Extended Data Figure 7c). Collectively, these findings demonstrated that brown adipocytes could arise from both Trpv1pos and Trpv1neg lineages, and cold exposure induced proliferation and differentiation of Trpv1pos progenitors.
Figure 4. Cold exposure induces the proliferation and differentiation of Trpv1pos adipocyte progenitors to highly thermogenic adipocytes.
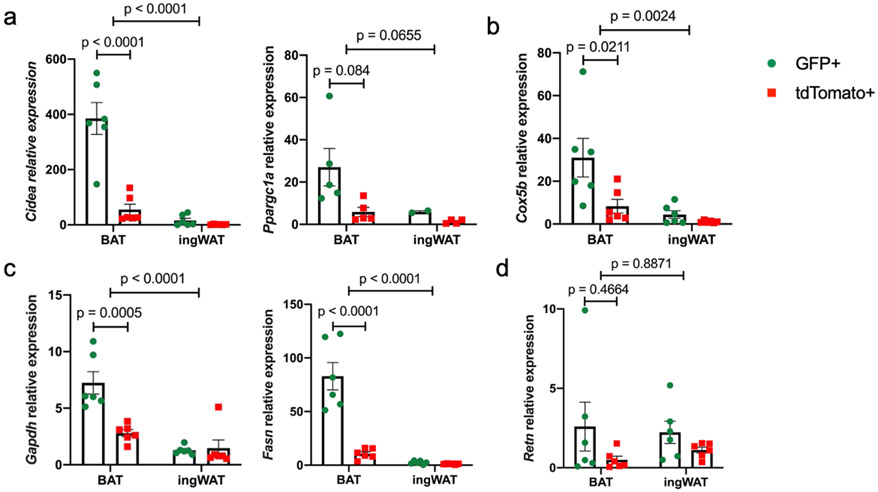
(a) Percentage of EdU labeling in the GFPpos cells in BAT of Trpv1cre Rosa26mTmG mice housed at RT or cold (5 °C) for 7 days. N=11 (RT) and N=12 (Cold) biologically independent animals examined over 2 independent experiments. Data are presented as Means ± SEM and analyzed by unpaired two-sided t-test. Results from one representative experiment are shown. (b) Whole-mount microscopy for GFP and tdTomato fluorescence in BAT of Trpv1cre Rosa26mTmG mice housed at RT or Cold for 7 days. Scale bar=50 μm. N=13 per group biologically independent animals examined over 3 independent experiments (c) Immunohistochemistry staining for GFP and Plin1 in BAT from mice housed at room temperature or cold for 7 days. Scale bar=50 μm. (d) Percentage of GFPpos adipocytes (Plinpos) in BAT of Trpv1cre Rosa26mTmG mice housed at RT or cold (5 °C) for 7 days . N=7 per group biologically independent animals examined in one experiment, 3-9 images/animal. Data are presented as Means ± SEM and analyzed by unpaired two-sided t-test. (e-h) Expression of the indicated transcripts in tdTomatopos and GFPpos adipocytes isolated from BAT and ingWAT of Trpv1cre Rosa26mTmG housed at cold (5 °C) for 7 days. N=6 mice per group. Data are presented as Means ± SEM. Two-Way ANOVA with Sidak's multiple comparisons test. (i) Model depicting the two types of adipocyte progenitors contributing to thermogenic adipocyte pool in adult mice.
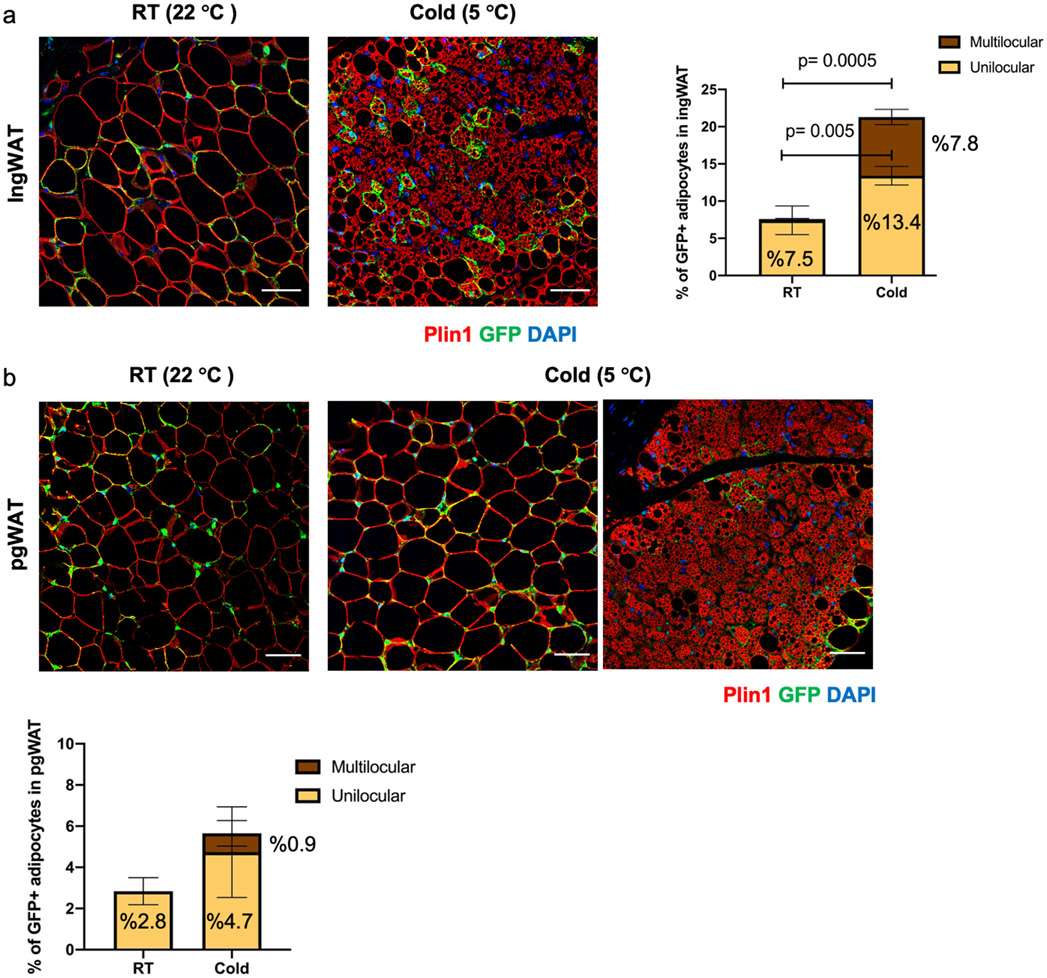
Beige adipocytes arise from de novo differentiation of adipocyte progenitors upon the first exposure to cold temperatures, while subsequent cold exposures trigger the conversion of the differentiated unilocular adipocytes to multilocular beige adipocytes35. Room temperature imposes mild cold stress on rodents and thus mice born and raised at room temperature have a small number of beige adipocytes35. To determine the contribution of Trpv1pos lineage to beige adipogenesis, we performed two sets of experiments using different housing conditions. First, we quantified the number of GFPpos adipocytes in the ingWAT and pgWAT of Trpv1Cre Rosa26mTmG mice born and raised at room temperature and housed at cold for 7 days. In this condition, cold increased the total frequency of GFPpos adipocytes, as well as the percentage of multilocular UCP1pos GFPpos beige adipocytes in the ingWAT (Extended Data Figure 8a). We could also detect a small number of multilocular GFPpos adipocytes in pgWAT of mice housed at cold for 7 days, however, the difference did not reach statistical significance compared to the control group housed at room temperature (Extended Data Figure 8b).
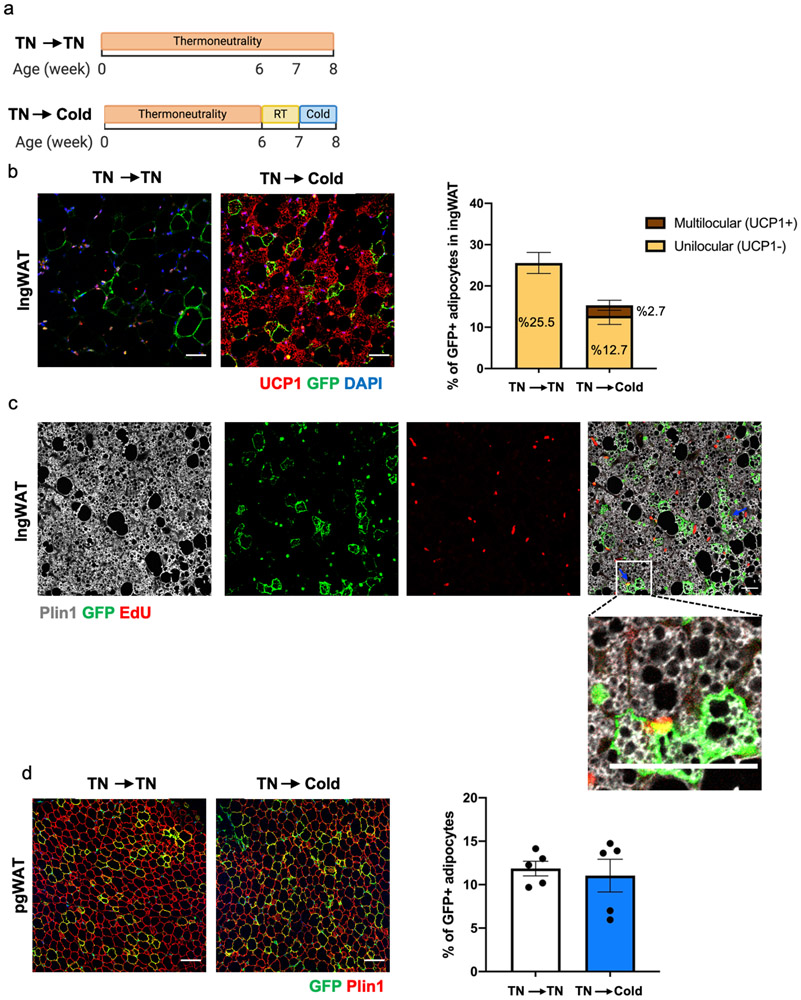
Alternatively, to minimize basal beige adipogenesis we raised Trpv1cre Rosa26mTmG mice at thermoneutrality from birth until 6 weeks of age, and then exposed them to cold for one week (Extended Data Figure 9a). While we could not detect any GFPpos/UCP1pos adipocytes in ingWAT of mice housed at thermoneutrality, we found 2.7% of adipocytes in ingWAT of the mice transferred to cold were GFPpos/UCP1pos (Extended Data Figure 9b). The GFPpos adipocytes make up about 10.5% of all the UCP1pos adipocytes in ingWAT of these mice. Importantly, the presence of EdU in the GFPpos multilocular adipocytes indicated that some of beige adipocytes were derived from the Trpv1pos APCs via de novo adipogenesis (Extended Data Figure 9c). We also observed the contribution of the Trpv1pos lineage to white adipocytes in pgWAT of the mice raised at thermoneutrality and after transfer to cold (Extended Data Figure 9d). Based on these results, we concluded that the Trpv1pos APCs in WAT give rise to both white and beige adipocytes, and that cold exposure triggers the recruitment of beige adipocytes from the Trpv1pos lineage through either de novo differentiation of Trpv1pos progenitors or direct conversion from dormant beige or white adipocytes.
To determine whether brown adipocytes derived from either lineage possess intrinsic differences, we isolated GFPpos (derived from Trpv1pos APCs) and tdTomato+ (derived from Trpv1neg APCs) mature adipocytes from BAT and ingWAT of the Trpv1Cre Rosa26mTmG mice (Supplementary Figure 1) and measured gene expression. Intriguingly, compared to the tdTomato+ adipocytes, the GFP+ brown adipocytes isolated from BAT expressed significantly higher levels of the key thermogenic genes (Ucp1, Cidea, Dio2, Ppargc1a) (Figure 4e and Extended Data Figure 10a), mitochondrial genes (Cox5b, Cox7a1, Cpt1b) (Figure 4f and Extended Data Figure 10b), as well as other genes regulating fuel uptake and utilization (Glut4, Gapdh, and Fasn) (Figure 4g and Extended Data Figure 10c). On the contrary, the expression of most of these genes was similar between the GFPpos and tdTomatopos adipocytes isolated from ingWAT, supporting the lineage tracing studies showing that Trpv1pos APCs in ingWAT give rise to both white and beige adipocytes. Levels of general adipogenic transcription factor Pparg was comparable between adipocytes isolated from BAT and ingWAT (Figure 4g). Additionally, the expression of white adipocyte-enriched genes, Lep, Retn, and Tnf was higher in the adipocytes isolated from ingWAT than those isolated from BAT and was not different between the GFPpos and tdTomatopos adipocytes (Figure 4h and Extended Data Figure 10d). Together, these results show that cold exposure promotes the adipogenic differentiation of Trpv1pos progenitors in BAT and ingWAT, which give rise to brown and beige adipocytes with high thermogenic potential.
Discussion
Recent technical advances allowing single cell approaches, combined with the development of powerful computation analyses have provided an opportunity to address fundamental questions in biology. The present study uses scRNA-seq to map the cellular composition of BAT, characterize the contribution of each cell type to cold-induced remodeling of the depot, and identify the cellular origin of brown adipocytes recruited in BAT upon cold exposure. The findings presented here reveal Trpv1pos cells as a previously unknown population of adipocyte progenitors derived from the VSM lineage. Genetic lineage tracing of the Trpv1pos progenitors demonstrates the contribution of these cells to adipocytes in BAT, ingWAT, and pgWAT depots. Previous studies have shown that the Pdgfrαpos progenitors can give rise to brown and beige adipocytes in response to cold exposure13,36. Based on these findings, we propose a model in which cold stimulates both Trpv1pos APCs and Pdgfrαpos APCs to undergo adipogenesis and expand the thermogenic adipocyte pool to adapt to the increased thermogenic demand (Figure 4i). Importantly, we show that brown adipocytes derived from the Trpv1pos lineage express higher levels of thermogenic genes compared to those derived from the Trpv1neg lineage.
Lineage tracing studies using multiple Cre drivers labeling the VSM lineage (Pdgfrβ, Acta2 (α-SMA), Tagln (SM22), Cspg4 (NG2), and Myh11 have tracked the differentiation of perivascular mural cells to white and beige adipocyte pool14,15,27,29. Disrupting the adipogenic differentiation of these mural progenitors through deletion of the key adipogenic transcription factor, Pparg, blunted beige adipocyte formation, and impaired thermoregulation and glycemic control in mice14,27. However, fate-mapping studies using these Cre drivers have not been able to find brown adipocytes derived from the mural lineage in interscapular BAT, leading to the conclusion that mural-derived adipocyte progenitors give rise to white and beige, but not brown adipocytes. The major limitation of these previous studies is that they have relied on a few selective mural lineage markers to assess adipogenic potential and track their transition to mature adipocyte fate. Comparing the populations marked by these different drivers indicated only a partial overlap between the vascular smooth muscle cells expressing these markers, and therefore points to the heterogeneity of vascular smooth muscle cells in adipose tissue14. In contrast to the previous studies, we used an unbiased strategy to identify the origin of the cold-induced brown adipocytes, which uncovered the Trpv1-expressing cells as progenitors giving rise to adipocytes in BAT, ingWAT, and pgWAT depots. The discrepancy between our findings and previous studies is possibly due to the lower expression of the classical vascular smooth muscle markers in the Trpv1pos VSM-APCs.
Trpv1 detects multiple noxious stimuli including heat, pH changes, fatty acid amides, and capsaicin, the pungent component of chili-peppers37. In addition to sensory neurons, Trpv1 expression was also found in smooth muscle cells of several thermoregulatory tissues, including the skin, ear, cremaster muscle, dura, tongue, and trachea34. Here, we report the detection of Trpv1-expressing VSMs in BAT by scRNAseq, which is the major thermogenic organ. Emerging evidence suggests a role for TRPV1 and capsaicin signaling in energy metabolism and feeding. Administration of capsaicin and its related compounds reduces food intake and increases energy expenditure in animals and humans38-41. TRPV1-deficient mice have higher energy expenditure and are protected from diet-induced obesity42. Additionally, capsaicin treatment blocked adipogenesis in 3T3-L1-preadipocytes in a Trpv1-dependent manner41. Here we show that cold stimulates the proliferation and differentiation of Trpv1pos adipocyte progenitors to mature adipocytes, providing an adaptive mechanism to enhance thermogenesis. The identification of Trpv1pos adipocyte progenitors and their role in cold-induced thermogenic adipocyte recruitment will enable future investigations to address the role of Trpv1 channel in thermoregulation, beyond its action in sensory neurons.
In summary, the findings reported here suggest a new model for the development of BAT that could be critical in designing strategies to increase the number of thermogenic adipocytes as a therapeutic approach for obesity and metabolic diseases.
Methods
Animals
Study approval: All experimental procedures involving animals were performed in compliance with all relevant ethical regulations applied to the use of small rodents and with approval by the Institutional Animal Care and Use Committees (IACUC) at Joslin Diabetes Center.
C57Bl/6J mice (Stock no. 000664) were purchased from The Jackson Laboratory. 9-week old male C57BL/6J mice were used for the scRNA-sequencing experiment.
Generation of Rosa26-mTmG reporter strain: Homozygous Trpv1cre mice (B6.129-Trpv1tm1(cre)Bbm/J, Stock No: 017769) were crossed with Homozygous Rosa26mTmG (B6.129(Cg)-Gt(ROSA)26Sortm4(ACTB-tdTomato,-EGFP)Luo/J, Stock no. 007676), both obtained from The Jackson Laboratory. The Trpv1cre mice used in this study express cre recombinase as a fusion transcript with the endogenous Trpv1 allele. These mice express mRNA featuring an internal ribosome entry site (IRES) between the Trpv1 locus and cre cDNA such that both proteins can be translated, and mutant animals do not suffer from Trpv1 gene insufficiency. These animals have been backcrossed to C57BL/6N mice for at least 10 generations and backcrossed to C57BL/6J mice for at least 1 generation.
For experiments involving cold exposure or thermoneutral housing, mice were housed at 5°C (cold) or 30°C (thermoneutral) in a controlled environmental diurnal chamber (Caron Products & Services Inc., Marietta, OH) with free access to food and water. Mice were maintained at a 12hr-light/dark cycle with 30% Humidity on a normal chow diet containing 22% of calories from fat, 23% from protein, and 55% from carbohydrates (Mouse Diet 9F 5020; PharmaServ).
5-Ethynyl-2´-deoxyuridine (EdU, Carbosynth, NE08701) was added to the drinking water at the concentration of 0.8 mg/ml for 7 days. Both male and female mice were used.
Isolation of stromovascular fraction from BAT
Interscapular BAT was dissected, minced, and digested with a cocktail containing type 1 Collagenase (1.5 mg/ml; Worthington Biochemical), Dispase II (2.5 U/mL; STEMCELL Technologies), fatty acid-free bovine serum albumin (2%; Gemini Bio Products) in Hanks’ balanced salt’s solution (Corning® Hank's Balanced Salt Solution, 1X with calcium and magnesium) for 45 minutes at 37°C with gentle shaking. Dissociated tissue was centrifuged at 500 g at 4°C for 10 minutes. The top adipocyte layer and the supernatant were gently removed, the SVF pellet was resuspended in 10 ml of 10% Fetal Bovine Serum (FBS) in DMEM, filtered through a 100 μm cell strainer into a fresh 50 ml tube, and centrifuged at 500 g for 7 minutes. The red blood cell lysis was performed by resuspending the pellet in 2 ml sterile ACK (Ammonium-Chloride-Potassium) lysis buffer (ACK Lysing Buffer, Lonza) and incubating on ice for 5 minutes. The cells were then filtered through a 40 μm cell strainer, washed with 20 ml 10% FBS in DMEM, and centrifuged at 500 g for 7 minutes. The pellet was resuspended in 1 ml of 1.5% BSA in PBS. The dead cell removal was performed using Dead Cell Removal Kit (Miltenyi Biotec) according to the manufacturer’s instructions. The cells were finally resuspended in 50-100 μl of 1.5% BSA in PBS and kept on ice before immediately proceeding to single cell isolation. The detailed protocol for the isolation of the SVF from adipose tissue is deposited on protocols.io (dx.doi.org/10.17504/protocols.io.bpurmnv6).
Single-cell RNA-sequencing
Cells were loaded for an expected recovery of 10,000 cells per channel. The chip loaded with single cell suspension was placed on a 10x Genomics Chromium Controller Instrument (10x Genomics, Pleasanton, CA, USA) to generate single cell droplets containing uniquely barcoded GEMs (Gel Bead-In EMulsions). Single-cell RNA-seq libraries were obtained following the 10x Genomics recommended protocol, using the reagents included in the Chromium Single Cell 3′ v3 Reagent Kit. The libraries were sequenced on the NovaSeq S2 flow cell (Illumina, 100 cycles). Sample demultiplexing, alignment, filtering, and UMI counting were obtained by using Cell Ranger 3.0.1.
Single-cell RNA-sequencing data analysis
Clustering and visualization of gene expression were performed using the Seurat package (version 3.0)19 on RStudio. Cells were filtered to have at least 800 UMI and 400 detected genes. The clustering analysis was done using the sctransform method43 after regressing out the variation due to cell cycle and integration across samples. By default, sctransform also accounts for differences in the number of UMIs per sample. The top 50 principal components (PCs) were included for determining the clusters. Visualization of the clusters was done by the Uniform Manifold Approximation and Projection (UMAP) method20. Upon marker identification, the non-immune cell clusters were subsetted and re-clustered again as described above.
Differential gene expression analysis was performed using a pseudo-bulk approach21. To do so, the single cell counts were aggregated to the sample level for each cluster. Differential gene expression analysis of count data was performed using the Bioconductor R package, DESeq244. Using the likelihood ratio test (LRT), we identified all genes whose expression was significantly different between at least 2 of the conditions (temperatures). Gene Ontology (GO) term over-representation analysis was performed on the groups of significantly up- or down-regulated genes.
Slingshot (v1.4.0) was used to perform branched trajectory analysis on integrated data25.The Seurat clusters were merged for the adipocyte progenitor cells (AP_8, AP_9, AP_25, AP_26), endothelial cells (EC_4, EC_10, EC_11, EC_15, EC_23, EC_28, EC_32, and Lymph_EC_19), vascular smooth muscle cells (VSM_0, VSM_1, VSM_2 VSM_3, VSM_5, VSM_7, VSM_20, VSM_21, VSM_22, VSM_27), and the pre-adipocyte cells (VSM_AP_6 and Adipo_16). Trajectories were calculated for the merged Seurat cell clusters, in addition to the Adipocyte (Adipo_24) cluster from the first 3 PCA components, specifying the Adipocyte (Adipo_24) cluster as the end state.
For trajectory analysis of the vascular smooth muscle cells and adipocytes, the UMAP coordinates and cell clusters for the vascular smooth muscle cells and adipocytes (VSM_0, VSM_1, VSM_2 VSM_3, VSM_5, VSM_7, VSM_20, VSM_21, VSM_22, VSM_27, VSM-AP_6, Adipo_16, and Adipo24) were used to calculate the lineages /pseudotime curves. No start or end states were specified, resulting in five separate trajectories for VSM/Adipocyte cells.
VISION26 was used for annotating the sources of variation in the scRNA-seq data using Hallmark gene sets signatures from MSigDB45,46.
Human BAT Single-nuclei RNA-sequencing data analysis
snRNA-seq data from human neck fat (accession code E-MTAB-8564) was downloaded from Array Express. A quality check was first performed based on the barcode rank plot generated using the barcodeRanks command in the DropletUtils package in R. Lack of an inflection point between cellular and empty barcodes in the barcode rank plot indicated a high degree of background RNA contamination. As a result, of the 9 samples analyzed, 5 samples were removed due to high background RNA contamination. The other 4 samples passed the quality check (H-BAT_nF_1, H-BAT_nF_2, H-BAT_nF_3, and H-BAT_nF_4) and were used for subsequent analyses. For each of the 4 high-quality samples, the top 1000 barcodes based on UMI count were used for downstream analyses. For doublet removal, barcodes with UMI count greater than 20,000 were filtered out, and all 4 datasets were then concatenated together to form one anndata object using the adata.concatenate command in Scanpy, with batch_key parameter set to batch_indices. Setting batch_key parameters allowed us to annotate each of the four datasets as an individual batch for downstream batch-effect correction (or data integration). Data integration was performed using scVI based on the top 2000 most variable genes determined using the subsample_genes command. Data integration itself was implemented using the VAE command in scVI with n_epochs = 400, lr = 1e-3, use_batches = True, reconstruction_loss ="nb, and n_latent =20. The output from scVI was a 20-dimension latent space representation (much like PCA but inferred using deep generative modeling) with batch-specific noise removed. UMAP representation was then generated using the sc.pp.neighbors (adata, use_rep="X_scVI", n_neighbors=15) and sc.tl.umap (dataset, min_dist=0.3) commands in Scanpy, using the scVI latent space representation as input for neighborhood graph construction. The integrated anndata, along with latent space and UMAP representations were then used as input to create Seurat object for downstream clustering. Upon marker identification, the adipocyte and adipocyte progenitor clusters were subsetted and re-clustered again as described above.
Flow cytometry and FACS
Adipocytes and SVF were isolated from BAT and ingWAT of Trpv1cre Rosa26mTmG as described above. Adipocytes were collected from the top layer, filtered through a 200 μm cell strainer, washed with 3% BSA in PBS, and centrifuged at 30 g for 5 minutes. The washing step was repeated three times and adipocytes were immediately used for FACS. The cells were stained with fluorescently conjugated antibodies listed in Supplementary Table 2.
Staining for SMA (Acta2) was performed using an intracellular flow cytometry staining protocol. After staining for the cell surface antigens, the SVF cells were fixed in Fixation Buffer (BioLegend Cat. No. 420801) in the dark for 20 minutes at room temperature. The Fixation Buffer was removed by centrifuging the samples at 350 x g for 5 minutes. Fixed cells were resuspended twice in Permeabilization Wash Buffer (BioLegend Cat. No. 421002) and centrifuged at 350 x g for 5-10 minutes. Fixed/permeabilized cells were resuspended in residual Permeabilization Wash Buffer and incubated with APC-conjugated Anti-alpha-Smooth Muscle Actin antibody (1:200 dilution, Fisher Scientific Cat. No. IC1420A) for 20 minutes in the dark at room temperature before they were washed twice with 2 ml of Permeabilization Wash Buffer and centrifuged at 350 x g for 5 minutes.
Detection of EdU labeling was performed using Click-iT™ Plus EdU Flow Cytometry Assay Kit (ThermoFisher Scientific C10634) according to the manufacturer instructions.
BD FACSAria (Becton Dickinson) was used to detect signals. Adipocytes were sorted using a 70um nozzle pressurized to 70psi. Data were collected using DIVA (Becton Dickinson) software and analyzed using FlowJo software (Tree Star, Inc.). Debris and dead cells were excluded by forward and side scatter gating.
After sorting, adipocytes and SVFs were lazed TriPure RNA Isolation Reagent (Sigma-Aldrich) and used for RNA isolation and gene expression analysis.
RNA isolation and quantitative RT-PCR
RNA was isolated from both adipocytes and SVF samples using phenol-chloroform extraction and isopropanol precipitation. Quantitative reverse transcription-PCR (qRT-PCR) assays were performed using an ABI Prism 7900 sequence-detection system using SYBR (Roche Applied Science, Indianapolis, IN). Relative mRNA expression was calculated by the ΔCt method and the values were normalized to the expression of ARBP. The sequences of primers are provided in Supplementary Table 1.
Imaging of Whole Mounted Adipose Tissue
Adipose depots were dissected and cut into ~1.5×1.5 cm pieces and were immediately mounted onto microscope slides with water. The slides were imaged on a Zeiss LSM 710 NLO confocal microscope. Images were taken with either 40X or 20X objectives.
Immunohistochemistry
Adipose tissues were fixed in 10% formalin and embedded in paraffin. 5 μm sections were prepared and stained with primary antibodies listed in Supplementary Table 2. Briefly, sections were deparaffinized and rehydrated, followed by an antigen retrieval step in a modified citrate buffer (Dako Target Retrieval Solution, pH 6.1, Agilent). Sections were then incubated in Sudan Black (0.3% in 70% ethanol) to reduce the autofluorescence signal. Blocking was performed in Millipore blocking reagent (EMD Millipore), followed by incubating the section in primary antibody overnight at 4°C (Supplementary Table 2). The next days, slides were washed in PBST (0.1% Tween 20 in PBS) and were incubated with appropriate fluorescently labeled secondary antibodies (Invitrogen) at 1:200 dilution (Supplementary Table 2).
Detection of EdU labeling on slides was performed using Click-iT™ EdU Imaging Kit with Alexa Fluor™ 488 (ThermoFisher Scientific C10086) according to the manufacturer instructions. The EdU detection step preceded the antigen retrieval and staining with the antibodies.
The slides were mounted in mounting media with DAPI. Images were collected on a Zeiss LSM 710 NLO confocal microscope and processed with ImageJ.
In vitro differentiation
Primary SVF cells were isolated from BAT and ingWAT of 3-4 week old mice. Cells were maintained in Dulbecco’s modified Eagle’s medium (high glucose) containing 10% bovine serum at 37°C in a 5% CO2 incubator.Cells were allowed to reach confluency, and treated with induction media supplemented with 2% FBS, 20 nM insulin, 1 nM triiodothyronine (T3), 0.125 mM indomethacin, 5 μM dexamethasone, 0.5 mM IBMX, and 1 μM Rosiglitazone for 2 days. Then, cells were maintained in differentiation media supplemented with 2% FBS, 20 nM insulin, 1 nM T3, and 1 μM Rosiglitazone for 6 more days. During differentiation, media was changed every other day. Staining for neutral lipid was done using HCS LipidTOX™ Deep Red Neutral Lipid Stain (ThermoFisher Scientific, H34477).
Statistical analysis
Statistical methods were not used to predetermine the sample size. The experiments were not randomized. All imaging and counting of adipocytes were performed in a blinded manner. All statistics were calculated using Graphpad Prism and RStudio.
Extended Data
Extended Data Fig. 1. Characterization of cell types present in the BAT-SVF, related to Figure 1.
Individual gene UMAP plots showing the expression levels and distribution of representative marker genes for each cell type.
Extended Data Fig. 2. Cold-induced transcriptional changes in BAT endothelial and Schwann cells, related to Figure 1.
(a) Gene ontology (GO) enrichment analysis of the transcripts significantly upregulated in capillary endothelial cells by cold. (b) Violin plots showing the expression levels and distribution of representative upregulated transcripts for the selected GO terms. (c) Gene ontology (GO) enrichment analysis of the transcripts significantly downregulated in capillary endothelial cells by cold. (d) Violin plots showing the expression levels and distribution of representative downregulated transcripts for the selected GO terms. (e) Gene ontology (GO) enrichment analysis of the transcripts significantly upregulated in Schwann cells by cold. (f) Violin plots showing the expression levels and distribution of representative upregulated transcripts for the selected GO terms. (g) Gene ontology (GO) enrichment analysis of the transcripts significantly downregulated in Schwann cells by cold. (h) Violin plots showing the expression levels and distribution of representative downregulated transcripts for the selected GO terms.
Extended Data Fig. 3. Cold-induced transcriptional changes in vascular smooth muscles of BAT, related to Figure 1.
(a) Gene ontology (GO) enrichment analysis of the transcripts significantly upregulated in vascular smooth muscles by cold. (b) Violin plots showing the expression levels and distribution of representative upregulated transcripts for the selected GO terms. (c) Gene ontology (GO) enrichment analysis of the transcripts significantly downregulated in vascular smooth muscles by cold. (d) Violin plots showing the expression levels and distribution of representative downregulated transcripts for the selected GO terms. (e) Adipogenesis and Fatty acid metabolism gene signatures visualized on UMAP plots using VISION. (f) Pathway enrichment analysis of the top 100 genes driving the trajectory.
Extended Data Fig. 4. Trpv1 expression is restricted to adipose tissue vasculature, related to Figure 2.
Immunohistochemistry for Trpv1 in adipose tissue from mice housed at RT or cold for 7 days. Scale bars=10 μm. N=4 biologically independent animals examined in 1 experiment.
Extended Data Fig. 5. Flow cytometry analysis of adipose tissue SVF, related to Figure 2.
Representative flow cytometry analysis of BAT-SVF derived from Trpv1cre Rosa26mTmG mice. (a) Gating strategy for isolating single SVF cells from BAT-SVF based on side scatter (SSC) and forward scatter (FSC). (b) Unstained, single channel and isotype control gates for GFP and Pdgfrα. (c-f) Unstained and single channel control gates for GFP and Sca-1 (c), Pdgfrβ (d), CD81 (e) and αSMA (f) antibodies.
Extended Data Fig. 6. TRPV1 and PDGFRA expression in human adipose progenitor cells, related to Figure 2.
(a) Unsupervised clustering of adipocytes and adipocyte progenitors in the single nuclei RNA-sequencing of human deep neck adipose tissue with 5 separate clusters indicated in each color. (b) TRPV1 and (c) PDGFRA expression visualized on UMAP plots. (d) Violin plots showing the expression levels and distribution of TRPV1, PDGFRA, and adiponectin (ADIPOQ) expression in each cluster identified in panel a.
Extended Data Fig. 7. Cold recruits adipocytes from the Trpv1pos lineage in BAT, related to Figure 4.
(a) Violin plot showing the Trpv1 expression in BAT-SVF at different housing conditions. (b) Percentage of cells in brown adipocyte cluster at different housing conditions in the scRNA-seq experiment. N=4 per group. Data are presented as Means ± SEM. One-Way ANOVA with Dunnett's multiple comparisons test. (c) EdU detection followed by immunohistochemistry staining for Plin1 and GFP in BAT from mice raised from birth to 6 weeks of age in thermoneutrality and transferred to room temperature (1 week) and cold (1 week). EdU was administered for 1 week at cold. Scale bar=50 μm. N=6 biologically independent animals examined in one experiment.
Extended Data Fig. 8. Cold increases the number of GFPpos adipocytes in ingWAT, related to Figure 4.
(a) Left: Immunohistochemistry staining for GFP and Plin1 in ingWAT from mice housed at room temperature or cold for 7 days. Right: Percentage of GFPpos adipocytes (Plinpos) in ingWAT of Trpv1cre Rosa26mTmG mice housed at RT or cold (5 °C) for 7 days. N=5 mice per group, 4-11 images/mouse. Data are presented as Means ± SEM. Two-Way ANOVA with Sidak's multiple comparisons test. (b) Top: Immunohistochemistry staining for GFP and Plin1 in pgWAT from mice housed at room temperature or cold for 7 days. Bottom: Percentage of GFPpos adipocytes (Plinpos) in pgWAT of Trpv1cre Rosa26mTmG mice housed at RT or cold (5 °C) for 7 days. N=5 mice per group, 4-6 images/mouse. Data are presented as Means ± SEM. Scale bar=50 μm.
Extended Data Fig. 9. Cold recruits GFPpos beige adipocytes in WAT, related to Figure 4.
(a) Schematic presentation of housing conditions utilized in this study. To measure the contribution of the Trpv1 lineage to newly recruited beige adipocytes, Trpv1cre Rosa26mTmG mice were raised from birth in thermoneutrality to minimize beige adipogenesis, after which a cohort of animals was first moved to room temperature for one week followed by one week of cold exposure (TN → Cold). The control group was kept at TN the whole time (TN → TN). (b) Left: Immunohistochemistry staining for UCP1 and GFP in ingWAT. Right: Percentage of UCP1neg (unilocular) and UCP1pos (multilocular) GFPpos adipocytes in each group. N=5 mice per group, 6-11 images/mouse. Data are presented as Means ± SEM. Scale bar=50 μm. (c) EdU detection followed by immunohistochemistry staining for Plin1 and GFP in ingWAT from mice housed in the TN → Cold condition. EdU was administered for 1 week at cold. Scale bar=100 μm. N=2 biologically independent animals examined in one experiment. (d) Left: Immunohistochemistry staining for Plin1 and GFP in pgWAT. Right: Percentage of GFPpos adipocytes in each group. N=5 mice per group, 4-5 images/mouse. Data are presented as Means ± SEM. Scale bar=100 μm.
Extended Data Fig. 10. Brown adipocytes derived from the Trpv1pos progenitors are highly thermogenic, related to Figure 4.
(a-d) Expression of the indicated transcripts in tdTomatopos and GFPpos adipocytes isolated from BAT and ingWAT of Trpv1cre Rosa26mTmG mice housed at cold for 7 days. N=6 mice per group. Data are presented as Means ± SEM. Two-Way ANOVA with Sidak's multiple comparisons test.
Supplementary Material
Supplementary Table 1. qPCR primer sequences.
Supplementary Table 2. List of the antibodies.
Supplementary Data 1 Marker genes for clusters of cells in BAT-SVF identified using Seurat. As a default, Seurat performs differential expression based on the non-parameteric Wilcoxon rank sum test.
Supplementary Data 2 List of differentially expressed transcripts in Pdgfrα+ APCs (AP_8 and AP_9), capillary endothelial cells (EC_4), VSMs (all VSM clusters), and Schwann cells (Schwann cells_14) identified using the likelihood ratio test (LRT).
Acknowledgments
This work was supported in part by US National Institutes of Health (NIH) grants R01DK077097, R01DK102898 R01DK122808 (to Y.-H.T.), K01DK125608 (to F.S.), K01DK111714 (to M.D.L), P30DK036836 (to Joslin Diabetes Center’s Diabetes Research Center) from the National Institute of Diabetes and Digestive and Kidney Diseases, grant #1-18-PDF-169 (to F.S.) from American Diabetes Association, and CZF2019-002454 from the Chan Zuckerberg foundation (to Y.-H.T. and A.S.). Work by M.P. at the Harvard Chan Bioinformatics Core was funded by the Harvard Stem Cell Institute's Center for Stem Cell Bioinformatics. We thank Alison Marotta for technical assistance.
Footnotes
Competing Interests Statement
The authors declare no competing interest.
Data Availability
The authors declare that the data supporting the findings of this study are available within the paper and its supplementary information files. scRNA-sequencing data are deposited at the Gene Expression Omnibus (GSE160585).
References
- 1.Kajimura S & Saito M A new era in brown adipose tissue biology: molecular control of brown fat development and energy homeostasis. Annu Rev Physiol 76, 225–249, doi: 10.1146/annurev-physiol-021113-170252 (2014). [DOI] [PMC free article] [PubMed] [Google Scholar]
- 2.Nedergaard J, Wang Y & Cannon B Cell proliferation and apoptosis inhibition: essential processes for recruitment of the full thermogenic capacity of brown adipose tissue. Biochim Biophys Acta Mol Cell Biol Lipids 1864, 51–58, doi: 10.1016/j.bbalip.2018.06.013 (2019). [DOI] [PubMed] [Google Scholar]
- 3.Hepler C, Vishvanath L & Gupta RK Sorting out adipocyte precursors and their role in physiology and disease. Genes Dev 31, 127–140, doi: 10.1101/gad.293704.116 (2017). [DOI] [PMC free article] [PubMed] [Google Scholar]
- 4.Berry DC, Stenesen D, Zeve D & Graff JM The developmental origins of adipose tissue. Development 140, 3939–3949, doi: 10.1242/dev.080549 (2013). [DOI] [PMC free article] [PubMed] [Google Scholar]
- 5.Seale P et al. PRDM16 controls a brown fat/skeletal muscle switch. Nature 454, 961–967, doi: 10.1038/nature07182 (2008). [DOI] [PMC free article] [PubMed] [Google Scholar]
- 6.Sebo ZL, Jeffery E, Holtrup B & Rodeheffer MS A mesodermal fate map for adipose tissue. Development 145, doi: 10.1242/dev.166801 (2018). [DOI] [PMC free article] [PubMed] [Google Scholar]
- 7.Lang D et al. Pax3 functions at a nodal point in melanocyte stem cell differentiation. Nature 433, 884–887, doi: 10.1038/nature03292 (2005). [DOI] [PubMed] [Google Scholar]
- 8.Sanchez-Gurmaches J et al. PTEN loss in the Myf5 lineage redistributes body fat and reveals subsets of white adipocytes that arise from Myf5 precursors. Cell Metab 16, 348–362, doi: 10.1016/j.cmet.2012.08.003 (2012). [DOI] [PMC free article] [PubMed] [Google Scholar]
- 9.Cannon B & Nedergaard J Brown adipose tissue: function and physiological significance. Physiol Rev 84, 277–359, doi: 10.1152/physrev.00015.2003 (2004). [DOI] [PubMed] [Google Scholar]
- 10.Chouchani ET & Kajimura S Metabolic adaptation and maladaptation in adipose tissue. Nat Metab 1, 189–200, doi: 10.1038/s42255-018-0021-8 (2019). [DOI] [PMC free article] [PubMed] [Google Scholar]
- 11.Geloen A, Collet AJ, Guay G & Bukowiecki LJ Beta-adrenergic stimulation of brown adipocyte proliferation. Am J Physiol 254, C175–182, doi: 10.1152/ajpcell.1988.254.1.C175 (1988). [DOI] [PubMed] [Google Scholar]
- 12.Bukowiecki LJ, Geloen A & Collet AJ Proliferation and differentiation of brown adipocytes from interstitial cells during cold acclimation. Am J Physiol 250, C880–887, doi: 10.1152/ajpcell.1986.250.6.C880 (1986). [DOI] [PubMed] [Google Scholar]
- 13.Lee YH, Petkova AP, Konkar AA & Granneman JG Cellular origins of cold-induced brown adipocytes in adult mice. FASEB J 29, 286–299, doi: 10.1096/fj.14-263038 (2015). [DOI] [PMC free article] [PubMed] [Google Scholar]
- 14.Berry DC, Jiang Y & Graff JM Mouse strains to study cold-inducible beige progenitors and beige adipocyte formation and function. Nat Commun 7, 10184, doi: 10.1038/ncomms10184 (2016). [DOI] [PMC free article] [PubMed] [Google Scholar]
- 15.Long JZ et al. A smooth muscle-like origin for beige adipocytes. Cell Metab 19, 810–820, doi: 10.1016/j.cmet.2014.03.025 (2014). [DOI] [PMC free article] [PubMed] [Google Scholar]
- 16.Menigoz A & Boudes M The expression pattern of TRPV1 in brain. J Neurosci 31, 13025–13027, doi: 10.1523/JNEUROSCI.2589-11.2011 (2011). [DOI] [PMC free article] [PubMed] [Google Scholar]
- 17.Caterina MJ et al. The capsaicin receptor: a heat-activated ion channel in the pain pathway. Nature 389, 816–824, doi: 10.1038/39807 (1997). [DOI] [PubMed] [Google Scholar]
- 18.Storozhuk MV, Moroz OF & Zholos AV Multifunctional TRPV1 Ion Channels in Physiology and Pathology with Focus on the Brain, Vasculature, and Some Visceral Systems. Biomed Res Int 2019, 5806321, doi: 10.1155/2019/5806321 (2019). [DOI] [PMC free article] [PubMed] [Google Scholar]
- 19.Butler A, Hoffman P, Smibert P, Papalexi E & Satija R Integrating single-cell transcriptomic data across different conditions, technologies, and species. Nat Biotechnol 36, 411–420, doi: 10.1038/nbt.4096 (2018). [DOI] [PMC free article] [PubMed] [Google Scholar]
- 20.Becht E et al. Dimensionality reduction for visualizing single-cell data using UMAP. Nat Biotechnol, doi: 10.1038/nbt.4314 (2018). [DOI] [PubMed] [Google Scholar]
- 21.Lun ATL & Marioni JC Overcoming confounding plate effects in differential expression analyses of single-cell RNA-seq data. Biostatistics 18, 451–464, doi: 10.1093/biostatistics/kxw055 (2017). [DOI] [PMC free article] [PubMed] [Google Scholar]
- 22.MacDougald OA & Mandrup S Adipogenesis: forces that tip the scales. Trends Endocrinol Metab 13, 5–11, doi: 10.1016/s1043-2760(01)00517-3 (2002). [DOI] [PubMed] [Google Scholar]
- 23.Liu J et al. Changes in integrin expression during adipocyte differentiation. Cell Metab 2, 165–177, doi: 10.1016/j.cmet.2005.08.006 (2005). [DOI] [PubMed] [Google Scholar]
- 24.Xue Y et al. Hypoxia-independent angiogenesis in adipose tissues during cold acclimation. Cell Metab 9, 99–109, doi: 10.1016/j.cmet.2008.11.009 (2009). [DOI] [PubMed] [Google Scholar]
- 25.Street K et al. Slingshot: cell lineage and pseudotime inference for single-cell transcriptomics. BMC Genomics 19, 477, doi: 10.1186/s12864-018-4772-0 (2018). [DOI] [PMC free article] [PubMed] [Google Scholar]
- 26.DeTomaso D et al. Functional interpretation of single cell similarity maps. Nat Commun 10, 4376, doi: 10.1038/s41467-019-12235-0 (2019). [DOI] [PMC free article] [PubMed] [Google Scholar]
- 27.Jiang Y, Berry DC, Tang W & Graff JM Independent stem cell lineages regulate adipose organogenesis and adipose homeostasis. Cell Rep 9, 1007–1022, doi: 10.1016/j.celrep.2014.09.049 (2014). [DOI] [PMC free article] [PubMed] [Google Scholar]
- 28.Tang W et al. White fat progenitor cells reside in the adipose vasculature. Science 322, 583–586, doi: 10.1126/science.1156232 (2008). [DOI] [PMC free article] [PubMed] [Google Scholar]
- 29.Vishvanath L et al. Pdgfrbeta+ Mural Preadipocytes Contribute to Adipocyte Hyperplasia Induced by High-Fat-Diet Feeding and Prolonged Cold Exposure in Adult Mice. Cell Metab 23, 350–359, doi: 10.1016/j.cmet.2015.10.018 (2016). [DOI] [PMC free article] [PubMed] [Google Scholar]
- 30.Rodeheffer MS, Birsoy K & Friedman JM Identification of white adipocyte progenitor cells in vivo. Cell 135, 240–249, doi: 10.1016/j.cell.2008.09.036 (2008). [DOI] [PubMed] [Google Scholar]
- 31.Gupta RK et al. Zfp423 expression identifies committed preadipocytes and localizes to adipose endothelial and perivascular cells. Cell Metab 15, 230–239, doi: 10.1016/j.cmet.2012.01.010 (2012). [DOI] [PMC free article] [PubMed] [Google Scholar]
- 32.Oguri Y et al. CD81 Controls Beige Fat Progenitor Cell Growth and Energy Balance via FAK Signaling. Cell 182, 563–577 e520, doi: 10.1016/j.cell.2020.06.021 (2020). [DOI] [PMC free article] [PubMed] [Google Scholar]
- 33.Sun W et al. snRNA-seq reveals a subpopulation of adipocytes that regulates thermogenesis. Nature, doi: 10.1038/s41586-020-2856-x (2020). [DOI] [PubMed] [Google Scholar]
- 34.Cavanaugh DJ et al. Trpv1 reporter mice reveal highly restricted brain distribution and functional expression in arteriolar smooth muscle cells. J Neurosci 31, 5067–5077, doi: 10.1523/JNEUROSCI.6451-10.2011 (2011). [DOI] [PMC free article] [PubMed] [Google Scholar]
- 35.Shao M et al. Cellular Origins of Beige Fat Cells Revisited. Diabetes 68, 1874–1885, doi: 10.2337/db19-0308 (2019). [DOI] [PMC free article] [PubMed] [Google Scholar]
- 36.Lee YH, Petkova AP, Mottillo EP & Granneman JG In vivo identification of bipotential adipocyte progenitors recruited by beta3-adrenoceptor activation and high-fat feeding. Cell Metab 15, 480–491, doi: 10.1016/j.cmet.2012.03.009 (2012). [DOI] [PMC free article] [PubMed] [Google Scholar]
- 37.Szallasi A, Cortright DN, Blum CA & Eid SR The vanilloid receptor TRPV1: 10 years from channel cloning to antagonist proof-of-concept. Nat Rev Drug Discov 6, 357–372, doi: 10.1038/nrd2280 (2007). [DOI] [PubMed] [Google Scholar]
- 38.Yoshioka M et al. Effects of red pepper on appetite and energy intake. Br J Nutr 82, 115–123 (1999). [PubMed] [Google Scholar]
- 39.Westerterp-Plantenga MS, Smeets A & Lejeune MP Sensory and gastrointestinal satiety effects of capsaicin on food intake. Int J Obes (Lond) 29, 682–688, doi: 10.1038/sj.ijo.0802862 (2005). [DOI] [PubMed] [Google Scholar]
- 40.Masuda Y et al. Upregulation of uncoupling proteins by oral administration of capsiate, a nonpungent capsaicin analog. J Appl Physiol (1985) 95, 2408–2415, doi: 10.1152/japplphysiol.00828.2002 (2003). [DOI] [PubMed] [Google Scholar]
- 41.Zhang LL et al. Activation of transient receptor potential vanilloid type-1 channel prevents adipogenesis and obesity. Circ Res 100, 1063–1070, doi: 10.1161/01.RES.0000262653.84850.8b (2007). [DOI] [PubMed] [Google Scholar]
- 42.Motter AL & Ahern GP TRPV1-null mice are protected from diet-induced obesity. FEBS Lett 582, 2257–2262, doi: 10.1016/j.febslet.2008.05.021 (2008). [DOI] [PMC free article] [PubMed] [Google Scholar]
- 43.Hafemeister C & Satija R Normalization and variance stabilization of single-cell RNA-seq data using regularized negative binomial regression. Genome Biol 20, 296, doi: 10.1186/s13059-019-1874-1 (2019). [DOI] [PMC free article] [PubMed] [Google Scholar]
- 44.Love MI, Huber W & Anders S Moderated estimation of fold change and dispersion for RNA-seq data with DESeq2. Genome Biol 15, 550, doi: 10.1186/s13059-014-0550-8 (2014). [DOI] [PMC free article] [PubMed] [Google Scholar]
- 45.Subramanian A et al. Gene set enrichment analysis: a knowledge-based approach for interpreting genome-wide expression profiles. Proc Natl Acad Sci U S A 102, 15545–15550, doi: 10.1073/pnas.0506580102 (2005). [DOI] [PMC free article] [PubMed] [Google Scholar]
- 46.Liberzon A et al. Molecular signatures database (MSigDB) 3.0. Bioinformatics 27, 1739–1740, doi: 10.1093/bioinformatics/btr260 (2011). [DOI] [PMC free article] [PubMed] [Google Scholar]
Associated Data
This section collects any data citations, data availability statements, or supplementary materials included in this article.
Supplementary Materials
Supplementary Table 1. qPCR primer sequences.
Supplementary Table 2. List of the antibodies.
Supplementary Data 1 Marker genes for clusters of cells in BAT-SVF identified using Seurat. As a default, Seurat performs differential expression based on the non-parameteric Wilcoxon rank sum test.
Supplementary Data 2 List of differentially expressed transcripts in Pdgfrα+ APCs (AP_8 and AP_9), capillary endothelial cells (EC_4), VSMs (all VSM clusters), and Schwann cells (Schwann cells_14) identified using the likelihood ratio test (LRT).
Data Availability Statement
The authors declare that the data supporting the findings of this study are available within the paper and its supplementary information files. scRNA-sequencing data are deposited at the Gene Expression Omnibus (GSE160585).


