Figure 1:
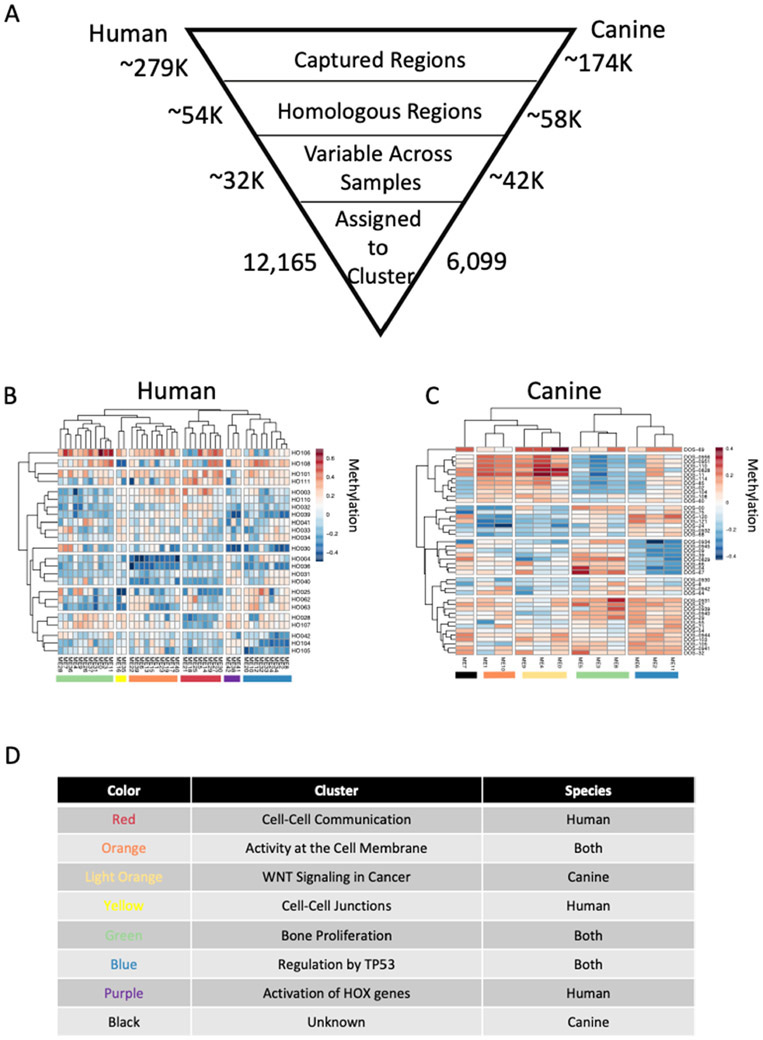
Genome wide DNA methylation patterns in canine and human osteosarcoma samples. Summary of analysis and the number of genomic regions included in each step (A). DNA methylation values were calculated at homologous genomic regions in canine (B, n=44) and human (C, n=24) primary osteosarcoma tumor samples. Genomic regions were clustered based on correlation in each species resulting in 12 canine clusters and 43 human clusters containing genomic regions that have highly correlated methylation values across all osteosarcoma samples. Heatmaps represent the weighted average DNA methylation value for the cluster in each sample. Red is a high methylation value and blue is a lower methylation value. Pathway analysis was performed using Reactome on the gene nearest (<=1,000bp) the underlying genomic region in each DNA methylation cluster. Clusters that share many of the same pathways are color coded the same in B and C and a summary of the pathways is given for each colored block in D. The unknown cluster did not have any significantly enriched pathways.

