

Abstract
The beer is a widely consumed drink, appreciated for its sensory characteristics, and it also contains beneficial compounds for health derived from its raw materials. In this work, the influence of coloured malt on the main quality parameters of a top-fermenting beer was evaluated. The beers were produced increasing the percentage of coloured malt (0, 5, 15% Caraamber®) respect to the pale ale base malt. The beers had an alcohol content ranging from 6.2 to 6.8 vol%; the results highlighted a deeper colour, increased bitterness and turbidity in beer with the highest amount of Caraamber malt. This latter showed the highest polyphenols (453.8 mg GAE/L) and antioxidant activity (840.1 µmol TE/L) and, on the other hand, the lowest foam stability. The volatiles profile showed a higher amount of aldehydes and ketones in beer with the highest percentage of caramel malt but the lowest in higher alcohols and esters. No differences were found in the fruity-esters, alcoholic and caramel sensory notes; while the beer made with 15% of coloured malt was perceived sweeter and with less fruity citrus notes than other beer samples.
Keywords: Beer, Malt, Antioxidants, Aroma, Sensory, Quality
Introduction
Beer is an alcoholic beverage widely consumed throughout the world and currently is the third beverage most consumed in the world, after water and tea (Piazzon et al. 2010; Liguori et al. 2018a). Beer is consumed by everyone for pleasure, to quench the thirst or only to socialize. It is a drink appreciated worldwide for its unique sensory characteristics. From a nutritional point of view, the beer contains beneficial compounds of interest (amino acids, peptides, Vitamin B, phenolic compounds, and other bioactive compounds). The percentage of raw materials in the beer recipe coupled with the technological parameters that can be applied during the brewing process allow to produce a huge variety of beers different in sensory parameters that define a specific style. Pale malt is the most common malt used for the production of beer. On the base of temperature and time used in the kilning, it is possible to produce different malts principally in dark colours (coloured malts, caramel malts and roasted malts) (Coghe et al. 2004) because of the Mallard reaction extent of which influences the chemical composition too. The economic and quality determinants of malt quality for brewers are extract and fermentability (Evans et al. 2014). Furthermore, malt provides proteins, free amino nitrogen (FAN), and enzymes that facilitate fermentation reactions in brewing but an excessive residue of saccharides and FAN can cause sweet beer or butterscotch flavour, respectively (Bokulich and Bamforth 2013). Although detailed malt analysis can provide information on its applicability in the brewing process and its capability to influence chemical and sensory parameters of beer, there is no clear scientific relationship between the chemical composition of malt and the final quality of beer. To our knowledge, only some studies were performed on the influence of malt type in the recipe on the final quality of produced beer. Coghe et al. (2003) investigated the influence of different dark malts used in different percentage on wort fermentation and on flavour compounds in the final beers (Coghe et al. 2005). More recently, Bettenhausen et al. (2018) investigated the effect of barley source and malt metabolites on beer flavour and flavour stability. The same authors, later, evaluated the effects of genetically distinct malts on sensory attributes and volatiles in beer (Bettenhausen et al. 2020). Mikyška and Psota (2019) showed some specific characteristics of barley varieties and the qualitative markers of malt on the chemical and sensory profile of lager beer. With the aim to obtain more information and deeper knowledge of the influence of the specialty malts on the main chemical and sensory characteristics of beer, this study focused on the use of different percentage of Caraamber malt on the main quality parameters of a top-fermenting beer.
Materials and methods
Materials
All chemicals including gallic acid (99%) and DPPH (2,2-Diphenyl-1-picrylhydrazyl radical) were acquired from Sigma-Aldrich®; the Folin–Ciocalteu’s phenol reagent was purchased from Sinopharm Chemical Reagent (Shanghai, China). The malts (Pale Ale and Caraamber® grains) were bought from Weyermann (Bamberg, Germany). Challenger and East Kent Golding hops and top-fermenting yeast, Safale S-04 Fermentis, were provided from Mr. Malt® (P.a.b. s.r.l., Pasian di Prato, Udine, Italy).
Methods
Beer production
Three different malt recipes were used: Pale Ale 100%—Caraamber® 0%; Pale Ale 95%—Caraamber® 5%; Pale Ale 85%—Caraamber® 15%.
The wort was produced in 50 L in the pilot scale brewery at Food Technology Laboratory (University of Salerno, Italy). The grains used were Pale Ale and Caraamber® in different percentage (85–95–100%) and (15–5–0%) respectively. Challenger hop (5.8% α-acids) was used to add bitterness. The wort was produced by a multiple step infusion mashing (Table 1). 13.5 kg of malt was crushed and mixed with 54 L of heated water into the mash tun for the mashing process. 10 mL of lactic acid solution (80%) was used to regulate the pH of the mash to about 5.8. After mashing, the mash extract was drawn off from lauter tun and, at the same time, an additional 20 L of water with a pH 5.2 was sprinkled over for the sparging process. Boiling time was for 60 min and Challenger and East Kent Golding hops were added first and 5 min before the end of boiling (Table 1), followed by a clarification into the whirlpool vessel. 45 L of the clarified wort was added with 11.5 g of dry top-fermenting yeast (Safale S-04, Fermentis). The fermentation was performed at 20 °C for 7 days, and then the temperature was cooled down to 4 °C over the following 15 days in a maturation vessel. After racking, the rough beer was stored in a maturation vessel under a slight CO2 overpressure at 4.0 ± 0.5 °C for about 15 days and then bottled.
Table 1.
Mashing schedule performed for wort process
| Two-roll milling (mm) | Water/grist ratio | Mashing steps | Hops Pellet/IBU |
Boiling/min | Yeast strain | |
|---|---|---|---|---|---|---|
|
Pale Ale Cara Amber |
1 | 4:1 |
60′ at 67 °C 5′ at 78 °C |
Challenger/20 IBU/1 g/L East Kent Golding/5 IBU/1.43 g/L |
60 | Top fermenting yeast |
The produced beers were codified as 100 PA 95 PA and 85 PA, according to the percentage of pale ale malt amount used in the recipe.
Chemical analyses
The main quality attributes (alcohol content, pH, colour, turbidity, bitterness, O2 and CO2 content and foam stability) of the three beers were investigated. All the analyses were performed according to Analytica European Brewing Convention (EBC) methods (2010). The foam collapse velocity was calculated as foam height decrease vs time. The total phenols content was determined with the Folin-Ciocalteu (FC) assay (Singleton and Rossi 1965). Gallic acid as reference compound was used for calibration curve and results were expressed as gallic acid equivalent (GAE) mg/L beer (Russo et al. 2019). The identification of phenolic compounds was carried out by HPLC, using an Agilent 1100 chromatograph (Agilent, Santa Clara, USA). Chromatographic separation was performed on a RP-Amide Ascentis column (15 cm × 4.6 mm, 5 μm) (Supelco, Sigma-Aldrich Co, Darmstadt, Germany). The UV detector was set at 280 nm; the flow rate was 1.0 mL/min and mobile phase was 0.085% orthophosphoric acid (A) and acetonitrile (B) following this gradient: 85% A, 15% B at zero time, 65% A and 35% B for 30 min and 15% A and 85% B for 5 min (Liguori et al. 2019). The antioxidant activity (AA) was evaluated by the DPPH scavenging method (Brand-Williams et al. 2005) using a spectrophotometer (Perkin Elmer, Lambda Bio 40, Milano, Italy). The percentage inhibition of remaining DPPH was calculated according to the literature (Liguori et al. 2018b; Corona et al. 2019). A calibration curve of Trolox standard was used and results were expressed as Trolox equivalent (TE) μmol/L beer. Furthermore, the antioxidant activity was expressed as EC50 value, defined as the volume (μL) required to decrease the initial DPPH radical activity by 50%. The volatile compounds concentration was determined by Gas Chromatograph (Agilent Technologies 6850, Milano, Italy) equipped with Mass Spectrometer (Agilent Technologies 5975C, Milano, Italy) and with a Maestro Autosampler Gerstel Multi-Purpose Sampler (SPME GC/MS). The method used was based on that developed by Vesely et al. (2003) and subsequently slightly modified (De Francesco et al. 2015). The analyses were carried out in duplicate.
Sensory analysis
The sensory analysis was carried out by a trained panel (composed by 12 judges aged between 25 and 45 years) through description analysis according to Analytica-EBC method 13.10 (2010). The panellists were asked to describe, in the three beers under evaluations, 11 flavour attributes for the taste (fruity/esters, alcoholic/solvent, fruity/citrus, malty, caramel, bitter, sweet, sour, astringent, body, and linger) and 6 flavour attributes for the aroma (fruity/esters, alcoholic/solvent, fruity-citrus, malty, caramel, and sweet). For each attribute, a score was assigned ranging from 0 to 9. A score of 0 meant that the attribute was absent whereas a score of 9 indicated that the attribute was extremely strong. Both replicates of each beer were blind-tested and the mean of the results was reported in spider plots. Sensory descriptive data were also submitted to Principal Component Analysis (Unscrambler v10.4, CAMO Software, Norway).
Statistical analysis
Brewing trials and analytical measurements were carried out in triplicate and mean values and standard deviation values were subjected to monofactorial variance analysis (ANOVA). The significance of differences (p < 0.05) among samples was determined by Student’s t-test. Principal Component Analysis (PCA) on taste sensory attributes of beers was performed. All statistical analyses were performed using STATA Software 12.0 (Stata Corp LLC, Lakeway Drive, College Station, Texas, USA).
Results and discussion
Chemical analyses
The produced beers had an alcohol content (Table 2) in the range 6.2–6.8 vol%. The parameter apparent attenuation showed significant difference (p < 0.05) of 100 PA compared to 85 PA sample. In this case, as expected, special malts give less attenuation to beer, due to lower diastatic power and lower yeast nutrients content (Yu et al. 2018). Furthermore, Coghe et al. (2005) suggested that the less fermentable extract might also be ascribed to Maillard reactions during the production of roasted malt, which compounds are unavailable for enzymatic hydrolysis. The Maillard compounds could also inhibit the metabolism of yeast cell (Coghe et al. 2005). The colour of beer is one of the basic sensory attributes, being part of the beer’s style and of the given beer brand. It is related to the beer composition and the technical and technological conditions of brewing process (Mikyška and Psota 2019). The main components related to the colour of beer are components of malts and adjuncts which are modified during the malting process due to browning reactions and, in some time, further caramelization can take place during wort boiling.
Table 2.
Quality parameters of 85 PA, 95 PA and 100 PA beer samples
| Parameters | 85 PA | 95 PA | 100 PA |
|---|---|---|---|
| Original extract (wt%) | 15.5 ± 0.1a | 16.2 ± 0.1b | 15.3 ± 0.1a |
| Ethanol (% vol) | 6.2 ± 0.3a | 6.8 ± 0.2b | 6.6 ± 0.2ab |
| Apparent attenuation (wt%) | 74 ± 2a | 75 ± 2a | 76 ± 2a |
| pH | 4.13 ± 0.05a | 4.24 ± 0.05a | 4.22 ± 0.05a |
| Colour (EBC- Units) | 62 ± 2c | 45 ± 2b | 24 ± 1a |
| Turbidity (EBC- Units) | 24.5 ± 0.1c | 21.3 ± 0.1b | 16.8 ± 0.1a |
| Polyphenols (mg GAE/L) | 453 ± 28b | 441 ± 11b | 353 ± 12a |
| Antioxidant activity (EC50) | 237 ± 2a | 255 ± 1b | 267 ± 1c |
| Antioxidant activity (µmol TE/L) | 840 ± 15b | 822 ± 15b | 792 ± 40a |
| Bitterness (International Bitterness Units) | 25 ± 1c | 23 ± 1b | 17 ± 1a |
| O2 (µg/L) | 25 ± 2b | 17 ± 2a | 18 ± 2a |
| CO2 (mg/L) | 5.0 ± 0.1a | 5.3 ± 0.1c | 5.1 ± 0.1b |
| Foam stability Nibem 30 mm (s) | 226 ± 14a | 257 ± 14b | 245 ± 14b |
| Gallic acid (mg/L) | 9.62 ± 0.25b | 8.76 ± 0.20a | 14.84 ± 0.40c |
| Chlorogenic acid (mg/L) | 4.59 ± 0.20c | 2.46 ± 0.20b | 1.88 ± 0.18a |
| Vanillic acid (mg/L) | 1.50 ± 0.08a | 2.17 ± 0.10b | 2.53 ± 0.15c |
| Caffeic acid (mg/L) | 2.47 ± 0.10a | 2.55 ± 0.05a | 2.55 ± 0.10a |
| p-Coumaric acid (mg/L) | 0.27 ± 0.05a | 0.79 ± 0.08c | 0.41 ± 0.07b |
| Benzoic acid (mg/L) | 0.65 ± 0.10a | 0.86 ± 0.10b | 0.89 ± 0.12b |
| Ferulic acid (mg/L) | 5.63 ± 0.22b | 4.08 ± 0.18a | 9.17 ± 0.30c |
Different lowercase letters within a row indicate significant differences (p < 0.05)
The colour detected in beer samples showed values ranging from about 24 to 62 EBC unit, depending on the amount of the used caramel malt (Caraamber®) (Table 2). The results were in accordance with the study reported by Coghe et al. (2005) who reported the colour of beer increased with increasing levels of high coloured special malt or with the use of darker malts.
Another parameter influenced by malt composition is the polyphenols content which was found to be higher (p < 0.05) in 85 PA and 95 PA beers than in 100 PA. The malt, in fact, is the main source (80%) of polyphenols and antioxidant properties in beer, while the remaining 20% comes from hops (Carvalho et al. 2016; Mikyška and Psota 2019). These compounds, in sufficient quantity, contribute to some beer properties such as bitterness, astringency and colour and, serve as browning substrates, participate in chill haze formation. Moreover, polyphenols give to overall beer stability (Naczk and Shahidi 2006).
The lowest concentration of polyphenols was found in 100 PA beer, due to the absence of Caraamber® that involved both less amount of polyphenols and also of melanoidins. As reported by Ceccaroni et al. (2018), the amount of these antioxidants is higher for darker barley and malt products in comparison to lightly coloured base malts, e.g. pils, pale. Furthermore, the dark malts play an important role in maintaining the stability and flavour of beer during processing and storage (Coghe et al. 2005). The polyphenols amount detected in the three beer samples (Table 2) was in the range found in other papers on commercial beers, whose values were from 152 to 486 mg GAE/L, depending on the beer style (Baiano and Terracone 2013). The phenols in beer include phenolic acids, flavonoids, proanthocyanidins, tannins, and amino phenolic compounds, and besides to vary significantly across malt varieties and during malting; thus, different raw materials and brewing process may lead to notable differences in phenolic compounds (Piazzon et al. 2010). The free and bound phenolic acids are predominant among phenols compounds detected in beer (Wannenmacher et al. 2018). The most abundant phenolic acids in beer are gallic acid, ferulic acid and syringic acid. Gallic acid is the main hydroxybenzoic acid (Table 2) and results to be a potent antioxidant, it was also found in major amount respect to the other phenolics, according to Torres et al. (2016). Besides, ferulic acid is mainly representative of derivates cinnamic acids present in barley, malted barley and beer, in free and bound form, and, is a very effective antioxidant (Szwajgier et al. 2005). The amount of ferulic acid was in the concentration range (1.22–9.77 mg/L) found by Dabina-Bicka et al. (2013). Other phenolic acids detected in the samples in higher amount than others were caffeic acid and vanillic acid, even if they are mainly in bound form (Piazzon et al. 2010).
Antioxidant capacity is derived from individual bioactive compounds and also synergistic effects between them, trace elements, metals, and other food constituents. The antioxidant activity of the beers was evaluated by DPPH assay with the results expressed as EC50 and Trolox Equivalent. In the present study, it was observed that as the higher the amount of caramel malt (equal to 15% in 85 PA sample), the higher the antioxidant activity (Table 2). A significant correlation between polyphenols content measured by the Folin–Ciocalteau and the antioxidant activity (µmolTE/L) was found (r = 0.9278). This agrees with the results obtained by other researchers (Piazzon et al. 2010; Dabina-Bicka et al. 2013). Besides the polyphenols content, the antioxidant capacity of malt can be originated and enhanced during the kilning of malt, not only caused by the modification or release of phenolic compounds, but also because there is the development of reductones and Maillard reaction products (e.g. melanoidins) (Carvalho et al. 2016).
The bitterness is the most important hop-derived beer flavour attribute, which intensity is determined by the time and temperature of the wort boiling (Palmer 2006). Besides α-acids, other compounds contribute to the bitter taste: amino acids from the malt (e.g. L-tyrosine, L-tryptophan and L-leucine), dipeptides and cyclic diketopiperazines. In the present study, the bitterness expressed as International Bitterness Unit (IBU) gives an approximate value of iso-α-acids present in milligram of iso-α-acid per litre of beer, and reflects as well as other compounds with similar chemistry such as polyphenols and humulinones which are all readily present in beer (Oladokun et al. 2017). As detected for polyphenols 85 PA and 95 PA beers showed higher bitter concentration than 100 PA (Table 2). This difference could be attributed to malt composition and less attenuation of beers. However, there are many variables throughout the process that can affect the bitterness, such as yeast behaviour, wort pH, yeast pitching, fermentation temperature, and so on. Thus, it remains an unclear result worth of more investigation in the future.
The foam is an important characteristic for the quality of beer to avoid O2 intake and CO2 release from the beer (Gresser 2009). Different methods exist and, in this study the kinetic of collapse foam and Nibem test were reported. The decaying velocity of foam for the three beer sample was showed in Fig. 1. 100 PA beer had a foam decrease rate lower than the others, whereas 85 PA sample presented poor foam and rapidly decreased during the analysis time. Similarly by Nibem, a better foam stability was detected in 95 PA and 100 PA beers (Table 2). The lower stability in the beer sample with higher amount of Caraamber® malt can be explained by its higher content of nitrogen compounds (amino acids and oligopeptides) obtained during roasting of malt, that when in higher concentrations, are able to banish polypeptides from the film of gas bubbles, decreasing foam stability (Gresser 2009). Another important parameter that affects the appearance of the beer is the turbidity. The 85 PA differed significantly (p < 0.05) with the other samples (Table 2); the difference may be due to the highest percentage of caramel malt that contains higher amount of polypeptides, polyphenols, polysaccharides (Gresser 2009) and thus their interactions, especially between proteins and tannins contribute to the turbidity in beer.
Fig. 1.
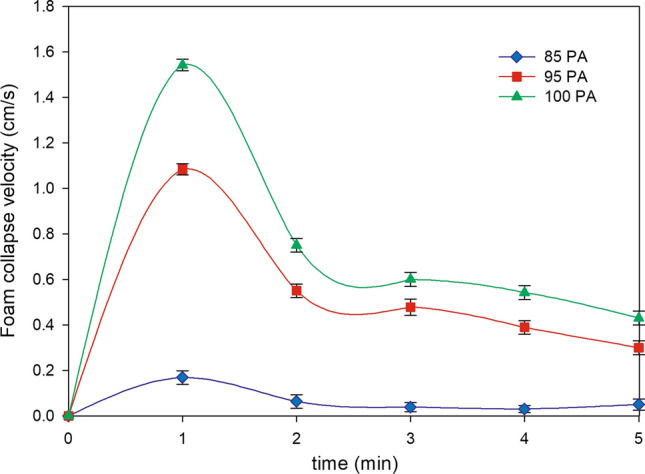
Foam collapse velocity of 85 PA, 95 PA and 100 PA beer samples
Volatile compounds
The beer aroma derives primarily from innate chemical volatile compounds of the barley malt or roasted malt, hops and yeast metabolism during fermentation and aging. The flavour of beer can also be affected by the brewing process, contaminant microorganisms and inappropriate storage conditions (i.e. oxygen and sunlight exposition).
The principal volatile compounds, identified in beer, were divided into 4 classes: higher alcohols, esters, carbonyl compounds such as aldehydes and ketones and sulphur-containing compounds. Ethanol gives off an alcoholic odour but also acts as a carrier of the other odour-active volatile compounds. The higher alcohols are produced by yeasts metabolism and impart a range of organoleptic attributes such as alcoholic, fruity, pungent, solvent-like and rose-like or floral, depending on the concentration and type of alcohol (Liu 2015) and they may be important because of their involvement in the production of esters (Cioch-Skoneczny et al. 2019).
Amyl alcohols (3-methyl-butanol and 2-methyl-butanol) were abundant and it is reported to be the most quantitatively significant flavour compound, responsible for fruity notes as well as ‘alcoholic’ flavour and aroma. The other aliphatic alcohols are responsible for “solvent” aroma of beer and produce a warm mouthfeel. 2-Phenylethanol is also important in some beers, imparting a rose or floral aroma. The higher alcohols are esters precursors, contributing to acetate esters formation and hence their amount influence the beer flavour.
95 PA and 100 PA beers showed a higher amount of fusel (or higher) alcohols higher than 85% and among them isoamyl alcohols and 2-phenylethanol showed the highest concentration These compounds were predominant also in 85 PA sample even if in lower amounts.
The esters are the most important group of yeast fermentation-derived compounds and they impart fruity, floral and solvent-like flavours and aromas to beers. Ethyl acetate is typically the most representative ester, with a fruity and solvent-like flavour) and in the analysed beer samples, it was almost the 90% of esters, in accordance with what reported elsewhere representing approximately one-third of all esters in beer (Jespersen and Jakobsen 1996). The second abundant ester is isoamyl acetate and the total esters amount was higher in 95 PA and 100 PA samples than 85 PA, which showed a higher quantity of aldehydes and ketones (Table 3).
Table 3.
Volatile compounds concentration in 85 PA, 95 PA and 100 PA beer samples
| Compounds | Flavour | 85 PA | 95 PA | 100 PA |
|---|---|---|---|---|
| 1-Propanol (mg/L) | Alcohol | 20.86 ± 0.55a | 31.28 ± 1.08b | 28.91 ± 0.02c |
| 2-Methyl-Propanol (mg/L) | Alcohol | 82.67 ± 1.53b | 82.52 ± 0.78b | 69.82 ± 0.14a |
| 3-Methyl-Butanol (mg/L) | Alcohol, banana, sweetish, aromatic | 59.84 ± 0.47a | 80.86 ± 0.52b | 70.88 ± 0.80c |
| 2-Methyl-Butanol (mg/L) | Alcohol, solvent, banana | 23.22 ± 0.24a | 30.38 ± 0.54c | 25.55 ± 0.35b |
| Phenyl Ethanol (mg/L) | Rose, sweetish, perfumed | 53.83 ± 7.42a | 69.76 ± 2.72b | 73.47 ± 8.06c |
| Furfuryl alcohol (mg/L) | Sugar cane, wood | 2.94 ± 0.11b | 2.28 ± 0.09a | 2.03 ± 0.20a |
| Sum of higher alcohols (mg/L) | 243.35 ± 10.31a | 297.08 ± 5.73b | 270.65 ± 9.57c | |
| Ethyl Acetate (mg/L) | Solvent, fruity, sweetish | 7.59 ± 0.23a | 31.77 ± 2.27b | 32.80 ± 0.05b |
| Ethy Butirrate (mg/L) | Butter, apple | 0.03 ± 0.00a | 0.09 ± 0.00b | 0.11 ± 0.01c |
| Isoamyl Acetate (mg/L) | Banana, apple, solvent, estery | 0.29 ± 0.01a | 1.75 ± 0.04b | 1.76 ± 0.06b |
| Ethyl Esanoate (mg/L) | Sour apple | 0.07 ± 0.00a | 0.15 ± 0.00b | 0.14 ± 0.00b |
| Ethyl Octanoate (mg/L) | Sour apple | 0.08 ± 0.01a | 0.29 ± 0.01b | 0.30 ± 0.02b |
| Sum of esters (mg/L) | 8.06 ± 0.25a | 34.05 ± 2.32b | 35.10 ± 0.14b | |
| Acetaldehyde (µg/L) | Green apple, fruity | 11,202 ± 589c | 2723 ± 303b | 1690 ± 163a |
| 2-methylbutanal (µg/L) | Green grass, fruity, sour | 7.9 ± 0.0c | 0.8 ± 0.1b | 0.2 ± 0.0a |
| 3-methylbutanal (µg/L) | Banana, apple, cherry | 29.6 ± 0.1c | 5.4 ± 0.6b | 1.8 ± 0.1 a |
| Hexanal (µg/L) | Bitter, astringent, green leaves | 9.9 ± 0.1c | 1.4 ± 0.0a | 1.5 ± 0.1b |
| Phenylacetaldehyde (µg/L) | Hyacinth, lilac | 10.1 ± 0.2c | 3.8 ± 0.1b | 2.2 ± 0.4a |
| Methional (µg/L) | Mashed potato, warm, soup-like | 9.3 ± 1.2c | 4.0 ± 0.0b | 3.2 ± 0.0a |
| Furfural (µg/L) | Bread, almond, sweet | 16.7 ± 0.6b | 7.9 ± 0.2a | 7.9 ± 0.2a |
| Sum of aldehydes (µg/L) | 11,285 ± 592c | 2746 ± 304b | 1706 ± 164a | |
| Diacetyl (µg/L) | Butter, scotch | 8.7 ± 0.1 | n.d | n.d |
| 2,3-pentandione (µg/L) | Buttery, toasty caramellic | 1.3 ± 0.1 | n.d | n.d |
| Sum of ketones (µg/L) | 10.0 ± 0.2 | n.d | n.d |
Different lowercase letters within a row indicate significant differences (p < 0.05)
The formation of aldehydes during fermentation is bound up to the formation of higher alcohols, but they result to be more flavour active than their corresponding aldehydes. Generally they are considered to contribute negative flavour attributes to beer. Concentrations of aldehydes and ketones in beer are comparatively low respect to the other volatiles: acetaldehyde is the predominant compound, usually at no more than 10 ppm. The methylbutanals are among the most important Strecker aldehydes. Originated by the degradation of amino acids they are considered contributors to aroma, considered to be responsible for the malty character (Soares Da Costa et al. 2004) and, they were detected mostly in 85 PA beer. Overall, the aldehydes content was significantly different among beers (p < 0.05). Diacetyl is produced as a by-product of fermentation and its concentration is often used as an index of the completion of beer fermentation or maturation (Petersen et al. 2004). At high concentrations (> 0.1 ppm), diacetyl may bring buttery/solvent like flavour and a rancid mouthfeel to the beer. Although for some beer styles, like stouts, scotch ales and pilsners, diacetyl concentration slightly above the threshold (0.15 mg/L) is accepted, and it brings a toffee-like described flavour (Vieira Humia et al. 2019). The other vicinal diketone (2,3-pentandione) obtained as by-products of the synthesis pathway of some amino acids during fermentation, was detected only in 85 PA beer.
Sensory evaluation
Sensory data were collected by the panel and the different attributes used to define the quality of the samples were rated using a scale ranging from 0 to 9. Average scores for each beer were calculated and results are shown in Fig. 2a, b.
The beers taste (Fig. 2a) showed some similarities mainly for fruity ester-like, alcoholic solvent and caramel notes. In particular, the 85 PA beer resulted sweeter and less fruity than the other beers and, as consequence, the bitter and astringent taste was less perceived. Caraamber®, as expected, gave a malty taste to 85 PA. Despite the highest bitterness value measured in the 85 PA this beer was judged to have the highest sweet. This is due to the use of Caraamber® malt, a common way to add a sweet flavour to beer, as suggested by the name “caramel”. Secondly, Safale™ S-04 is a maltotriose negative yeast, thus sugars remain into the beer contributing to sweet character to aroma and taste. The sweet sensation given by Caraamber malt could justify the significant differences (p < 0.05) in astringent attribute registered in beer samples. Body is a sensory attribute which can be affected by many physical and chemical properties of beer: foam head, carbon dioxide, protein, polyphenols, dextrins, bcta-glucan, viscosity, alcohol and glycerol. The body and linger attributes were weakly perceived in all three samples. Similarly, the main aroma notes were alcohol/solvent, caramel and fruity/esters (Fig. 2b). This is due to the ale yeast strain used and the high temperature of fermentation, which caused a high amount of ester, as confirmed by the volatile profile. The fruity/citrus attribute is given by the hop. The beers with Caraamber® were judged to have a higher malty aroma (Fig. 2b). The sweet odour is due to the Caraamber® and the kind of yeast, Safale™ S-04, which can give to beers sweet sensation producing high amount 3-methyl-propanol, ethyl acetate, volatile compounds that contribute to this sensory attribute (Table 3).
Fig. 2.

Sensory profile of 85 PA, 95 PA and 100 PA beer samples: a taste, b aroma
PCA
The taste sensory results were analysed by PCA approach (Fig. 3) and they showed distinct differences in the sensory traits of beers. Analysing the eigenvalues of the covariance matrix, we observed that the set of the two Principal Components (PCs) accounted for 95.5% of the total variance in the dataset: PC1 explained 88.5% of the variance in the dataset, whereas PC2 explained an additional 7.0% of the variance. The three beers were grouped differently in 2D-PCA plot: 95 and 100 PA samples were plotted in the PC1 and PC2 positive quadrants; 85 PA was projected on the quadrant defined by positive PC1 and negative PC2. All beers were positively correlated on PC1 with sweet alcoholic solvent and fruity citrus notes and body. The malty and linger descriptors were on the negative quadrant of PCs respect to the all sample beers; the other descriptors i.e. fruity citrus, caramel, bitter and astringent were positively correlated on the PC2 with 95 and 100 PA beers; instead they were negatively correlated with 85 PA sample. Also, PCA confirmed the similarities and differences among the produced beers as emerged by other quality parameters.
Fig. 3.

PCA plot of the relationship among taste sensory descriptors and 85 PA, 95 PA and 100 PA beer samples
Conclusion
The study aimed to evaluate the influence of malt composition on some quality parameters of an ale beer. The beers were produced increasing the percentage of caramel malt (0, 5, 15%) respect to the pale ale base malt. The samples showed an alcohol content ranging from 6.2 to 6.8% vol and significant differences on other parameters such as colour, bitterness, turbidity, foam stability, polyphenols and volatiles compounds that are considered among the main chemical-physical parameters which affect the beer quality. As the percentage of caramel malt increased, a deeper colour, a more pronounced bitterness was found in 85 PA than in 95 PA and 100 PA sample beers. The total polyphenols content, the profile of phenolic acid compounds (gallic and ferulic acids the most abundant), as well as the antioxidant activity was higher in 85 PA beer than that obtained by only pale ale malt (100 PA) and, a good correlation was found. The highest amount of caramber malt is also responsible for higher turbidity, while the best foam stability was found in 100 PA beer. Higher amount of aldehydes and ketones was found in beer with the highest percentage of caramel malt (85 PA) even if lower concentration of fusel alcohols and esters was registered. The sensory evaluation pointed out no significant differences among beers in terms of fruity-esters, alcoholic and caramel notes. As regards the taste, the 85 PA beer was perceived with the highest sweet and malty attributes. The PCA analysis confirmed the panel results and discriminated the beers, showing the relationship among similar samples (95 PA and 100 PA). Hence, further studies will focus also on the course of fermentation, yeast behaviour, wort fermentation that could explain influence of caramel malt on beer quality parameters more deeply.
Footnotes
Publisher's Note
Springer Nature remains neutral with regard to jurisdictional claims in published maps and institutional affiliations.
References
- Analytica - European Brewing Convention (EBC) (2010) Verlag Hans Carl, Nurnberg, Germany
- Baiano A, Terracone C. Physico-chemical indices, Iso-α-acid, phenolic contents and antioxidant activity of commercial beers. J Food Res. 2013;2:107–120. doi: 10.5539/jfr.v2n4p107. [DOI] [Google Scholar]
- Bettenhausen HM, Barr L, Broeckling CD, Chaparro JM, Holbrook C, Sedin D, Heuberger AL. Influence of malt source on beer chemistry, flavor, and flavor stability. Food Res Int. 2018;11:487–504. doi: 10.1016/j.foodres.2018.07.024. [DOI] [PubMed] [Google Scholar]
- Bettenhausen HM, Benson A, Fisk S, Herb D, Hernandez J, Lim J, Queisser SH, Shellhammer TH, Vega V, Yao L, Heuberger AL, Hayes PM. Variation in sensory attributes and volatile compounds in beers brewed from genetically distinct malts: an integrated sensory and non-targeted metabolomics approach. J Am Soc Brew Chem. 2020;78(2):136–152. [Google Scholar]
- Bokulich NA, Bamforth CW. The microbiology of malting and brewing. Microbiol Mol Biol R. 2013;77:157–172. doi: 10.1128/MMBR.00060-12. [DOI] [PMC free article] [PubMed] [Google Scholar]
- Brand-Williams W, Cuvelier ME, Berset C. Use of a free radical method to evaluate antioxidant activity. LWT Food Sci Technol. 1995;28:25–30. doi: 10.1016/S0023-6438(95)80008-5. [DOI] [Google Scholar]
- Carvalho DO, Gonçalves LM, Guido LF. Overall antioxidant properties of malt and how they are influenced by the individual constituents of barley and the malting process. Compr Rev Food Sci. 2016;15:927–943. doi: 10.1111/1541-4337.12218. [DOI] [PubMed] [Google Scholar]
- Ceccaroni D, Sileoni V, Marconi O, De Francesco G, Lee EG, Perretti G. Specialty rice malt optimization and improvement of rice malt beer aspect and aroma. LWT Food Sci Technol. 2018;99:299–305. doi: 10.1016/j.lwt.2018.09.060. [DOI] [Google Scholar]
- Cioch-Skoneczny M, Zdaniewicz M, Pater A, Skoneczny S. Impact of triticale malt application on physiochemical composition and profile of volatile compounds in beer. Eur Food Res Technol. 2019;245:1431–1437. doi: 10.1007/s00217-019-03284-2. [DOI] [Google Scholar]
- Coghe S, Adriaenssens B, Leonard S, Delvaux FR. Fractionation of colored maillard reaction products from dark specialty malts. J Am Soc Brew Chem. 2004;62(2):79–86. [Google Scholar]
- Coghe S, Hollander H, Verachtert H, Delvaux F. Impact of dark specialty malts on extract composition and wort fermentation. J Inst Brew. 2005;111(1):51–60. doi: 10.1002/j.2050-0416.2005.tb00648.x. [DOI] [Google Scholar]
- Coghe S, Vanderhaegen B, Pelgrims B, Basteyns AV, Delvaux FR. Characterization of dark specialty malts: new insights in color evaluation and pro- and antioxidative activity. J Am Soc Brew Chem. 2003;61(3):125–132. [Google Scholar]
- Corona O, Liguori L, Albanese D, Di Matteo M, Cinquanta L, Russo P. Quality and volatile compounds in red wine at different degrees of dealcoholization by membrane process. Eur Food Res Technol. 2019;245:2601–2611. doi: 10.1007/s00217-019-03376-z. [DOI] [Google Scholar]
- Dabina-Bicka I, Karklina D, Kruma Z, Dimins F. Bioactive compounds in latvian beer. Proc Latv Agric. 2013;30:325. [Google Scholar]
- De Francesco G, Sileoni V, Marconi O, Perretti G. Pilot plant production of low-alcohol beer by osmotic distillation. J Am Soc Brew Chem. 2015;73(1):41–48. [Google Scholar]
- Evans E, Redd K, Haraysmow SE, Elvig N, Koutoulis A. The influence of malt quality on malt brewing and barley quality on barley brewing with ondea pro, compared by small-scale analysis. J Am Soc Brew Chem. 2014;72(3):192–207. [Google Scholar]
- Gresser A. Properties and quality. In: Eblinger Hans M, editor. Handbook of brewing: process, technology, Markets. Germany: Wiley-vch; 2009. p. 362. [Google Scholar]
- Jespersen L, Jakobsen M. Specific spoilage organisms in breweries and laboratory media for their detection. Int J Food Microb. 1996;33:139–155. doi: 10.1016/0168-1605(96)01154-3. [DOI] [PubMed] [Google Scholar]
- Liguori L, Albanese D, Crescitelli A, Di Matteo M, Russo P. Impact of dealcoholization on quality properties in white wine at various alcohol content levels. Food Sci Technol. 2019;56(8):3707–3720. doi: 10.1007/s13197-019-03839-x. [DOI] [PMC free article] [PubMed] [Google Scholar]
- Liguori L, De Francesco G, Albanese D, Mincione A, Perretti G, Di Matteo M, Russo P (2018b) Impact of osmotic distillation on the sensory properties and quality of low alcohol beer. J Food Qual 2018 Article ID 8780725 11 pp.
- Liguori L, Russo P, Albanese D, Di Matteo M. Production of low-alcohol beverages: current status and perspectives. In: Grumezescu AM, Holban AM, editors. Handbook of food bioengineering. San Diego: Elsevier Inc; 2018. [Google Scholar]
- Liu SQ. Impact of yeast and bacteria on beer appearance and flavour. In: Hill A, editor. Brewing microbiology, managing microbes, ensuring quality and valorising waste. Cambridge: Woodhead Publishing; 2015. pp. 357–374. [Google Scholar]
- Mikyška A, Psota V. Chemical and sensory profiles of beers from barley varieties registered in the Czech Republic. J Food Nutr Res. 2019;58(4):349–362. [Google Scholar]
- Naczk M, Shahidi F. Phenolics in cereals, fruits and vegetables: occurrence, extraction and analysis. J Pharm Biomed. 2006;41:1523–1542. doi: 10.1016/j.jpba.2006.04.002. [DOI] [PubMed] [Google Scholar]
- Oladokun O, James S, Cowley T, Dehrmann F, Smart K, Hort J, Cook D. Perceived bitterness character of beer in relation to hop variety and the impact of hop aroma. Food Chem. 2017;230:215–224. doi: 10.1016/j.foodchem.2017.03.031. [DOI] [PubMed] [Google Scholar]
- Palmer J. How to brew boulder. Colorado: Brewers Publications; 2006. Hops; pp. 41–60. [Google Scholar]
- Petersen EE, Margaritis A, Stewart RJ, Pilkinton PH, Mensour NA. The effects of wort valine concentration on the total diacetyl profile and levels late in batch fermentations with brewing yeast Saccharomyces carsbergensis. J Am Soc Brew Chem. 2004;62:131–139. [Google Scholar]
- Piazzon A, Forte M, Nardini M. Characterization of phenolics content and antioxidant activity of different beer types. J Agric Food Chem. 2010;58:10677–10683. doi: 10.1021/jf101975q. [DOI] [PubMed] [Google Scholar]
- Russo P, Liguori L, Corona O, Albanese D, Di Matteo M, Cinquanta L. Combined membrane process for dealcoholization of wines: Osmotic distillation and reverse osmosis. Chem Eng Trans. 2019;75:7–12. [Google Scholar]
- Singleton V, Rossi JA. Colorimetry of total phenolicswith phosphomolybdic-phosphotungstic acid reagents. Am J Enol Vitic. 1965;16(3):144–158. [Google Scholar]
- Soares Daa Costa M, Goncalves C, Ferreira A, Ibsen C, Guedes De Pinho P, Silva Ferreira AC. Further insights into the role of methional and phenylacetaldehyde in lager beer flavour stability. J Agric Food Chem. 2004;52:7911–7917. doi: 10.1021/jf049178l. [DOI] [PubMed] [Google Scholar]
- Szwajgier D, Pielecki J, Targonski Z. The release of ferulic acid and feruloylated oligosaccharides during wort and beer production. J Inst Brew. 2005;111(4):372–379. doi: 10.1002/j.2050-0416.2005.tb00222.x. [DOI] [Google Scholar]
- Torres AG, Perrone D, Monteiro M, Moura-Nunes N, da Fonseca ND, Aguiar PF, Brito TC. Phenolic compounds of Brazilian beers from different types and styles and application of chemometrics for modeling antioxidant capacity. J Agric Food Chem. 2016;199:105–113. doi: 10.1016/j.foodchem.2015.11.133. [DOI] [PubMed] [Google Scholar]
- Vesely P, Lusk L, Basarova G, Seabrooks J, Ryder D. Analysis of aldehydes in beer using solid-phase microextraction with on-fiber derivatization and gas chromatography/mass spectrometry. J Agric Food Chem. 2003;51(24):6941–6944. doi: 10.1021/jf034410t. [DOI] [PubMed] [Google Scholar]
- Vieira Humia B, Silva Santos K, Mendonça Barbosa A, Sawata M, da Costa MM, Ferreira Padilha F. Beer molecules and its sensory and biological properties: a review. Molecules. 2019;24:1568. doi: 10.3390/molecules24081568. [DOI] [PMC free article] [PubMed] [Google Scholar]
- Wannenmacher J, Gastl M, Becker T. Phenolic substances in beer: structural diversity, reactive potential and relevance for brewing process and beer quality. Compr Rev Food Sci. 2018;17:953–988. doi: 10.1111/1541-4337.12352. [DOI] [PubMed] [Google Scholar]
- Yu W, Quek WP, Li C, Gilbert RG, Fox GP. Effects of the starch molecular structures in barley malts and rice adjuncts on brewing performance. Ferment. 2018;4:1–21. doi: 10.3390/fermentation4010001. [DOI] [Google Scholar]