Abstract
Objective
Preoperative differentiation between inverted papilloma (IP) and its malignant transformation to squamous cell carcinoma (IP-SCC) is critical for patient management. We aimed to determine the diagnostic accuracy of conventional imaging features and histogram parameters obtained from whole tumor apparent diffusion coefficient (ADC) values to predict IP-SCC in patients with IP, using decision tree analysis.
Materials and Methods
In this retrospective study, we analyzed data generated from the records of 180 consecutive patients with histopathologically diagnosed IP or IP-SCC who underwent head and neck magnetic resonance imaging, including diffusion-weighted imaging and 62 patients were included in the study. To obtain whole tumor ADC values, the region of interest was placed to cover the entire volume of the tumor. Classification and regression tree analyses were performed to determine the most significant predictors of IP-SCC among multiple covariates. The final tree was selected by cross-validation pruning based on minimal error.
Results
Of 62 patients with IP, 21 (34%) had IP-SCC. The decision tree analysis revealed that the loss of convoluted cerebriform pattern and the 20th percentile cutoff of ADC were the most significant predictors of IP-SCC. With these decision trees, the sensitivity, specificity, accuracy, and C-statistics were 86% (18 out of 21; 95% confidence interval [CI], 65–95%), 100% (41 out of 41; 95% CI, 91–100%), 95% (59 out of 61; 95% CI, 87–98%), and 0.966 (95% CI, 0.912–1.000), respectively.
Conclusion
Decision tree analysis using conventional imaging features and histogram analysis of whole volume ADC could predict IP-SCC in patients with IP with high diagnostic accuracy.
Keywords: Inverted papilloma, Magnetic resonance imaging, Diffusion
INTRODUCTION
The preoperative differentiation of inverted papilloma (IP) from its malignant transformation to squamous cell carcinoma (IP-SCC) is critical for patient management. When a patient is suspected of having IP-SCC, the patient should undergo extensive surgical resection and be considered for adjuvant treatment, including radiation or chemotherapy (1,2). However, it is difficult to accurately diagnose IP-SCC using nasal endoscopy because such tumors are often found in the maxillary sinus, and even biopsies could be affected by sampling error (3).
Several attempts have been made to distinguish IP-SCC from IPs using preoperative computed tomography (CT) or magnetic resonance imaging (MRI) (3,4,5,6,7,8). Bony erosion on CT and conventional MRI features—including tumor necrosis, soft tissue invasion (with a particular interest in orbital invasion), intracranial extension, and loss of convoluted cerebriform pattern—may help predict IP-SCC (3,4,5,6). However, conventional MRI features are suboptimal in terms of diagnostic accuracy; these include the loss of a convoluted cerebriform pattern, among other features which are subject to interpretation error with respect to the radiologist's level of experience (3).
Recently, several studies have reported that the mean apparent diffusion coefficient (ADC) value might be helpful in the differentiation of histological subtypes of sinonasal neoplasms, or that malignant sinonasal neoplasms have lower mean ADC values compared with benign tumors (9,10). Another study reported that IP-SCCs are associated with lower ADC values (ADCb0,1000 = 1.12 × 10⁻³ mm2/sec) than IP (ADCb0,1000 = 1.49 × 10⁻³ mm2/sec) (3). However, the mean ADC value is limited in that it does not represent the whole tumor, and malignant transformation may occur in small foci in the background of IP (2).
We hypothesized that the histogram analysis of ADC values of a whole tumor might help predict the malignant transformation of IP by detecting left-sided peakedness of ADC values of individual voxels. We aimed to determine the diagnostic accuracy of conventional imaging features and histogram parameters obtained from whole tumor ADC values to predict IP-SCC among patients with IP using a decision tree analysis.
MATERIALS AND METHODS
Study Population
We followed the Standards for Reporting of Diagnostic Accuracy Studies 2015 guidelines in reporting this study (11). This retrospective cohort study was approved by the relevant Institutional Review Board of Asan Medical Center (2019-1405), and the requirement for informed consent was waived owing to the retrospective design.
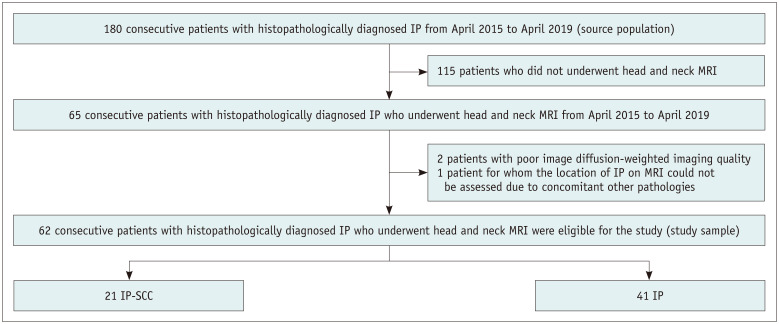
The study sample was derived from a head and neck tumor cohort of 180 consecutive patients in three hospitals between April 2015 and April 2019. The eligibility criteria were as follows: 1) patients with histopathologically diagnosed IP or IP-SCC and 2) patients who underwent head and neck MRI, including diffusion-weighted imaging (DWI). Among the 180 patients, 21 patients (12%) had IP-SCC, and 159 patients (88%) had IP. After the exclusion of 115 patients who did not undergo head and neck MRI, 65 consecutive patients were evaluated. Of them, two patients were excluded because of poor DWI quality, and one patient was excluded because the location of IP on MRI could not be assessed due to concomitant fungal ball and inflammatory polyp. Finally, 62 consecutive patients were included in the study (Fig. 1). All patients underwent surgery or biopsy, performed by otolaryngologist-head and neck surgeon. All histopathologic specimens were analyzed by the pathology divisions of the participating institutions.
Fig. 1. Flow diagram from standards for reporting of diagnostic accuracy studies.
IP = inverted papilloma, IP-SCC = malignant transformation of inverted papilloma to squamous cell carcinoma, MRI = magnetic resonance imaging
Imaging Protocol
Head and neck MRI were performed using a 3T scanner with a 64-channel (Skyra, Siemens Healthineers) or 16-channel neurovascular coil (Ingenia, Philips Healthcare). The MRI protocol included the following sequences: axial and coronal T1-weighted imaging, axial and coronal fat-suppressed T2-weighted imaging, axial DWI, an axial and coronal fat-suppressed contrast-enhanced T1-weighted imaging (12). DWI was obtained using single-shot echo-planar imaging before injecting a contrast agent. The parameters of DWI sequences were as follows: repetition time/echo time; 5450/62 msec; b value, 0 and 1000 sec/mm2; section thickness/gap, 4/0 mm; field of view, 192 × 192 mm, and acquisition time, approximately 5 minutes. ADC maps were acquired automatically within manufacturer console.
All patients underwent CT scans using 64 or 128 channels (Siemens Healthineers or GE Healthcare) with or without contrast. The detailed scan parameters were as follows: 120 kV tube voltage; 200 mAs effective tube current; slice thickness, 2.0 or 2.5 mm; and coronal and sagittal reconstruction.
Image Analysis
All image analyses were performed by two neuroradiologists (6 years of clinical experience in neuroradiology and 18 years of clinical experience in neuroradiology, respectively) who were blinded to reference standards and clinical information. Conventional MRI features, including tumor necrosis, orbit invasion, soft tissue invasion other than orbit, intracranial invasion, loss of convoluted cerebriform pattern, and bony erosion on CT, were analyzed with the consensus of the two readers. These are known to be imaging features of malignant transformation among patients with IP (3,4,5,6). We defined a convoluted cerebriform pattern on T2-weighted or contrast-enhanced T1-weighted imaging as a mixture of linear or curvilinear hyperintense or hypointense striations visualized in the solid portion of the tumor (4). The loss of convoluted cerebriform pattern was categorized as absent, partial, or diffuse (3,5).
To perform a histogram analysis of ADC, ADC maps were digitally transferred from a picture archiving and communication system to a personal computer. One of the authors drew a region of interest (ROI) on the ADC map using ITK-SNAP (Penn Image Computing and Science Laboratory at the University of Pennsylvania and the Scientific Computing and Imaging Institute at the University of Utah, USA, http://www.itksnap.org/pmwiki/pmwiki.php) with a semi-automatic method. The boundary of a tumor was defined with reference to T2-weighted and contrast-enhanced T1-weighted images. The ROIs were carefully placed to cover the entire volume of the tumor. An in-house software developed from ImageJ (National Institute of Health, USA, https://imagej.nih.gov/ij/download.html) was used to perform the ADC histogram analysis. ADC histograms were plotted with ADC values on the x-axis and the relative frequency in each bin on the y-axis. The mean of ADC, 5th, 10th, 15th, 20th, and 25th percentile ADC cutoffs were derived from the cumulative overall curves of the ADC histograms. The nth percentile was the point at which the n percent of the voxel values forming the histogram was found to the left.
Statistical Analysis
All statistical analyses were conducted using the commercial statistical software (SPSS Statistics for Windows, version 21 [IBM Corp.] & R, version 3.6.1 [R Foundation for Statistical Computing]), and the level of statistical significance was defined as p < 0.05. All parameters were compared between patients with IP-SCC and those with IP. To test the differences between the two groups, binary variables were compared using the chi-square test or Fisher's exact test, and continuous variables were compared using Student's t test.
C-statistics and Youden index (13) values were obtained to calculate the sensitivity and specificity of conventional imaging features, and ADC histogram parameters were used to predict malignant transformation in patients with IP. Partial or diffuse loss of convoluted cerebriform patterns was defined as test positivity. Inter-observer agreement for loss of convoluted cerebriform was analyzed using weighted kappa (14). Kappa values were classified as 0–0.20, slight; 0.21–0.40, fair; 0.41–0.60, moderate; 0.61–0.80, substantial; 0.81–1.00, almost perfect. In addition, classification and regression tree analysis were performed to determine the most significant predictors of malignant transformation in patients with IP among multiple covariates, including age, sex, history of treatment, conventional imaging features, and ADC histogram parameters. The minimum number of cases in the parent and child nodes was 20 each. The maximum tree depth was 30. The final tree was selected by cross-validation pruning based on minimal error. The performance of the decision tree model was evaluated using C-statistics. The sensitivity, specificity, and accuracy of the model were also calculated.
RESULTS
Patient Characteristics
The demographic characteristics of the patients are shown in Table 1. Of 62 patients with IP, 21 (34%) had IP-SCC. Among these 21 patients, 16 diagnoses were confirmed by surgery, and five by biopsy. All 41 patients with IP underwent surgical resection. Among the 62 patients with IP, 12 (19%) had a history of treatment for IP. The mean tumor volume was significantly larger among patients with IP-SCC than those without (p < 0.001). The mean time interval between head and neck MRI and surgery or biopsy was 26 days (standard deviation, 24 days), which showed no statistical difference between IP (30 days) and IP-SCC (20 days) (p = 0.142).
Table 1. Demographic Characteristics of the Patients.
| IP-SCC (n = 21) | IP (n = 41) | P | |
|---|---|---|---|
| Sex | 0.054 | ||
| Male | 19 (91) | 28 (68) | |
| Female | 2 (10) | 13 (32) | |
| Age, years | 61 ± 12 | 57 ± 13 | 0.280 |
| Treatment status | 0.520 | ||
| Pretreatment | 16 (76) | 34 (83) | |
| Post-treatment | 5 (24) | 7 (17) | |
| Tumor volume, cm3 | 28.5 ± 21.4 | 10.7 ± 9.6 | < 0.001 |
| Tumor location* | |||
| Nasal cavity | 12 (57) | 24 (59) | |
| Maxillary sinus | 14 (67) | 19 (46) | |
| Ethmoid sinus | 11 (52) | 25 (61) | |
| Sphenoid sinus | 4 (19) | 4 (10) | |
| Frontal sinus | 5 (24) | 11 (27) | |
Data are presented as n (%) or mean ± standard deviation. *Multiple locations were counted separately. IP = inverted papilloma, IP-SCC = malignant transformation of inverted papilloma to squamous cell carcinoma
Comparison of Conventional Imaging Features
Comparisons of imaging features between patients with IP-SCC and those with IP are shown in Table 2. Bony erosion on CT was significantly more common among patients with IP-SCC (91%, 19 out of 21) than those with IP; however, 34% of patients (14 out of 41) showed bony erosion on CT, including patients with IP. Tumor necrosis, orbit invasion, and soft tissue invasion other than the orbit were significantly more common among patients with IP-SCC (p < 0.001). Of the 21 patients with IP-SCC, 20 (95%) had at least a partial loss of convoluted cerebriform pattern, whereas 35 out of 41 patients (85%) with IP did not demonstrate loss of convoluted cerebriform pattern. Among conventional imaging features, loss of convoluted cerebriform pattern was associated with the highest C-statistic (0.903; 95% CI, 0.801–0.964) to predict IP-SCC (Table 2). Weighted kappa for inter-observer agreement of loss of convoluted cerebriform pattern was 0.78 (95% CI, 0.66–0.91).
Table 2. Comparison of CT and MR Imaging Features between Patients with IP and IP-SCC.
| IP-SCC (n = 21) | IP (n = 41) | P | Sensitivity (95% CI) | Specificity (95% CI) | C-statistics (95% CI) | |
|---|---|---|---|---|---|---|
| Bony erosion on CT, n (%) | 19 (91) | 14 (34) | < 0.001 | 58 (39–75) | 93 (77–99) | 0.753 (0.627–0.854) |
| Conventional MRI, n (%) | ||||||
| Tumor necrosis | 7 (33) | 0 (0) | < 0.001 | 100 (59–100) | 75 (61–85) | 0.873 (0.764–0.944) |
| Orbit invasion | 7 (33) | 0 (0) | < 0.0001 | 100 (59–100) | 75 (61–85) | 0.873 (0.764–0.944) |
| Soft tissue invasion other than orbit | 10 (48) | 1 (2) | < 0.0001 | 91 (59–100) | 78 (65–89) | 0.847 (0.733–0.926) |
| Intracranial invasion | 1 (5) | 0 (0) | 0.339 | NA | NA | NA |
| Loss of CCP* | < 0.001 | 95 (76–100) | 85 (71–94) | 0.903 (0.801–0.964) | ||
| Absent | 1 (5) | 35 (85) | ||||
| Partial | 10 (48) | 4 (10) | ||||
| Diffuse | 10 (48) | 2 (5) | ||||
| Diffusion-weighted imaging (SD), 10-3 mm2/sec | ||||||
| Mean ADC | 1.20 (0.18) | 1.51 (0.26) | < 0.001 | 81 (58–95) | 76 (60–88) | 0.832 (0.730–0.933) |
| ADC5 | 0.73 (0.17) | 0.92 (0.36) | < 0.001 | 90 (70–99) | 61 (45–76) | 0.754 (0.633–0.875) |
| ADC10 | 0.84 (0.15) | 1.09 (0.29) | < 0.001 | 86 (64–97) | 76 (60–88) | 0.810 (0.700–0.919) |
| ADC15 | 0.91 (0.16) | 1.20 (0.23) | < 0.001 | 90 (70–99) | 73 (57–86) | 0.861 (0.768–0.954) |
| ADC20 | 0.96 (0.16) | 1.30 (0.26) | < 0.001 | 90 (70–99) | 76 (60–88) | 0.884 (0.801–0.968) |
| ADC25 | 1.00 (0.17) | 1.36 (0.27) | < 0.001 | 90 (70–99) | 71 (55–84) | 0.877 (0.793–0.962) |
*Partial or diffuse loss of CCP was defined as test positivity. ADC = apparent diffusion coefficient, ADC5 = 5th percentile cutoff of ADC, ADC10 = 10th percentile cutoff of ADC, ADC15 = 15th percentile cutoff of ADC, ADC20 = 20th percentile cutoff of ADC, ADC25 = 25th percentile cutoff of ADC, CCP = convoluted cerebriform pattern, CI = confidence interval, CT = computed tomography, MRI = magnetic resonance imaging
Comparison of ADC Histogram Parameters
Mean ADC was significantly lower among patients with IP-SCC (1.20 × 10⁻³ mm2/sec) compared with those with IP (1.51 × 10⁻³ mm2/sec) (p < 0.001) (Table 2). In addition, the 10th–25th ADC percentile was significantly lower among patients with IP-SCC relative to patients with IP (p < 0.001). Among ADC histogram parameters, the 20th percentile cutoff of ADC (ADC20) (1.14 × 10⁻³ mm2/sec) had the highest C-statistic (0.884; 95% CI, 0.801–0.968) to predict IP-SCC (Table 2).
Decision Tree Analysis
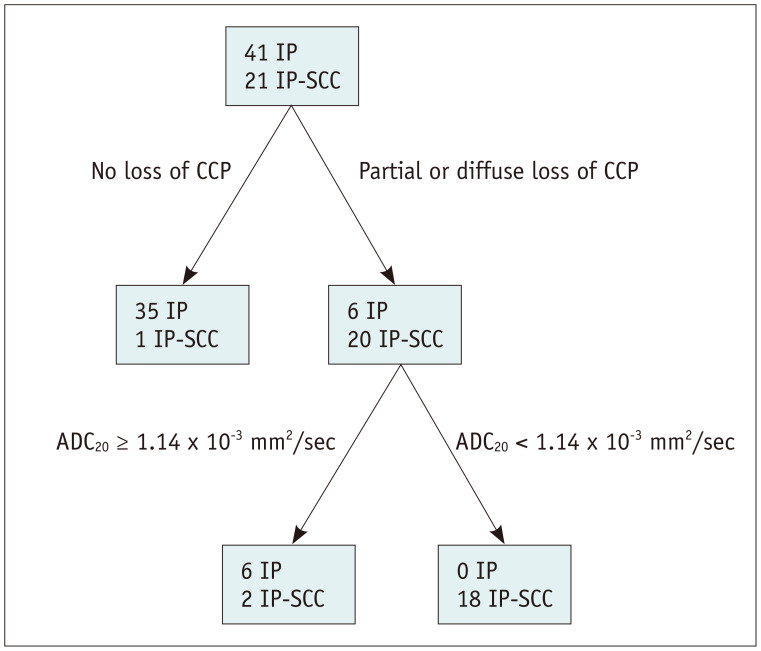
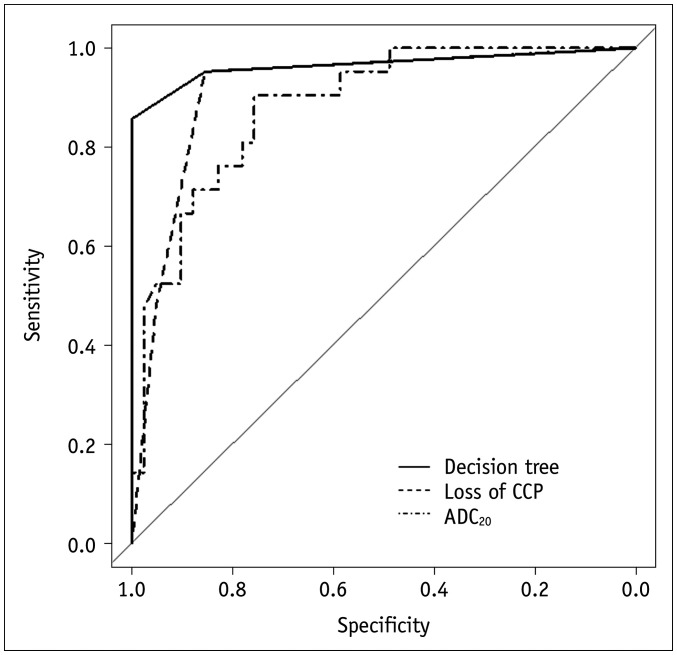
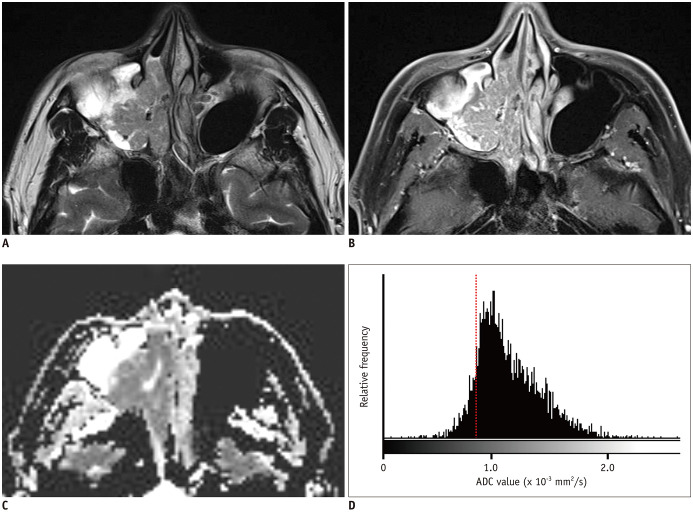
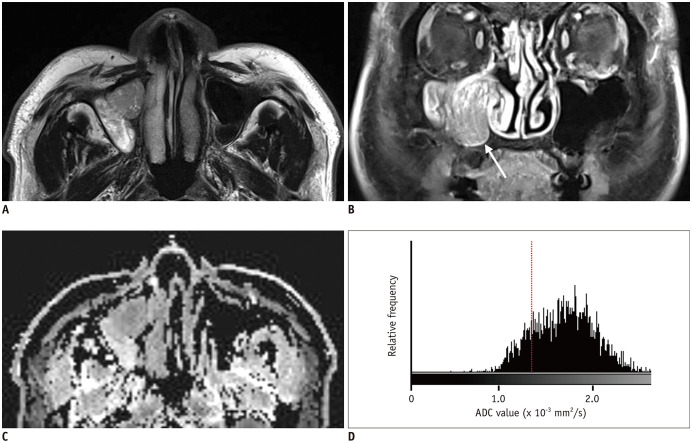
Decision tree analysis demonstrated that the loss of convoluted cerebriform pattern and the ADC20 were the most significant predictors of IP-SCC (Fig. 2). First, when the loss of convoluted cerebriform pattern was absent, these cases were categorized as IP. When the loss of convoluted cerebriform pattern was partially or diffusely present, a second branch of the decision tree concerning the ADC20 was applied. When the ADC20 was < 1.14 × 10⁻³ mm2/sec, these cases were categorized as IP-SCC. With these decision trees, the sensitivity, specificity, accuracy, and C-statistics were 86% (18 out of 21; 95% confidence interval [CI], 65–95%), 100% (41 out of 41; 95% CI, 91–100%), 95% (59 out of 61; 95% CI, 87–98%), and 0.966 (95% CI, 0.912–1.000), respectively (Fig. 3). Figure 4 shows representative images from a patient with malignant transformation to SCC from IP and Figure 5 shows representative images from a patient with IP.
Fig. 2. Classification and regression trees for decision tree analysis.
The decision tree analysis demonstrated that loss of CCP and the ADC20 were the most significant predictors of IP-SCC. On the basis of this decision tree, only three patients were false negatives. ADC20 = 20th percentile cutoff of the apparent diffusion coefficient, CCP = convoluted cerebriform pattern
Fig. 3. Receiver operating characteristic curves to predict malignant transformation among patients with IP.
The decision tree analysis revealed the highest C-statistic (0.966; 95% confidence interval, 0.912–1.000).
Fig. 4. A 54-year-old male patient with IP-SCC.
A. T2WI shows a soft tissue mass with a papillary growth pattern in the right maxillary sinus and nasal cavity. B. The mass shows partial loss of CCP and heterogeneous enhancement on fat-suppressed contrast-enhanced T1WI. C. On the ADC map, the mass shows homogeneous diffusion restriction. D. Histogram analysis revealed left-side peakedness and low 20th percentile cutoff of ADC values (0.86 × 10⁻³ mm2/s, dash line). T1WI = T1-weighted image, T2WI = T2-weighted image
Fig. 5. A 70-year-old male patient with IP.
A. T2WI shows a soft tissue mass with a papillary growth pattern in the right maxillary sinus. B. The mass shows partial loss of CCP (arrow) and heterogeneous enhancement on coronal fat-suppressed contrast-enhanced T1WI. C. On the ADC map, the mass shows no diffusion restriction. D. Histogram analysis revealed right-sided peakedness and high 20th percentile cutoff of ADC (1.36 × 10⁻³ mm2/s, dash line).
DISCUSSION
It is difficult to accurately diagnose IP-SCC using nasal endoscopy with biopsy and conventional imaging features. In the present study, we determined the diagnostic accuracy of imaging features, including ADC values, to predict IP-SCC using decision tree analysis. The decision tree analysis revealed that a loss of convoluted cerebriform pattern and the ADC20 were the most significant predictors of IP-SCC among patients with IP. With these decision trees, the sensitivity, specificity, accuracy, and C-statistics were 86%, 100%, 95%, and 0.966, respectively. Using the loss of convoluted cerebriform pattern alone, the C-statistic was 0.903, and the ADC20 alone generated a C-statistic of 0.884. Therefore, the decision tree analysis of conventional imaging features and the histogram analysis of ADC demonstrated excellent diagnostic accuracy for predicting IP-SCC among patients with IP.
Preoperative MRI for sinonasal IP is not routinely recommended in current clinical practice. The decision to perform MRI is not standard and usually depends on the referral physician's preference. However, there is growing evidence that preoperative MRI may help predict IP-SCC in patients with IP (3,4,5,6,7,8). In this study, the loss of convoluted cerebriform pattern was the most significant conventional imaging feature for predicting IP-SCC, which corroborates with previous studies (3,4,5,6). However, the interpretation of losses of convoluted cerebriform patterns on images is subjective, according to the level if experience of the radiologist (3). Thus, objective methods are needed.
The current study highlighted the usefulness of ADC histogram analysis when predicting IP-SCC, with ADC20 having the highest C-statistic among the histogram parameters, and, to our knowledge, this has not been reported in the literature before. Previous papers revealed that the mean ADC value might be helpful for differentiating histological subtypes of sinonasal neoplasms (9,10). Although a recent study used the mean ADC value to predict IP-SCC in patients with IP and showed promising results (3), the mean ADC value cannot accurately reflect the nature of IP-SCC because malignant transformation may occur as a small focus in the background of IP (2). This is supported by the observation that the percentage of malignant cells was less than 50% in > 30% of IP-SCCs (2). Therefore, histogram analysis of the ADC values of a whole tumor could be promising for predicting IP-SCC in patients with IP.
By adopting decision tree analysis using the most significant parameters from conventional imaging features and from histogram analysis of the whole ADC values, we could diagnose IP-SCC with a higher accuracy than that achieved previously (3,6). Moreover, our decision tree analysis procedure is relatively simple, with only two steps, and is relatively easy to follow in routine clinical practice.
Several limitations of this study should be addressed. First, only 36% of patients with IP (65 out of 180) underwent head and neck MRI, partly because there are no standard guidelines for performing MRI examinations on patients with IP. However, all patients with IP-SCC underwent head and neck MRI in our study. Second, our sample size was relatively small (n = 62), and external validation was not performed for the proposed decision. Further studies with larger samples are warranted to validate our results. Third, DWI was obtained using scanners from two different manufacturers. However, we believe that the same scanning protocols, including the same b values, might minimize any bias associated with the scanners.
In conclusion, decision tree analysis using conventional imaging features and histogram analysis of whole volume ADC could predict IP-SCC in patients with IP with high diagnostic accuracy.
Footnotes
Conflicts of Interest: The authors have no potential conflicts of interest to disclose.
References
- 1.Lawson W, Kaufman MR, Biller HF. Treatment outcomes in the management of inverted papilloma: an analysis of 160 cases. Laryngoscope. 2003;113:1548–1556. doi: 10.1097/00005537-200309000-00026. [DOI] [PubMed] [Google Scholar]
- 2.Yu HX, Liu G. Malignant transformation of sinonasal inverted papilloma: a retrospective analysis of 32 cases. Oncol Lett. 2014;8:2637–2641. doi: 10.3892/ol.2014.2539. [DOI] [PMC free article] [PubMed] [Google Scholar]
- 3.Yan CH, Tong CCL, Penta M, Patel VS, Palmer JN, Adappa ND, et al. Imaging predictors for malignant transformation of inverted papilloma. Laryngoscope. 2019;129:777–782. doi: 10.1002/lary.27582. [DOI] [PubMed] [Google Scholar]
- 4.Jeon TY, Kim HJ, Chung SK, Dhong HJ, Kim HY, Yim YJ, et al. Sinonasal inverted papilloma: value of convoluted cerebriform pattern on MR imaging. AJNR Am J Neuroradiol. 2008;29:1556–1560. doi: 10.3174/ajnr.A1128. [DOI] [PMC free article] [PubMed] [Google Scholar]
- 5.Jeon TY, Kim HJ, Choi JY, Lee IH, Kim ST, Jeon P, et al. 18F-FDG PET/CT findings of sinonasal inverted papilloma with or without coexistent malignancy: comparison with MR imaging findings in eight patients. Neuroradiology. 2009;51:265–271. doi: 10.1007/s00234-009-0510-2. [DOI] [PubMed] [Google Scholar]
- 6.Fujima N, Nakamaru Y, Sakashita T, Homma A, Tsukahara A, Kudo K, et al. Differentiation of squamous cell carcinoma and inverted papilloma using non-invasive MR perfusion imaging. Dentomaxillofac Radiol. 2015;44:20150074. doi: 10.1259/dmfr.20150074. [DOI] [PMC free article] [PubMed] [Google Scholar]
- 7.Ramkumar S, Ranjbar S, Ning S, Lal D, Zwart CM, Wood CP, et al. MRI-based texture analysis to differentiate sinonasal squamous cell carcinoma from inverted papilloma. AJNR Am J Neuroradiol. 2017;38:1019–1025. doi: 10.3174/ajnr.A5106. [DOI] [PMC free article] [PubMed] [Google Scholar]
- 8.Maroldi R, Farina D, Palvarini L, Lombardi D, Tomenzoli D, Nicolai P. Magnetic resonance imaging findings of inverted papilloma: differential diagnosis with malignant sinonasal tumors. Am J Rhinol. 2004;18:305–310. [PubMed] [Google Scholar]
- 9.Gencturk M, Ozturk K, Caicedo-Granados E, Li F, Cayci Z. Application of diffusion-weighted MR imaging with ADC measurement for distinguishing between the histopathological types of sinonasal neoplasms. Clin Imaging. 2019;55:76–82. doi: 10.1016/j.clinimag.2019.02.004. [DOI] [PubMed] [Google Scholar]
- 10.Das A, Bhalla AS, Sharma R, Kumar A, Thakar A, Vishnubhatla SM, et al. Can diffusion weighted imaging aid in differentiating benign from malignant sinonasal masses?: a useful adjunct. Pol J Radiol. 2017;82:345–335. doi: 10.12659/PJR.900633. [DOI] [PMC free article] [PubMed] [Google Scholar]
- 11.Bossuyt PM, Reitsma JB, Bruns DE, Gatsonis CA, Glasziou PP, Irwig L, et al. STARD 2015: an updated list of essential items for reporting diagnostic accuracy studies. Radiology. 2015;277:826–832. doi: 10.1148/radiol.2015151516. [DOI] [PubMed] [Google Scholar]
- 12.Choi YJ, Lee JH, Kim HO, Kim DY, Yoon RG, Cho SH, et al. Histogram analysis of apparent diffusion coefficients for occult tonsil cancer in patients with cervical nodal metastasis from an unknown primary site at presentation. Radiology. 2016;278:146–155. doi: 10.1148/radiol.2015141727. [DOI] [PubMed] [Google Scholar]
- 13.Youden WJ. Index for rating diagnostic tests. Cancer. 1950;3:32–35. doi: 10.1002/1097-0142(1950)3:1<32::aid-cncr2820030106>3.0.co;2-3. [DOI] [PubMed] [Google Scholar]
- 14.Landis JR, Koch GG. The measurement of observer agreement for categorical data. Biometrics. 1977;33:159–174. [PubMed] [Google Scholar]


