

Abstract
Introduction:
Alcohol is among the most commonly used psychoactive drugs, yet it can produce markedly different subjective effects in different people. Certain effects, including both heightened stimulatory effects and lesser sedative effects, are thought to predict repeated or excessive use. However, we do not fully understand the nature of these individual differences or their relationships to alcohol consumption. This controlled laboratory study examined subjective and physiologic responses to a moderate dose of alcohol in social drinkers in relation to the subjects’ decision to consume alcohol.
Methods:
Healthy adult volunteers (N=95) participated in a 5-session double-blind alcohol choice study. On the first four sessions they received alcohol (0.8 g/kg) and placebo in alternating order, and on the fifth session they chose and consumed whichever of the two they preferred. During each session, participants completed the Profile of Mood States (POMS) and Biphasic Alcohol Effects Scale (BAES) questionnaires and had their vitals recorded every 30 minutes. We compared subjective and physiologic response to alcohol during the sampling sessions in participants who chose alcohol or placebo on session five.
Results:
Of the 95 participants, 55 chose alcohol (choosers) and 40 chose placebo (non-choosers). In the full sample, alcohol produced its expected effects (e.g., increased friendliness, elation & vigor (POMS) and stimulation and sedation (BAES)). The chooser and non-chooser groups did not differ in demographic characteristics, blood alcohol levels or cardiovascular measures. However, the choosers experienced greater alcohol-induced increases in positive mood (POMS) and liked the drug more, whereas the non-choosers experienced greater anger, anxiety (POMS) and sedation (BAES) after alcohol.
Conclusion:
Both greater positive mood effects and lesser sedative effects after alcohol predicted preference under controlled conditions, suggesting that both factors can predict future consumption of alcohol.
Keywords: Alcohol, Drug choice, Subjective effects, Mood, Social Drinkers
1. Introduction
Alcohol remains one of the most commonly used psychoactive substances in the world. A substantial fraction of those who ever consume alcohol go on to use the drug excessively, leading some to develop Alcohol Use Disorder (American Psychiatric Association, 2013; Grant et al., 2017). Yet, the factors that lead some people to use alcohol repeatedly or at high levels are not fully understood. One factor that holds intuitive appeal is that individuals differ in their subjective experiences of the effects of alcohol. That is, people who experience more positive subjective effects from alcohol, including either greater stimulant-like effects (Wardell, Ramchandani and Hendershot, 2016; Corbin, Gearhardt and Fromme, 2008; King et al., 2019; de Wit et al., 1987; de Wit, Pierri and Johanson, 1989; Hendershot et al., 2017; Wardell, Ramchandani and Hendershot, 2015) or less aversive or sedative effects (Schuckit, 1987; Schuckit et al., 2011; Hendershot et al., 2017; Wardell, Ramchandani and Hendershot, 2015), may be more likely to use it repeatedly or excessively. Indeed, across most drugs of abuse, there is evidence that feelings of pleasure, euphoria and elevated mood produced by drugs contribute to their abuse potential (Balster and Bigelow, 2003; de Wit and Phillips, 2012). However, there are also occasional cases of drug-seeking in the apparent absence of subjective feelings of euphoria. Nicotine, for example, establishes and maintains robust drug seeking behavior without producing distinct euphorigenic effects (de Wit and Phillips, 2012), and in one study with experienced opioid users, the subjective effects of morphine were dissociable from drug-seeking behavior (Lamb et al., 1991). Thus, it is possible that factors other than subjective responses may influence consumption of drugs, including alcohol. Some early studies suggested that sensitivity to the cardiovascular effects of alcohol, i.e. its ability to increase heart rate, was an indicator of abuse risk (Conrod, Peterson and Pihl, 2001; Conrod, Pihl and Vassileva, 1998). It is also possible that euphorigenic effects play a role early in drug use, but not later (Berridge and Robinson, 2016), although recent evidence indicates that the positive subjective effects of alcohol remain stable and robust over years, even in established alcohol-dependent users (King et al., 2019). Taken together, these considerations remind us that the acute subjective effects of alcohol may not be fully predictive of the behavior of choosing to ingest the drug. Even if subjective drug effects are related to future drug taking, more information is needed on what type of subjective effects (e.g., positive mood, relief of negative mood, insensitivity to negative effects) predict use.
The present study used an approach similar to that used in an early study (de Wit et al., 1987), examining the relationship between subjective responses to alcohol and choice of alcohol over placebo. In the earlier study, healthy adults (N=29) first sampled alcohol (0.5 g/kg) and placebo beverages under double blind conditions, and then had three opportunities to choose which they preferred. The subjective responses to alcohol during sampling were compared for those who more often chose alcohol (choosers) or placebo (non-choosers). Alcohol produced feelings of elation and vigor in the choosers, whereas it produced dysphoria and confusion in the non-choosers. More recently as part of a larger study (Murray, Weafer and de Wit, 2020; Radoman et al., 2020), we used a similar behavioral procedure with a larger sample, a higher dose of alcohol and additional measures of subjective and physiological responses to the alcohol. In this paper we examine in greater depth which subjective responses, or other factors, predict alcohol choice.
The present study examined subjective and physiological effects of alcohol that predict consumption in a choice procedure. Healthy adults (N=95) underwent four sampling sessions with alcohol (0.8 g/kg) and placebo, followed by a fifth session on which they chose which, and how much, of the two they preferred. Subjective effects of alcohol during sampling were assessed using the Profile of Mood States (McNair, Lorr and Droppleman, 1971) and the Biphasic Alcohol Effects Scale (Martin et al., 1993). We also examined choice in relation to alcohol-induced heart rate and blood pressure, in relation to demographic characteristics including self-reported habitual alcohol use and in relation to pre-beverage mood states.
2. Materials & Methods
2.1. Design:
Healthy social drinkers completed a 5-session study. On the first 4 sessions they sampled beverages containing either alcohol (0.8 g/kg) or placebo two times each in alternating order, and on the fifth session they chose which they preferred. During sampling the beverage was administered in 4 small doses, and on the choice session subjects could consume from 1 to all 4 of the doses. We examined their mood and physiological responses to the drug (during sampling) in relation to their choice for alcohol or placebo. The Institutional Review Board of the University of Chicago approved the study, and it was carried out in accordance with the Declaration of Helsinki.
2.2. Participants:
Men and women (N=95), aged 21–30 were recruited from the community through online and printed advertisements. Inclusion criteria were high school education, fluency in English and BMI 18 – 26. To be eligible, subjects had to report regular habitual alcohol consumption (7–30 drinks per week) and at least one binge drinking episode in the last month (i.e., 4 or more drinks for women and 5 or more for men). Exclusion criteria were past treatment for alcohol use disorder, presence of any serious medical problems or psychiatric disorders as defined in the DSM-V (American Psychiatric Association, 2013), severe flushing reaction to alcohol, current pregnancy or lactation.
2.3. Procedure:
Sessions took place in comfortable rooms in the Human Behavioral Pharmacology Laboratory at the University of Chicago. Participants first attended an orientation session in which they provided informed consent and were familiarized with laboratory procedures and study protocol. They were instructed to abstain from drugs, including alcohol, for 24 hours prior to each session. Compliance with drug abstinence was verified at each session by both self-report and breath alcohol and urine drug screens. Participants were asked to fast 4 hours prior, and consume their usual amounts of caffeine and nicotine prior to each session.
Sampling sessions:
Sessions took place from 3pm to 8pm, separated by 2–7 days. Subjects were tested individually. At the beginning of each session, participants first provided urine and breath samples to verify compliance with drug use instructions. They completed baseline, pre-beverage questionnaires (described in 2.4) and had their blood pressure and heart rate recorded. Then they consumed color-coded beverages containing either alcohol (0.8 g/kg for men and 0.68 g/kg for women) or placebo. The beverages were administered in alternating order across sessions (i.e., two alcohol sessions and two placebo sessions) under double blind conditions. The alcohol and placebo were served in distinctively colored cups for each subject, and participants were informed that the contents of each color would be the same across sessions. They were asked to attend to the effects of each beverage. Following each sampling session, participants indicated whether they believed they received alcohol or placebo to assess the blinding. The alcohol dosage was selected to achieve a peak breath alcohol content (BrAC) of 80 mg/100 ml (Fillmore, 2001; Mulvihill, Skilling and VogelSprott, 1997). The alcohol beverage consisted of a solution of 190-proof ethanol (Everclear, Luxco, Inc., St. Louis, MO) mixed with the participant’s preferred fruit juice at a 1:9 ratio. The placebo beverage consisted of fruit juice plus 3 ml ethanol added as a taste mask. To minimize drug expectancies, participants were told that they might receive a stimulant, a sedative, alcohol or a placebo in their beverage, and alcohol was sprayed on the rim of cups to reduce differences in smell. Subjects consumed the beverage in 4 separate cups or ‘doses’, within a 10-minute period. Then, at 30-minute intervals throughout the session, participants completed the questionnaires (see below) and had their breath alcohol levels, heart rate and blood pressure recorded. At the end of the session after confirming that subjects were no longer under the influence of the drug, they completed end of session questionnaires and were allowed to leave the lab.
Choice session:
On the fifth session, participants were asked to recall the effects they had experienced during the prior sessions and mark, on a 100 mm analog scale how much they liked each beverage (Like), how much they felt any effects (Feel), and how much they were willing to pay for it (Pay). They were also asked to indicate, on a questionnaire, which of the two color-coded beverages they wished to consume, and how many of the 4 doses they wanted. Then they received and consumed that beverage. The rest of the session proceeded in the same manner as the first four sessions. Upon completion of this session, participants were told what they had received and compensated for their time.
2.4. Measures of Drug Effect:
Heart rate (HR) and blood pressure (BP) were obtained by blood pressure monitor (Omron Healthcare, Inc., Lake Forest, IL). BrAC was measured via breathalyzer (Intoximeters Inc., St. Louis, MO). Two questionnaires were utilized to assess participants’ subjective response to the administered drug, the Profile of Mood States (POMS) and the Biphasic Alcohol Effects Scale (BAES). The POMS is a 72-item measure that assesses mood states (McNair, Lorr and Droppleman, 1971). Participants rate the extent to which they experienced each state using a 5-point scale. The responses have been factor analyzed into 8 scales: friendliness, anxiety, elation, anger, fatigue, depression, confusion and vigor, in addition to indexed scales of positive mood (elation minus depression) and arousal (anxiety plus vigor minus confusion plus fatigue). BAES was designed to measure the stimulant and sedative effects of alcohol (Martin et al., 1993). The BAES is a 14-item instrument that measures alcohol-induced stimulation (e.g. vigorous, elated, talkative) and sedation (e.g. sluggish, inactive, difficulty concentrating). Participants rated their subjective experience of the alcohol effects on an 11-point rating scale. Subjects also completed the Drug Effects Questionnaire (Morean et al., 2013) but these results were presented elsewhere (Murray, Weafer and de Wit, 2020).
2.5. Data Analyses:
Participants were divided into two groups: alcohol choosers – those who chose alcohol in session 5, and non-choosers – those who chose placebo. T-tests (mean of POMS scores on the four sampling sessions, for choosers vs non-choosers) confirmed that chooser and non-chooser groups did not differ on measures of pre-drug mood states. Sampling session drug effects were calculated from participants’ peak change scores (PCS), defined as the largest magnitude of difference from a participants’ baseline, on each subjective and physiologic measure during each session. The PCS scores for the two drug sessions and two placebo sessions were averaged, and two-way ANOVAs were performed with group and substance (alcohol or placebo) as independent variables using SPSS statistical package version 25 (SPSS Inc, Chicago, IL). Follow-up independent samples t-tests were used to compare choosers and non-choosers on responses to alcohol effects, while paired t-tests compared alcohol vs. placebo separately for choosers and non-choosers. In addition, direct logistic regression was performed to assess the impact of each subjective and physiologic measure (average PCS scores of alcohol sessions minus average PCS scores of placebo sessions) on the likelihood that individuals would choose alcohol. Variables selected for the regression showed main effects of alcohol after ANOVA and passed collinearity diagnostics with a 3.0 VIF cut-off. We also examined the groups’ demographic data and their retrospective responses to the four sampling sessions on the analog scales for Like, Feel and Pay at the beginning of session five. 0.05 was used as the cutoff for significant p values.
3. Results
3.1. Choice and Demographics
Of the 95 participants (51 men and 44 women), 55 chose alcohol and 40 chose placebo. The subjects who chose alcohol chose a mean of 3.16 out of 4 doses, and those who chose placebo took a mean of 2.12 out of 4 doses. The chooser and non-chooser groups did not differ significantly in sex, age, BMI, alcohol usage or baseline mood measurements assessed in POMS (Table 1).
Table 1. Participant Demographics.
Demographic characteristics, drug use history and baseline mood scores of subjects who chose alcohol on session 5 (Choosers) or placebo (Non-Choosers). POMS refers to Profile of Mood States. Values shown are N (sex) or mean (SEM). The groups did not differ on any of these measures (t-tests and chi-square).
| Choosers | Non-choosers | |
|---|---|---|
| Sex (M,F) | (31, 24) | (19, 21) |
| Age | 24.27 (2.6) | 24.03 (2.8) |
| BMI | 23.30 (2.3) | 23.33 (2.3) |
| Alcohol Use | ||
| Alcohol (days last month) | 16.13 (5.1) | 14.50 (5.4) |
| Alcohol (binges last month) | 4.18 (3.2) | 4.95 (2.7) |
| Alcohol (drinks per occasion) | 3.54 (1.6) | 3.68 (1.6) |
| Alcohol (total drinks last 28 days) | 51.51 (19.3) | 49.78 (20.3) |
| Baseline Mood (POMS) | ||
| Positive Mood | 4.85 (4.4) | 5.05 (5.0) |
| Arousal | 6.59 (6.0) | 6.24 (6.7) |
| Friend | 13.21 (6.3) | 13.80 (5.9) |
| Anxiety | 3.72 (1.7) | 3.90 (2.2) |
| Elation | 6.39 (3.9) | 6.90 (3.7) |
| Anger | 1.11 (2.1) | 1.20 (2.5) |
| Fatigue | 2.20 (2.4) | 2.65 (2.6) |
| Depression | 1.55 (2.8) | 1.81 (3.4) |
| Confusion | 3.80 (1.8) | 3.89 (2.2) |
| Vigor | 8.87 (5.4) | 9.04 (5.1) |
3.2. Effect of Alcohol on POMS
Figure 1 shows the results of two-way ANOVAs on peak change in POMS from pre-drug baseline levels across placebo and alcohol sampling sessions. In the entire sample (main effects of drug), alcohol significantly increased ratings of friendliness (p=0.034), elation (p<0.001), anger (p=0.002), fatigue (p<0.001), depression (p<0.001), confusion (p<0.001) and vigor (p=0.002). Choosers and non-choosers differed significantly (group x drug) in their responses to alcohol on positive mood (p=0.040), anxiety (p=0.049) and anger (p=0.029). Follow up independent samples t-tests showed that choosers reported higher scores in positive mood after alcohol than non-choosers, and non-choosers reported higher scores in anger. Paired t-tests showed that non-choosers reported greater anger after alcohol vs. placebo. Complete ANOVA results with F-test statistics are shown in Supplementary Table 1.
Figure 1.

Mean (SEM) peak change scores on scales of the Profile of Mood States (POMS) for alcohol (filled bars) and placebo (open bars) for subjects who chose alcohol (Choosers; N=55) or placebo (Non-Choosers; N=40) on the choice session. Two-way ANOVAs were conducted, followed by t-tests when significant interactions were found. Independent samples t-test (Alcohol): Positive Mood (p=0.005); Anger (0.031). Paired t-test (Non-Choosers): Anger (p=0.01). (*p<0.05; **p<0.01).
3.3. BAES
Figure 2 displays the effects of choice and alcohol on the BAES stimulation and sedation subscales. In all subjects together, alcohol increased scores on sedation (p<0.001) and prevented decreases in stimulation (p<0.001) compared to placebo. There was a significant interaction between choice and drug on the sedation scale (p=0.021), and follow-up independent samples t-tests showed that alcohol produced a greater increase on this scale in non-choosers than choosers. Paired t-tests confirmed that alcohol increased sedation vs. placebo for both choosers and non-choosers.
Figure 2.
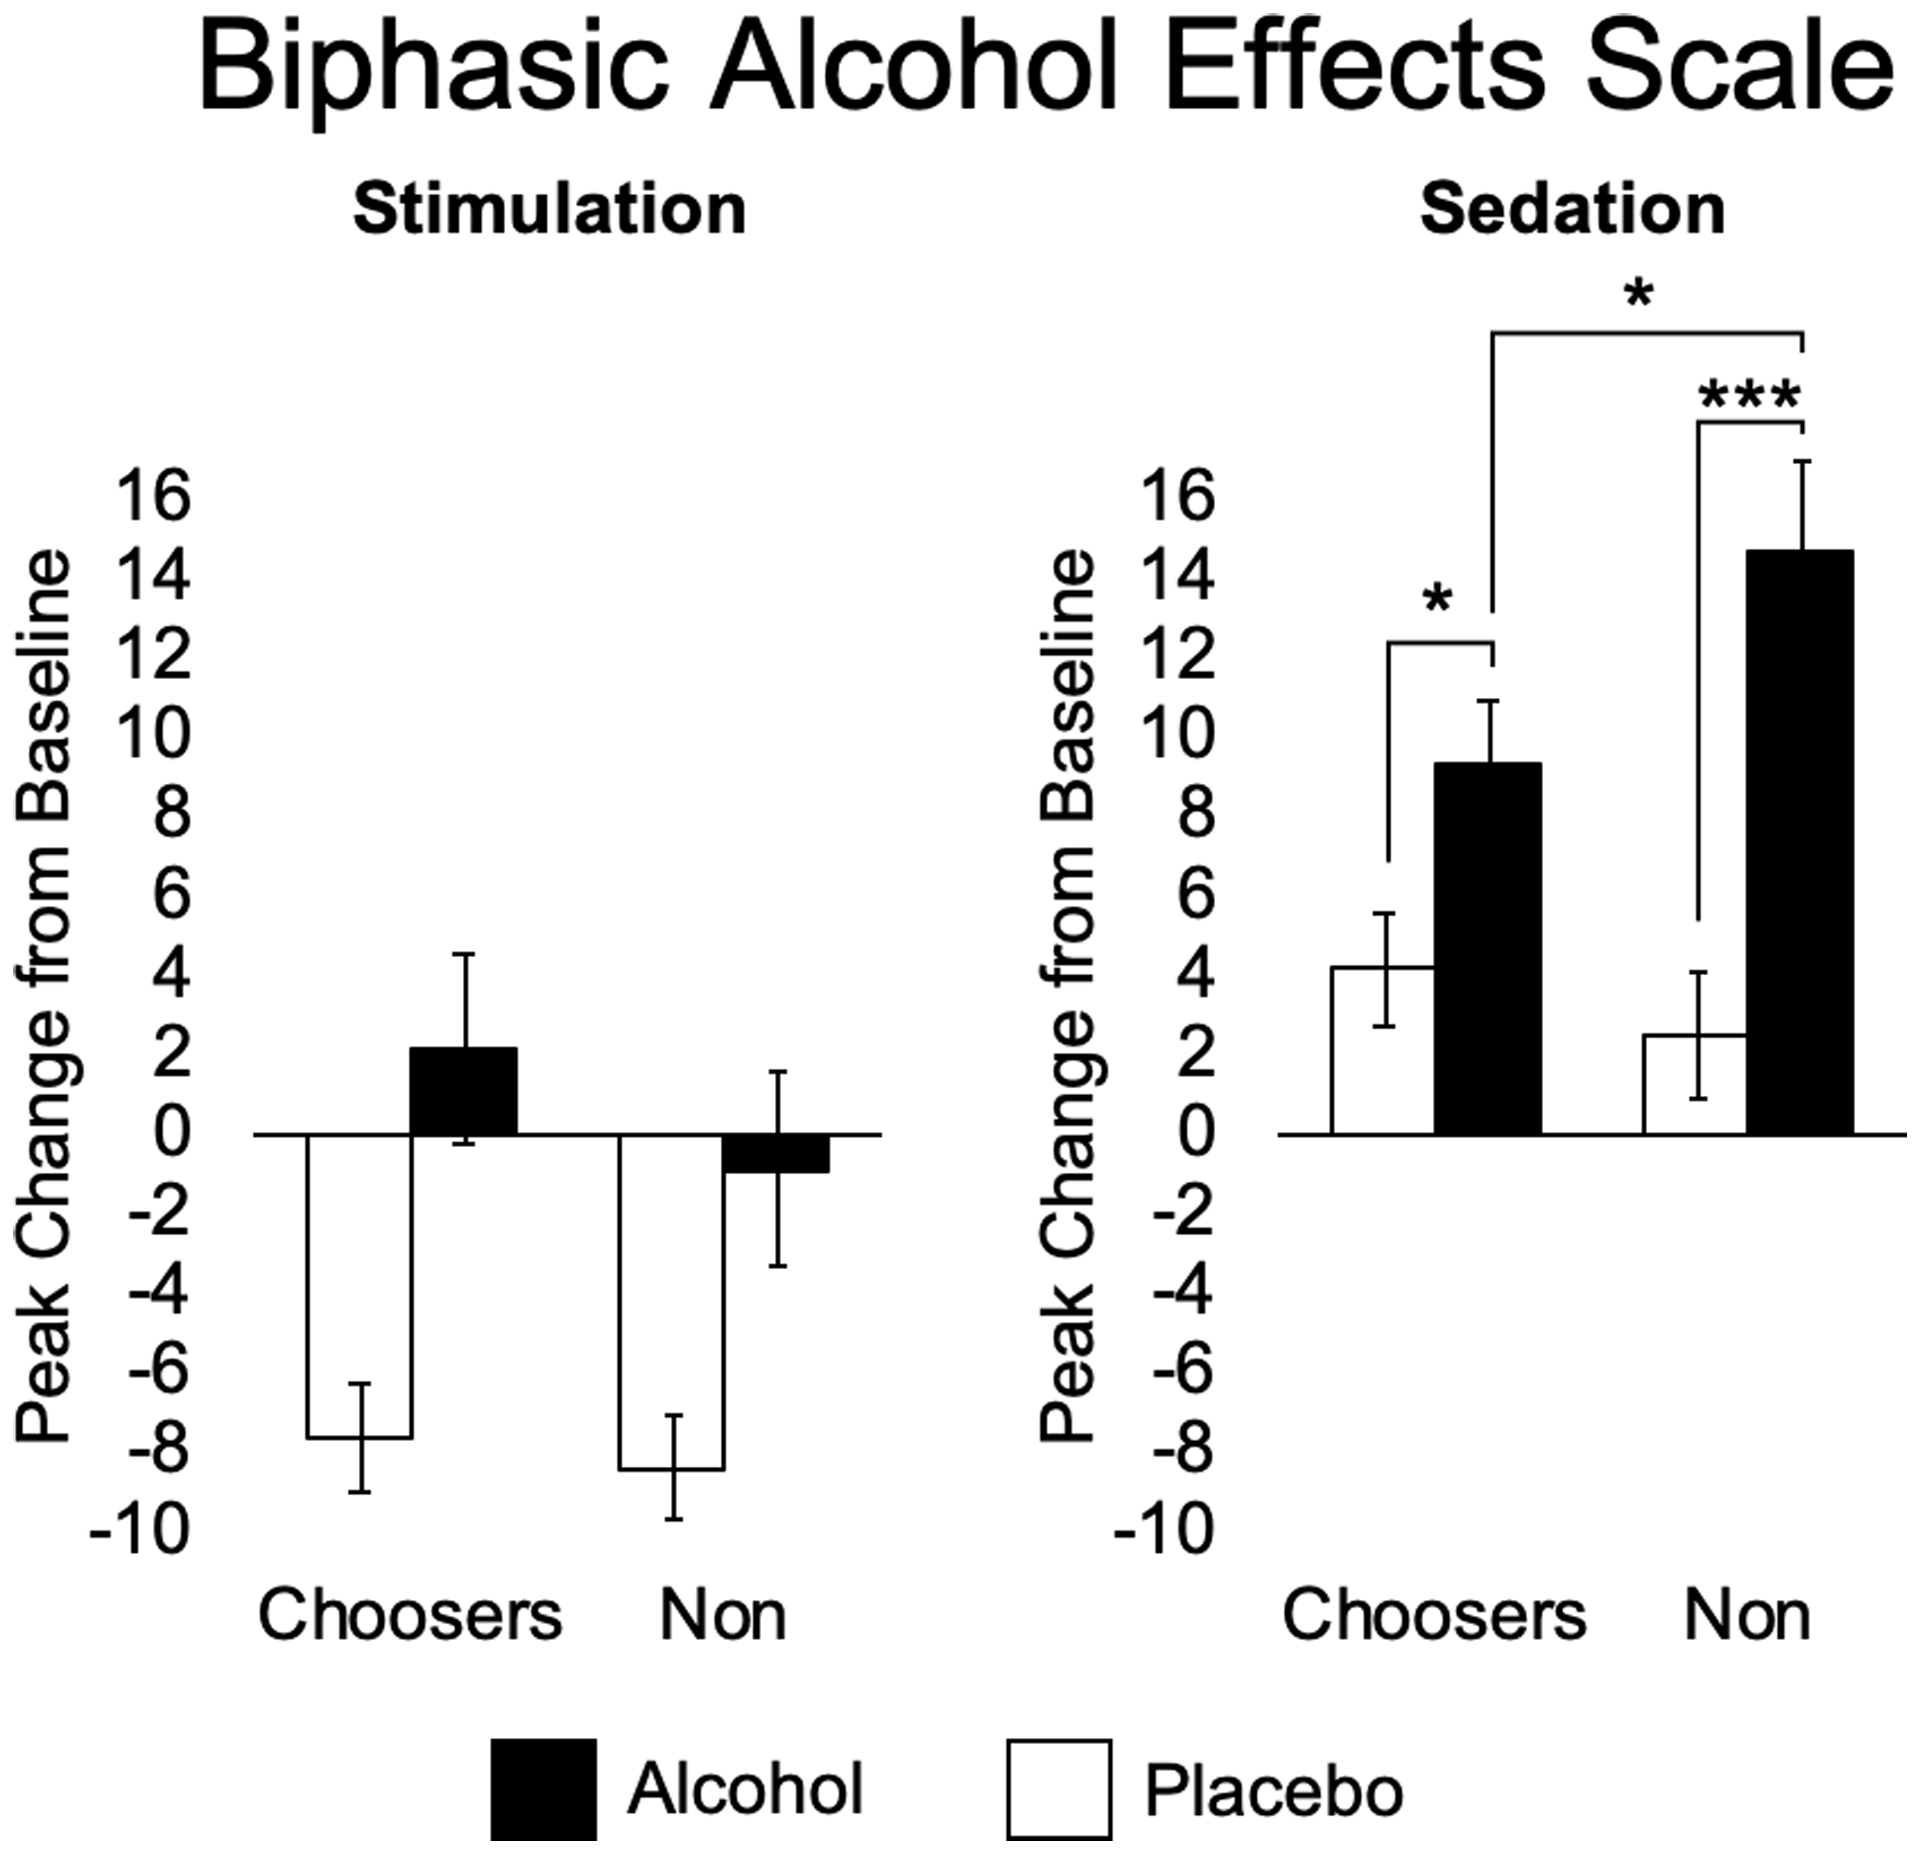
Mean (SEM) peak change scores on the Stimulation and Sedation scales of the Biphasic Alcohol Effects Scale (BAES) after alcohol (filled bars) and placebo (open bars) in alcohol choosers (Choosers; N=55) and Non-Choosers (N=40). Two-way ANOVAs were conducted, followed by t-tests when significant interactions were found. Independent samples t-test (Alcohol): Sedation (p=0.048). Paired t-test (Choosers): Sedation (p=0.014); (Non-Choosers): Sedation (p<0.001). (*p<0.05; **p<0.01; ***p<0.001).
3.4. Physiologic Measures
Figure 3 represents the peak change from baseline in heart rate and blood pressure in response to alcohol and placebo in the two groups. In the full sample, alcohol significantly increased heart rate compared to placebo (p<0.001), but there were no significant differences between groups. Figure 4 shows that the breath alcohol level (BrAC) over time did not differ between the two groups.
Figure 3.
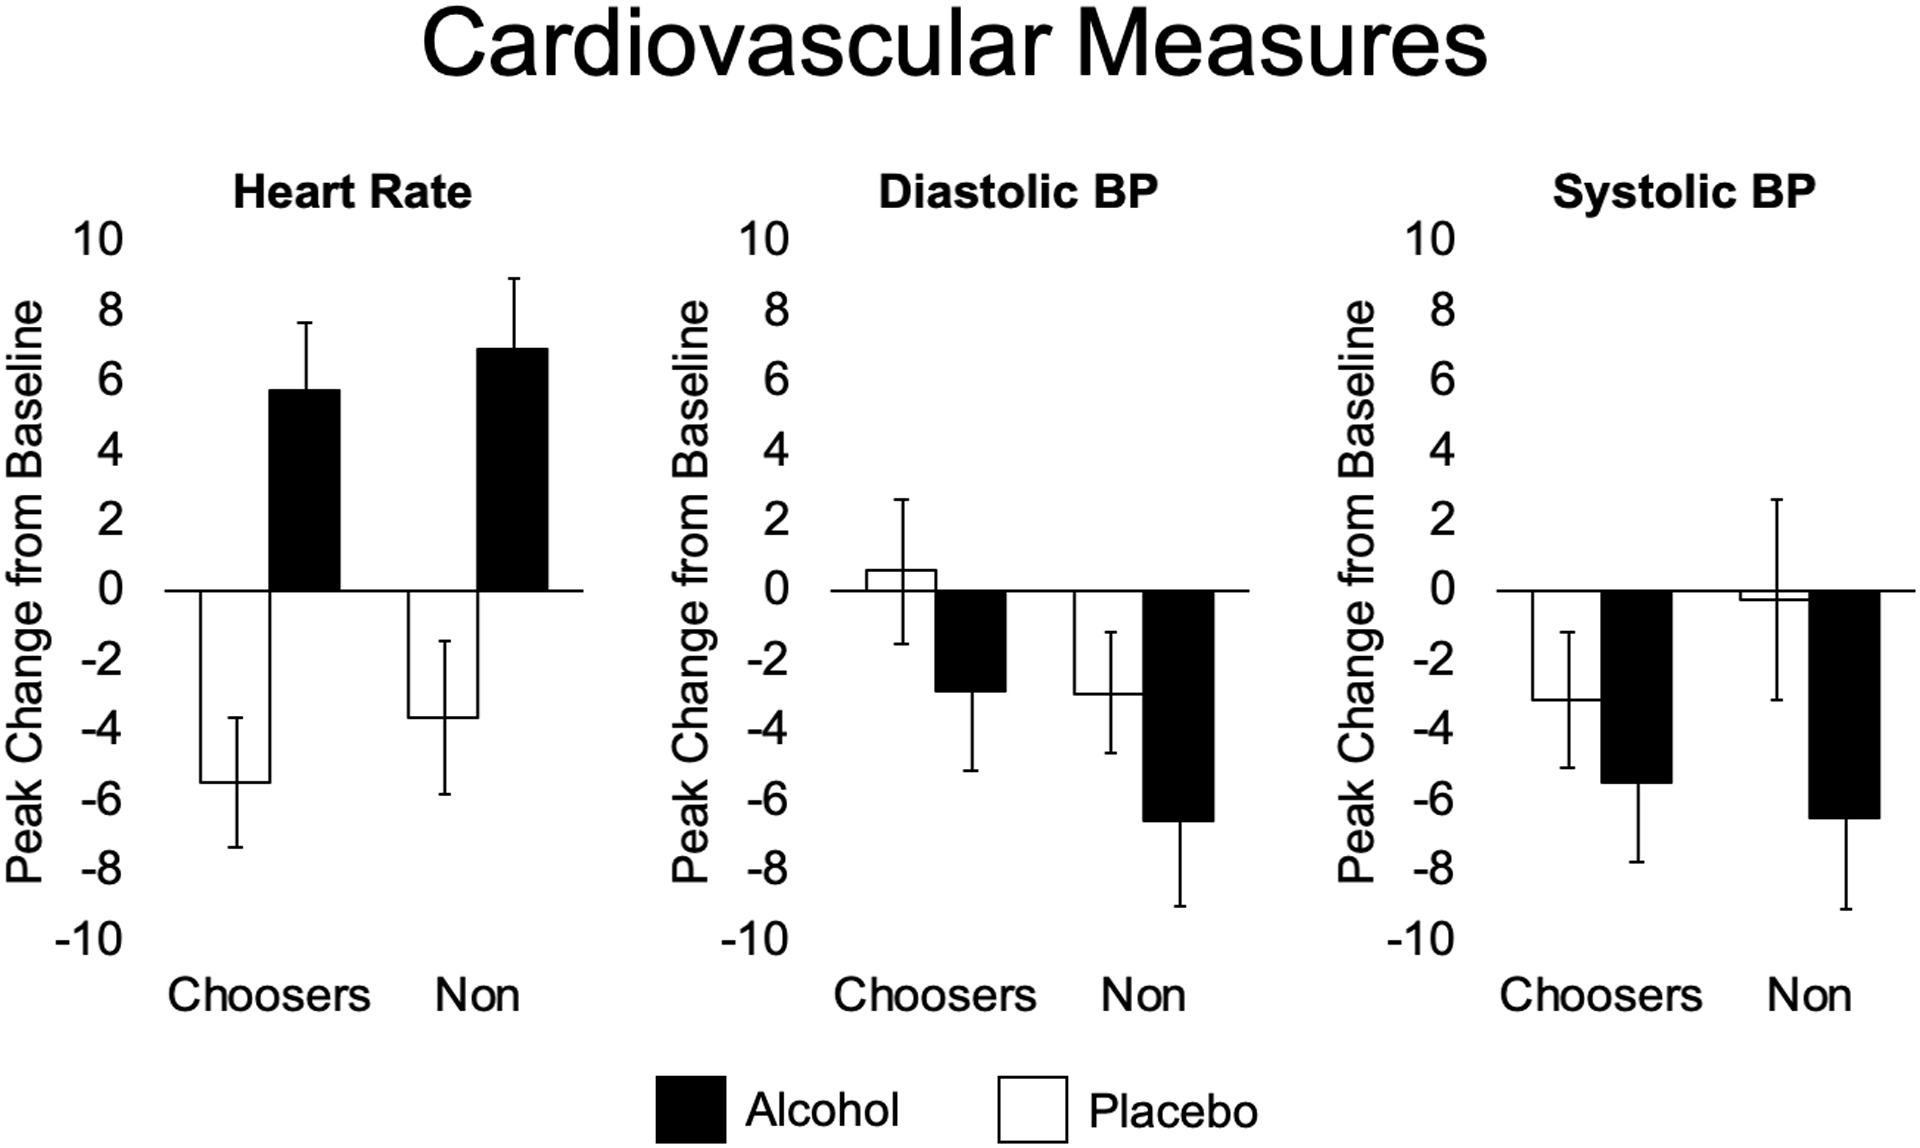
Mean (SEM) cardiovascular measures after alcohol (filled bars) and placebo (open bars) in alcohol choosers (Choosers; N=55) and Non-Choosers (N=40). Panels show heart rate (HR), diastolic blood pressure (DIA BP), and systolic blood pressure (SYS BP). Two-way ANOVAs were conducted, no significant interactions found.
Figure 4.

Mean (± SD) breath alcohol concentration (BrAC; averaged across the two alcohol sessions) over time in alcohol Choosers (N=55) and Non-Choosers (N=40). The groups did not differ in BrAC.
3.5. Like/Feel/Pay
Figure 5 shows that alcohol increased retrospective ratings of feeling (p<0.001) and liking (p<0.001) and willingness to pay (p<0.001) for the drug effects when compared to placebo. The effects of the drug differed between choosers and nonchoosers (drug x group) on the ratings of like (p<0.001) and willingness to pay (p=0.014). Follow-up independent samples t-tests showed that choosers liked the alcohol beverage more than non-choosers, and non-choosers were willing to pay more for placebo than choosers. Paired t-tests confirmed that alcohol increased liking vs. placebo for choosers only.
Figure 5.
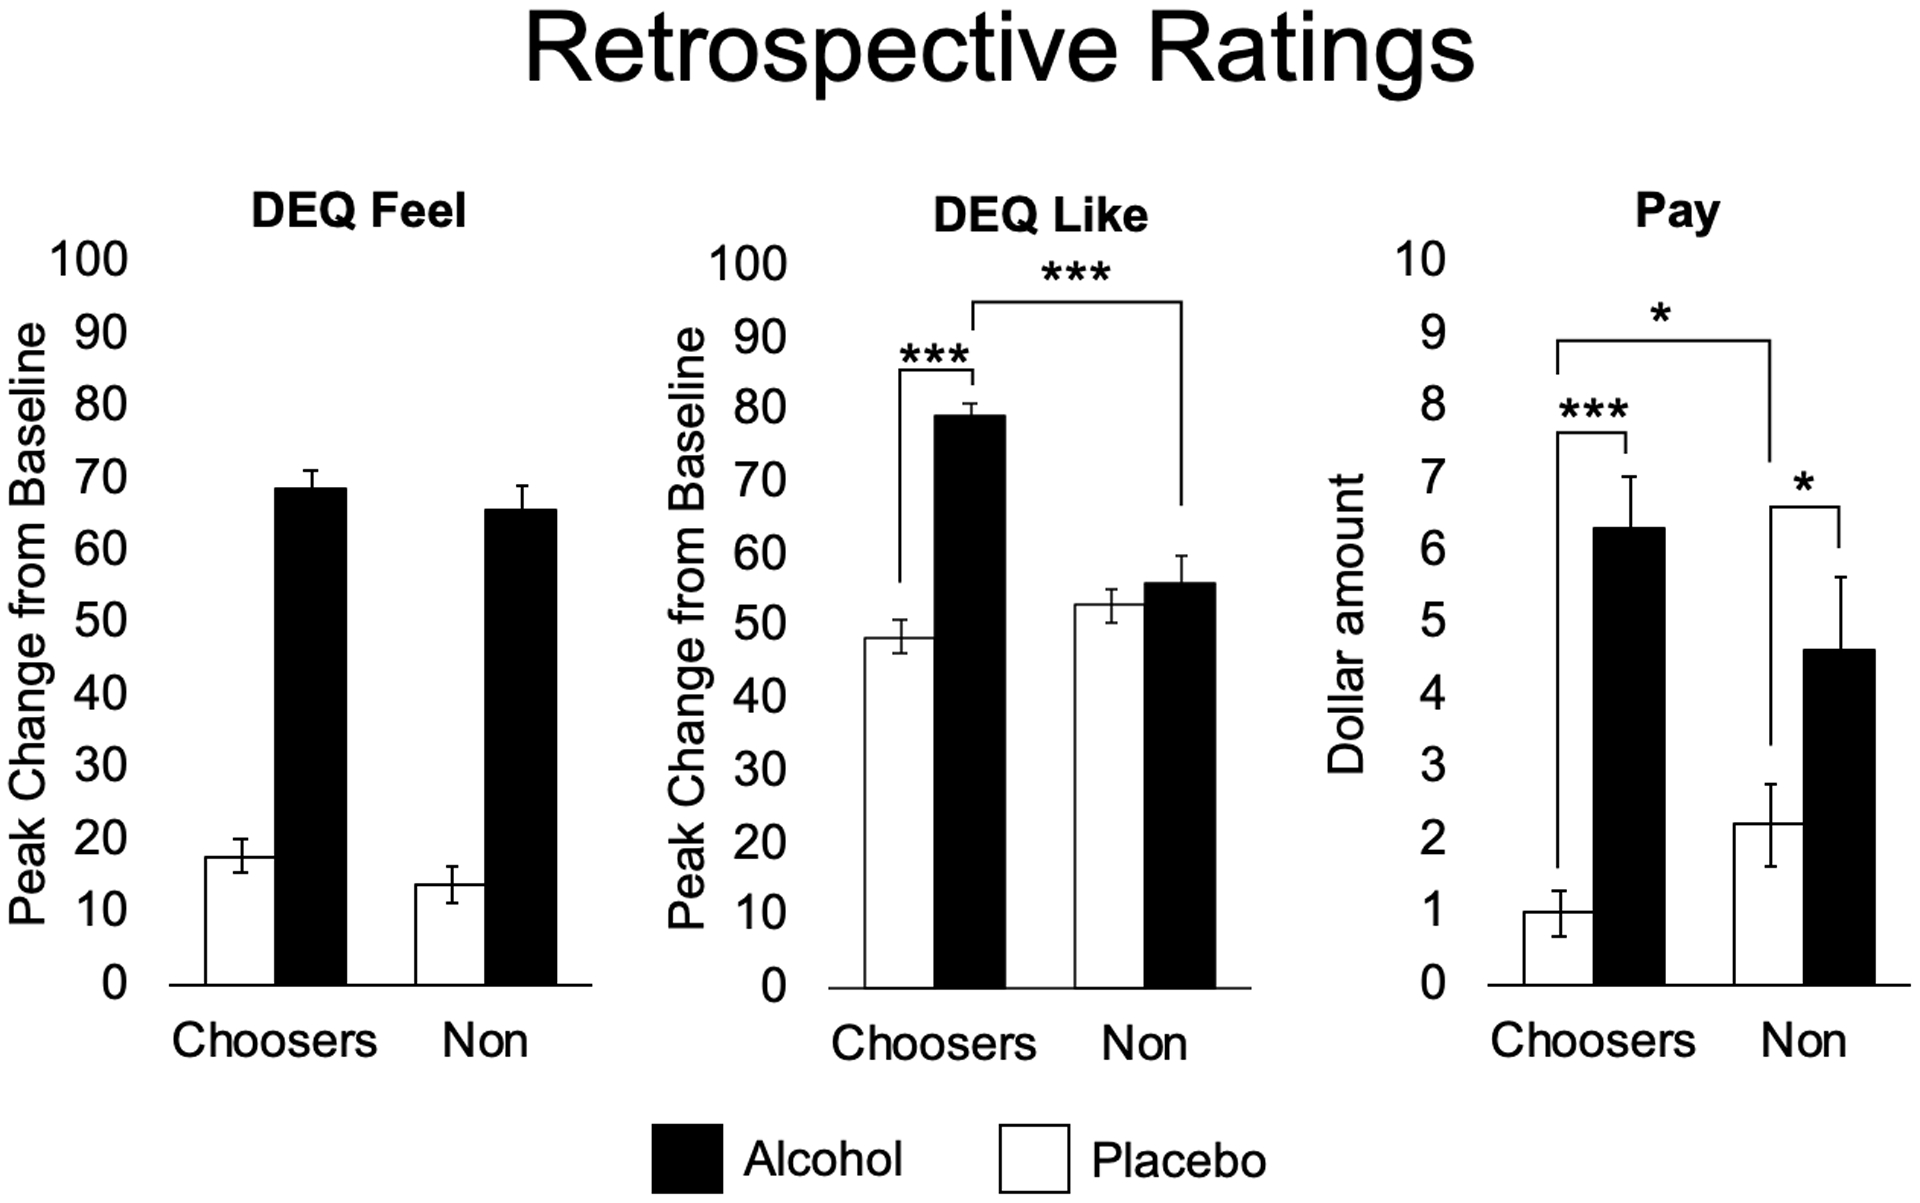
Mean (SEM) retrospective ratings assessed during the choice session, regarding effects on sampling sessions when they received alcohol (filled bars) or placebo (open bars) for alcohol choosers (Choosers; N=55) and Non-Choosers (N=40). DEQ = Drug Effects Questionnaire. Subjects rated how much they felt a drug effect, liked the effects, and how much they were willing to pay for drug in US dollars. Two-way ANOVAs were conducted, followed by t-tests when significant interactions were found. Independent samples t-test (Alcohol): DEQ Like; (Placebo): Pay (p=0.049). Paired t-test (Choosers): Like (p<0.001), Pay (p<0.001); (Non-Choosers): Pay (p=0.016). (*p<0.05; **p<0.01; ***p<0.001).
3.6. Likelihood of Alcohol Choice
Logistic regression was used to assess the impact of each subjective and physiologic variable from sampling sessions on the outcome of alcohol choice over choice of placebo (Table 2). Variables selected for the regression showed main effects of alcohol after ANOVA (Supplementary Table 1) and passed collinearity diagnostics in SPSS with a 3.0 VIF cut-off. The model resulted in 9 independent variables, derived from the average peak change score after alcohol minus the average peak change score after placebo on sampling sessions. The model as a whole, with all 9 predictors, correctly classified 69.1% of cases. As shown in Table 2, only one of the independent variables made a unique statistically significant contribution to the model (sedation, less of which predicted alcohol choice).
Table 2. Logistic Regression Predicting Likelihood of Choosing Alcohol.
Logistic regression for likelihood of choosing alcohol. Left side column lists predictor variables for outcome of alcohol choice. Variables selected for the regression showed main effects of alcohol after ANOVA and passed collinearity diagnostics with a 3.0 VIF cut-off. The variables represent the average peak change score from alcohol sampling sessions minus from the average peak change score from placebo sampling sessions. B values in second column from left indicate the directionality of relationship, with negative values indicating that an increase in variable magnitude (e.g., sedation), decreases the probability of choosing alcohol. Significant predictor p values are indicated in bold (p<0.05).
| Odds Ratio | 95% C.I. for Odds Ratio | |||||||
|---|---|---|---|---|---|---|---|---|
| B | S.E. | Wald | df | p | Lower | Upper | ||
| friendliness (POMS) | −.006 | .048 | .014 | 1 | .907 | .994 | .905 | 1.092 |
| Elation (POMS) | .085 | .068 | 1.591 | 1 | .207 | 1.089 | .954 | 1.244 |
| Anger (POMS) | −.129 | .086 | 2.225 | 1 | .136 | .879 | .742 | 1.041 |
| Fatigue (POMS) | .099 | .064 | 2.393 | 1 | .122 | 1.104 | .974 | 1.252 |
| Confusion (POMS) | .050 | .098 | .256 | 1 | .613 | 1.051 | .867 | 1.273 |
| Vigor (POMS) | −.088 | .059 | 2.226 | 1 | .136 | .916 | .817 | 1.028 |
| Stimulation (BAES) | .023 | .021 | 1.241 | 1 | .265 | 1.024 | .982 | 1.067 |
| Sedation (BAES) | −.054 | .023 | 5.417 | 1 | .020 | .947 | .905 | .991 |
| Heart Rate | .007 | .014 | .254 | 1 | .615 | 1.007 | .980 | 1.034 |
| Constant | .295 | .344 | .735 | 1 | .391 | 1.343 | ||
4. Discussion
This study examined the subjective effects of alcohol as predictors of alcohol choice in an alcohol vs placebo preference procedure in 95 social drinkers. We used standardized questionnaires to examine the effects of alcohol on mood, stimulation and sedation in relation to subjects’ choice of alcohol (choosers) or placebo (non-choosers). Just over half of the participants chose the alcohol-containing beverage over the placebo. These individuals reported more positive mood effects from alcohol and less anger and sedation compared to the non-choosers. The two groups did not differ in age, sex, habitual alcohol use, or mood states before beverage consumption (Table 1).
When compared to non-choosers, alcohol choosers rated their positive mood significantly higher after consuming alcohol (Fig. 1). However, alcohol did not significantly increase positive mood relative to placebo in alcohol choosers, nor did it significantly decrease positive mood in the non-choosers. Positive mood effects have previously been shown to play a large role in social drinking, and this increase has been suggested to play a role in behavioral reinforcement (aan het Rot et al., 2008; Sayette et al., 2012). While those studies examined the effects of alcohol in a social setting, our present study shows that alcohol choosers rated higher positive mood than non-choosers even in a solitary, controlled laboratory setting. Prior studies have suggested that the pleasurable and mood-elevating effects of many drugs classes, including opiates, stimulants and nicotine, contribute to their abuse liability (Fischman and Foltin, 1991; Balster and Bigelow, 2003), perhaps because of actions of these drugs on dopaminergic mesolimbic pathways (Volkow and Morales, 2015). Further to this point, our logistic regression provided additional insight by showing that, of all variables assessed, only sedation (i.e., a lesser sedative response) was uniquely predictive of alcohol choice. The lesser sedative response to alcohol is consistent with the extensive work of Marc Schuckit (Schuckit and Smith, 1996), indicating that a low level of response to alcohol is a risk factor for future excessive alcohol use.
Compared to choosers, non-choosers reported greater negative subjective effects from alcohol, namely greater increases in anger (Fig. 1) in POMS and sedation (Fig. 2, Table 2) in BAES. In addition, the non-choosers reported decreases in positive mood during the sessions after both alcohol and placebo (Fig. 1). These results suggest that the presence of negative effects is protective against preference for alcohol. While choosers also reported modest increases in sedation after alcohol, this effect was much more pronounced in the non-choosers, suggesting that the sedative effect of alcohol effects may reduce preference for alcohol. Prior studies have found that stimulating effects are stronger predictors of alcohol use than blunted sedating effects (King et al., 2011; King et al., 2020). Our combined findings with POMS and BAES suggest that the magnitude of sedating effects may also play a role in alcohol preference. This is consistent with a body of research (Schuckit et al., 2011; Hendershot et al., 2017; Wardell, Ramchandani and Hendershot, 2015) showing that lesser sedative effects may be predictive of future alcohol use.
Importantly, the two groups in this study did not differ in their physiologic responses to alcohol, or in their overall magnitude of feeling a drug effect. As expected, alcohol increased heart rate compared to placebo in the full participant cohort, but the two groups did not differ in alcohol-induced changes in heart rate (Fig. 3). Although early research suggested that greater heart rate increases after alcohol predicted alcohol reward (Conrod, Pihl and Vassileva, 1998; Conrod, Peterson and Pihl, 2001), we did not detect greater alcohol-induced heart rate in the choosers. We also saw no evidence that the chooser and non-chooser groups differed in overall sensitivity to alcohol. The two groups achieved similar blood alcohol levels (Fig. 4), they exhibited similar cardiovascular responses, and on measures of overall subjective effects the groups reported feeling the drug to a similar extent (Fig. 5). Thus, the choosers and non-choosers experienced similar physiologic effects, and pharmacokinetic factors did not account for the differences between groups.
Our present results can be compared to findings from an early study using a smaller sample, a lower dose of alcohol (0.5 g/kg) and three choice sessions instead of one (de Wit et al., 1987). In the previous study, choosers reported greater elation and vigor after alcohol, and non-choosers reported more fatigue and confusion. In the present study, choosers reported greater positive mood and non-choosers reported anger, anxiety and sedation. The patterns of responses that distinguish the choosers and non-choosers are remarkably similar despite differences in the subject samples, the dose of alcohol, and the procedure. The similarities across studies speak to the robustness of these findings.
The present study also had limitations. First, the sample was homogenous with regard to age, prior drug use and absence of psychiatric symptomatology. It is possible that these findings would not generalize to a broader sample of the population. Second, the study was conducted in a controlled laboratory setting, which minimized factors present in naturalistic settings (e.g., presence of others, drug-related expectations), factors known to influence responses to alcohol and consumption of alcohol (Kirkpatrick and de Wit, 2013). Next, we were not able to fully blind subjects regarding the identity of the drug administered. Although placebo was guessed correctly by only 52% of participants on the first placebo session, this number increased to 73% on the second placebo session, and subjects correctly identified alcohol on 91% and 89% on the two sessions. Finally, we note that the chooser and non-chooser groups in the present study did not differ in habitual alcohol consumption. Although this suggests that the responses in the laboratory do not fully predict consumption outside the laboratory, the responses to the drug under controlled conditions can nevertheless reveal important individual differences in acute pharmacological responses to the drug.
At this time, it is uncertain why people vary in their subjective response to alcohol. One previous study found an association between increased striatal activity and the stimulatory effects of alcohol (Weafer et al., 2018), suggesting that differences in neural responses to alcohol contribute to differences in subjective responses. In Weafer et al. (2018), individuals who reported greater feelings of stimulation after alcohol also exhibited greater increases in striatal activity, as measured by blood oxygen level dependent (BOLD) imaging. This is consistent with the key role of dopamine in drug reward (Volkow and Morales, 2015; Setiawan et al., 2014; Yoder et al., 2016; Volkow et al., 2017; Leurquin-Sterk et al., 2018), and suggests that one source of individual differences in alcohol reward may relate to dopaminergic function. Alternatively, genetic factors may predispose certain individuals to experience positive subjective effects from alcohol (Quickfall and el-Guebaly, 2006; Enoch and Goldman, 2001; Schuckit, 2018), and some single nucleotide polymorphisms affecting the subjective response to alcohol have already been identified (Yang et al., 2017; Otto et al., 2017). Alternatively, different individuals may experience essentially the same effects from alcohol, but for unknown reasons attribute different cognitive labels to the effects, as in accordance with Schachter’s two-factor theory of emotion (Schachter and Singer, 1962). Understanding the basis in subjective differences in alcohol experience may help to identify high-risk individuals and prevent the development of alcohol use disorder before it begins. This study suggests that both the presence of positive mood effects and lesser sedative effects play a role in individual preference for alcohol.
Supplementary Material
Acknowledgements
This research was supported by the National Institutes of Health [HdW: DA02812; JW: K01AA024519; CHM: T32DA043469].
Role of funding sources
Nothing to declare.
Footnotes
Conflict of interest
None.
5. References
- aan het Rot M, Russell JJ, Moskowitz DS and Young SN (2008) ‘Alcohol in a social context: Findings from event-contingent recording studies of everyday social interactions’, Alcoholism-Clinical and Experimental Research, 32(3), pp. 459–471. [DOI] [PubMed] [Google Scholar]
- American Psychiatric Association 2013. Diagnostic and Statistical Manual of Mental Disorders. 5th ed. Washington, DC. [Google Scholar]
- Balster RL and Bigelow GE (2003) ‘Guidelines and methodological reviews concerning drug abuse liability assessment’, Drug and Alcohol Dependence, 70(3), pp. S13–S40. [DOI] [PubMed] [Google Scholar]
- Berridge KC and Robinson TE (2016) ‘Liking, Wanting, and the Incentive-Sensitization Theory of Addiction’, American Psychologist, 71(8), pp. 670–679. [DOI] [PMC free article] [PubMed] [Google Scholar]
- Conrod PJ, Peterson JB and Pihl RO (2001) ‘Reliability and validity of alcohol-induced heart rate increase as a measure of sensitivity to the stimulant properties of alcohol’, Psychopharmacology, 157(1), pp. 20–30. [DOI] [PubMed] [Google Scholar]
- Conrod PJ, Pihl RO and Vassileva J (1998) ‘Differential sensitivity to alcohol reinforcement in groups of men at risk for distinct alcoholism subtypes’, Alcoholism-Clinical and Experimental Research, 22(3), pp. 585–597. [DOI] [PubMed] [Google Scholar]
- Corbin WR, Gearhardt A and Fromme K (2008) ‘Stimulant alcohol effects prime within session drinking behavior’, Psychopharmacology, 197(2), pp. 327–337. [DOI] [PMC free article] [PubMed] [Google Scholar]
- de Wit H and Griffiths RR (1991) ‘Testing the abuse liability of anxiolytic and hypnotic drugs in humans’, Drug and Alcohol Dependence, 28(1), pp. 83–111. [DOI] [PubMed] [Google Scholar]
- de Wit H and Phillips TJ (2012) ‘Do initial responses to drugs predict future use or abuse?’, Neuroscience and Biobehavioral Reviews, 36(6), pp. 1565–1576. [DOI] [PMC free article] [PubMed] [Google Scholar]
- de Wit H, Pierri J and Johanson CE (1989) ‘Assessing individual-differences in ethanol preference using a cumulative dosing procedure’, Psychopharmacology, 98(1), pp. 113–119. [DOI] [PubMed] [Google Scholar]
- de Wit H, Uhlenhuth EH, Pierri J and Johanson CE (1987) ‘Individual differences in behavioral and subjective responses to alcohol’, Alcoholism: Clinical and Experimental Research, 11(1), pp. 52–59. [DOI] [PubMed] [Google Scholar]
- Enoch MA and Goldman D (2001) ‘The genetics of alcoholism and alcohol abuse’, Current psychiatry reports, 3(2), pp. 144–51. [DOI] [PubMed] [Google Scholar]
- Fillmore MT (2001) ‘Cognitive preoccupation with alcohol and binge drinking in college students: Alcohol-induced priming of the motivation to drink’, Psychology of Addictive Behaviors, 15(4), pp. 325–332. [PubMed] [Google Scholar]
- Fischman MW and Foltin RW (1991) ‘Utility of subjective effects measurements in assessing abuse liability of drugs in humans’, British Journal of Addiction, 86(12), pp. 1563–1570. [DOI] [PubMed] [Google Scholar]
- Grant BF, Chou SP, Saha TD, Pickering RP, Kerridge BT, Ruan WJ, Huang BJ, Jung JS, Zhang HT, Fan A and Hasin DS (2017) ‘Prevalence of 12-Month Alcohol Use, High-Risk Drinking, and DSM-IV Alcohol Use Disorder in the United States, 2001–2002 to 2012–2013 Results From the National Epidemiologic Survey on Alcohol and Related Conditions’, Jama Psychiatry, 74(9), pp. 911–923. [DOI] [PMC free article] [PubMed] [Google Scholar]
- Hendershot CS, Wardell JD, McPhee MD and Ramchandani VA (2017) ‘A prospective study of genetic factors, human laboratory phenotypes, and heavy drinking in late adolescence’, Addiction Biology, 22(5), pp. 1343–1354. [DOI] [PMC free article] [PubMed] [Google Scholar]
- King A, Vena A Hasin D, de Wit H, O’Conor SJ, Cao D (2020) Subjective responses to alcohol in the development and maintenance of AUD. American Journal of Psychiatry. [DOI] [PMC free article] [PubMed] [Google Scholar]
- King AC, Cao DC, deWit H, O’Connor SJ and Hasin DS (2019) ‘The role of alcohol response phenotypes in the risk for alcohol use disorder’, Bjpsych Open, 5(3). [DOI] [PMC free article] [PubMed] [Google Scholar]
- King AC, de Wit H, McNamara PJ and Cao D (2011) ‘Rewarding, Stimulant, and Sedative Alcohol Responses and Relationship to Future Binge Drinking’, Archives of General Psychiatry, 68(4), pp. 389–399. [DOI] [PMC free article] [PubMed] [Google Scholar]
- Kirkpatrick MG, de Wit H. (2013) ‘In the company of others: social factors alter acute alcohol effects’ Psychopharmacology (Berl), 230(2), pp. 215–226. [DOI] [PMC free article] [PubMed] [Google Scholar]
- Lamb RJ, Preston KL, Schindler CW, Meisch RA, Davis F, Katz JL, Henningfield JE and Goldberg SR (1991) ‘The reinforcing and subjective effects of morphine in post-addicts: a dose-response study’, Journal of Pharmacology and Experimental Therapeutics, 259(3), pp. 1165–1173. [PubMed] [Google Scholar]
- Leurquin-Sterk G, Ceccarini J, Crunelle CL, Weerasekera A, de Laat B, Himmelreich U, Bormans G and Van Laere K (2018) ‘Cerebral dopaminergic and glutamatergic transmission relate to different subjective responses of acute alcohol intake: an in vivo multimodal imaging study’, Addiction Biology, 23(3), pp. 931–944. [DOI] [PubMed] [Google Scholar]
- Martin CS, Earleywine M, Musty RE, Perrine MW and Swift RM (1993) ‘Development and validation of the biphasic alcohol effects scale’, Alcoholism-Clinical and Experimental Research, 17(1), pp. 140–146. [DOI] [PubMed] [Google Scholar]
- McNair DM, Lorr M and Droppleman LF 1971. Manual for the Profile of Mood States. San Diego, CA: Educational and Industrial Testing Services. [Google Scholar]
- Morean ME, de Wit H, King AC, Sofuoglu M, Rueger SY and O’Malley SS (2013) ‘The drug effects questionnaire: psychometric support across three drug types’, Psychopharmacology, 227(1), pp. 177–192. [DOI] [PMC free article] [PubMed] [Google Scholar]
- Mulvihill LE, Skilling TA and VogelSprott M (1997) ‘Alcohol and the ability to inhibit behavior in men and women’, Journal of Studies on Alcohol, 58(6), pp. 600–605. [DOI] [PubMed] [Google Scholar]
- Murray CH, Weafer J and de Wit H (2020) ‘Stability of acute responses to drugs in humans across repeated testing: Findings with alcohol and amphetamine’, Drug and Alcohol Dependence, 212. [DOI] [PMC free article] [PubMed] [Google Scholar]
- Otto JM, Gizer IR, Deak JD, Fleming KA and Bartholow BD (2017) ‘A cis-eQTL in OPRM1 is Associated with Subjective Response to Alcohol and Alcohol Use’, Alcoholism-Clinical and Experimental Research, 41(5), pp. 929–938. [DOI] [PMC free article] [PubMed] [Google Scholar]
- Quickfall J and el-Guebaly N (2006) ‘Genetics and alcoholism: How close are we to potential clinical applications?’, Canadian Journal of Psychiatry-Revue Canadienne De Psychiatrie, 51(7), pp. 461–467. [DOI] [PubMed] [Google Scholar]
- Radoman M, Crane NA, Gorka SM, Weafer J, Langenecker SA, de Wit H and Phan KL (2020) ‘Striatal activation to monetary reward is associated with alcohol reward sensitivity’, Neuropsychopharmacology. [DOI] [PMC free article] [PubMed] [Google Scholar]
- Sayette MA, Creswell KG, Dimoff JD, Fairbairn CE, Cohn JF, Heckman BW, Kirchner TR, Levine JM and Moreland RL (2012) ‘Alcohol and Group Formation: A Multimodal Investigation of the Effects of Alcohol on Emotion and Social Bonding’, Psychological Science, 23(8), pp. 869–878. [DOI] [PMC free article] [PubMed] [Google Scholar]
- Schachter S and Singer JE (1962) ‘Cognitive, social, and physiological determinants of emotional state’, Psychological Review, 69(5), pp. 379–399. [DOI] [PubMed] [Google Scholar]
- Schuckit MA (1987) ‘Biological vulnerability to alcoholism’, Journal of Consulting and Clinical Psychology, 55(3), pp. 301–309. [DOI] [PubMed] [Google Scholar]
- Schuckit MA (2018) ‘A Critical Review of Methods and Results in the Search for Genetic Contributors to Alcohol Sensitivity’, Alcoholism-Clinical and Experimental Research, 42(5), pp. 822–835. [DOI] [PMC free article] [PubMed] [Google Scholar]
- Schuckit MA, Smith TL (1996) ‘An 8-Year Follow-up of 450 Sons of Alcoholic and Control Subjects’, Arch Gen Psychiatry, 53(3), pp. 202–210. [DOI] [PubMed] [Google Scholar]
- Schuckit MA, Smith TL, Trim RS, Allen RC, Fukukura T, Knight EE, Cesario EM and Kreikebaum SA (2011) ‘A Prospective Evaluation of How a Low Level of Response to Alcohol Predicts Later Heavy Drinking and Alcohol Problems’, American Journal of Drug and Alcohol Abuse, 37(6), pp. 479–486. [DOI] [PubMed] [Google Scholar]
- Setiawan E, Pihl RO, Dagher A, Schlagintweit H, Casey KF, Benkelfat C and Leyton M (2014) ‘Differential Striatal Dopamine Responses Following Oral Alcohol in Individuals at Varying Risk for Dependence’, Alcoholism-Clinical and Experimental Research, 38(1), pp. 126–134. [DOI] [PubMed] [Google Scholar]
- Volkow ND and Morales M (2015) ‘The Brain on Drugs: From Reward to Addiction’, Cell, 162(4), pp. 712–725. [DOI] [PubMed] [Google Scholar]
- Volkow ND, Wiers CE, Shokri-Kojori E, Tomasi D, Wang GJ and Baler R (2017) ‘Neurochemical and metabolic effects of acute and chronic alcohol in the human brain: Studies with positron emission tomography’, Neuropharmacology, 122, pp. 175–188. [DOI] [PubMed] [Google Scholar]
- Wardell JD, Ramchandani VA and Hendershot CS (2015) ‘A Multilevel Structural Equation Model of Within- and Between-Person Associations Among Subjective Responses to Alcohol, Craving, and Laboratory Alcohol Self-Administration’, Journal of Abnormal Psychology, 124(4), pp. 1050–1063. [DOI] [PMC free article] [PubMed] [Google Scholar]
- Wardell JD, Ramchandani VA and Hendershot CS (2016) ‘Drinking Motives Predict Subjective Effects of Alcohol and Alcohol Wanting and Liking During Laboratory Alcohol Administration: A Mediated Pathway Analysis’, Alcoholism-Clinical and Experimental Research, 40(10), pp. 2190–2198. [DOI] [PMC free article] [PubMed] [Google Scholar]
- Weafer J, Ross TJ, O’Connor S, Stein EA, de Wit H and Childs E (2018) ‘Striatal activity correlates with stimulant-like effects of alcohol in healthy volunteers’, Neuropsychopharmacology, 43(13), pp. 2532–2538. [DOI] [PMC free article] [PubMed] [Google Scholar]
- Yang BZ, Arias AJ, Feinn R, Krystal JH, Gelernter J and Petrakis IL (2017) ‘GRIK1 and GABRA2 Variants Have Distinct Effects on the Dose-Related Subjective Response to Intravenous Alcohol in Healthy Social Drinkers’, Alcoholism-Clinical and Experimental Research, 41(12), pp. 2025–2032. [DOI] [PMC free article] [PubMed] [Google Scholar]
- Yoder KK, Albrecht DS, Dzemidzic M, Normandin MD, Federici LM, Graves T, Herring CM, Hile KL, Walters JW, Liang TB, Plawecki MH, O’Connor S and Kareken DA (2016) ‘Differences in IV alcohol-induced dopamine release in the ventral striatum of social drinkers and nontreatment-seeking alcoholics’, Drug and Alcohol Dependence, 160, pp. 163–169. [DOI] [PMC free article] [PubMed] [Google Scholar]
Associated Data
This section collects any data citations, data availability statements, or supplementary materials included in this article.