

Abstract
Background
Given the age-related decline in glomerular filtration rate (GFR) in healthy individuals, we examined the association of all-cause death or cardiovascular event with the Kidney age - Chronological age Difference (KCD) score, whereby an individual’s kidney age is estimated from their estimated GFR (eGFR) and the age-dependent eGFR decline reported for healthy living potential kidney donors.
Methods
We examined the association between death or cardiovascular event and KCD score, age-dependent stepped eGFR criteria (eGFRstep), and eGFR < 60 ml/min/1.73 m2 (eGFR60) in a community-based high cardiovascular risk cohort of 3837 individuals aged ≥60 (median 70, interquartile range 65, 75) years, followed for a median of 5.6 years.
Results
In proportional hazards analysis, KCD score ≥ 20 years (KCD20) was associated with increased risk of death or cardiovascular event in unadjusted analysis and after adjustment for age, sex and cardiovascular risk factors. Addition of KCD20, eGFRstep or eGFR60 to a cardiovascular risk factor model did not improve area under the curve for identification of individuals who experienced death or cardiovascular event in receiver operating characteristic curve analysis. However, addition of KCD20 or eGFR60, but not eGFRstep, to a cardiovascular risk factor model improved net reclassification and integrated discrimination. KCD20 identified individuals who experienced death or cardiovascular event with greater sensitivity than eGFRstep for all participants, and with greater sensitivity than eGFR60 for participants aged 60–69 years, with similar sensitivities for men and women.
Conclusions
In this high cardiovascular risk cohort aged ≥60 years, the KCD score provided an age-adapted measure of kidney function that may assist patient education, and KCD20 provided an age-adapted criterion of eGFR-related increased risk of death or cardiovascular event. Further studies that include the full age spectrum are required to examine the optimal KCD score cut point that identifies increased risk of death or cardiovascular event, and kidney events, associated with impaired kidney function, and whether the optimal KCD score cut point is similar for men and women.
Trial registration
ClinicalTrials.gov NCT00400257, NCT00604006, and NCT01581827.
Supplementary Information
The online version contains supplementary material available at 10.1186/s12882-021-02324-y.
Keywords: Chronic kidney disease, eGFR, All-cause mortality, Cardiovascular disease
Background
Chronic kidney disease (CKD) “is defined as abnormalities of kidney structure or function, present for >3 months, with implications for health” [1], which include end-stage kidney disease, but predominantly premature mortality and cardiovascular (CV) events. Criteria for the definition of CKD in adults are: (1) signs of kidney damage, most often determined by an elevated urine albumin (or protein)- to-creatinine ratio; or (2) reduced kidney function, indicated by glomerular filtration rate (GFR) < 60 ml/min/1.73 m2 [1]. However, the GFR cut point of 60 ml/min/1.73 m2, based on a meta-analysis of the relationship between estimated GFR (eGFR) and mortality and morbidity in approximately 1.5 million participants from the general population [2], does not take account of the normal age-related decline in eGFR [3–9], and is subject to ongoing debate [1–3, 10–18]. Two potential limitations of the eGFR cut point of 60 ml/min/1.73 m2 are (i) its failure to identify individuals with eGFR-related increased risk of death or CV event who have eGFR above this cut point, and (ii) its overdiagnosis of CKD among individuals with eGFR below the cut point because of normal age-related decline in eGFR. The first limitation is illustrated by the association of eGFR 60–74 ml/min/1.73 m2 with increased risk of death and CV event in individuals aged < 65 years [19, 20].
An age-adapted definition of CKD has been proposed by several authors [7, 10, 21, 22] and age-dependent reference intervals for eGFR reported [7–9], but the relationship between these reference intervals and health outcomes has not been examined. Based on an analysis of all-cause mortality according to categories of eGFR and age in patients with little or no albuminuria [4], Delanaye et al. recently proposed age-dependent stepped eGFR criteria for CKD diagnosis, whereby CKD was defined by eGFR < 75 ml/min/1.73 m2 for individuals aged < 40 years, < 60 ml/min/1.73 m2 for individuals aged 40–65 years, and < 45 ml/min/1.73 m2 for individuals aged > 65 years (Fig. 1) [10]. However, these stepped eGFR criteria may fail to identify individuals with eGFR-related increased risk of death aged 40–64 years with eGFR ≥60 ml/min/1.73 m2, or aged 65–74 years with eGFR ≥45 ml/min/1.73 m2, described by Hallan et al. [20].
Fig. 1.

Scattergram plot of eGFR in relation to age for 3837 SCREEN-HF participants. The black line represents the age-related decline in eGFR from 105 ml/min/1.73 m2 at age 40 years to 60 ml/min/1.73 m2 at age 90 years in healthy living potential kidney donors [3]. eGFR values below the black line represent eGFR values below that of a healthy living potential kidney donor of the same age, and correspond to a kidney age that exceeds the chronological age. A 70-year old individual with an eGFR of 60 ml/min/1.73 m2 has an eGFR of a healthy 90-year-old; thus, the kidney age is 20 years older than the chronological age, and the Kidney age - Chronological age Difference (KCD) score is 90–70 = 20 years. Whereas CKD may be defined by eGFR < 60 ml/min/1.73 m2 (green line), age-dependent stepped eGFR criteria of Delanaye et al. [10] define CKD as eGFR < 75 ml/min/1.73 m2 for age < 40 years, < 60 ml/min/1.73 m2 for individuals between 40 and 65 years, and < 45 ml/min/1.73 m2 for age > 65 years (purple line) The red line corresponds to a KCD score of 20 years
We propose an alternative age-adapted measure of kidney function, the Kidney age - Chronological age Difference (KCD) score, whereby an individual’s kidney age is estimated from their eGFR and the age-dependent eGFR decline based on the metanalysis of 5482 healthy living potential kidney donors [3]. In this metanalysis, mean GFR of healthy living potential kidney donors was 104.9 ml/min/1.73 m2 at age 35 years, and declined at 0.89 ml/min/1.73 m2 per year after age 40 years [3]. To assist description of the KCD score and its calculation, we assumed a mean eGFR of 105 ml/min/1.73 m2 at age 40 years, and decline of 0.9 ml/min/1.73 m2 per year after age 40 years; from this relationship, expected eGFR for a healthy individual was calculated for their known chronological age:
| 1 |
This equation calculates an eGFR for a healthy 90-year old individual to be 60 ml/min/1.73 m2. Equation (1) can be transposed to give the kidney age corresponding to a measured eGFR, assuming an eGFR of 105 ml/min/1.73 m2 at age 40 years and decline in eGFR of 0.9 ml/min/1.73 m2 per year after age 40 years for a healthy individual:
| 2 |
An eGFR that falls below the regression line for the age-related decline in eGFR of a healthy individual (Fig. 1) indicates a kidney age that exceeds its chronological age. Thus, if a 70-year old individual has an eGFR of 60 ml/min/1.73 m2, their eGFR corresponds to a kidney age of 90 years for a healthy individual, and their KCD score is 90–70 = 20 years. This concept of kidney age is analogous to the concept of heart age, described by D’Agostino et al. [23].
We compared the associations of all-cause death or CV event with the KCD score, the age-dependent stepped eGFR criteria of Delanaye et al. [10] (eGFRstep), and the eGFR cut point of 60 ml/min/1.73 m2 (eGFR60) in a prospective cohort study of 3837 community-based individuals at increased CV event risk who had eGFR measured at baseline. Our hypothesis was that the KCD score would be superior to eGFRstep in identifying individuals at increased risk of death or CV event.
Methods
Study population
The SCReening Evaluation of the Evolution of New Heart Failure (SCREEN-HF) study, a prospective cohort study of men and women recruited from the community, has been described elsewhere [24–27]. A CONSORT flow diagram describing participant recruitment and follow-up is shown in Supplementary Fig. 1. In summary, 44,000 members of private health fund Bupa, resident in Melbourne or Shepparton, Victoria, Australia, were invited to participate. Inclusion criteria were age ≥ 60 years with one or more of self-reported treatment for hypertension or diabetes for ≥2 years, myocardial infarction or other ischaemic heart disease, valvular heart disease, irregular or rapid heart rhythm, cerebrovascular disease, or kidney impairment. We excluded individuals with previously diagnosed heart failure and those with well-recognised risk for heart failure, such as previous valve surgery or documented valve abnormality graded >mild, left ventricular ejection fraction < 50% or other known cardiac abnormality on previous echocardiography or other cardiac imaging. Recruitment commenced in May 2007 and was completed in January 2010. Of the 4054 individuals enrolled at the baseline visit (Visit 1), 3847 met the inclusion and exclusion criteria, of whom 3837 had eGFR measurement and complete baseline CV risk factor data. The SCREEN-HF study was registered at ClinicalTrials.gov NCT00400257, NCT00604006, and NCT01581827.
Details of the collection of baseline data are described elsewhere [24–27]. Serum creatinine was measured using the Siemens CRE_2 Jaffe kinetic method on the Siemens Advia 2400, a method that is IDMS traceable. eGFR was calculated using the Chronic Kidney Disease Epidemiology Collaboration (CKD-EPI) equation [28].
Outcome assessment
Follow-up was by participant visits and phone follow-up (Supplementary Fig. 1). All participant files were reviewed by a CV physician and documentation of all deaths and CV events was requested from hospitals, and the participant’s primary care provider, physician and cardiologist. Adjudicated heart failure diagnosis according to European Society of Cardiology criteria of 2012 has been described previously [25, 29]. Diagnoses of myocardial infarction, stroke and transient ischaemic attack were based on published criteria [30, 31].
Statistical analysis
Continuous variables were summarised as medians (interquartile range, IQR) and categorical variables summarised as numbers (percentages). Study outcome was death or CV event (incident myocardial infarction, heart failure, stroke/transient ischaemic attack, and coronary revascularisation). Data were censored at the date of last contact. Sensitivities and specificities for identification of individuals who experienced a study outcome were compared using McNemar’s test with Yates correction. Hazard ratios (HRs) and Bier scores, with 95% confidence interval (CI), for death or CV event were calculated from unadjusted proportional hazards models and also after adjustment for age, sex and CV risk factors (previous myocardial infarction, coronary revascularisation, stroke, transient ischaemic attack, peripheral vascular disease, diabetes, atrial fibrillation (AF), log2(body mass index, BMI), systolic blood pressure, antihypertensive medication, and smoking status on enrolment). Serum lipids, measured on blood collected at Visit 2 (Supplementary Fig. 1), were available for 3068 participants. However, neither total cholesterol nor high density lipoprotein cholesterol was statistically significantly associated with death or CV event in multivariable proportional hazards analysis; therefore, total and high density lipoprotein cholesterol were not included in the CV risk factor model, and CV risk factor data were available for 3837 participants. Inspection of Schoenfeld residuals confirmed that proportional hazards assumptions were satisfied. Area under the curve (AUC) statistics were estimated from time-dependent receiver operating characteristic (ROC) curves for 5-year follow-up with asymptotic CIs as described by Blanche et al. [32]. Continuous net reclassification improvement (NRI) for time-to-event data with inverse probability weighting was calculated as described by Pencina et al. [33–35] and CIs estimated with bootstrap resampling (n = 1000). Integrated discrimination improvement (IDI) and calibration plots were calculated using sex-specific 5-year absolute risk derived from models based on CV risk factors alone, and from CV risk factor models to which KCD score ≥ 20 years (KCD20), eGFRstep or eGFR60 were added, using coefficients from multivariable proportional hazards models and Kaplan-Meier estimates of baseline event rate, as described by Goff et al. [36]. IDI was calculated as described by Pencina et al. [33]. Given that absolute risk models were based on Kaplan-Meier estimates of baseline event rate, calibration plots were constructed comparing mean sex-specific 5-year absolute risk of death or CV event with mean Kaplan-Meier estimates of observed 5-year risk for deciles of absolute risk. A two-sided P value < 0.05 was considered to indicate statistical significance. Analyses were conducted using Statview 5.0.1 (SAS Institute, Cary, NC, USA), and R version 4.0.2.
Results
Characteristics of study population
Baseline participant characteristics are shown in Table 1. Median age was 70 (IQR: 65, 75) years on enrolment, 55% were male, 86% had hypertension, 18% had diabetes, 32% were obese (BMI ≥30 kg/m2), 45% were overweight (25 < BMI < 30 kg/m2), 22% had a history of ischaemic heart disease, 10% had a previous myocardial infarction, and 10% had AF.
Table 1.
Characteristics of 3837 SCREEN-HF participants who had eGFR measurement and complete data for cardiovascular risk factors on enrolment
| Characteristic | Men | Women |
|---|---|---|
| n = 2096 | n = 1741 | |
| Age (years) | 70 (65, 75) | 70 (65, 75) |
| Bupa member | 1921 (92%) | 1598 (92%) |
| Systolic blood pressure (mmHg) | 141 (131, 153) | 137 (127, 151) |
| Diastolic blood pressure (mmHg) | 81 (75, 88) | 80 (73, 87) |
| Pulse pressure (mmHg) | 60 (52, 70) | 57 (49, 68) |
| Heart rate (bpm) | 69 (61, 77) | 72 (65, 80) |
| Body mass index (kg/m2) | 28 (25, 31) | 28 (25, 32) |
| Waist circumference (cm) | 103 (96, 110) | 94 (86, 103) |
| Cardiovascular risk factors | ||
| Hypertension | 1716 (82%) | 1571 (90%) |
| Diabetes | 429 (20%) | 272 (16%) |
| Obesity (BMI ≥30 kg/m2) | 622 (30%) | 615 (35%) |
| Overweight (25 > BMI < 30 kg/m2) | 1049 (50%) | 682 (39%) |
| eGFR < 60 ml/min/1.73 m2 | 411 (20%) | 373 (21%) |
| Previous myocardial infarction | 302 (14.4%) | 87 (5.0%) |
| Coronary revascularisation | 460 (21.9%) | 115 (6.6%) |
| Total ischaemic heart disease | 607 (29%) | 243 (14%) |
| Previous stroke or transient ischaemic attack | 250 (11.9%) | 168 (9.6%) |
| Peripheral vascular disease | 93 (4.4%) | 32 (1.8%) |
| Cardiovascular disease | 810 (39%) | 394 (23%) |
| Atrial fibrillation | 240 (11.5%) | 151 (8.7%) |
| Pacemaker | 47 (2.2%) | 18 (1.0%) |
| Obstructive sleep apnoea | 215 (10.3%) | 63 (3.6%) |
| Physical inactivity | 1115 (63%) | 1013 (71%) |
| Tobacco use | ||
| Current smoker | 79 (3.8%) | 59 (3.4%) |
| Former smoker | 1161 (55%) | 587 (34%) |
| Non-smoker | 856 (41%) | 1094 (63%) |
| Alcohol > 2 drinks/day | 616 (29.4%) | 144 (8.3%) |
| Medication use | ||
| Antihypertensive therapy | 1873 (89%) | 1613 (93%) |
| ß-blocker | 477 (23%) | 411 (24%) |
| ACE inhibitor | 715 (34%) | 471 (27%) |
| ARB | 912 (44%) | 888 (51%) |
| ACE inhibitor and/or ARB | 1549 (74%) | 1295 (74%) |
| Calcium channel blocker | 570 (27%) | 477 (27%) |
| Statin therapy | 1159 (55%) | 830 (48%) |
| Thiazide diuretic | 616 (29%) | 563 (32%) |
| Loop diuretic | 47 (2.2%) | 62 (3.6%) |
| Mineralocorticoid antagonist | 9 (0.4%) | 14 (0.8%) |
| Digoxin therapy | 65 (3.1%) | 32 (1.8%) |
| Aspirin therapy | 976 (47%) | 624 (36%) |
| Clopidogrel therapy | 145 (6.9%) | 94 (5.4%) |
| Warfarin therapy | 120 (5.7%) | 57 (3.3%) |
| NSAID therapy | 170 (8.1%) | 152 (8.7%) |
| Insulin therapy | 67 (3.2%) | 41 (2.4%) |
| Oral anti-diabetic medication | 298 (14%) | 178 (10%) |
| Nitrate therapy | 109 (5.2%) | 108 (6.2%) |
| Biochemistry and haematology | ||
| eGFR (ml/min/1.73 m2) | 76 (63, 86) | 74 (62, 86) |
| Haemoglobin (g/dL) | 14.6 (13.8, 15.3) | 13.3 (12.7, 14.0) |
| White cell count (×109/L) | 7.1 (6.1, 8.2) | 7.1 (6.1, 8.3) |
| Platelets (×109/L) | 212 (183, 246) | 250 (216, 288) |
| Total cholesterol (mmol/L) | 4.5 (3.8, 5.2) | 5.2 (4.5, 5.9) |
| High density lipoprotein cholesterol (mmol/L) | 1.1 (0.9, 1.4) | 1.4 (1.2, 1.7) |
Data shown as median (interquartile range) or n (%). ACE angiotensin converting enzyme, ARB angiotensin II type 1 receptor blocker, bpm beats per minute, eGFR estimated glomerular filtration rate calculated using the Chronic Kidney Disease Epidemiology Collaboration (CKD-EPI) equation [28], NSAID non-steroidal anti-inflammatory drug. Total ischaemic heart disease refers to myocardial infarction, coronary revascularisation, coronary artery disease detected on coronary angiography, and angina. Cardiovascular disease refers to total ischaemic heart, cerebrovascular and peripheral vascular disease. Physical activity was assessed using the New York Heart Association questionnaire [37], and physical inactivity refers to participants who did not walk for, on average, ≥30 min per day and/or participate in, on average, ≥10 min per day of more vigorous exercise, including housework, for the 1757 men and 1419 women who completed the questionnaire. Alcohol > 2 drinks/day refers to consumption of more than 2 standard drinks on any day [38]. The numbers receiving antihypertensive therapy exceeded the numbers with hypertension because participants without hypertension received antihypertensive therapy. Total cholesterol and high-density lipoprotein cholesterol were measured in 1712 men and 1356 women. Data for cardiovascular disease, diabetes, obstructive sleep apnoea, smoking, alcohol intake and drug therapy were from self-report
Median follow-up was 5.6 (IQR: 4.6, 6.3) years. Among participants who experienced death or CV event, median time to death or CV event was 3.4 (IQR: 2.0, 5.0) years; 782 participants experienced death or CV event during follow-up, and 585 experienced death or CV event during 5 years of follow-up (Supplementary Table 1).
Relationship of eGFR to age
The relationship between participant age and baseline eGFR is shown in Fig. 1; the regression line for age-related decline in eGFR according to the meta-analysis for healthy living potential kidney donors reported by Pottel et al. [3], and the corresponding regression line for a KCD score of 20 years, are shown. Also shown are the stepped eGFR criteria [10], and the eGFR cut point of 60 ml/min/1.73 m2 for CKD definition [1].
Distribution of eGFR and KCD scores
eGFR had a skewed distribution and 784 participants (20%) had an eGFR < 60 ml/min/1.73 m2 (Fig. 2a). KCD scores also had a skewed distribution (Fig. 2b). A negative KCD score represented participants with eGFR above the regression line for healthy living potential kidney donors, and only 68 (1.8%) participants had a KCD score < − 20 years. By contrast, 694 (18.1%) participants had a KCD score ≥ 20 years (KCD20) and 468 (12.2%) had a KCD score ≥ 25 years.
Fig. 2.
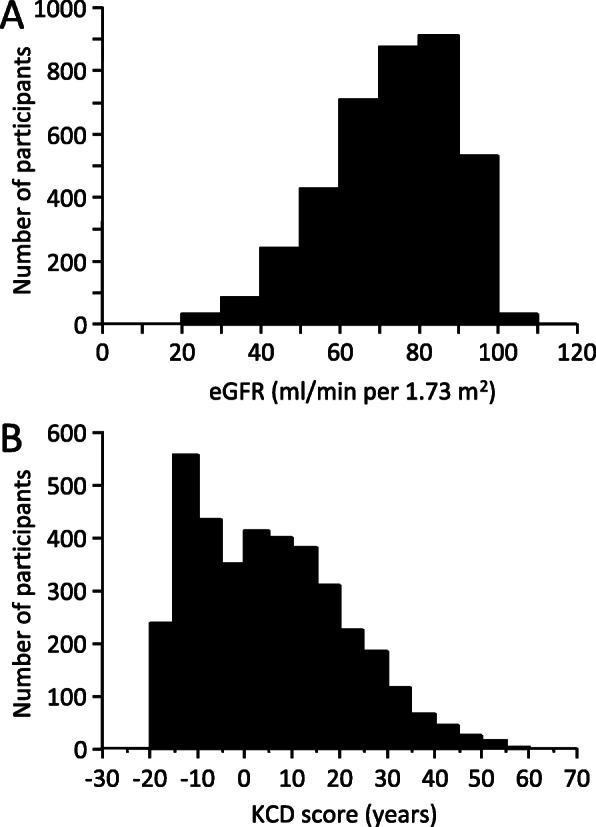
Histograms of the numbers of participants according to eGFR (a) and KCD score (b)
Relationship of KCD score to BMI
BMI was similar for KCD score categories ranging from <− 20 to ≥30 years (Supplementary Fig. 2), with no evidence that extremes of KCD score were associated with extreme deviation of body composition that may have impacted on serum creatinine, eGFR or KCD score.
Associations with death or CV event
In proportional hazards analysis, with participants with KCD scores < 0 years as the reference group, KCD scores 20 - < 25 years and ≥ 25 years were associated with increased risk of death or CV event in unadjusted analysis (Fig. 3a), and after adjustment for age, sex and CV risk factors (Fig. 3b). KCD score ≥ 20 years (KCD20) alone, eGFRstep alone, and eGFR60 alone were each associated with risk of death or CV event in unadjusted (univariate) proportional hazards analysis (Tables 2, 3). Moreover, KCD20 and eGFR60, but not eGFRstep, were each associated with risk of death or CV event in adjusted (multivariable) analyses that included CV risk factors (Tables 2, 3).
Fig. 3.
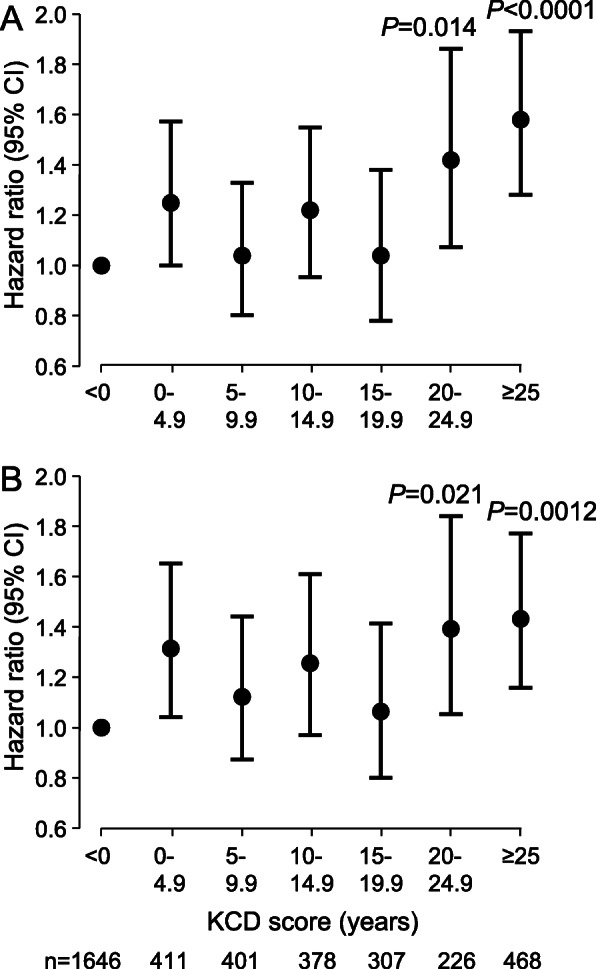
Hazard ratios for death or CV event according to KCD score. Hazard ratios (95% confidence interval, CI) for KCD score alone (a) or adjusted (b) for age, sex, and CV risk factors (previous myocardial infarction, coronary revascularisation, stroke or transient ischaemic attack, peripheral vascular disease, diabetes, atrial fibrillation, log2(BMI), systolic blood pressure, antihypertensive medication, and smoking status on enrolment). Hazard ratios from proportional hazards analysis of all events during follow-up (n = 782)
Table 2.
Proportional hazards analysis of 5-year association of death or cardiovascular event with cardiovascular risk factors alone, with KCD20 alone, and with KCD20 together with cardiovascular risk factors
| Variable | Cardiovascular risk factors alone | KCD20 alone or KCD20 with cardiovascular risk factors | ||
|---|---|---|---|---|
| Hazard ratio (95% CI) | P | Hazard ratio (95% CI) | P | |
| Univariate analysis | ||||
| KCD20 | 1.44 (1.19, 1.74) | 0.0004 | ||
| Multivariable analysis | ||||
| Age (years) | 1.07 (1.05, 1.08) | < 0.0001 | 1.07 (1.05, 1.08) | < 0.0001 |
| Male sex | 1.63 (1.35, 1.97) | < 0.0001 | 1.63 (1.35, 1.97) | < 0.0001 |
| Systolic blood pressure (per 10 mmHg) | 1.05 (1.00, 1.11) | 0.037 | 1.06 (1.01, 1.11) | 0.028 |
| Antihypertensive medication | 0.93 (0.70, 1.22) | 0.58 | 0.89 (0.68, 1.18) | 0.43 |
| Diabetes | 1.56 (1.29, 1.90) | < 0.0001 | 1.54 (1.27, 1.87) | < 0.0001 |
| Log2(body mass index, kg/m2) | 1.80 (1.23, 2.65) | 0.0026 | 1.74 (1.18, 2.56) | 0.0050 |
| Myocardial infarction | 0.96 (0.74, 1.24) | 0.74 | 0.96 (0.74, 1.24) | 0.74 |
| Coronary revascularisation | 1.75 (1.40, 2.19) | < 0.0001 | 1.75 (1.40, 2.19) | < 0.0001 |
| Previous stroke or transient ischaemic attack | 1.29 (1.01, 1.65) | 0.041 | 1.27 (1.00, 1.63) | 0.053 |
| Peripheral vascular disease | 1.51 (1.06, 2.16) | 0.022 | 1.50 (1.05, 2.13) | 0.025 |
| Atrial fibrillation/flutter | 1.62 (1.29, 2.03) | < 0.0001 | 1.64 (1.31, 2.06) | < 0.0001 |
| Current or former smoker | 1.21 (1.02, 1.44) | 0.029 | 1.22 (1.03, 1.45) | 0.023 |
| KCD20 | 1.31 (1.08, 1.60) | 0.0076 | ||
CI confidence interval, KCD20 Kidney age-Chronological age Difference score ≥ 20 years
Table 3.
Proportional hazards analysis of 5-year association of death or cardiovascular event with eGFRstep or eGFR60 alone, and with eGFRstep or eGFR60 together with cardiovascular risk factors
| Variable | eGFRstep alone or eGFRstep with cardiovascular risk factors | eGFR60 alone or eGFR60 with cardiovascular risk factors | ||
|---|---|---|---|---|
| Hazard ratio (95% CI) | P | Hazard ratio (95% CI) | P | |
| Univariate analysis | ||||
| eGFRstep | 1.78 (1.37, 2.31) | < 0.0001 | ||
| eGFR60 | 1.84 (1.54, 2.19) | < 0.0001 | ||
| Multivariable analysis | ||||
| Age (years) | 1.07 (1.05, 1.08) | < 0.0001 | 1.06 (1.05, 1.08) | < 0.0001 |
| Male sex | 1.63 (1.35, 1.97) | < 0.0001 | 1.65 (1.36, 1.99) | < 0.0001 |
| Systolic blood pressure (per 10 mmHg) | 1.05 (1.00, 1.11) | 0.034 | 1.06 (1.01, 1.11) | 0.022 |
| Antihypertensive medication | 0.91 (0.69, 1.21) | 0.52 | 0.89 (0.67, 1.17) | 0.39 |
| Diabetes | 1.54 (1.26, 1.87) | < 0.0001 | 1.54 (1.27, 1.87) | < 0.0001 |
| Log2(body mass index, kg/m2) | 1.77 (1.21, 2.61) | 0.0036 | 1.71 (1.16, 2.52) | 0.0066 |
| Myocardial infarction | 0.96 (0.74, 1.24) | 0.74 | 0.96 (0.74, 1.24) | 0.76 |
| Coronary revascularisation | 1.75 (1.40, 2.19) | < 0.0001 | 1.74 (1.39, 2.17) | < 0.0001 |
| Previous stroke or transient ischaemic attack | 1.27 (1.00, 1.63) | 0.053 | 1.27 (0.99, 1.62) | 0.057 |
| Peripheral vascular disease | 1.51 (1.06, 2.15) | 0.022 | 1.49 (1.05, 2.12) | 0.026 |
| Atrial fibrillation/flutter | 1.63 (1.30, 2.05) | < 0.0001 | 1.65 (1.31, 2.06) | < 0.0001 |
| Current or former smoker | 1.22 (1.02, 1.44) | 0.027 | 1.22 (1.03, 1.45) | 0.022 |
| eGFRstep | 1.29 (0.98, 1.70) | 0.067 | ||
| eGFR60 | 1.37 (1.13, 1.65) | 0.0015 | ||
CI confidence interval, eGFR60 eGFR < 60 ml/min/1.73 m2, eGFRstep age-dependent stepped eGFR criteria of Delanaye et al. [10]
KCD20 identified individuals who experienced death or CV event with greater sensitivity than eGFRstep for all participants (P < 0.0001), and in separate analysis of participants aged 60–69 years (P < 0.0001), 70–79 years (P < 0.0001), and ≥ 80 years (P < 0.046) (Fig. 4a). KCD20 also identified individuals who experienced death or CV event with greater sensitivity than eGFR60 for participants aged 60–69 years (P < 0.0001) (Fig. 4a). The higher sensitivity for identification of individuals who experienced death or CV event by eGFR60 for participants ≥70 years of age was associated with progressive decrease in specificity (Fig. 4b). By contrast, the lower sensitivity for identification of individuals who experienced death or CV event by eGFRstep was associated with higher specificity (Fig. 4b).
Fig. 4.
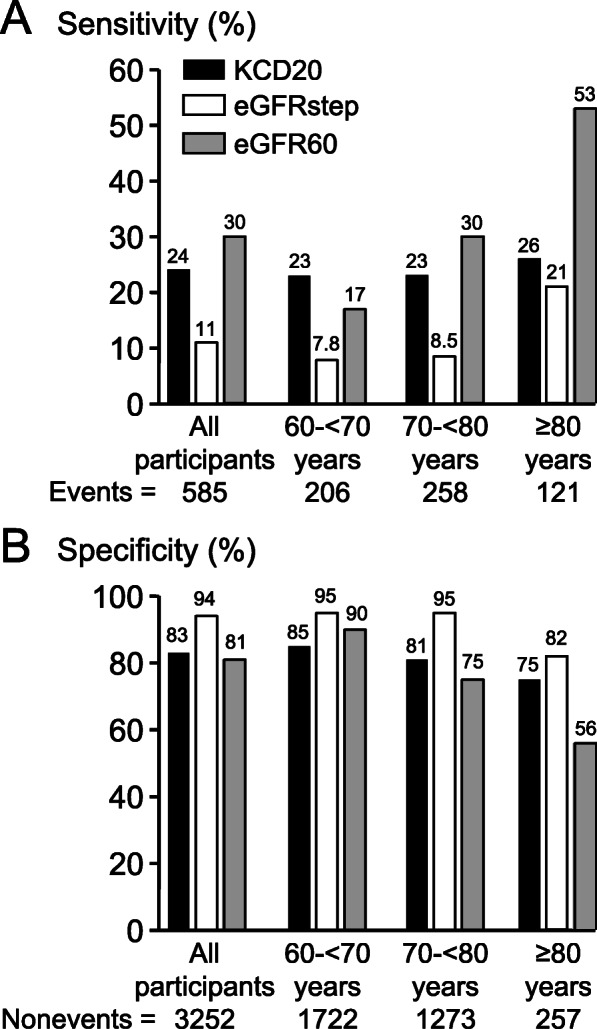
Sensitivity (a) and specificity (b) for the identification of individuals who experienced death or CV event during 5-year follow-up. Sensitivity and specificity for either Kidney age - Chronological age Difference score ≥ 20 years (KCD20), age-dependent stepped eGFR criteria of Delanaye et al. [10] (eGFRstep), or eGFR < 60 ml/min/1.73 m2 (eGFR60), for all participants, and for participants aged 60- < 70 years, 70- < 80 years, and ≥ 80 years. Among all participants, and each age category, sensitivities and specificities, compared using McNemar’s test with Yates correction, were statistically significantly different between KCD20, eGFRstep and eGFR60 (P < 0.05)
Sensitivities and specificities for the identification of individuals who experienced death or CV event by KCD20, eGFRstep and eGFR60 were similar for men and women (Supplementary Table 2).
Discrimination and classification
In ROC curve analysis, AUC for eGFR60 alone was higher than for either KCD20 alone (P < 0.0001) or eGFRstep alone (P < 0.0001), with no statistically significant difference between the AUC for KCD20 alone and eGFRstep alone (Table 4). The multivariable proportional hazards model based on CV risk factors alone identified individuals who experienced death or CV event with AUC of 0.717 (95% CI: 0.694, 0.740). No improvement in AUC was obtained when KCD20, eGFRstep, or eGFR60 was added to the CV risk factor model (Table 4). Addition of KCD20 or eGFR60 to the CV risk factor model decreased NRI for events, but increased NRI for non-events, such that the NRI for combined events and non-events was increased when KCD20 or eGFR60 was added to the CV risk factor model, whereas addition of eGFRstep to the CV risk factor model did not change NRI (Table 5). Moreover, addition of KCD20 or eGFR60, but not eGFRstep, to the CV risk factor model improved IDI (Table 5).
Table 4.
Time-dependent receiver operating characteristic curve analysis of identification of individuals who experienced death or cardiovascular event by cardiovascular risk factors, by KCD20, eGFRstep or eGFR60 alone, and by the combination of cardiovascular risk factors and KCD20, eGFRstep or eGFR60
| Model | AUC (95% CI) |
|---|---|
| Cardiovascular risk factors alone | 0.717 (0.694, 0.740)a |
| KCD20 alone | 0.531 (0.512, 0.550)b |
| eGFRstep alone | 0.523 (0.510, 0.537)b |
| eGFR60 alone | 0.561 (0.541, 0.581)b |
| Cardiovascular risk factors and KCD20 | 0.719 (0.696, 0.742)a |
| Cardiovascular risk factors and eGFRstep | 0.718 (0.695, 0.741)a |
| Cardiovascular risk factors and eGFR60 | 0.718 (0.695, 0.741)a |
AUC area under the curve calculated from time-dependent receiver operating characteristic curve analysis for 5-year follow-up [32], CI confidence interval, eGFR60 eGFR < 60 ml/min/1.73 m2, eGFRstep age-dependent stepped eGFR criteria of Delanaye et al. [10], KCD20 Kidney age-Chronological age Difference score ≥ 20 years
The model with cardiovascular risk factors alone included age, sex, previous myocardial infarction, coronary revascularisation, stroke or transient ischaemic attack, peripheral vascular disease, diabetes, atrial fibrillation, log2(BMI), systolic blood pressure, antihypertensive medication, and smoking status on enrolment
aThere were no statistically significant differences between AUC for the model with cardiovascular risk factors alone, and the models with cardiovascular risk factors and KCD20, eGFRstep, or eGFR60
bAUC for eGFR60 alone was higher than for KCD20 alone (P < 0.0001) and for eGFRstep alone (P = 0.0001), with no statistically significant difference between AUC for KCD20 alone and for eGFRstep alone (P = 0.31)
Table 5.
Continuous net reclassification improvement (NRI) and integrated discrimination improvement (IDI) for the identification of individuals who experienced death or cardiovascular event during 5-year follow-up by cardiovascular risk factor models including either KCD20, eGFRstep, or eGFR60, in comparison with cardiovascular risk factor model without kidney function parameter
| Estimate (95% CI) | P value | |
|---|---|---|
| Cardiovascular risk factor model including KCD20, in comparison with cardiovascular risk factor model without kidney function parameter. | ||
| NRI (events & non-events) | 0.126 (0.042, 0.201) | 0.0020 |
| NRI (events) | −0.504 (−0.575, − 0.424) | < 0.0001 |
| NRI (non-events) | 0.630 (0.580, 0.662) | < 0.0001 |
| IDI | 0.00359 (0.00098, 0.00620) | 0.0069 |
| Cardiovascular risk factor model including eGFRstep, in comparison with cardiovascular risk factor model without kidney function parameter. | ||
| NRI (events & non-events) | −0.010 (− 0.163, 0.122) | NS |
| NRI (events) | −0.607 (− 0.705, 0.599) | NS |
| NRI (non-events) | 0.597 (−0.485, 0.755) | NS |
| IDI | 0.00174 (−0.00024, 0.00372) | NS |
| Cardiovascular risk factor model including eGFR60, in comparison with cardiovascular risk factor model without kidney function parameter. | ||
| NRI (events & non-events) | 0.206 (0.105, 0.295) | < 0.0001 |
| NRI (events) | −0.329 (− 0.401, − 0.235) | < 0.0001 |
| NRI (non-events) | 0.534 (0.447, 0.576) | < 0.0001 |
| IDI | 0.00603 (0.00259, 0.00947) | 0.0006 |
CI confidence interval, eGFR60 eGFR < 60 ml/min/1.73 m2, eGFRstep age-dependent stepped eGFR criteria of Delanaye et al. [10], KCD20 Kidney age-Chronological age Difference score ≥ 20 years
Continuous NRI for time-to-event data with inverse probability weighting calculated as described by Pencina et al. [33–35] and CI estimated with bootstrapping. IDI calculation based on sex-specific 5-year absolute risk, calculated as described by Pencina et al. [33]
Calibration plots showed reasonable agreement between model-based calculated 5-year absolute risk and observed 5-year risk for models based on CV risk factors alone, and models that included KCD20, eGFRstep or eGFR60 (Supplementary Fig. 3). Brier scores were not different between proportional hazards models with CV risk factors alone, or with addition of KCD20, eGFRstep or eGFR60 to the CV risk factor model (Supplementary Fig. 3).
Discussion
The challenge for a CKD definition based on an eGFR threshold “with implications for health” [1] is to differentiate changes in kidney structure and function associated with premature morbidity and mortality from the anatomic and functional changes in the kidneys observed with healthy, normal aging [6, 16], a challenge that has stimulated investigation of age-adapted CKD criteria [7, 10, 21, 22]. The KCD score provided a continuous age-adapted measure of kidney function. Moreover, the association of KCD score ≥ 20 years (KCD20) with increased eGFR-related risk of death or CV event provided an age-adapted criterion for CKD that was able to diagnose CKD in individuals aged < 70 years with eGFR ≥60 ml/min/1.73 m2, and avoided the diagnosis of CKD in those with eGFR < 60 ml/min/1.73 m2 due to age. KCD20 had higher sensitivity than eGFRstep in identifying individuals aged ≥60 years with increased risk of death or CV event, and higher sensitivity than eGFR60 in identifying individuals aged 60–69 years with increased risk of death or CV event. Moreover, KCD20 was superior to eGFRstep with respect to improvement in NRI and IDI for identification of individuals with increased risk of death or CV event.
Our use of KCD20 as a criterion for diagnosis of CKD was based on proportional hazards analysis of the risk of death or CV event in SCREEN-HF participants, who were ≥ 60 years of age. Further studies that include the full age spectrum are required to examine the optimal KCD score cut point that identifies eGFR-related increased risk of death or CV event, and whether the optimal KCD score cut point is similar for men and women. Nevertheless, our use of KCD20 as a criterion for diagnosis of CKD was supported by the meta-analysis of ~ 2 million individuals by Hallan et al. who reported that individuals aged 18–54 and 55–64 years with eGFR 60–74 ml/min/1.73 m2 had increased risk for all-cause mortality in comparison with individuals with eGFR of 75–89 ml/min/1.73 m2, and also by the meta-analysis of 637,315 individuals by Matsushita et al. who reported that individuals with eGFR 60–74 ml/min/1.73 m2 had increased risk for CV mortality, coronary heart disease and heart failure, in comparison with individuals with eGFR of 95 ml/min/1.73 m2 [19, 20].
The meta-analyses of Hallan et al. and Matsushita et al. showed a J-shaped association of high eGFR with increased relative and absolute mortality risk in patients older than 55 years [20], and with increased cardiovascular mortality, coronary heart disease and stroke [19]. Hallan et al. [20] proposed this J-shaped association was caused by the influence of patients with reduced muscle mass due to malnutrition and other effects associated with cancer or other significant comorbidities. In our study of SCREEN-HF participants we found no evidence that low KCD score (<− 20 years) was associated with malnutrition. However, much larger studies of the full age spectrum in general populations are required to examine whether a J-shaped association exists for the KCD score and death and CV outcomes.
The higher sensitivity for identification of individuals with increased risk of death or CV event by KCD20, in comparison with eGFRstep and eGFR60, in SCREEN-HF participants aged 60–69 years was due to its identification of increased risk of death or CV event in individuals < 70 years of age with eGFR > 60 ml/min/1.73 m2, whereas neither eGFRstep nor eGFR60 was able to identify individuals aged > 40 years with eGFR > 60 ml/min/1.73 m2 and eGFR-related increased risk of death or CV event. The higher sensitivity for identification of individuals with increased risk of death or CV event by KCD20 in participants aged 60–69 years was in agreement with the meta-analyses of Hallan et al. [20] and Matsushita et al. [19], described above. The importance of identifying individuals < 70 years of age with eGFR > 60 ml/min/1.73 m2 with eGFR-related increased risk of death or CV event is their potential to benefit from early recognition of their increased risk, and from intervention to slow the rate of decline in their kidney function and decrease their risk.
eGFR60 identified individuals with increased risk of death or CV event with higher sensitivity than KCD20 in participants ≥70 years of age because eGFR60, in contrast to KCD20, was not adjusted for age, and the proportion of participants with eGFR < 60 ml/min/1.73 m2 increased progressively with age (Fig. 1). Consequently, the higher sensitivity of eGFR60 for identification of individuals with increased risk of death or CV event among participants ≥70 years of age was at the expense of decreased specificity due to increased numbers of false positives because of normal age-related decline in eGFR.
Variability of the KCD score reflects variability in eGFR measurement due to methodology and patient-specific factors. Given that a below-normal eGFR was more likely than an above-normal eGFR in the SCREEN-HF cohort, we considered the KCD limit of − 20 years to represent the lower limit of normal variation in KCD score for individuals without kidney disease. Thus, assuming a normal distribution for KCD score, the upper limit of normal variation in KCD score would be + 20 years, which was consistent with our data showing a KCD score ≥ 20 years (KCD20) was associated with increased risk of death or CV event. According to the full-age spectrum (FAS) equation [9], the lower reference eGFR (95% CI) for an individual aged 70 years is 56 ml/min/1.73 m2, which corresponds to a KCD score of 24 years. However, in contrast to the KCD score, the relationship between the lower reference eGFR from the FAS equation and health outcomes is unknown. Whereas the lower 95% CI of the FAS equation provides a single cut point, the KCD score provides a continuous age-adapted measure of kidney function that can be easily calculated and reported by the laboratory, analogous to the reporting of eGFR results. Moreover, in contrast to eGFRstep, the KCD score avoids the “birthday paradox” whereby CKD is “cured” when an individual reaches a specific age category [16].
It is of note that the 5482 healthy living potential kidney donors analysed by Pottel et al. [3] were selected by 12 different study groups, with variation between studies in mean GFR and 95% CI for specific age categories. The KCD score may assist in the definition of “normal” eGFR for age, and in the selection of living potential kidney donors.
By providing an age-adapted measure of kidney function, the KCD score may assist in patient education. Informing a patient that their kidney function is equivalent to that of an individual 20 or more years older than the patient’s age may be more informative for the patient than telling them their eGFR result in ml/min/1.73 m2, and may assist in improving patient compliance with therapy.
Our finding that addition of KCD20, eGFRstep or eGFR60 to a CV risk factor model failed to improve the AUC beyond that of the model based on CV risk factors alone was in agreement with previous studies [39], and the well-recognised insensitivity of ROC curve analysis to identify clinically important risk factors [40]. A meta-analysis of data from 637,315 participants showed that eGFR and albuminuria improved AUC when added to a CV risk factor model, although the increment in AUC was < 0.02 [19]. This small increment in AUC when kidney function parameters were added to a CV risk factor model reflected the extensive overlap between risk factors for CKD and CV disease, with age, hypertension, diabetes, obesity and smoking being major risk factors for both conditions [1].
Our study had a number of limitations. The SCREEN-HF cohort comprised volunteers (possible healthy volunteer bias) who were predominantly members of a health fund and, together with the inclusion criteria with respect to age ≥ 60 years and CV risk factors, may be cause for caution in the generalisation of our findings to the general community. However, the SCREEN-HF cohort was similar to the general Australian population aged ≥60 years. Of Australians aged 65–74 years, 53% have CV disease [41], 38.2% of men and 32.7% of women are obese [42], 17% have diabetes [43], 5% have AF [44], and 70% have hypertension [45]. Our findings are therefore likely to be applicable to the general Australian community. Although the SCREEN-HF cohort was limited to 3837 participants in this study, the inclusion criteria ensured sufficient events were observed during follow-up, although follow-up was relatively short. Another limitation was that we did not collect data for kidney outcomes such as end-stage kidney disease.
A further limitation of our study was that our analysis was based on a single eGFR measurement for each participant. However, any misclassification would have biased our results toward the null hypothesis. Moreover, most of the CKD Prognosis Consortium analyses of eGFR and risk of adverse events in both high-risk and general populations used as the reference group participants with only a single eGFR available [46]. Our equation for the calculation of KCD score was based on the meta-analysis of cross-sectional measured GFR reported by Pottel et al. [3]. Although eGFR calculated from the CKD-EPI equation may differ from measured GFR, the identification of individuals with increased risk of death or CV event by KCD20 in the SCREEN-HF cohort provided support for our use of CKD-EPI eGFR to calculate the KCD score.
We did not have urine data and therefore cannot report the proportion of participants with CKD according to urine albumin/creatinine ratio. Serum creatinine and eGFR are frequently measured as part of routine blood biochemistry, whereas the decision to measure albuminuria is usually based on an individual’s risk factor profile [47]. Previous studies reported most individuals with eGFR ≤60 ml/min/1.73 m2 did not have increased albuminuria [2, 48, 49], and eGFR ≤60 ml/min/1.73 m2 was associated with increased all-cause and cardiovascular mortality in the absence of increased albuminuria [2, 10]. However, increased albuminuria was a risk factor for all-cause mortality independent of eGFR [2, 20], and reduced eGFR with increased albuminuria was associated with increased risk for combined CV events and all-cause mortality [2, 48]. Thus, the threshold KCD score to define CKD may need to be modified if increased albuminuria is present. Certainly, an elevated KCD score should prompt measurement of albuminuria.
Conclusions
In summary, the KCD score provided an age-adapted measure of kidney function that may assist patient education, and a KCD score ≥ 20 years (KCD20) provided an age-adapted criterion of eGFR-related increased risk of death or CV event. KCD20 was more sensitive than eGFRstep in identifying individuals aged ≥60 years with increased risk of death or CV event, and more sensitive than eGFR60 in identifying individuals aged 60–69 years with increased risk of death or CV event. Further studies that include the full age spectrum are required to examine the optimal KCD score cut point that identifies increased risk of death or CV event, and kidney events, associated with impaired kidney function, and whether the optimal KCD score cut point is similar for men and women.
Supplementary Information
Acknowledgements
We thank all SCREEN-HF study participants and the study nurses, echocardiographers and administrative staff for their invaluable contribution.
Abbreviations
- AF
Atrial fibrillation
- BMI
Body mass index
- CKD
Chronic kidney disease
- CKD-EPI
Chronic Kidney Disease Epidemiology Consortium
- CV
Cardiovascular
- eGFR
Estimated glomerular filtration rate
- eGFRstep
The age-dependent stepped eGFR criteria of Delanaye et al. [10]
- eGFR60
eGFR cut point of 60 ml/min/1.73 m2
- FAS
Full-age spectrum
- GFR
Glomerular filtration rate
- HR
Hazard ratio
- IQR
Interquartile range
- KCD
Kidney age - Chronological age Difference
- KCD20
Kidney age - Chronological age Difference score ≥ 20 years
- ROC
Receiver operating characteristic
- SCREEN-HF
SCReening Evaluation of the Evolution of New Heart Failure
Authors’ contributions
D.J.C. designed the study, had full access to all the data in the study, takes responsibility for the integrity of the data and the accuracy of the data analysis, and wrote the manuscript. J.M.C., F.F.G., M.M., U.B., L.S., D.L., S.S., A.J.O., H.K., C.M.R. and D.L.P. made contributions to the conception and design of the study and the acquisition of data. All authors performed revisions for important intellectual content, and approved the final manuscript.
Funding
This research was supported by Bupa Australia, with subsequent support from the National Health and Medical Research Council of Australia (GTN0559010, GTN1044619, GTN1092642, GTN0395508 to D.J.C., GTN1045862, GTN1136372 to C.M.R., GTN1041796 to S.S., GTN0620241 to J.M.C., GNT0519456 to M.M.), the National Heart Foundation of Australia (G 07 M 3198, 102956), the Diabetes Australia Research Trust (Y15G-CAMD), The University of Melbourne, St. Vincent’s Hospital Melbourne, St. Vincent’s Institute of Medical Research, and the Victorian Government’s Operational Infrastructure Support Program.
Availability of data and materials
The datasets used and/or analysed during the current study are available from the corresponding author on reasonable request.
Declarations
Ethics approval and consent to participate
This study was approved by the Alfred Human Research Ethics Committee, conformed to the ethical standards of the Declaration of Helsinki, and written informed consent was obtained from all participants.
Consent for publication
Not applicable.
Competing interests
Bupa Australia was involved in study design, recruitment of participants, and funding, but was not involved in data collection, analysis or interpretation, or writing of the article. Bupa Australia had no control or influence over the decision to submit the final manuscript for publication.
U.B. was an employee of Bupa Australia. D.L. has received honoraria from Pfizer, Sanofi, Astra-Zeneca, Abbott, Bayer, MSD, GSK, Novartis and Nycomed. S.S. has received unrestricted educational grants from Schering Plough and Boehringer Ingelheim, and was Principal Investigator of the Novartis-sponsored Valsartan Intensified Primary Care Reduction of Blood Pressure (VIPER-BP) Study. H.K. received support from Novartis, Bristol-Myers Squibb, and Ardian/Medtronic. D.L.P. received payment from Johnson & Johnson, Bayer and Novartis for lectures. The remaining authors have no disclosures to report.
Footnotes
Publisher’s Note
Springer Nature remains neutral with regard to jurisdictional claims in published maps and institutional affiliations.
Henry Krum is deceased.
References
- 1.KDIGO 2012 Clinical practice guideline for the evaluation and Management of Chronic Kidney Disease Chapter 1: definition and classification of CKD. Kidney Int Suppl. 2013;3:19–62. doi: 10.1038/kisup.2012.64. [DOI] [PMC free article] [PubMed] [Google Scholar]
- 2.Levey AS, de Jong PE, Coresh J, El Nahas M, Astor BC, Matsushita K, Gansevoort RT, Kasiske BL, Eckardt KU. The definition, classification, and prognosis of chronic kidney disease: a KDIGO controversies conference report. Kidney Int. 2011;80(1):17–28. doi: 10.1038/ki.2010.483. [DOI] [PubMed] [Google Scholar]
- 3.Pottel H, Hoste L, Yayo E, Delanaye P. Glomerular filtration rate in healthy living potential kidney donors: a meta-analysis supporting the construction of the full age spectrum equation. Nephron. 2017;135(2):105–119. doi: 10.1159/000450893. [DOI] [PubMed] [Google Scholar]
- 4.Denic A, Glassock RJ, Rule AD. Structural and functional changes with the aging kidney. Adv Chronic Kidney Dis. 2016;23(1):19–28. doi: 10.1053/j.ackd.2015.08.004. [DOI] [PMC free article] [PubMed] [Google Scholar]
- 5.Hommos MS, Glassock RJ, Rule AD. Structural and functional changes in human kidneys with healthy aging. J Am Soc Nephrol. 2017;28(10):2838–2844. doi: 10.1681/ASN.2017040421. [DOI] [PMC free article] [PubMed] [Google Scholar]
- 6.Denic A, Mathew J, Lerman LO, Lieske JC, Larson JJ, Alexander MP, Poggio E, Glassock RJ, Rule AD. Single-nephron glomerular filtration rate in healthy adults. N Engl J Med. 2017;376(24):2349–2357. doi: 10.1056/NEJMoa1614329. [DOI] [PMC free article] [PubMed] [Google Scholar]
- 7.Wetzels JF, Kiemeney LA, Swinkels DW, Willems HL, den Heijer M. Age- and gender-specific reference values of estimated GFR in Caucasians: the Nijmegen biomedical study. Kidney Int. 2007;72(5):632–637. doi: 10.1038/sj.ki.5002374. [DOI] [PubMed] [Google Scholar]
- 8.Poggio ED, Rule AD, Tanchanco R, Arrigain S, Butler RS, Srinivas T, Stephany BR, Meyer KH, Nurko S, Fatica RA, Shoskes DA, Krishnamurthi V, Goldfarb DA, Gill I, Schreiber MJ., Jr Demographic and clinical characteristics associated with glomerular filtration rates in living kidney donors. Kidney Int. 2009;75(10):1079–1087. doi: 10.1038/ki.2009.11. [DOI] [PMC free article] [PubMed] [Google Scholar]
- 9.Pottel H, Delanaye P, Weekers L, Selistre L, Goffin K, Gheysens O, Dubourg L. Age-dependent reference intervals for estimated and measured glomerular filtration rate. Clin Kidney J. 2017;10(4):545–551. doi: 10.1093/ckj/sfx026. [DOI] [PMC free article] [PubMed] [Google Scholar]
- 10.Delanaye P, Jager KJ, Bokenkamp A, Christensson A, Dubourg L, Eriksen BO, Gaillard F, Gambaro G, van der Giet M, Glassock RJ, et al. CKD: a call for an age-adapted definition. J Am Soc Nephrol. 2019;30(10):1785–1805. doi: 10.1681/ASN.2019030238. [DOI] [PMC free article] [PubMed] [Google Scholar]
- 11.Chertow GM, Beddhu S. Modification of eGFR-based CKD definitions: perfect, or enemy of the good? J Am Soc Nephrol. 2019;30(10):1807–1809. doi: 10.1681/ASN.2019070743. [DOI] [PMC free article] [PubMed] [Google Scholar]
- 12.Wesson DE. Does eGFR by any number mean the same? J Am Soc Nephrol. 2019;30(10):1806–1807. doi: 10.1681/ASN.2019070749. [DOI] [PMC free article] [PubMed] [Google Scholar]
- 13.Trachtman H. Age-dependent definition of CKD. J Am Soc Nephrol. 2020;31:447. doi: 10.1681/ASN.2019090914. [DOI] [PMC free article] [PubMed] [Google Scholar]
- 14.Coresh J, Gansevoort RT, Consortium CKDP, Levin A, Jadoul M. Kdigo. Current CKD definition takes into account both relative and absolute risk. J Am Soc Nephrol. 2020;31(2):447–448. doi: 10.1681/ASN.2019101049. [DOI] [PMC free article] [PubMed] [Google Scholar]
- 15.Rule AD, Jager KJ, van den Brand J, Delanaye P. Authors’ reply. J Am Soc Nephrol. 2020;31(2):448–449. doi: 10.1681/ASN.2019111188. [DOI] [PMC free article] [PubMed] [Google Scholar]
- 16.Glassock RJ, Delanaye P, Rule AD. Should the definition of CKD be changed to include age-adapted GFR criteria? YES Kidney Int. 2020;97(1):34–37. doi: 10.1016/j.kint.2019.08.033. [DOI] [PubMed] [Google Scholar]
- 17.Levey AS, Inker LA, Coresh J. Should the definition of CKD be changed to include age-adapted GFR criteria?: con: the evaluation and management of CKD, not the definition, should be age-adapted. Kidney Int. 2020;97(1):37–40. doi: 10.1016/j.kint.2019.08.032. [DOI] [PubMed] [Google Scholar]
- 18.Rovin BH. Do kidneys grow old gracefully? Kidney Int. 2020;97(1):40–41. doi: 10.1016/j.kint.2019.08.031. [DOI] [PubMed] [Google Scholar]
- 19.Matsushita K, Coresh J, Sang Y, Chalmers J, Fox C, Guallar E, Jafar T, Jassal SK, Landman GW, Muntner P, Roderick P, Sairenchi T, Schöttker B, Shankar A, Shlipak M, Tonelli M, Townend J, van Zuilen A, Yamagishi K, Yamashita K, Gansevoort R, Sarnak M, Warnock DG, Woodward M, Ärnlöv J, CKD Prognosis Consortium Estimated glomerular filtration rate and albuminuria for prediction of cardiovascular outcomes: a collaborative meta-analysis of individual participant data. Lancet Diabetes Endocrinol. 2015;3(7):514–525. doi: 10.1016/S2213-8587(15)00040-6. [DOI] [PMC free article] [PubMed] [Google Scholar]
- 20.Hallan SI, Matsushita K, Sang Y, Mahmoodi BK, Black C, Ishani A, Kleefstra N, Naimark D, Roderick P, Tonelli M, Wetzels JFM, Astor BC, Gansevoort RT, Levin A, Wen CP, Coresh J, Chronic Kidney Disease Prognosis Consortium Age and association of kidney measures with mortality and end-stage renal disease. JAMA. 2012;308(22):2349–2360. doi: 10.1001/jama.2012.16817. [DOI] [PMC free article] [PubMed] [Google Scholar]
- 21.Rule AD, Gussak HM, Pond GR, Bergstralh EJ, Stegall MD, Cosio FG, Larson TS. Measured and estimated GFR in healthy potential kidney donors. Am J Kidney Dis. 2004;43(1):112–119. doi: 10.1053/j.ajkd.2003.09.026. [DOI] [PubMed] [Google Scholar]
- 22.O'Hare AM, Bertenthal D, Covinsky KE, Landefeld CS, Sen S, Mehta K, Steinman MA, Borzecki A, Walter LC. Mortality risk stratification in chronic kidney disease: one size for all ages? J Am Soc Nephrol. 2006;17(3):846–853. doi: 10.1681/ASN.2005090986. [DOI] [PubMed] [Google Scholar]
- 23.D'Agostino RB, Sr, Pencina MJ, Massaro JM, Coady S. Cardiovascular disease risk assessment: insights from Framingham. Glob Heart. 2013;8(1):11–23. doi: 10.1016/j.gheart.2013.01.001. [DOI] [PMC free article] [PubMed] [Google Scholar]
- 24.Campbell DJ, Coller JM, Gong FF, McGrady M, Prior DL, Boffa U, Shiel L, Liew D, Wolfe R, Owen AJ, Krum H, Reid CM. Risk factor management in a contemporary Australian population at increased cardiovascular disease risk. Intern Med J. 2018;48(6):688–698. doi: 10.1111/imj.13678. [DOI] [PubMed] [Google Scholar]
- 25.Gong FF, Jelinek MV, Castro JM, Coller JM, McGrady M, Boffa U, Shiel L, Liew D, Wolfe R, Stewart S, Owen AJ, Krum H, Reid CM, Prior DL, Campbell DJ. Risk factors for incident heart failure with preserved or reduced ejection fraction, and valvular heart failure, in a community-based cohort. Open Heart. 2018;5(2):e000782. doi: 10.1136/openhrt-2018-000782. [DOI] [PMC free article] [PubMed] [Google Scholar]
- 26.Coller JM, Gong FF, McGrady M, Jelinek MV, Castro JM, Boffa U, Shiel L, Liew D, Stewart S, Krum H, Reid CM, Prior DL, Campbell DJ. Age-specific diastolic dysfunction improves prediction of symptomatic heart failure by stage B heart failure. ESC Heart Fail. 2019;6(4):747–757. doi: 10.1002/ehf2.12449. [DOI] [PMC free article] [PubMed] [Google Scholar]
- 27.Campbell DJ, Gong FF, Jelinek MV, Castro JM, Coller JM, McGrady M, Boffa U, Shiel L, Wang BH, Liew D, et al. Prediction of incident heart failure by serum amino-terminal pro-B-type natriuretic peptide level in a community-based cohort. Eur J Heart Fail. 2019;4:449–459. doi: 10.1002/ejhf.1381. [DOI] [PubMed] [Google Scholar]
- 28.Levey AS, Stevens LA, Schmid CH, Zhang YL, Castro AF, 3rd, Feldman HI, Kusek JW, Eggers P, Van Lente F, Greene T, et al. A new equation to estimate glomerular filtration rate. Ann Intern Med. 2009;150(9):604–612. doi: 10.7326/0003-4819-150-9-200905050-00006. [DOI] [PMC free article] [PubMed] [Google Scholar]
- 29.McMurray JJ, Adamopoulos S, Anker SD, Auricchio A, Bohm M, Dickstein K, Falk V, Filippatos G, Fonseca C, Gomez-Sanchez MA, et al. ESC guidelines for the diagnosis and treatment of acute and chronic heart failure 2012: the task force for the diagnosis and treatment of acute and chronic heart failure 2012 of the European Society of Cardiology. Developed in collaboration with the heart failure association (HFA) of the ESC. Eur Heart J. 2012;33:1787–1847. doi: 10.1093/eurheartj/ehs104. [DOI] [PubMed] [Google Scholar]
- 30.Thygesen K, Alpert JS, Jaffe AS, Simoons ML, Chaitman BR, White HD, Joint ESCAAHAWHFTFftUDoMI. Katus HA, Lindahl B, Morrow DA, et al. Third universal definition of myocardial infarction. Circulation. 2012;126(16):2020–2035. doi: 10.1161/CIR.0b013e31826e1058. [DOI] [PubMed] [Google Scholar]
- 31.Sacco RL, Kasner SE, Broderick JP, Caplan LR, Connors JJ, Culebras A, Elkind MS, George MG, Hamdan AD, Higashida RT, Hoh BL, Janis LS, Kase CS, Kleindorfer DO, Lee JM, Moseley ME, Peterson ED, Turan TN, Valderrama AL, Vinters HV, American Heart Association Stroke Council, Council on Cardiovascular Surgery and Anesthesia. Council on Cardiovascular Radiology and Intervention. Council on Cardiovascular and Stroke Nursing. Council on Epidemiology and Prevention. Council on Peripheral Vascular Disease. Council on Nutrition, Physical Activity and Metabolism An updated definition of stroke for the 21st century: a statement for healthcare professionals from the American Heart Association/American Stroke Association. Stroke. 2013;44(7):2064–2089. doi: 10.1161/STR.0b013e318296aeca. [DOI] [PMC free article] [PubMed] [Google Scholar]
- 32.Blanche P, Dartigues JF, Jacqmin-Gadda H. Estimating and comparing time-dependent areas under receiver operating characteristic curves for censored event times with competing risks. Stat Med. 2013;32(30):5381–5397. doi: 10.1002/sim.5958. [DOI] [PubMed] [Google Scholar]
- 33.Pencina MJ, D'Agostino RB, Sr, D'Agostino RB, Jr, Vasan RS. Evaluating the added predictive ability of a new marker: from area under the ROC curve to reclassification and beyond. Stat Med. 2008;27(2):157–172. doi: 10.1002/sim.2929. [DOI] [PubMed] [Google Scholar]
- 34.Pencina MJ, Steyerberg EW, D'Agostino RB., Sr Net reclassification index at event rate: properties and relationships. Stat Med. 2017;36(28):4455–4467. doi: 10.1002/sim.7041. [DOI] [PubMed] [Google Scholar]
- 35.Pencina MJ, D'Agostino RB, Sr, Steyerberg EW. Extensions of net reclassification improvement calculations to measure usefulness of new biomarkers. Stat Med. 2011;30(1):11–21. doi: 10.1002/sim.4085. [DOI] [PMC free article] [PubMed] [Google Scholar]
- 36.Goff DC, Jr, Lloyd-Jones DM, Bennett G, Coady S, D'Agostino RB, Gibbons R, Greenland P, Lackland DT, Levy D, O'Donnell CJ, et al. 2013 ACC/AHA guideline on the assessment of cardiovascular risk: a report of the American College of Cardiology/American Heart Association task force on practice guidelines. Circulation. 2014;129(25 suppl 2):S49–S73. doi: 10.1161/01.cir.0000437741.48606.98. [DOI] [PubMed] [Google Scholar]
- 37.Kubo SH, Schulman S, Starling RC, Jessup M, Wentworth D, Burkhoff D. Development and validation of a patient questionnaire to determine New York heart association classification. J Card Fail. 2004;10(3):228–235. doi: 10.1016/j.cardfail.2003.10.005. [DOI] [PubMed] [Google Scholar]
- 38.National Health and Medical Research Council of Australia . Australian guidelines to reduce health risks from drinking alcohol. Canberra: Australian Government; 2009. [Google Scholar]
- 39.Chang A, Kramer H. Should eGFR and albuminuria be added to the Framingham risk score? Chronic kidney disease and cardiovascular disease risk prediction. Nephron Clin Pract. 2011;119(2):c171–c178. doi: 10.1159/000325669. [DOI] [PubMed] [Google Scholar]
- 40.Cook NR. Use and misuse of the receiver operating characteristic curve in risk prediction. Circulation. 2007;115(7):928–935. doi: 10.1161/CIRCULATIONAHA.106.672402. [DOI] [PubMed] [Google Scholar]
- 41.Cardiovascular health compendium. https://www.aihw.gov.au/reports/heart-stroke-vascular-disease/cardiovascular-health-compendium/contents/how-many-australians-have-cardiovascular-disease. Accessed 21 May 2018.
- 42.An interactive insight into overweight and obesity in Australia. https://www.aihw.gov.au/reports/overweight-obesity/interactive-insight-into-overweight-and-obesity/contents/how-many-people-are-overweight-or-obese. Accessed 21 May 2018.
- 43.Diabetes compendium. https://www.aihw.gov.au/reports/diabetes/diabetes-compendium/contents/how-many-australians-have-diabetes. Accessed 21 May 2018.
- 44.Ball J, Thompson DR, Ski CF, Carrington MJ, Gerber T, Stewart S. Estimating the current and future prevalence of atrial fibrillation in the Australian adult population. Med J Aust. 2015;202(1):32–35. doi: 10.5694/mja14.00238. [DOI] [PubMed] [Google Scholar]
- 45.Australian Institute of Health and Welfare . Cardiovascular disease, diabetes and chronic kidney disease - Australian facts: risk factors., Cardiovascular, diabetes and chronic kidney disease series no. 4. Cat. no. CDK 4. edn. Canberra: AIHW; 2015. [Google Scholar]
- 46.Go AS, Chertow GM, Fan D, McCulloch CE, Hsu CY. Chronic kidney disease and the risks of death, cardiovascular events, and hospitalization. N Engl J Med. 2004;351(13):1296–1305. doi: 10.1056/NEJMoa041031. [DOI] [PubMed] [Google Scholar]
- 47.Johnson DW, Jones GR, Mathew TH, Ludlow MJ, Chadban SJ, Usherwood T, Polkinghorne K, Colagiuri S, Jerums G, Macisaac R, et al. Chronic kidney disease and measurement of albuminuria or proteinuria: a position statement. Med J Aust. 2012;197(4):224–225. doi: 10.5694/mja11.11468. [DOI] [PubMed] [Google Scholar]
- 48.Foster MC, Hwang SJ, Larson MG, Parikh NI, Meigs JB, Vasan RS, Wang TJ, Levy D, Fox CS. Cross-classification of microalbuminuria and reduced glomerular filtration rate: associations between cardiovascular disease risk factors and clinical outcomes. Arch Intern Med. 2007;167(13):1386–1392. doi: 10.1001/archinte.167.13.1386. [DOI] [PubMed] [Google Scholar]
- 49.Inker LA, Coresh J, Levey AS, Tonelli M, Muntner P. Estimated GFR, albuminuria, and complications of chronic kidney disease. J Am Soc Nephrol. 2011;22(12):2322–2331. doi: 10.1681/ASN.2010111181. [DOI] [PMC free article] [PubMed] [Google Scholar]
Associated Data
This section collects any data citations, data availability statements, or supplementary materials included in this article.
Supplementary Materials
Data Availability Statement
The datasets used and/or analysed during the current study are available from the corresponding author on reasonable request.