

Abstract
The aim of the current study was to explore the value of tumor attenuation and quantitative analysis of perfusion parameters obtained from traditional tri-phasic CT scans in grading hepatocellular carcinoma (HCC).
Totally 39 patients (42 lesion samples) with pathologically confirmed HCC who underwent tri-phasic CT scans were enrolled. HCC lesions were divided into non-poorly differentiated HCC (NP-HCC; n = 31) and poorly differentiated HCC (pHCC; n = 11). All lesions were divided into 5 groups according to the attenuation on different CT enhancement phase. The values of tumor attenuation on different scanning phases were measured. The following parameters were calculated: arterial enhancement fraction (AEF), portal venous supply coefficient (PVC), and hepatic arterial supply coefficient (HAC). The relationship of perfusion parameters with the histological grade of HCC was analyzed. Receiver operating characteristic curves were generated.
No significant correlation was observed between the perfusion parameters and tumor grading. Only HAC showed a non-significant trend in different grades of HCC (pHCC < NP-HCC; P = .07). The pHCC cases had significantly decreased values of tumor attenuation on the unenhanced phase (TAu), tumor attenuation on the portal phase portal phase (TAp), and equilibrium phase (TAe) (P < .01). The difference of tumor attenuation between the portal phase and the unenhanced phase (TAp-TAu) of the pHCC cases was decreased than that of the NP-HCC cases (P < .01), whereas the difference of attenuation between the equilibrium phase and portal phase (TAe-TAp) was significantly higher in the pHCC cases than that in the NP-HCC cases (P < .01). TAe-TAp had the highest area under the curve. The number of tumor enhancement pattern in Group 5 of HCCs with a diameter of 3 cm or more was significantly more than that of HCCs with a diameter of less than 3 cm or with other different enhancement patterns (P < .01).
Histological HCC grading cannot be predicted by the perfusion parameters derived from traditional tri-phasic CT scans, whereas the tumor attenuation on different phases and the tumor attenuation differences among different phases, especially the mean value of TAe-TAp, might be useful for non-invasive prediction on the degree of HCC differentiation.
Keywords: CT perfusion, hepatocellular carcinoma, histological grade, tri-phasic CT, tumor attenuation
1. Introduction
Hepatocellular carcinoma (HCC) is a common malignancy worldwide[1] and predominantly develops in patients with cirrhosis.[2,3] Treatment methods include liver transplantation, surgical resection, radiofrequency ablation (RFA), transcatheter hepatic arterial chemoembolization (TACE) and targeted therapies.[4] Surgical resection is considered to be one of the most effective treatments for HCC, however, recurrence remains high.[5] Poorly differentiated HCC (pHCC) has higher tumor recurrence rate, poorer prognosis, and lower survival rate, compared to moderately and well-differentiated HCC (wHCC).[6,7] In the current therapy guidelines, RFA is not recommended for pHCC due to tumor seeding and the poor outcomes. Moreover, pHCC is a contraindication of liver transplantation due to high recurrence rate and poor survival.[8–10] Therefore, accurate preoperative assessment of tumor grade, especially pHCC, has been increasingly emphasized.
Histological grade is a well-established prognostic factor for survival or recurrence of HCC.[11] An increasing number of reports have explored non-invasive evaluation of the HCC histological grade using radiological analyses, such as diffusion-weighted magnetic resonance imaging,[11,12] and the hemodynamic patterns of CT arteriography and CT arterial portography.[13–15] The source of blood supply differs among tumors of different grades. Some studies have evaluated the role of the hemodynamic pattern in histological grading of HCC.[13–16] Yoshiki et al[13] suggested that the vascularity of pHCC was lower than those of the moderately differentiated HCC (mHCC) and wHCC radiologically. Tsuyoshi et al[15] reported that the intra-nodular cumulative artery number increased along with the malignant degree of HCC. It is believed that using the enhancement pattern to predict blood supply of different histological grades of HCC is not scientific, as the enhancement pattern of a tumor is qualitative rather than quantitative, and is usually subjectively determined by the researchers.[17]
During the development of HCC from a low-grade dysplastic nodule to advanced HCC, the arterial blood supply and angiogenesis are increased;[18,19] thus, quantifying HCC vascularity is important for evaluating tumor progression. CT perfusion is highly promising as a functional vascular imaging technique. However, because of the increased radiation dose, CT perfusion of liver is largely unfulfilled clinically. Fortunately, standard tri-phasic CT is a new method that can estimate the blood supply of liver.[20] The perfusion parameters of hepatic artery and portal vein can estimate the volume of each pixel. The arterial enhancement fraction (AEF) can assess the arterial perfusion of liver tumor.[21] We hypothesize that perfusion parameters may have higher diagnostic performance of predicting the HCC histological grade.
Up to now, there have been few studies focusing on the association between perfusion parameters and HCC grading. The aim of the present study was to investigate the roles of tumor attenuation values among each different dynamic phase and perfusion parameters derived from traditional tri-phasic CT scans in determining the histological grade of HCC. The results may provide a guidance for non-invasive and preoperative prediction on the degree of HCC differentiation.
2. Materials and methods
2.1. Patients
A total of 39 patients with pathologically confirmed HCCs between January 2015 and May 2017 were included in this study. The patients’ clinical characteristics are shown in Table 1. There were 24 men and 15 women (median age, 67 years old; range, 51–84 years old). All 39 patients suffered from liver cirrhosis; 19 patients were classified as Child-Pugh A; 12 patients were classified as Child-Pugh B; and 8 patients were Child-Pugh C. The causes of liver cirrhosis were chronic viral hepatitis (n = 33) and alcohol abuse (n = 6). The performed surgical methods included segmentectomy in 8 patients, lobectomy in 11 patients, and partial hepatectomy in 13 patients. Finally, the total number of resected HCC tumor samples from these 39 patients was 42.
Table 1.
Clinical Characteristics of the patients.
| Characteristics | Value |
| Median age, y | 67 (51–84) |
| The pathologic diagnosis of HCC | |
| Hepatic resection | 32 |
| Biopsy | 7 |
| Child-Pugh Classification | |
| Child-Pugh A | 19 |
| Child-Pugh B | 12 |
| Child-Pugh C | 8 |
| Background liver | |
| B-LC | 22 |
| C-LC | 11 |
| Alc-LC | 6 |
| The causes of liver cirrhosis | |
| Chronic viral hepatitis | 33 |
| Alcohol abuse | 6 |
| Gender | |
| Male | 24 |
| Female | 15 |
Inclusion criteria:
-
1.
pathological diagnosis of HCC;
-
2.
patients received conventional tri-phasic enhancement CT scan;
-
3.
time interval between enhancement CT scan and surgery was within 1 month;
-
4.
patients did not receive any previous treatment, such as RFA or TACE.
Exclusion criteria:
-
1.
the arterially enhancing portion of the tumor was too small to characterize (<5 mm);
-
2.
the main portal vein was occluded;
-
3.
patients with more than 3 concurrent lesions.
The study flowchart is shown in Fig. 1. The study was approved by the Ethics Committee of the Second Hospital of Shandong University (Jinan, China). Signed informed consent was obtained from each patient.
Figure 1.
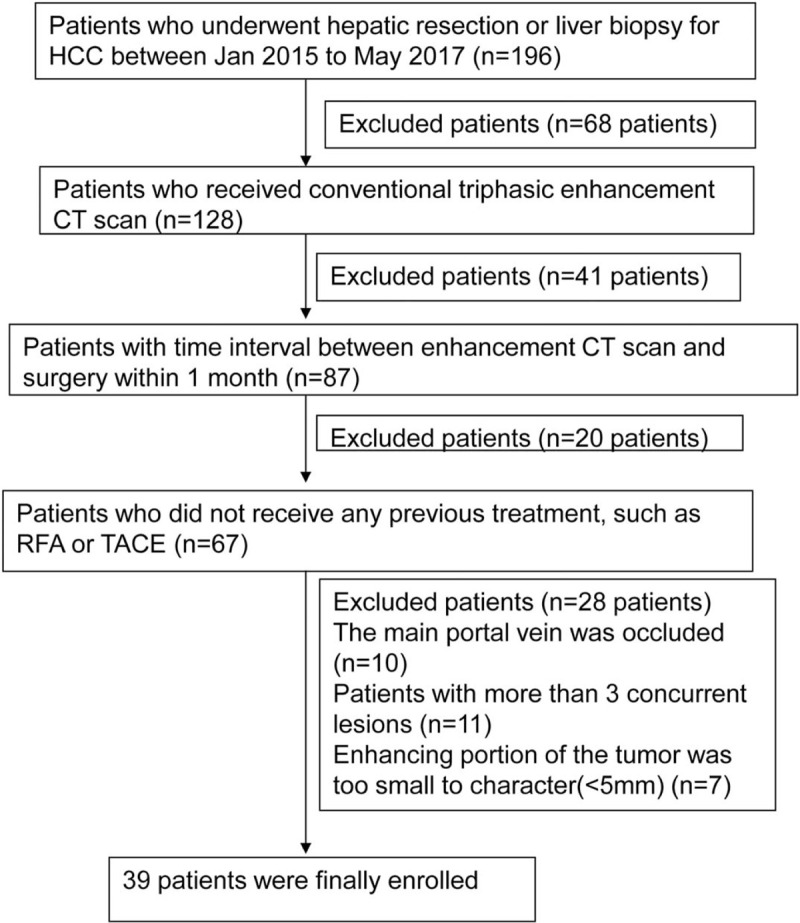
Study flowchart of subject enrollment.
2.2. Computed tomography (CT)
Tri-phasic enhancement CT scanning was performed on GE Discovery CT750 HD (GE Healthcare, Chicago, IL, US). Iodinated contrast (100 ml; Visipaque 270 mg iodine/ml; GE Healthcare, Chicago, IL, US) was used for contrast enhancement and saline (30 ml; 4 μl/sec) was power injected intravenously. The unenhanced CT scan, arterial phase CT scan, portal venous phase CT scan and equilibrium phase CT scan were respectively performed. The scanning parameters included: 128 × 0.625 mm collimation, 120 kV tube voltage, 200 mAs effective tube current and 1.375 pitch.
Using the CT hemodynamic kinetics software (GE Healthcare, Chicago, IL, US), portal venous supply coefficient (PVC) and hepatic arterial supply coefficient (HAC) were calculated from the tri-phasic CT scan based on the model-free maximum method. Regions of interest (ROIs) were drawn on the images that involved measurements of mean attenuation. PVC = (a2x1 + a2x2 + a3x3)/(a3v2–a2v3); HAC = (v2x1 + v2x2 + v3x3)/(a2v3–a3v2); where xi is the enhancement of the pixel in the liver, ai is the enhancement of the aorta, and vi is the enhancement of the portal vein; for i, 1 is the arterial phase, 2 is the portal venous phase and 3 is the delayed phase. Enhancement was measured in HU, relative to the average HU of the 3 phases.[20] AEF = [(HUa-HUu)/(HUp-HUu)] × 100, where HU is the attenuation, a is the arterial phase, p is the portal phase and u is the unenhanced CT scan. From these voxel-by-voxel HAC, PVC and AEF values, a histogram for each lesion was generated using JMP Pro, version 9.0 (SAS Institute Inc., North Tustin, USA).
2.3. Pathologic evaluation
For all the 42 lesions, 2 experienced pathologists who were blinded to the preoperative CT findings reviewed the hematoxylin and eosin-stained specimens. The tumor cell differentiation was graded according to the Edmondson-Steiner grading,[22] and the patients were divided into 2 groups: NP-HCC group, including wHCC (Edmondson grade I) and mHCC (Edmondson grade II); and the pHCC groups (Edmondson grade III or IV). When different grading results were observed within the same tumor sample, the grade of the major part was used to assign the tumor grade.[14]
2.4. Imaging interpretation
The attenuation of lesion on CT enhancement phase was visually evaluated by 2 radiologists independently as hyperattenuation, isoattenuation, or hypoattenuation by comparing with the surrounding liver parenchyma, and consensus was achieved. All lesions were classified as one of the following types:[14,23] group 1, isoattenuation-isoattenuation; group 2, hypoattenuation-isoattenuation; group 3, hypoattenuation-hypoattenuation; group 4, isoattenuation-hypoattenuation; group 5, hyperattenuation-hypoattenuation. Measurement of the values of tumor attenuation and quantitative analysis of the perfusion parameters were performed using the original images of the tri-phasic enhancement scan. The measurement was performed on a PACS workstation (GE Healthcare, Chicago, IL, US). At different phases, ROI, which was set as large as possible (excluding necrosis, hemorrhage and degeneration), was placed on the same position. Tumor attenuation values of the unenhanced (TAu), hepatic arterial (TAa), tumor attenuation on the portal phase hepatic portal (TAp), and hepatic equilibrium phases (TAe) were respectively recorded.
All the original imaging data of the patients were processed and analyzed using CT kinetics hemodynamic software (GE Healthcare, Chicago, IL, US). Two radiologists performed image analysis. The breathing motion was compensated by non-rigid image registration using the same software. For each patient, ROIs were put on 3 or 4 slices to reduce bias. The mean values of the perfusion parameters were calculated (Fig. 2).
Figure 2.
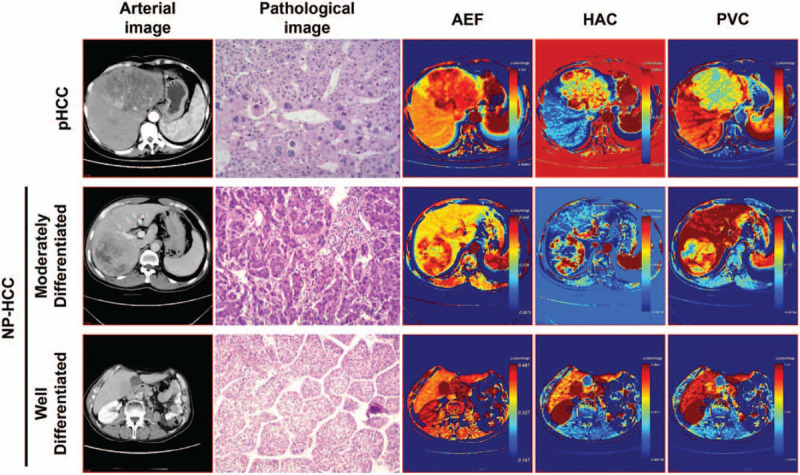
Pathological and pharmacokinetic images of the pHCC and NP-HCC. For the same patients with different histological grades, all AEF and HAC images showed heterogeneous (pHCC and mHCC) and homogeneous (wHCC) high perfusion in the lesions; all PVC images showed heterogeneous (pHCC and mHCC) and homogeneous (wHCC) low perfusion in the lesions. AEF = arterial enhancement fraction, AC = hepatic arterial supply coefficient, HCC = hepatocellular carcinoma, NP-HCC = non-poorly differentiated HCC, pHCC = poorly differentiated HCC, PVC = portal venous supply coefficient.
2.5. Statistical analysis
SPSS version 15.0 (SPSS Inc., Chicago, IL, US) was used for data analysis. Inter-observer agreement between the 2 radiologists was assessed by weighted k statistics. Degrees of agreement were categorized as follows: 0.00 to 0.19, poor agreement; 0.20 to 0.39, fair agreement; 0.40 to 0.59, moderate agreement; 0.60 to 0.79 substantial agreement; and 0.80 to 1.00, excellent agreement.
The relationship between the enhancement patterns on CT at each dynamic phase and pathologic grading was analyzed with Spearman's rank correlation test. Continuous values were expressed as mean ± standard deviation (SD). Mann–Whitney U test was used to compare the difference in tumor attenuation values between 2 histological grades. Tukey's test was used to analyze the difference in TAa-TAu, TAp-TAu, TAe-TAu, TAp-TAa, TAe-Taa, and TAe-TAp among the 3 histological grades. All the HCC lesions were divided into 2 groups based on whether the maximal diameter of the HCC lesions was larger than 3 cm, which was the median maximal diameter of all the lesions. The relationship between tumor attenuation on all the phases and the maximal diameter (less than 3 cm vs 3 cm or more) was analyzed using the Mann–Whitney U test. The differences in parameters among different HCC histological grades were analyzed by one-way analysis of variance (ANOVA) and the Tukey-Kramer post hoc test. The perfusion parameters were compared between the pHCC and NP-HCC (mHCC or wHCC) grades using Student t test. Receiver operating characteristic (ROC) curve analysis was performed to determine the optimal threshold value of each parameter. The area under curve (AUC), sensitivity and specificity were calculated. A P value P < .05 was considered as statistically significant.
3. Results
3.1. Histopathology of the lesions and enhancement patterns among various pathologic grades
The 42 lesions were classified as pHCC (n = 11), mHCC (n = 22), and wHCC (n = 9) (Fig. 3). Details of the radiographic pattern and histological findings are shown in Table 2. The number of cases in groups 1 to 5 were 0, 3 (all were wHCCs), 2 (all were wHCCs), 2 (all were wHCCs), 35 (5 were wHCCs, 19 were mHCCs, and 11 were pHCCs), respectively.
Figure 3.
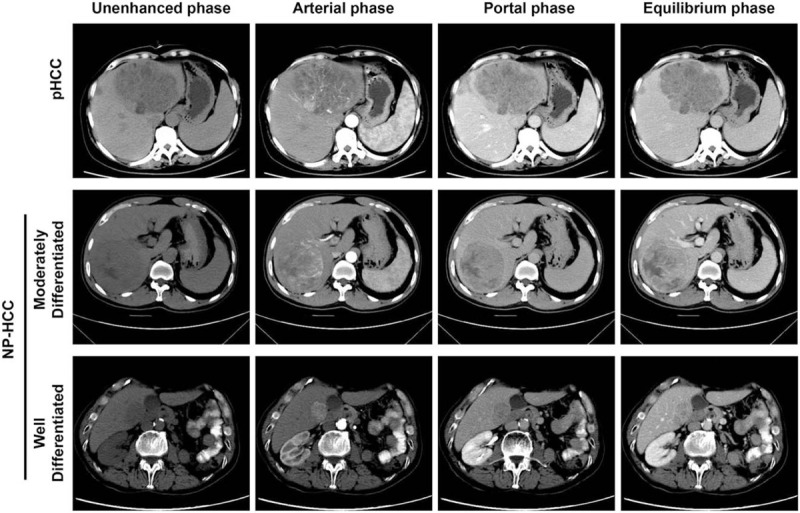
CT images of pHCC and NP-HCC at unenhanced, arterial, portal and equilibrium phases. The unenhanced phase showed large, apparent hypo-attenuating masses for pHCC and slight hypo-attenuating masses for mHCC; showed small, slight hypo-attenuating masses for wHCC. All the masses exhibited high attenuation at the arterial phase (heterogeneous for pHCC and mHCC, homogeneous for wHCC), and there were many tiny blood vessels in the pHCC. NP-HCC showed slight hypo-attenuating masses at the portal and equilibrium phases, whereas pHCC showed apparent hypo-attenuating masses. HCC = hepatocellular carcinoma, mHCC = moderately differentiated HCC, NP-HCC = non-poorly differentiated HCC, pHCC = poorly differentiated HCC, wHCC = well differentiated HCC.
Table 2.
Correlation between the enhancement patterns of CT at each dynamic phase and the histological grades.
| Enhancement patterns | ||||||
| Pathological grading | Isoattenuation/Isoattenuation (Group 1) | Hypoattenuation/Isoattenuation (Group 2) | Hypoattenuation/ Hypoattenuation (Group 3) | Isoattenuation/Hypoattenuation (Group 4) | Hyperattenuation/Hypoattenuation (Group 5) | Total |
| wHCC | 0 | 3 | 2 | 2 | 5 | 12 (29) |
| mHCC | 0 | 0 | 0 | 0 | 19 | 19 (45) |
| pHCC | 0 | 0 | 0 | 0 | 11 | 11 (26) |
| Total | 0 | 3 (7) | 2 (5) | 2 (5) | 35 (83) | 42 |
3.2. Inter-observer agreement
To assess the inter-observer agreement in terms of lesion detection and analysis of tumor parameters, the quadratic weighted k values were calculated. The measurement of tumor attenuation at each dynamic phase and the quantitative analysis of perfusion parameters exhibited excellent inter-observer agreement (k = 0.81). Therefore, the measurement and quantitative analysis of both radiologists were used for further analysis.
3.3. Radiologic and pathologic features of HCC patients related to the tumor attenuation
The pathologic and radiologic features that may affect the tumor attenuation at each dynamic phase were summarized in Table 3. With regard to the histological grade, the mean diameters of the pHCCs (range 1.8–13.6), mHCCs (range 1.1–10.3) and wHCCs (range 1.3–12.9) were 7.1, 4.8, and 6.1 cm, respectively.
Table 3.
Radiologic and pathologic parameters for the comparison of tumor attenuation at different dynamic phases.
| Variable | Value |
| Background liver | |
| Normal | 0 |
| Chronic hepatitis | 33 |
| Fibrosis | 0 |
| Cirrhosis | 42 |
| Pre-contrast attenuation | |
| High | 1 |
| Iso | 11 |
| Low | 30 |
| Capsule | |
| Presence | 29 |
| Absence | 13 |
| Histological grade | |
| Well, Moderately | 31 |
| Poorly | 11 |
| Histological architecture | |
| Pure trabecular | 15 |
| Trabecular and acinar | 4 |
| Trabecular and others | 20 |
| Nontrabecular | 3 |
3.4. Comparison of the enhancement patterns among different pathologic grades of HCC and the relationship with the maximal diameter of HCC lesions
The predominant enhancement patterns of HCC at the arterial and portal venous or equilibrium phase differed significantly according to the histological grading of the tumor (P = .001). The proportions of arterial hyper attenuation were significantly higher for the mHCC or wHCC (P < .001). Besides, the proportion of HCC lesions with typical enhancement (both arterial hyperattenuation and portal washout) differed significantly between the wHCC group and the mHCC or pHCC group (P < .001). This indicate that the enhancement patterns of HCC differed significantly among various pathologic grades.
There was a significant correlation between the enhancement patterns and the maximal diameter for all HCCs (P < .01, Table 4). This indicates that the maximal diameter of HCC is related to the histological grade.
Table 4.
Comparison of the enhancement patterns and maximal diameter for all HCC lesions.
| Tumor enhancement patterns | |||||
| Maximal diameter | Isoattenuation/Isoattenuation (Group 1) | Hypoattenuation/Isoattenuation (Group 2) | Hypoattenuation/Hypoattenuation (Group 3) | Isoattenuation/Hypoattenuation (Group 4) | Hyperattenuation/Hypoattenuation (Group 5) |
| Less than 3 cm | 0 | 1 | 0 | 1 | 11 |
| 3 cm or more | 0 | 2 | 2 | 1 | 24∗ |
3.5. Comparison of the perfusion parameters among different histological grades of HCC
To compare the perfusion parameters among various histological grades, one-way ANOVA and the Tukey–Kramer post hoc test were performed. No significant difference was found in the perfusion parameters between the pHCCs and NP-HCCs (Table 5), but there was a decreasing trend in the change of HAC. The pHCC patients had higher HAC than that of the NP-HCC patients. AEF was 0.598 ± 0.075 in the pHCCs and 0.646 ± 0.169 in the NP-HCCs, respectively. The pHCC patients had lower AEF than that of the NP-HCC patients, but there was no statistical significance (P = .376; Table 5). As shown in Figure 4, the AUCs for AEF, HAC, and PVC were 0.552, 0.698, and 0.519, respectively. The AUC of HAC was higher than the AUCs of AEF and PVC, but there was no statistical significance (P = .368). The specificity of AEF, HAC, PVC were 90.9%, 100%, 81.8%, respectively, and the sensitivity were 35.7%, 46.4%, 35.7%, respectively. This suggests that HAC has a trend to reflect the blood flow changes among various histological grades.
Table 5.
Comparison of CT perfusion parameters between pHCC and NP-HCC.
| Perfusion parameters | pHCC | NP-HCC | P |
| AEF | 0.598 ± 0.075 | 0.646 ± 0.169 | .376 |
| HAC | 0.02 ± 0.035 | 0.004 ± 0.04 | .079 |
| PVC | 0.249 ± 0.08 | 0.246 ± 0.09 | .935 |
Figure 4.
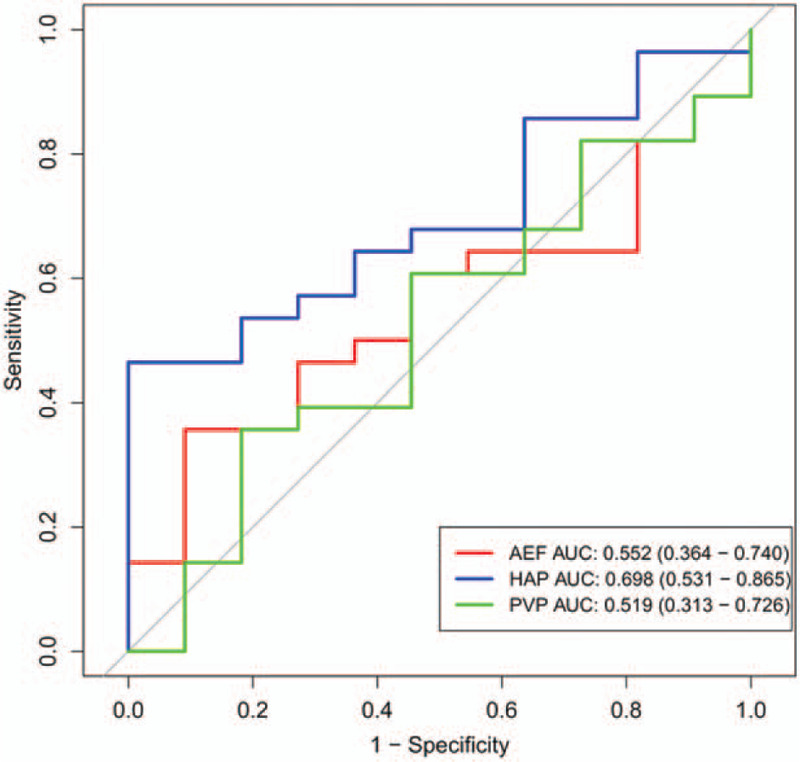
The ROC curves of AEF, HAC, and PVC values for pHCC and NP-HCC. AEF = arterial enhancement fraction, AUC = area under the curve, HAC = hepatic arterial supply coefficient, HCC = hepatocellular carcinoma, NP-HCC = non-poorly differentiated HCC, pHCC = poorly differentiated HCC, PVC = portal venous supply coefficient.
3.6. Comparison of the values of tumor attenuation between different dynamic phases and histological grades
To compare the values of tumor attenuation of different dynamic phases and pathologic grades, Student t test and ROC curves analyzed. The pHCCs had significantly lower tumor attenuation values of TAu, Tap, and TAe than those of the NP-HCCs (P < .01; Table 6). The AUCs for TAu, TAp, and TAe were 0.88, 0.921, and 0.822, respectively. The specificity of TAu, TAp, and TAe were 100%, 91.9%, 81.8%, respectively, and the sensitively were 62.9%, 88.9%, 81.5%, respectively (Fig. 5). The TAp-TAu was significantly lower in pHCCs than that in NP-HCCs (P < .01), with the AUC of 0.85, the specificity of 100% and the sensitivity of 66.7%, respectively. Compared with the NP-HCCs, pHCCs had significantly increased TAe-TAp (P < .01). TAe-TAp had the highest AUC, which was 0.894, and the specificity and sensitivity of TAe-TAp were 90.9% and 77.8%, respectively. No significant difference was found in TAa, TAa-TAu, TAe-TAu, TAe-TAa and TAp-TAa between the pHCC and NP-HCC cases (P > .01; Fig. 5; Table 6). This indicates that the pHCC shows a faster contrast washout than the NP-HCC.
Table 6.
Comparison of CT values in pHCC and NP-HCC.
| Phase | pHCC | NP-HCC | P |
| TAu | 38.9 ± 5.1 | 47.9 ± 5.9 | <.01 |
| TAa | 68.9 ± 14.5 | 82.4 ± 16.1 | .021 |
| TAp | 65.5 ± 7.6 | 86.4 ± 12.0 | <.01 |
| TAe | 60.5 ± 8.5 | 72.5 ± 10.2 | <.01 |
| TAa-TAu | 30.0 ± 12.5 | 34.5 ± 10.2 | .348 |
| TAp-TAu | 26.5 ± 6.0 | 38.5 ± 6.1 | <.01 |
| TAe-TAu | 21.5 ± 6.2 | 24.6 ± 4.3 | .274 |
| TAp-TAa | -3.5 ± 11.6 | 4.0 ± -4.1 | .082 |
| TAe-TAa | -8.5 ± 10.7 | -9.9 ± -5.9 | .715 |
| TAe-TAp | -5.0 ± 5.5 | -13.9 ± -1.8 | <.01 |
Figure 5.
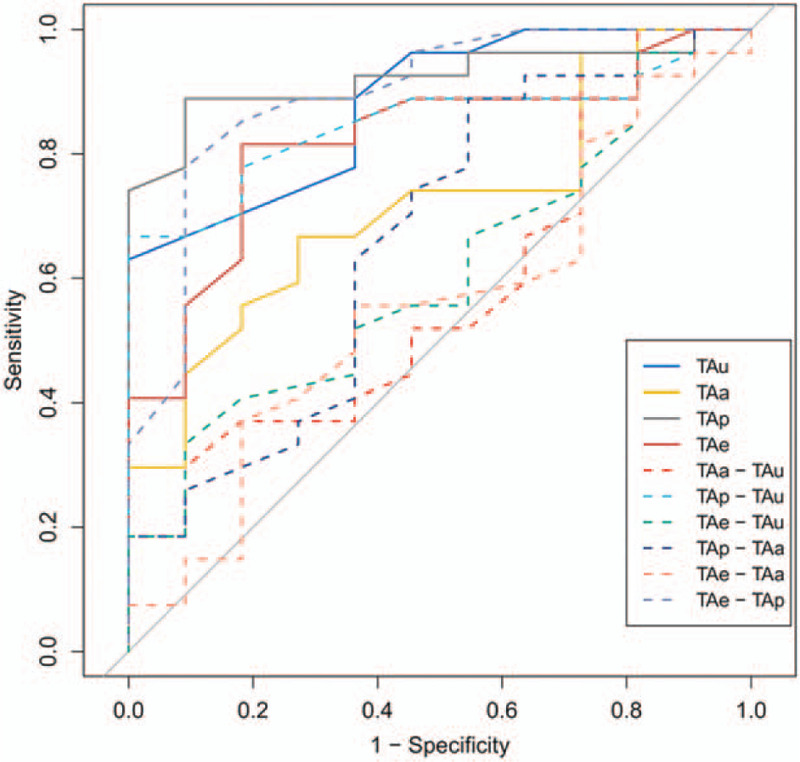
The ROC curves for the CT values of the poorly differentiated HCC and non-poorly differentiated HCC. TAe-TAp ROC curve had the highest area under the curve. ROC = receiver operating characteristic, TAa = tumor attenuation values of the hepatic arterial phase, TAe = tumor attenuation values of the hepatic equilibrium phase, TAp = tumor attenuation values of the hepatic portal phase, TAu = tumor attenuation value of the unenhanced phase.
4. Discussion
As histological grade is one of the main prognostic factors in patients with HCCs, preoperative prediction of the histological grade using perfusion parameters may guide clinicians for more accurate staging and management and help them to determine the optimal management strategy and prognosis. It has been clarified that early metastases occurs more frequently after curative hepatic resection in patients with P-HCCs than those with NP-HCCs.[24] The correlation of the blood supply with the grade of HCC in early-stage HCCs and precancerous lesions has been reported.[15,24,25] Several studies demonstrated different enhancement patterns of different grades of HCC using triple-phasic contrast-enhanced CT, and reported that HCC enhancement patterns were associated with tumor grade.[15,23] Our study reviewed that some wHCC lesions (7/12, 58%) had hypoattenuation or isoattenuation imaging on the arterial enhancement images. Poor enhancement may be caused by the degeneration of preexisting hepatic arteries in portal tracts. The status of degenerated hepatic arteries was associated with reduced arterial blood flow in early hepatocellular carcinoma (wHCC).[15] The present study showed the mHCC or pHCC lesions had hyperattenuation imaging on the arterial phase. This result can be explained that the total number of intratumoral cumulative arteries may increase as the lesion becomes more malignant, that is, from wHCC to pHCC. For wHCC group, some lesions represented isoattenuation imaging on the portal enhancement images. However, all lesions showed hypoattenuation imaging for mHCC or pHCC lesions. These results suggest that the portal blood supply also decreases with the advances of the tumor, and eventually, the tumor is supplied mainly by arteries. Thus, this finding was consistent with the conclusion of the previous studies.[15,17] Therefore, the proportion of HCC lesions with typical enhancement (both arterial hyperattenuation and portal washout) differed significantly between the wHCC group and the mHCC or pHCC group. Furthermore, we found that the maximal diameter of tumors was also significantly correlated with tumor enhancement patterns. According to the histological grade, the mean diameter of pHCCs was larger than that of mHCCs, and the tumor size of the majority of wHCCs was small. There was a reciprocal correlation between the maximal diameter of tumors and the enhancement patterns of tumor lesions. These results are similar to those in the previous report.[26]
The current study investigated the association of the tumor attenuation value at the contrast-enhanced dynamic phase CT with the histological features. The pHCC had significantly decreased tumor attenuation values at the portal and equilibrium phase compared to the NP-HCC, indicating a shorter contrast washout time for the pHCC than that for the mHCC and wHCC. These findings also suggest an increase in the intra-nodular arterial flow and a decrease in the intra-nodular portal flow in advanced tumors. The pHCC also had significantly decreased attenuation values at the unenhanced phase compared to that of the NP-HCC. This discrepancy might be associated with the rapid tumor growth of pHCCs. Compared with the NP-HCC, pHCC had significantly decreased TAp-TAu, whereas significantly increased TAe-TAp. Therefore, the quantitative analysis also supports the conclusion that there is faster contrast washout in the pHCCs, which is in consistent with previous reports.[26,27] NP-HCC had a higher TAa than pHCC, but there was no significant difference. Furthermore, these findings partly suggest that arterial blood supply increases at the early phase but decreases at the late phase of tumor development, consistent with previous studies.[13,28,29]
In the current study, analysis using CT hemodynamic kinetics software was performed to calculate various perfusion parameters obtained from the standard tri-phasic CT. Recently, routine tri-phasic scan with simplified model of tumor blood supply has been developed and validated. The linear combination of the enhancement curves of aorta and portal vein can be used to calculate the hepatic artery and portal vein blood supply coefficients of tumor,[20] and this has been validated as a simple predictive model of liver perfusion. To our best knowledge, this is the first study to use the perfusion parameters derived from triphasic CT scans to predict the histological grades of HCC. There was no significant difference in the mean values of perfusion parameters between the pHCC and the NP-HCC; however, we found that there was a trend in the change of HAC, which was higher in pHCCs than in NP-HCCs (P = .07). HAC represents the coefficient of hepatic arterial blood volume in an ideal state and could reflect the hepatic artery perfusion level.[30,31] The results of this study suggest that the vascularity or intra-nodular arterial flow of the pHCC tends to be increased compared with the NP-HCC (mHCC or wHCC) as the disease advances, radiologically. Similarly, Asayama et al[13] reported that there was no obviously increased arterial blood supply in wHCCs because of the increased neo-vascular arterial blood supply, despite the decrease of normal arterial supply. Additionally, the arterial blood supply increased significantly as the histological grade progressed. The findings of the present study are also consistent with the recent report by Ippolito et al,[32] in which there was no significant difference in the perfusion parameters among the wHCC, mHCC, and pHCC, indicating that CT perfusion parameters cannot predict the grade of HCC.
This study has some limitations. Firstly, the enrolled patients were not consecutive. Secondly, the number of pHCCs was relatively small. Thirdly, the study was retrospective. Thus, there is a potential risk of selection bias, and in heterogeneous lesions, most arterially enhancement of the lesion is measured, but the exact ROI is still somewhat arbitrary. Finally, the quantitative analysis of the perfusion parameters derived from the tri-phasic CT scans was not compared with that obtained from the traditional CT perfusion imaging to test the reliability of the hepatic perfusion.
In conclusion, the CT perfusion parameters cannot indicate the HCC grade, whereas the values of tumor attenuation at different phases and the difference values among different phases, especially the mean value of (TAe-TAp), may be useful to non-invasively and preoperatively predict the degree of HCC differentiation.
Author contributions
Conceptualization: Fang Zhao.
Data curation: Chunchun Shao, Yao Lv.
Supervision: Fang Zhao.
Writing – original draft: Guodong Pang.
Footnotes
Abbreviations: AEF = arterial enhancement fraction, HAC = hepatic arterial supply coefficient, HCC = hepatocellular carcinoma, pHCC = poorly differentiated HCC, PVC = portal venous supply coefficient, ROC = receiver operating characteristic, TAe = tumor attenuation on the equilibrium phase, TAp = tumor attenuation on the portal phase, TAu = tumor attenuation on the unenhanced phase, wHCC = well-differentiated HCC.
How to cite this article: Pang G, Shao C, Lv Y, Zhao F. Tumor attenuation and quantitative analysis of perfusion parameters derived from tri-phasic CT scans in hepatocellular carcinoma: relationship with histological grade. Medicine. 2021;100:16(e25627).
This research received no specific grant from any funding agency in the public, commercial, or not-for-profit sectors.
The authors have no conflicts of interests to disclose.
The datasets generated during and/or analyzed during the current study are available from the corresponding author on reasonable request.
Alc-indicates alcohol related, B- = hepatitis B virus related, C- = hepatitis C virus related, LC = liver cirrhosis.
The numbers are for HCC lesions, and those in parentheses are percentages. Histologic grades from wHCC to pHCC were analyzed using Spearman's rank correlation test. mHCC = moderately differentiated hepatocellular carcinoma, pHCC = poorly differentiated hepatocellular carcinoma, wHCC = well differentiated hepatocellular carcinoma.
Each value is the number of HCCs. Histological grade shows the predominant histological grade.
The number of tumor enhancement pattern in Group 5 of HCCs with a diameter of 3 cm or more was significantly more than that of HCCs with a diameter of less than 3 cm or with other different enhancement patterns (P < .01).
Data are numbers of HCCs.
AEF = arterial enhancement fraction, HAC = hepatic arterial supply coefficient, NP-HCC = HCC without poorly differentiated components, pHCC = poorly differentiated HCC, PVC = portal venous supply coefficient.
NP-HCC = HCC without poorly differentiated components, pHCC = poorly differentiated HCC, TAa = tumor attenuation values of the hepatic arterial phase, TAe = tumor attenuation values of the hepatic equilibrium phase, TAp = tumor attenuation values of the hepatic portal phase, TAu = tumor attenuation value of the unenhanced phase.
References
- [1].Okuda K. Hepatocellular carcinoma: clinicopathological aspects. J Gastroenterol Hepatol 1997;12:S314–8. [DOI] [PubMed] [Google Scholar]
- [2].Kalra N, Gupta P, Chawla Y, et al. Locoregional treatment for hepatocellular carcinoma: the best is yet to come. World J Radiol 2015;7:306–18. [DOI] [PMC free article] [PubMed] [Google Scholar]
- [3].Kalra N, Kang M, Bhatia A, et al. Role of radiofrequency ablation in unresectable hepatocellular carcinoma: an Indian experience. Indian J Radiol Imaging 2013;23:139–44. [DOI] [PMC free article] [PubMed] [Google Scholar]
- [4].Komorizono Y, Oketani M, Sako K, et al. Risk factors for local recurrence of small hepatocellular carcinoma tumors after a single session, single application of percutaneous radiofrequency ablation. Cancer 2003;97:1253–62. [DOI] [PubMed] [Google Scholar]
- [5].Verslype C, Rosmorduc O, Rougier P, et al. Hepatocellular carcinoma: ESMO-ESDO clinical practice guidelines for diagnosis, treatment and follow-up. Ann Oncol 2012;23: Suppl 7: vii41–8. [DOI] [PubMed] [Google Scholar]
- [6].Jonas S, Bechstein WO, Steinmuller T, et al. Vascular invasion and histopathologic grading determine outcome after liver transplantation for hepatocellular carcinoma in cirrhosis. Hepatology 2001;33:1080–6. [DOI] [PubMed] [Google Scholar]
- [7].Kim SH, Lee WJ, Lim HK, et al. SPIO-enhanced MRI findings of well-differentiated hepatocellular carcinomas: correlation with MDCT findings. Korean J Radiol 2009;10:112–20. [DOI] [PMC free article] [PubMed] [Google Scholar]
- [8].Bruix J, Sherman M. Management of hepatocellular carcinoma. Hepatology 2005;42:1208–36. [DOI] [PubMed] [Google Scholar]
- [9].DuBay D, Sandroussi C, Sandhu L, et al. Liver transplantation for advanced hepatocellular carcinoma using poor tumor differentiation on biopsy as an exclusion criterion. Ann Surg 2011;253:166–72. [DOI] [PubMed] [Google Scholar]
- [10].Tamura S, Kato T, Berho M, et al. Impact of histological grade of hepatocellular carcinoma on the outcome of liver transplantation. Arch Surg 2001;136:25–30. discussion 1. [PubMed] [Google Scholar]
- [11].Nishie A, Tajima T, Asayama Y, et al. Diagnostic performance of apparent diffusion coefficient for predicting histological grade of hepatocellular carcinoma. Eur J Radiol 2011;80:e29–33. [DOI] [PubMed] [Google Scholar]
- [12].Heo SH, Jeong YY, Shin SS, et al. Apparent diffusion coefficient value of diffusion-weighted imaging for hepatocellular carcinoma: correlation with the histologic differentiation and the expression of vascular endothelial growth factor. Korean J Radiol 2010;11:295–303. [DOI] [PMC free article] [PubMed] [Google Scholar]
- [13].Asayama Y, Yoshimitsu K, Nishihara Y, et al. Arterial blood supply of hepatocellular carcinoma and histologic grading: radiologic-pathologic correlation. AJR Am J Roentgenol 2008;190:W28–34. [DOI] [PubMed] [Google Scholar]
- [14].Park VY, Choi JY, Chung YE, et al. Dynamic enhancement pattern of HCC smaller than 3 cm in diameter on gadoxetic acid-enhanced MRI: comparison with multiphasic MDCT. Liver Int 2014;34:1593–602. [DOI] [PubMed] [Google Scholar]
- [15].Tajima T, Honda H, Taguchi K, et al. Sequential hemodynamic change in hepatocellular carcinoma and dysplastic nodules: CT angiography and pathologic correlation. AJR Am J Roentgenol 2002;178:885–97. [DOI] [PubMed] [Google Scholar]
- [16].Sato KT, Omary RA, Takehana C, et al. The role of tumor vascularity in predicting survival after yttrium-90 radioembolization for liver metastases. J Vasc Interv Radiol 2009;20:1564–9. [DOI] [PubMed] [Google Scholar]
- [17].Dvorak HF, Brown LF, Detmar M, et al. Vascular permeability factor/vascular endothelial growth factor, microvascular hyperpermeability, and angiogenesis. Am J Pathol 1995;146:1029–39. [PMC free article] [PubMed] [Google Scholar]
- [18].Matsui O, Kadoya M, Kameyama T, et al. Benign and malignant nodules in cirrhotic livers: distinction based on blood supply. Radiology 1991;178:493–7. [DOI] [PubMed] [Google Scholar]
- [19].Park YN, Yang C-P, Fernandez GJ, et al. Neoangiogenesis and sinusoidal “Capillarization” in dysplastic nodules of the liver. Am J Surgical Pathol 1998;22:656–62. [DOI] [PubMed] [Google Scholar]
- [20].Boas FE, Kamaya A, Do B, et al. Classification of hypervascular liver lesions based on hepatic artery and portal vein blood supply coefficients calculated from triphasic CT scans. J Digit Imaging 2015;28:213–23. [DOI] [PMC free article] [PubMed] [Google Scholar]
- [21].Kim KW, Lee JM, Kim JH, et al. CT color mapping of the arterial enhancement fraction of VX2 carcinoma implanted in rabbit liver: comparison with perfusion CT. AJR Am J Roentgenol 2011;196:102–8. [DOI] [PubMed] [Google Scholar]
- [22].Edmondson HA, Steiner PE. Primary carcinoma of the liver: a study of 100 cases among 48,900 necropsies. Cancer 1954;7:462–503. [DOI] [PubMed] [Google Scholar]
- [23].Yoon SH, Lee JM, So YH, et al. Multiphasic MDCT enhancement pattern of hepatocellular carcinoma smaller than 3 cm in diameter: tumor size and cellular differentiation. AJR Am J Roentgenol 2009;193:W482–9. [DOI] [PubMed] [Google Scholar]
- [24].Oishi K, Itamoto T, Amano H, et al. Clinicopathologic features of poorly differentiated hepatocellular carcinoma. J Surg Oncol 2007;95:311–6. [DOI] [PubMed] [Google Scholar]
- [25].Winter TC, 3rd, Takayasu K, Muramatsu Y, et al. Early advanced hepatocellular carcinoma: evaluation of CT and MR appearance with pathologic correlation. Radiology 1994;192:379–87. [DOI] [PubMed] [Google Scholar]
- [26].Nishie A, Yoshimitsu K, Okamoto D, et al. CT prediction of histological grade of hypervascular hepatocellular carcinoma: utility of the portal phase. Jpn J Radiol 2013;31:89–98. [DOI] [PubMed] [Google Scholar]
- [27].Okamoto D, Yoshimitsu K, Nishie A, et al. Enhancement pattern analysis of hypervascular hepatocellular carcinoma on dynamic MR imaging with histopathological correlation: validity of portal phase imaging for predicting tumor grade. Eur J Radiol 2012;81:1116–21. [DOI] [PubMed] [Google Scholar]
- [28].Hayashi M, Matsui O, Ueda K, et al. Correlation between the blood supply and grade of malignancy of hepatocellular nodules associated with liver cirrhosis: evaluation by CT during intraarterial injection of contrast medium. AJR Am J Roentgenol 1999;172:969–76. [DOI] [PubMed] [Google Scholar]
- [29].Ueda K, Matsui O, Kawamori Y, et al. Hypervascular hepatocellular carcinoma: evaluation of hemodynamics with dynamic CT during hepatic arteriography. Radiology 1998;206:161–6. [DOI] [PubMed] [Google Scholar]
- [30].Bonekamp D, Bonekamp S, Ou HY, et al. Assessing liver fibrosis: comparison of arterial enhancement fraction and diffusion-weighted imaging. J Magn Reson Imaging 2014;40:1137–46. [DOI] [PubMed] [Google Scholar]
- [31].White MJ, O’Gorman RL, Charles-Edwards EM, et al. Parametric mapping of the hepatic perfusion index with gadolinium-enhanced volumetric MRI. Br J Radiol 2007;80:113–20. [DOI] [PubMed] [Google Scholar]
- [32].Ippolito D, Capraro C, Casiraghi A, et al. Quantitative assessment of tumour associated neovascularisation in patients with liver cirrhosis and hepatocellular carcinoma: role of dynamic-CT perfusion imaging. Eur Radiol 2012;22:803–11. [DOI] [PubMed] [Google Scholar]