

Abstract
Background
Supplementary feeding is defined as the provision of extra food to children or families beyond the normal ration of their home diets. The impact of food supplementation on child growth merits careful evaluation in view of the reliance of many states and non‐governmental organisations on this intervention to improve child health in low and middle income countries (LMIC). This is an update of a Cochrane review first published in 2005.
Objectives
To evaluate the effectiveness of community‐based supplementary feeding for promoting the physical growth of children under five years of age in LMIC.
Search methods
For this updated review we searched the following databases on 31 January 2011: CENTRAL (The Cochrane Library), MEDLINE (1948 to January week 3, 2011), EMBASE (1980 to week 3, 2011), CINAHL (1937 to 27 January 2011), LILACS (all years), WorldCat for dissertations and theses (all years) and ClinicalTrials.gov (all years).
Selection criteria
Randomised controlled trials (RCTs) evaluating supplementary feeding in comparison to a control group (no intervention or a placebo such as food with a very low number of nutrients and calories) in children from birth to five years of age in LMIC.
Data collection and analysis
Two review authors independently extracted and analysed the data.
Main results
We included eight RCTs (n = 1243 children) that were at relatively high risk of bias. We found high levels of clinical heterogeneity in the participants, interventions and outcome measures across studies. Nevertheless, in order to quantify pooled effects of supplementary feeding, we decided to combine studies according to prespecified characteristics. These were the children's age (younger or older than 24 months), their nutritional status at baseline (stunted or wasted, or not stunted or wasted) and the duration of the intervention (less or more than 12 months). A statistically significant difference of effect was only found for length during the intervention in children aged less than 12 months (two studies; 795 children; mean difference 0.19 cm; 95% confidence interval (CI) 0.07 to 0.31). Based on the summary statistic calculated for each study, the mean difference (MD) between intervention and control groups ranged from 0.48 cm (95% CI 0.07 to 0.89) to 1.3 cm (95% CI 0.03 to 2.57) after 3 and 12 months of intervention, respectively. Data on potential adverse effects were lacking.
Authors' conclusions
The scarcity of available studies and their heterogeneity makes it difficult to reach any firm conclusions. The review findings suggest supplementary feeding has a negligible impact on child growth; however, the pooled results should be interpreted with great caution because the studies included in the review are clinically diverse. Future studies should address issues of research design, including sample size calculation, to detect meaningful clinical effects and adequate intervention allocation concealment. In the meantime, families and children in need should be provided appropriate feeding, health care and sanitation without waiting for new RCTs to establish a research basis for feeding children.
Keywords: Child, Preschool; Humans; Infant; ; Dietary Supplements; Growth; Child Nutrition Disorders; Child Nutrition Disorders/diet therapy; Child Nutritional Physiological Phenomena; Infant Nutrition Disorders; Infant Nutrition Disorders/diet therapy; Randomized Controlled Trials as Topic
Plain language summary
Providing extra food for children under five years of age in low and middle income countries
Undernutrition is one of the underlying causes of childhood illness and death in low‐ and middle‐income countries. Providing extra food to children or families beyond what they normally have at home is an intervention aimed at supporting the nutritional wellbeing of the target population. We included eight studies where the participants were randomly assigned to two groups: one group received the extra food and the other group was a control, either receiving no food or food with very low nutritional content. Although the impact of supplementary feeding on child growth appeared to be negligible, it is not possible to draw any conclusions until we have studies that involve larger numbers and do not allow assessors to know who is receiving the intervention. Although it is difficult to determine whether community‐based supplementary feeding helps to promote the growth of children from birth to five years in low‐ and middle‐income countries, it is obviously vital to continue to provide food, health care and sanitation to those who need them.
Summary of findings
Summary of findings for the main comparison. Supplementary feeding compared to no food supplementation or low‐protein/kcalories supplementation for children aged less than 24 months in low and middle income countries (LMIC).
| Patient or population: Children aged less than 24 months Settings: Bolivia, New Caledonia, Congo, Jamaica, Indonesia, Senegal Intervention: Supplementary feeding Comparison: No food supplementation or low‐protein/kcalories supplementation | ||||||
| Outcomes | Illustrative comparative risks* (95% CI) | Relative effect (95% CI) | No of Participants (studies) | Quality of the evidence (GRADE) | Comments | |
| Assumed risk | Corresponding risk | |||||
| No food supplementation or low‐protein/kcalories supplementation | Supplementary feeding | |||||
| Weight (kg) at the end of the intervention Weight scale Follow‐up: 3‐12 months | The mean weight (kg) at the end of the intervention in the intervention groups was 0.03 lower (0.21 lower to 0.15 higher)1 | 460 (3 studies2) | ⊕⊕⊝⊝ low,3,4,5 | |||
| Lenght/height (cm) at the end of the intervention Measurement board Follow‐up: 3‐12 months | The mean lenght/height (cm) at the end of the intervention in the intervention groups was 0.16 higher (0.31 lower to 0.63 higher)6 | 460 (3 studies2) | ⊕⊕⊝⊝ low3,4,5 | |||
| *The basis for the assumed risk (e.g. the median control group risk across studies) is provided in footnotes. The corresponding risk (and its 95% confidence interval) is based on the assumed risk in the comparison group and the relative effect of the intervention (and its 95% CI). CI: confidence interval | ||||||
| GRADE Working Group grades of evidence High quality: Further research is very unlikely to change our confidence in the estimate of effect. Moderate quality: Further research is likely to have an important impact on our confidence in the estimate of effect and may change the estimate. Low quality: Further research is very likely to have an important impact on our confidence in the estimate of effect and is likely to change the estimate. Very low quality: We are very uncertain about the estimate. | ||||||
1The IC (‐0.21 to 0.15) crosses the line of no effect. 2 A four country RCT reported results separately for Bolivia, Caledonia, Congo and Senegal. 3The allocation concealment was not described in any of these studies. 4Bias related to blinding of growth outcome assessment was unclear in two studies and high in the four country RCT. 5 Incomplete outcome data was not clearly reported in one study but it was high (i.e., equal to or more than 20% in any of the study groups) in all countries participating in the multicentre RCT. 6The IC (‐0.31 to 0.63) crosses the line of no effect.
Summary of findings 2. Supplementary feeding compared to no food supplementation or placebo for children aged less than five years in LMIC.
| Patient or population: Children aged less than five years in LMIC Settings: Bolivia, Brazil, Caledonia, China, Congo, Indonesia, Jamaica, Senegal Intervention: Supplementary feeding Comparison: No food supplementation | ||||||
| Outcomes | Illustrative comparative risks* (95% CI) | Relative effect (95% CI) | No of Participants (studies) | Quality of the evidence (GRADE) | Comments | |
| Assumed risk | Corresponding risk | |||||
| No food supplementation | Supplementary feeding | |||||
| Weight gain (kg) during the intervention Weight scale Follow‐up: 3‐9 months | The mean weight gain (kg) during the intervention in the intervention groups was 0.03 higher (0.05 lower to 0.11 higher)1 | 668 (2 studies2) | ⊕⊝⊝⊝ very low3,4,5,6 | |||
| Length/height gain (cm) at the end of the intervention Measurement board Follow‐up: 3‐9 months | The mean length/height gain (cm) at the end of the intervention in the intervention groups was 0.19 higher (0.07 to 0.31 higher) | 795 (2 studies2) | ⊕⊝⊝⊝ very low3,4, 5,6 | |||
| Weight‐for‐age z‐score at the end of the intervention Weight scale and child growth reference Follow‐up: 2‐12 months | The mean weight‐for‐age z‐score at the end of the intervention in the intervention groups was 0.03 lower (0.27 lower to 0.21 higher)7 | 308 (3 studies) | ⊕⊕⊕⊝
moderate 3,8,9 |
|||
| Lenght/height‐for‐age z‐score at the end of the intervention Measurement board and child growth reference Follow‐up: 2‐12 months | The mean lenght/height‐for‐age z‐score at the end of the intervention in the intervention groups was 0.05 higher (0.2 lower to 0.3 higher)10 | 308 (3 studies) | ⊕⊕⊝⊝ low3,8,9 | |||
| Weight‐for‐length/height z‐score at the end of the intervention Weight scale, measurement boards and child growth reference Follow‐up: 2‐12 months | The mean weight‐for‐length/height z‐score at the end of the intervention in the intervention groups was 0.10 lower (0.33 lower to 0.13 higher)11 | 260 (3 studies) | ⊕⊕⊕⊝ moderate3,8 | |||
| *The basis for the assumed risk (e.g. the median control group risk across studies) is provided in footnotes. The corresponding risk (and its 95% confidence interval) is based on the assumed risk in the comparison group and the relative effect of the intervention (and its 95% CI). CI: confidence interval | ||||||
| GRADE Working Group grades of evidence High quality: Further research is very unlikely to change our confidence in the estimate of effect. Moderate quality: Further research is likely to have an important impact on our confidence in the estimate of effect and may change the estimate. Low quality: Further research is very likely to have an important impact on our confidence in the estimate of effect and is likely to change the estimate. Very low quality: We are very uncertain about the estimate. | ||||||
1 The CI (‐0.05 to 0.11) crosses the line of no effect. 2 A four country RCT reported results separately for Bolivia, Caledonia, Congo and Senegal. 3 The allocation concealment was not described in any of these studies. 4 Blinding of outcome assessors was not clear in the Chinese study. Outcome assessors were not blinded to treatment allocation in the four country RCT. 5 Incomplete outcome data was not clearly reported in one study but it was high (i.e., equal to or more than 20% in any of the study groups) in the four country RCT. 6 The random generation sequence was not reported in the Chinese study.
7 The CI (‐0.27 to 0.21) crosses the line of no effect.
8 Bias related to blinding of growth outcome assessment was unclear in two studies.
9 Incomplete outcome data was not clearly reported in the Indonesian study.
10The CI (‐0.20 to 0.30) crosses the line of no effect.
11The CI (‐0.33 to 0.13) crosses the line of no effect.
Summary of findings 3. Supplementary feeding compared to no food supplementation for children older than 24 months in LMIC.
| Patient or population: Children older than 24 months Settings: China Intervention: Supplementary feeding Comparison: No food supplementation | ||||||
| Outcomes | Illustrative comparative risks* (95% CI) | Relative effect (95% CI) | No of Participants (studies) | Quality of the evidence (GRADE) | Comments | |
| Assumed risk | Corresponding risk | |||||
| No food supplementation | Supplementary feeding | |||||
| Change in weight‐for‐age z‐score during the intervention Weight scale and and child growth reference Follow‐up: 10 months | The mean change in weight‐for‐age z‐score during the intervention in the intervention groups was 0.12 higher (0.05 to 0.19 higher) | 348 (1 study) | ⊕⊕⊝⊝ low1,2,3 | |||
| Change in length/height z‐score during the intevention Measurement board and child growth reference Follow‐up: 10 months | The mean change in length/height z‐score during the intevention in the intervention groups was 0.05 higher (0.01 to 0.08 higher) | 348 (1 study) | ⊕⊕⊝⊝ low1,2,3 | |||
| *The basis for the assumed risk (e.g. the median control group risk across studies) is provided in footnotes. The corresponding risk (and its 95% confidence interval) is based on the assumed risk in the comparison group and the relative effect of the intervention (and its 95% CI). CI: confidence interval | ||||||
| GRADE Working Group grades of evidence High quality: Further research is very unlikely to change our confidence in the estimate of effect. Moderate quality: Further research is likely to have an important impact on our confidence in the estimate of effect and may change the estimate. Low quality: Further research is very likely to have an important impact on our confidence in the estimate of effect and is likely to change the estimate. Very low quality: We are very uncertain about the estimate. | ||||||
1 The random generation sequence and the allocation concealment were not described. 2 Bias related to blinding of growth outcome assessment was unclear. 3 Incomplete outcome data was not clearly reported.
Summary of findings 4. Supplementary feeding compared to no food supplementation or low‐protein/kcalories supplementation for children aged less than five years with or without stunting or wasting in LMIC.
| Patient or population: Children aged less than five years with or without stunting or wasting Settings: Bolivia, Caledonia, Congo, Jamaica1, Indonesia2, Senegal Intervention: Supplementary feeding Comparison: No food supplementation or low‐protein/kcalories supplementation | ||||||
| Outcomes | Illustrative comparative risks* (95% CI) | Relative effect (95% CI) | No of Participants (studies) | Quality of the evidence (GRADE) | Comments | |
| Assumed risk | Corresponding risk | |||||
| No food supplementation or low‐protein/kcalories supplementation | Supplementary feeding | |||||
| Weight (kg) at the end of the intervention Weight scale Follow‐up: 3‐12 months | The mean weight (kg) at the end of the intervention in the intervention groups was 0.03 lower (0.21 lower to 0.15 higher)3 | 460 (3 studies4) | ⊕⊕⊝⊝ low5,6,7,8 | |||
| Length/height (cm) at the end of the intervention Measurement board Follow‐up: 3‐12 months | The mean length/height (cm) at the end of the intervention in the intervention groups was 0.16 higher (0.31 lower to 0.63 higher)9 | 460 (3 studies4) | ⊕⊕⊝⊝ low5,6,7,8 | |||
| *The basis for the assumed risk (e.g. the median control group risk across studies) is provided in footnotes. The corresponding risk (and its 95% confidence interval) is based on the assumed risk in the comparison group and the relative effect of the intervention (and its 95% CI). CI: confidence interval | ||||||
| GRADE Working Group grades of evidence High quality: Further research is very unlikely to change our confidence in the estimate of effect. Moderate quality: Further research is likely to have an important impact on our confidence in the estimate of effect and may change the estimate. Low quality: Further research is very likely to have an important impact on our confidence in the estimate of effect and is likely to change the estimate. Very low quality: We are very uncertain about the estimate. | ||||||
1 Children with height‐for‐age below ‐2 SD of the median of the NSCH/WHO reference values.
2 Children with length‐for‐age below ‐1SD and weight‐for‐length between ‐1 and ‐2 SD of the median of the NSCH/WHO reference values.
3 The CI (‐0.21 to 0.15) crosses the line of no effect. 4 A four country RCT reported results separately for Bolivia, Caledonia, Congo and Senegal. 5 Information about the random sequence generation was not reported in two studies. 6 The allocation concealment was not described in any of these studies. 7 Bias related to blinding of growth outcome assessment was unclear in two studies and high in the four country RCT. 8 Incomplete outcome data was not clearly reported in one study but it was high (i.e., equal to or more than 20% in any of the study groups) in the four country RCT. 9 The CI (‐0.31 to 0.63) crosses the line of no effect.
Summary of findings 5. Supplementary feeding compared to no food supplementation or placebo for children aged less than five years with or without stunting or wasting in LMIC.
| Patient or population: Children aged less than five years with or without stunting/wasting in LMIC Settings: Brazil, Jamaica1 Intervention: Supplementary feeding Comparison: No food supplementation or placebo | ||||||
| Outcomes | Illustrative comparative risks* (95% CI) | Relative effect (95% CI) | No of Participants (studies) | Quality of the evidence (GRADE) | Comments | |
| Assumed risk | Corresponding risk | |||||
| No food supplementation or placebo | Supplementary feeding | |||||
| Weight‐for‐length/height z‐score at the end of the intervention Weight scale and measurement board Follow‐up: 2‐12 months | The mean weight‐for‐length/height z‐score at the end of the intervention in the intervention groups was 0.10 lower (0.33 lower to 0.13 higher)2 | 260 (3 studies) | ⊕⊕⊕⊝ moderate3,4 | |||
| *The basis for the assumed risk (e.g. the median control group risk across studies) is provided in footnotes. The corresponding risk (and its 95% confidence interval) is based on the assumed risk in the comparison group and the relative effect of the intervention (and its 95% CI). CI: confidence interval | ||||||
| GRADE Working Group grades of evidence High quality: Further research is very unlikely to change our confidence in the estimate of effect. Moderate quality: Further research is likely to have an important impact on our confidence in the estimate of effect and may change the estimate. Low quality: Further research is very likely to have an important impact on our confidence in the estimate of effect and is likely to change the estimate. Very low quality: We are very uncertain about the estimate. | ||||||
1 Children with height‐for‐age below ‐2 SD of the median of the NSCH/WHO reference values.
2 The CI (‐0.33 to 0.13) crosses the line of no effect. 3 The allocation concealment was not described in any of these studies. 4Bias related to blinding of growth outcome assessment was unclear in two studies.
Summary of findings 6. Supplementary feeding compared to no food supplementation or low‐protein/kcalories supplementation for ≤ 12 months in children aged less than five years in LMIC.
| Patient or population: Children aged less than five years in LMIC Settings: Bolivia, Caledonie, China, Congo, Jamaica, Indonesia, Senegal Intervention: Supplementary feeding1 Comparison: No food supplementation or low‐protein/kcalories supplementation | ||||||
| Outcomes | Illustrative comparative risks* (95% CI) | Relative effect (95% CI) | No of Participants (studies) | Quality of the evidence (GRADE) | Comments | |
| Assumed risk | Corresponding risk | |||||
| No food supplementation or low‐protein/kcalories supplementation | Supplementary feeding | |||||
| Weight (kg) at the end of the intervention Weight scale Follow‐up: 3‐12 months | The mean weight (kg) at the end of the intervention in the intervention groups was 0.16 higher (0.17 lower to 0.59 higher)2 | 587 (3 studies3) | ⊕⊕⊝⊝ low4,5,6,7 | |||
| Length/height (cm) at the end of the intervention Measurement board Follow‐up: 3‐12 months | The mean length/height (cm) at the end of the intervention in the intervention groups was 0.28 higher (0.11 lower to 0.67 higher)8 | 587 (3 studies3) | ⊕⊕⊝⊝ low4,5,6,7 | |||
| Weight gain (kg) during the intervention Weight scale Follow‐up: 3‐9 months | The mean weight gain (kg) during the intervention in the intervention groups was 0.04 higher (0.03 lower to 0.11 higher)9 | 795 (2 studies3) | ⊕⊝⊝⊝
very low4,5, 6,10 |
|||
| Length/height gain (cm) at the end of the intervention Measurement board Follow‐up: 3‐9 months | The mean length/height gain (cm) at the end of the intervention in the intervention groups was 0.19 higher (0.07 to 0.31 higher) | 795 (2 studies3) | ⊕⊝⊝⊝ very low4,5,6 | |||
| *The basis for the assumed risk (e.g. the median control group risk across studies) is provided in footnotes. The corresponding risk (and its 95% confidence interval) is based on the assumed risk in the comparison group and the relative effect of the intervention (and its 95% CI). CI: confidence interval | ||||||
| GRADE Working Group grades of evidence High quality: Further research is very unlikely to change our confidence in the estimate of effect. Moderate quality: Further research is likely to have an important impact on our confidence in the estimate of effect and may change the estimate. Low quality: Further research is very likely to have an important impact on our confidence in the estimate of effect and is likely to change the estimate. Very low quality: We are very uncertain about the estimate. | ||||||
1 The duration of the intervention was ≤ 12 months. 2 The CI (‐0.17 to 0.59) crosses the line of no effect. 3 A four‐country RCT reported results separately for Bolivia, Caledonia, Congo and Senegal. 4 Information about the random sequence generation was not reported in three studies. 5 The allocation concealment was not described in any of these studies. 6 Bias related to blinding of growth outcome assessment was unclear in three studies and high in the four country RCT. 7 Incomplete outcome data was not clearly reported in one study but it was high (i.e., equal to or more than 20% in any of the study groups) in the four country RCT. 8 The CI (‐0.11 to 0.67) crosses the line of no effect.
9 The CI (‐0.03 to 0.11) crosses the line of no effect.
Summary of findings 7. Supplementary feeding compared to no food supplementation or placebo for ≤ 12 months in children aged less than five years in LMIC.
| Patient or population: Children aged less than five years in LMIC Settings: Brazil, Indonesia, Jamaica Intervention: Supplementary feeding1 Comparison: No food supplementation | ||||||
| Outcomes | Illustrative comparative risks* (95% CI) | Relative effect (95% CI) | No of Participants (studies) | Quality of the evidence (GRADE) | Comments | |
| Assumed risk | Corresponding risk | |||||
| No food supplementation | Supplementary feeding for less than 12 months | |||||
| Weight‐for‐age z‐score at the end of the intervention Weight scale and child growth reference Follow‐up: 2‐12 months | The mean weight‐for‐age z‐score at the end of the intervention in the intervention groups was 0.03 lower (0.27 lower to 0.21 higher)2 | 308 (3 studies) | ⊕⊕⊕⊝ moderate3,4,5 | |||
| Length/height‐for‐age z‐score at the end of the intervention Measurement board and child growth reference Follow‐up: 2‐12 months | The mean length/height‐for‐age z‐score at the end of the intervention in the intervention groups was 0.05 higher (0.2 lower to 0.3 higher)6 | 308 (3 studies) | ⊕⊕⊝⊝ low3,4,5 | |||
| Weight‐for‐length/height z‐score at the end of the intervention Weight scale, measurement boards and child growth reference Follow‐up: 2‐12 months | The mean weight‐for‐length/height z‐score in the intervention groups was 0.10 lower (0.33 lower to 0.13 higher)7 | 260 (3 studies) | ⊕⊕⊕⊝ moderate3,4 | |||
| *The basis for the assumed risk (e.g. the median control group risk across studies) is provided in footnotes. The corresponding risk (and its 95% confidence interval) is based on the assumed risk in the comparison group and the relative effect of the intervention (and its 95% CI). CI: confidence interval | ||||||
| GRADE Working Group grades of evidence High quality: Further research is very unlikely to change our confidence in the estimate of effect. Moderate quality: Further research is likely to have an important impact on our confidence in the estimate of effect and may change the estimate. Low quality: Further research is very likely to have an important impact on our confidence in the estimate of effect and is likely to change the estimate. Very low quality: We are very uncertain about the estimate. | ||||||
1 The duration of the intervention was less than 12 months. 2 The CI (‐0.27 to 0.21) crosses the line of no effect. 3 The allocation concealment was not described in any of these studies. 4 Bias related to blinding of growth outcome assessment was unclear in most of two studies. 5 Incomplete outcome data was not clearly reported in the Indonesian study. 6 The CI (‐0.20 to 0.30) crosses the line of no effect.
7The CI (‐0.33 to 0.13) crosses the line of no effect.
Summary of findings 8. Supplementary feeding compared to no food supplementation for ≤ 12 months in children aged less than five years in LMIC.
| Patient or population: Children aged less than five years in LMIC Settings: China Intervention: Supplementary feeding1 Comparison: No food supplementation | ||||||
| Outcomes | Illustrative comparative risks* (95% CI) | Relative effect (95% CI) | No of Participants (studies) | Quality of the evidence (GRADE) | Comments | |
| Assumed risk | Corresponding risk | |||||
| No food supplementation | Supplementary feeding | |||||
| Change in weight‐for‐age z‐core during the intervention Weight scale and and child growth reference Follow‐up: 10 months | The mean change in weight‐for‐age z‐core during the intervention in the intervention groups was 0.12 higher (0.05 to 0.19 higher) | 348 (1 study) | ⊕⊕⊝⊝ low2,3,4 | |||
| Change in length/height z‐score during the intervention Measurement board and child growth reference Follow‐up: 10 months | The mean change in length/height z‐score during the intervention in the intervention groups was 0.05 higher (0.01 to 0.08 higher) | 348 (1 study) | ⊕⊕⊝⊝ low2,3,4 | |||
| *The basis for the assumed risk (e.g. the median control group risk across studies) is provided in footnotes. The corresponding risk (and its 95% confidence interval) is based on the assumed risk in the comparison group and the relative effect of the intervention (and its 95% CI). CI: confidence interval | ||||||
| GRADE Working Group grades of evidence High quality: Further research is very unlikely to change our confidence in the estimate of effect. Moderate quality: Further research is likely to have an important impact on our confidence in the estimate of effect and may change the estimate. Low quality: Further research is very likely to have an important impact on our confidence in the estimate of effect and is likely to change the estimate. Very low quality: We are very uncertain about the estimate. | ||||||
1 The duration of the intervention was ≤ 12 months. 2 The random generation sequence and the allocation concealment were not described. 3 Bias related to blinding of growth outcome assessment was unclear. 4 Incomplete outcome data was not clearly reported.
Background
Child undernutrition contributes to more than one third of child deaths (Black 2008). On September 2010, the Interagency Group for Child Mortality Estimation released data indicating that nearly 8.1 million children under five years of age died in 2009 (http://www.childmortality.org/cmeMain.html). Half of these deaths occurred in only five countries, which were India, Nigeria, Democratic Republic of the Congo, Pakistan and China. For millions more who survive, growth and development may be irreversibly damaged, quality of life diminished and future wellbeing compromised by undernutrition. According to UNICEF, 24 countries account for more than 80% of the global burden of chronic child undernutrition (as measured by stunting, that is, low length or height for age), with 90% of these chronically undernourished children living in Asia and Africa (UNICEF 2009).
Description of the condition
Human growth consists of a progression of events that is marked by increasing physical size (bone growth and muscle and fat accretion) and vital physiologic and intellectual development. The process requires a balanced mix of energy and nutrients, appropriate care and the absence of disease to ensure that an individual's genetic potential for growth is fulfilled (Black 2008). If nutrients are in short supply or unbalanced, or if the child is exposed to environmental stressors (for example, infections) that interfere with nutrient intake or utilisation, growth is impaired. Should this happen in a period of life that is programmed by nature for rapid growth and development (Victora 2010), the deficits incurred result in irreversible damage, with associated consequences including shorter adult height, lower educational achievement, reduced adult income and decreased offspring birth weight (Victora 2008). These perpetuate the intergenerational cycle of undernutrition.
In early childhood, common causes of undernutrition in low and middle income countries are 1) inappropriate feeding practices and behaviours, such as lack of promotion of exclusive breastfeeding jointly with early introduction of complementary foods, and 2) receiving inadequate diets in terms of quantity or quality, or both (WHO 1999). Undernutrition and infection are closely related to the high morbidity and mortality in circumstances of high exposure to infectious diseases and inadequate diet. In this regard, household food insecurity has an important role in determining the state of nutrition of children who live in poor environments.
Undernutrition in children can be diagnosed in a number of ways, and it is most commonly assessed through the measurement of weight and height. A child can have low weight for his age (underweight), be too short for his age (stunted) or have low weight for his height (wasted). Each of these situations reflects a certain aspect of the problem: weight is known to be a sensitive indicator of acute deficiencies, whereas height captures more chronic exposure to deficiencies and infections. Wasting is used as a way to identify severe acute malnutrition.
Description of the intervention
Supplementary feeding, defined as the provision of extra food to children or families beyond the normal ration of their home diets, is an intervention aimed at improving the nutritional status or preventing the nutritional deterioration of the target population (Beaton 1982). Young children can consume the supplementary food at home, at a supervised feeding centre or at other places adapted for this purpose. These different approaches have implications that should be considered when assessing the effectiveness of supplementary feeding. When supplementary feeding is provided 'out of home', the family needs to be motivated to participate daily. As someone has to be able to take the child to and from the centre each day, the centre should be in reasonably close proximity to their home. Further, personnel are needed to prepare and serve the food as well as record and monitor participation. The 'at home' food approach permits a greater geographic distance between those distributing the food and the homes and hence requires fewer staff. However, the impact on the intended beneficiaries is probably less due to the fact that food delivered to the home may well be shared with other family members (Beaton 1982).
The content and type of supplementary feeding varies across countries due to issues related to the cultural meaning of supplemental food, the availability of local foods and the acceptance of imported foods, etc.
How the intervention might work
The theoretical objective of supplementary feeding is to improve the quality and quantity of the child's daily nutritional intake by providing additional calories, minerals and vitamins. It is therefore rational to assume that the provision of supplemental food of high quality would result in better anthropometric status of the recipients.
The most widely used indicator for screening of children as beneficiaries of supplementary feeding is weight‐for‐age. Therefore, if low weight‐for‐age is the criterion for selection, a proportion of small but not undernourished children who are likely not to respond to a feeding supplementation will be included. On the other hand, children who are undernourished but relatively tall and thus have 'normal' weight‐for‐age will not be recruited. For these reasons, it is advisable to base screening for undernutrition on indicators that also include length or height. The benefits of supplementary feeding can be expected to be noticeable first in a change of weight indicators (weight‐for‐length or height or weight‐for‐age), although it should be provided for an extensive period to also affect the length or height‐for‐age (FNB 2009).
In young children, supplementary feeding may improve the current nutritional situation and contribute to a long‐term improvement but not, in and of itself, represent a solution to the primary health and nutritional problems faced by families living in poverty. In this context, diarrhoea and infectious diseases may weaken the beneficial effects of supplementary feeding. Food safety, housing, water supply and sanitation are key contextual factors that need to be considered when assessing the effects of nutritional interventions on child health and growth.
Why it is important to do this review
The development of appropriate interventions aimed at preventing or treating impaired growth in young children is a priority given the devastating effects of child malnutrition on human performance, health and survival. Earlier evaluations of supplementary feeding not based on a Cochrane systematic methodology yielded mixed results (Beaton 1982; Caulfield 1999; WHO 1999; Dewey 2008). In other words, supplementary feeding has been largely implemented but the real impact on child growth remains unknown. Given the current global burden of disease due to undernutrition, and in view of the reliance of many governments and non‐governmental organisations (NGOs) on this nutritional intervention to enhance child health in low and middle income countries, this review is of great importance.
As Mulrow states in her chapter on the rationale for systematic reviews (BMJ 1995), “the value of any single study is derived from how it fits with and expands previous work, as well as from the study's intrinsic properties”. Our up‐to‐date assessment of the available evidence about the effects of supplementary feeding on child growth has amalgamated new primary study results into the existing body of research. This systematic review assessed the available randomised controlled trials on supplementary feeding and contributes to identifying research priorities.
Objectives
To assess the effectiveness of community‐based supplementary feeding in promoting the growth of children from birth to five years of age in low and middle income countries.
Methods
Criteria for considering studies for this review
Types of studies
Randomised controlled trials (randomisation by cluster or individual). We excluded quasi‐randomised designs.
Types of participants
Children from low and middle income countries born at term (≥ 37 completed weeks of gestation), from birth to five years old. We excluded studies including children with malnutrition not resulting from insufficient dietary intake, for example, cystic fibrosis, metabolic and endocrine disorders.
Types of interventions
Supplementary feeding was defined as the provision of extra food to children or families beyond the normal rations of their home diets. The intervention had to be 'community‐based', that is, young children could consume the supplementary food at home, at a supervised feeding centre or at other places adapted for this purpose, such as healthcare centres and crèches. We excluded trials in hospital and refugee settings.
Supplementary feeding could comprise:
meals (local or imported foods);
drinks (juices or milk);
snacks (including both food and milk snacks).
Controls included either no treatment (home diet or no extra feeding) or placebo (for example, low‐ or no‐protein and low‐energy drinks).
Types of outcome measures
Primary outcomes
We considered the following primary anthropometric (growth measurement) outcomes.
Weight expressed in kg or weight‐for‐age (W‐F‐A) z‐score at the end of the intervention.
Length or height expressed in cm or length‐ or height‐for‐age (L‐F‐A or H‐F‐A) z‐score at the end of the intervention.
Weight‐for‐height (W‐F‐H) z‐score at the end of the intervention.
Weight or length or height gain during the intervention.
W‐F‐A, L/H‐FA and W‐F‐L/H change during the intervention.
Prevalence of underweight (weight‐for‐age below ‐2 standard deviations (SD) from the reference median value of the international growth reference).
Prevalence of stunting (length‐ or height‐for‐age below ‐2 SD from the reference median value of the international growth reference).
Prevalence of wasting (weight‐for‐length or height below ‐2 SD from the reference median value of the international growth reference).
Secondary outcomes
Mid‐upper arm circumference (MUAC) in cm.
Skinfold thickness (subscapular, tricipital) in mm.
Head circumference (front‐occipital circumference) in cm.
Potential adverse effects such as decrease of breast milk intake, overweight (weight‐for‐length or height above + 2 SD from the reference median value of the international growth reference) and diarrhoea as reported by trialist.
Programme costs
Use and interpretation of direct or indirect costs related to the intervention will be carried out in future updates if data are available.
Search methods for identification of studies
Electronic searches
Searches for the original review were run in 2005 (Figure 1). For this update, the MEDLINE search strategy was revised to incorporate new MeSH terms and the Cochrane highly sensitive search strategy for identifying randomised trials (Lefebvre 2008). Additional free‐text terms were also added to increase the sensitivity of the search. New searches based on the updated MEDLINE strategy were executed for the period 2005 onwards. The new terms were also used to search the period covered by the original review and records not found by the original searches were identified.
For this update we searched the following databases.
Cochrane Central Register of Controlled Trials (CENTRAL), searched via The Cochrane Library on DVD (January 2011). MEDLINE (Ovid), 1948 to week 3 January 2011 (searched 31 January 2011). EMBASE (Ovid),1980 to week 3, 2011 (searched 31 January 2011). CINAHL (EBSCO), 1937 to current (searched 31 January 2011). LILACS, all years (searched 31 January 2011). WorldCat (OCLC), limited to dissertations and theses (searched 31 January 2011). ClinicalTrials.gov (searched 31 January 2011).
Social Science Citation Index and Dissertation Abstracts International were searched for the original review but were not available for this update. We searched two new sources: OCLC WorldCat (dissertations and theses) and ClinicalTrials.gov. No language restrictions were applied.
See Appendix 1; Appendix 2; Appendix 3; Appendix 4; Appendix 5; Appendix 6; Appendix 7 for further details.
Searching other resources
We scanned references of retrieved articles and relevant reviews for potentially eligible studies. When contact details were available, we sent emails to the authors of the included trials asking for help in clarifying relevant and missing data.
Data collection and analysis
Selection of studies
Two review authors independently assessed titles and abstracts of articles retrieved by the electronic searches to determine whether they met the inclusion criteria. For the current updated review, this was performed by YS and AMB, who were not blinded to the names of the authors, institutions or journal of publication. We resolved discrepancies by discussion. When necessary, we consulted a third review author (MDO).
We created the following consecutive categories to discard studies and recorded these in the study selection flowcharts (Figure 1 and Figure 2).
1.
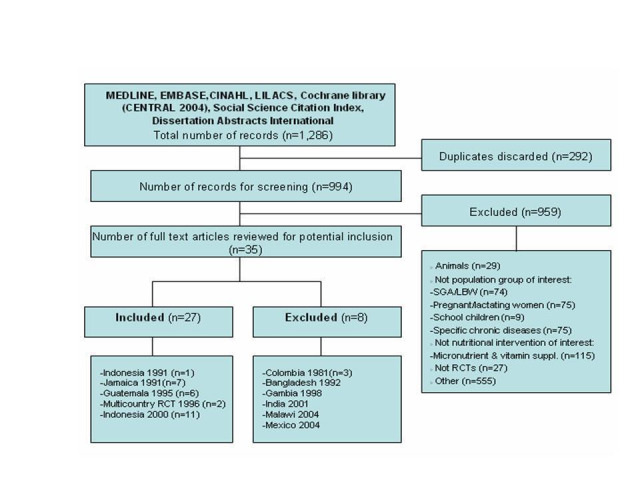
Updated flowchart of searches up to 2005. The four country RCT conducted in Bolivia, Congo, New Caledonia and Senegal was included in the current version of the review due to a change of exclusion criteria between the protocol and review. The corresponding citation is Multicountry study 1996. See Differences between protocol and review for further explanations.
2.
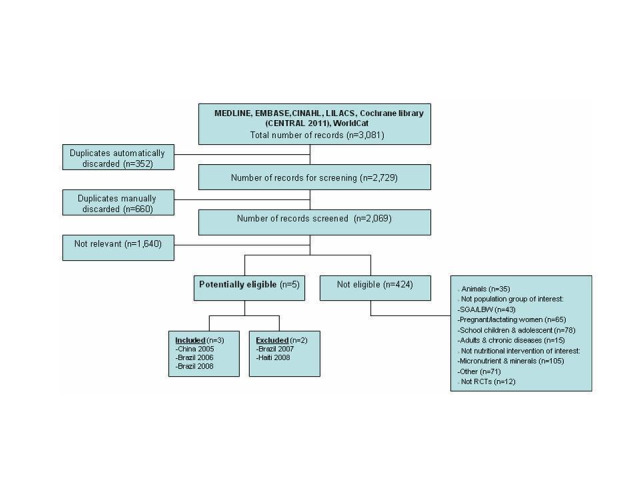
Flowchart of 2011 searches.
1) Animals, i.e., experimental studies not involving human beings. 2) Not population group of interest, i.e., not preschool children (small for gestational age and low birth weight; pregnant and lactating women; school children and adolescents; adults and chronic diseases). 3) Not nutritional intervention of interest, i.e., not food supplementation (micronutrient and minerals supplementation; others such as breastfeeding promotion, education interventions, prevention of obesity). 4) Not RCTs, e.g., observational studies, programme evaluation, descriptive studies.
Data extraction and management
We retrieved full copies of all those articles deemed potentially eligible by one of the review authors (YS) for closer examination. Two review authors (YS and AMB) determined whether they met eligibility criteria. We sought the advice of MDO, our content expert, when necessary. YS and AMB independently extracted data and recorded the data on data extraction forms. These included method of random allocation, participant characteristics, description and length of the intervention and co‐interventions, data on outcomes related to child physical growth and rates of withdrawals. We discussed any disagreements and consulted a third review author, when necessary.
Two review authors (YS and AMB) independently coded all studies. One of the review authors (YS) entered and organised citations and data in Review Manager 5.1 software (Rev Man 2011) and another review author who was involved in the data extraction (AMB) double‐checked the data entry process.
Assessment of risk of bias in included studies
Two review authors (YS and GC) independently assessed each included study on a number of criteria, which are listed below. Domains were defined as per the Cochrane Handbook for Systematic Reviews of Interventions (Higgins 2009).
Allocation concealment to intervention groups (protection against selection bias)
Low risk: indicated adequate concealment of allocation (e.g., by consecutively numbered, sealed opaque envelopes). Unclear risk: indicated uncertainty about whether the allocation was adequately concealed (e.g., possibly where the method of allocation concealment was not reported). High risk: indicated that the allocation was definitely not adequately concealed (for example, open random number lists).
Blinding of participants and personnel (protection against performance bias)
Low risk: participants and personnel were unaware of the assigned treatment when collecting outcome measures. Unclear risk: blinding of participants and personnel not reported and could not be verified by contacting investigators. High risk: participants and personnel were aware of the assigned treatment when collecting outcome measures.
Blinding of outcome assessors (protection against detection bias)
Low risk: outcome assessors unaware of the assigned treatment when collecting outcome measures. Unclear risk: blinding of outcome assessors not reported and could not be verified by contacting investigators. High risk: outcome assessors were aware of the assigned treatment when collecting outcome measures.
Incomplete outcome data, i.e., participants included in the analysis were not exactly those who were randomised into the trial (protection against attrition and exclusion bias).
Low risk: incomplete outcome data less than 20% in each of the comparison groups. Unclear risk: numbers randomised or numbers on outcome data for any of the study groups that were not clearly reported. High risk: incomplete outcome data of 20% or more in any of the comparison groups. In addition, we reported on the numbers and reasons for outcomes being missing to judge whether incomplete data may have introduced bias given the purpose of analysis, duration of intervention and specific context of included studies.
Other sources of bias
i) Reliable primary outcome measures (training of personnel, number of replicates of measurements, calibration of equipments, etc.)
Low risk: if the anthropometric method or procedures to take anthropometric measurements such as weight and length or height were described in detail, if personnel were trained in line with established protocols and if equipment was calibrated regularly. Unclear risk: if the methods or procedures to take anthropometric measurements and the level of training of personnel were not reported and could not be verified by contacting investigators. High risk: if the methods or procedures to take anthropometric measurements and training of personnel were not adequate, or if equipment was not calibrated regularly.
ii) Intention to treat
Low risk: intention‐to‐treat analysis performed or possible with data provided. Unclear risk: intention‐to‐treat analysis not reported and could not be verified by contacting the investigators. High risk: intention‐to‐treat analysis not done and not possible with data provided.
Measures of treatment effect
Continuous data
We combined continuous data provided that means and standard deviations were available and there was no clear evidence of skew in the distribution. We used 95% confidence intervals for individual study data and pooled estimates. We carried out a meta‐analysis according to planned, prespecified subgroups: duration of the intervention (less or more than 12 months), age of participants (less or more than 24 months of age) and nutritional status of children (stunted or wasted, or non‐stunted or wasted children).
In future updates of this review, if scales measure the same clinical outcomes in different ways we will compare standardised mean differences (SMD) across studies. We will use inverse variance methods to pool SMDs, so that each effect size is weighted by the inverse of its variance, in an overall estimate of effect size.
Binary data
Should sufficient binary data be combined in future updates of this review, we will analyse them by calculating odds ratios with 95% confidence intervals. If some primary studies report an outcome as a dichotomous measure and others use a continuous measure of the same construct, we will use two separate meta‐analyses (one for odds ratios and another for SMDs). When a primary outcome study provides multiple measures of the same construct at the same point in time, we will use an average effect size to avoid dependence problems. When a primary outcome study reports multiple measures of the same construct at different points in time, we will use a single measure that is closest to a one‐year follow‐up.
Dealing with missing data
For the primary growth outcomes, data were likely to be missing for reasons related to group assignment. Although the recommendation is not to ignore ‘not missing at random’ data, we were not able to implement new strategies for dealing with missing data. As planned at the protocol stage, we reported reasons for missing data, including reasons and numbers for dropouts. Whenever possible, we sent emails to the original investigators requesting missing data and other key information in order to determine whether the incomplete outcome was not measured or reported. Finally, we acknowledged this issue as a potential source of bias in the discussion section of the review.
For future updates of the review, if there is sufficient time we will consider implementing other available strategies for dealing with missing data, such as imputing the missing data with replacement values and treating these as if they were observed (for example, imputing an assumed outcome such as assuming all were poor outcomes, imputing the mean), or using statistical models to allow for missing data and making assumptions about their relationships with the available data. We will also conduct sensitivity analysis to evaluate the potential impact of incomplete outcome data on the findings of the review (see Sensitivity analysis).
Assessment of heterogeneity
There was high heterogeneity amongst the included studies regarding baseline sample characteristics, nutritional composition and variety of food used for supplementary feeding, duration of the intervention and type of outcome measurement (see Table 9 for further details). Notwithstanding this, we pooled some studies reporting on the same primary outcomes according to prespecified subgroups, described in the Subgroup analysis and investigation of heterogeneity section.
1. Baseline characteristics of included studies (n = 8).
| Country/region |
Year of publication |
Target age of children |
Type of delivery |
Type of food |
Target ration Exp Control |
Duration of the intervention |
Outcome measures |
||
| Indonesia/West Java | 1991 | 6‐20 months | Feeding centre | Two snack foods (including, rice, rice flour, wheat flour, bread, cassava, potatoes, sweet potatoes, coconut milk, refined sugar, brown sugar, and oil) | 400 kcal and 5 g proteins per day (daily average estimate) | No snack | 3 months | Weight and height z‐scores at the end of intervention. |
|
| Jamaica/Kingston | 1991 | 9‐24 months (stunting) | Take home supplementary food | 1 kg milk‐based formula. In addition, 1 kg each of skimmed milk powder and cornmeal were provided were provided to other household members. |
525 kcal and 14 g proteins/100 g of milk | No milk supplementation | 12 months | Length (cm), weight (kg), HC (cm), MUAC (cm), TSF (mm), SSF (mm), W‐F‐L z‐ score at the end of intervention. | |
| Guatemala/El Progreso | 1995 | Birth‐7 years | Feeding centre | Liquid supplement consumed daily on a voluntary basis. |
Atole: 90.5 kcal and 63.5 g proteins/100 ml |
Fresco: 33 kcal/100 ml | N/A | Length (cm), weight (kg) before and after the beginning of the study. | |
| Bolivia/Pasankeri, La Paz [1] |
1996 | 4‐7 months | Take home supplementary food | Cereal based precooked porridge enriched with vitamins & minerals to be mixed with boiled water for hygienic preparation. | Per 100 g of dry porridge the supplemental food provided: 410 kcal, 9 g of proteins, 10 g of lipids, and 67 g of carbohydrates [2] |
No food supplementation |
3 months | Weight (kg), length (cm) at the end of intervention and weight (kg) and length (cm) gain during the intervention. | |
| Congo/Mikalou, Brazzaville [1] |
1996 | 4‐7 months | Take home supplementary food | Cereal based pre‐cooked porridge enriched with vitamins and minerals to be mixed with boiled water for hygienic preparation. | Per 100 g of dry porridge the supplemental food provided: 410 kcal, 9 g of proteins, 10 g of lipids, and 67 g of carbohydrates [2] | No food supplementation |
3 months | Weight (kg), length (cm) at the end of intervention and weight (kg) and length (cm) gain during the intervention. | |
| New Caledonia/Island of Mare [1] |
1996 | 4‐7 months | Take home supplementary food | Cereal based pre‐cooked porridge enriched with vitamins and minerals to be mixed with boiled water for hygienic preparation. | Per 100 g of dry porridge the supplemental food provided: 410 kcal, 9 g of proteins, 10 g of lipids, and 67 g of carbohydrates [2] | No food supplementation |
3 months | Weight (kg), length (cm) at the end of intervention and weight (kg) and length (cm) gain during the intervention. | |
| Senegal [1] | 1996 | 4‐7 months | Take home supplementary food | Cereal based pre‐cooked porridge enriched with vitamins and minerals to be mixed with boiled water for hygienic preparation. | Per 100 g of dry porridge the supplemental food provided: 410 kcal, 9 g of proteins, 10 g of lipids, and 67 g of carbohydrates [2] | No food supplementation |
3 months | Weight (kg), length (cm) at the end of intervention and weight (kg) and length (cm) gain during the intervention. | |
| Indonesia/West Java | 2000 | 12 and 18 months (moderate stunting and wasting) | Feeding centre | Condensed milk | 500 kcal and 12 g of protein per day. |
Skimmed milk | 12 months | Height (cm), weight (kg), HC (cm), MUAC (cm) at the end of intervention. | |
| China/Beijing | 2005 | 3‐5 years | Feeding centre | Yogurt (125 g per service) | 3.8 g protein per ration. Total amount of calories not reported. | No yogurt | 9 months | Weight gain (kg), height gain (cm), change of H‐F‐A, W‐F‐A z‐score during the intervention and MUAC (cm) at the end of intervention. | |
| Brazil/Joao Pessoa, Paraiba | 2006 | 1‐6 years | Feeding centre | Multimixture (wheat flour, cornmeal, melon seed powder, sesame, gourd, peanut, cassava leaf powder, eggshell ) | 11,7 g proteins, 74,2 g of carbohydrate and 5,2 g of lipids per 100 g of preparation. No further information provided. | Placebo: cassava flour |
2 months | W‐F‐A, H‐F‐A and W‐F‐H z‐scores, prevalence of underweight, stunting, wasting at the end intervention | |
| Brazil/Maceio, State of Alago | 2008 | 6‐60 months | Take home supplementary food | 2 soup spoons of multimixture per day (80% wheat flour, 10% cassava leaf powder, and 10% egg shells) | No kcal or protein content (g) per ration reported. | No multimixture | 10 months | H‐F‐A, W‐F‐A and W‐F‐H z‐score at the end of intervention. | |
Abbreviations: cm (centimetres), Exp (experimental), g (grams), H‐F‐A (height‐for‐age), kcal (kilocalories), kg (kilograms), ml (millilitres), mm (millimetres), mo (months), MUAC (mid‐upper arm circumference), N/A (not available), W‐F‐A (weight‐for ‐age), W‐F‐H (weight‐for‐height), W‐F‐L (weight‐for‐length), SSF (subscapular skin folder), TSF (tricipital skin folder).
[1] Simondon KB, Gartner A, Berger J, Cornu A, Massamba JP, San Miguel JL et al. Effect of early, short‐term supplementation on weight and linear growth of 4‐7‐mo‐old infants in developing countries: a four‐country randomized trial. Effect of early, short‐term supplementation on weight and linear growth of 4‐7‐mo‐old infants in developing countries: a four‐country randomized trial 1996;64 (4):537‐45.
[2] Introduction was progressive, 25 g dry supplement in 75 ml water per meal, i.e.103 kcal in 100 g from 4 to 5 months and 50 g supplement and 135 ml water per meal, i.e. 205 kcal in 185 g from 5 to 7 months.
Consistency of results were assessed visually and by examining the I2 statistic (Higgins 2002), a quantity that describes the proportion of variation in point estimates that is due to heterogeneity rather than sampling error.
Assessment of reporting biases
In future updates of this review, if sufficient studies are found, we will draw funnel plots (effect size against standard error). Asymmetry could be due to publication bias but can also be due to a relationship between trial size and effect size. In the event that a relationship is found, we will examine the clinical diversity of the studies as a possible explanation (Egger 1997).
Data synthesis
We carried out statistical analysis using the Review Manager (RevMan) 5.1 software (Rev Man 2011). We presented results as mean differences (MDs) with their 95% confidence intervals (CI) as the outcomes assessed were continuous. For the present updated version of the review, we decided to perform a meta‐analysis of primary growth outcomes based on the prespecified study characteristics, that is, age of the children (younger or older than 24 months), nutritional status at baseline (stunting or wasting, or not) and duration of the intervention (less or more than 12 months) in order to quantify pooled effects and to assess to what extent aggregated data provide further information about whether community‐based supplementary feeding helped to promote the growth of children from birth to five years in low and middle income countries.
Subgroup analysis and investigation of heterogeneity
Prespecified subgroups analyses based on the age of the children (younger or older than 24 months), nutritional status at baseline (stunting or wasting, or not) and duration of the intervention (less or more than 12 months) were determined at the protocol stage of the review.
Sensitivity analysis
If appropriate, we will perform sensitivity analyses in future updates to evaluate whether the pooled effect sizes are robust across components of risk of bias. In line with the methodological criteria assessed; we will conduct sensitivity analysis for each major risk of bias domain, such as concealment allocation, incomplete outcome data and blinded outcome assessment.
Meta‐regression
If appropriate, and an adequate number of trials are included, meta‐regression will be conducted in future updates to examine the relationship between study characteristics (such as the age of the children, nutritional status of the children at baseline and duration of the intervention) and the size of effects.
Results
Description of studies
We included eight out of 16 potentially eligible studies. See Figure 1 and Figure 2.
Results of the search
The new searches (Electronic searches) yielded 2069 unique citations. Of those, only three new RCTs (China 2005; Brazil 2006; Brazil 2008) met the inclusion criteria for this review (see Figure 2). Five RCTs conducted before 2005 were also included in the review (Indonesia 1991; Jamaica 1991; Guatemala 1995; Multicountry study 1996; Indonesia 2000) (see Figure 1).
Included studies
Eight RCTs (n = 1243 children) published as journal articles are included in this updated version of the review.
Location of studies
The studies were conducted in Bolivia (Multicountry study 1996), Brazil (Brazil 2006; Brazil 2008), China (China 2005), Congo (Multicountry study 1996), Indonesia (Indonesia 1991; Indonesia 2000), Guatemala (Guatemala 1995), Jamaica (Jamaica 1991), New Caledonia (Multicountry study 1996) and Senegal (Multicountry study 1996).
Characteristics of study samples
The studies were heterogeneous and sample sizes varied from 65 to 447 participants. Differences existed in the age of participants, with four studies recruiting only very young children (< 24 months) (Indonesia 1991; Jamaica 1991 ; Multicountry study 1996; Indonesia 2000) and four involving older children (Guatemala 1995; China 2005; Brazil 2006; Brazil 2008). Nutritional status at baseline also differed. Six of the studies were focused on nutritionally‐at‐risk children (Jamaica 1991; Multicountry study 1996; Indonesia 2000; China 2005; Brazil 2006; Brazil 2008), whereas in the other two (Indonesia 1991; Guatemala 1995) there were no trial entry criteria based on child nutritional status.
Unit of randomisation
Six studies considered individuals as the unit of analysis (Jamaica 1991; Multicountry study 1996; Indonesia 2000; China 2005; Brazil 2006; Brazil 2008) and two used cluster randomisation (Indonesia 1991; Guatemala 1995).
Supplementary feeding interventions
Supplementation varied both in physical form, liquid (Guatemala 1995; Indonesia 2000) or solid (Indonesia 1991; Jamaica 1991; Multicountry study 1996; China 2005; Brazil 2006; Brazil 2008); and in method of delivery, home delivery (Jamaica 1991; Multicountry study 1996; Brazil 2008) versus central distribution (Indonesia 1991; Guatemala 1995; Indonesia 2000; China 2005; Brazil 2006)). Duration of food supplementation also varied: three months or less (Indonesia 1991 ; Multicountry study 1996; Brazil 2006), nine months (China 2005), 10 months (Brazil 2008), 12 months (Jamaica 1991; Indonesia 2000) and seven years (Guatemala 1995).
The quantity of calories or protein in the supplementary food content was variable. This information was reported as per day (Indonesia 1991; Multicountry study 1996; Indonesia 2000; China 2005) and per 100 ml or 100 mg of preparation (Jamaica 1991; Guatemala 1995; Brazil 2006). In one included study (Indonesia 2000) the energy of the snacks varied from 187 kcal to 216 kcal and protein content ranged from 1.8 g to 4.4 g. Only one study (Brazil 2008) did not report on this issue.
Primary outcome assessments
Timing of anthropometric measurements differed among studies. Three studies (Indonesia 1991; Brazil 2006; Brazil 2008) evaluated weight and length at the beginning and at the end of the intervention. In the Jamaican study (Jamaica 1991), children were measured at enrolment and six and 12 months later. The weight and length of children were assessed at birth, 15 days of life and at different intervals up to 84 months of age in the Guatemalan study (Guatemala 1995). Anthropometric measurements were taken monthly in the four country RCT (Multicountry study 1996). In the Indonesian study from 2000 (Indonesia 2000), children were assessed at baseline and at two, four, six, eight, 10 and 12 month after the beginning of the intervention. In the Chinese study (China 2005), measurements were taken at baseline and after three, six and nine months.
Primary outcomes were reported as mean weight (kg) and length or height (cm) at the end of the intervention (Jamaica 1991; Multicountry study 1996; Indonesia 2000) and mean weight or length or height gain during the intervention period (Multicountry study 1996; China 2005); mean z‐score for weight‐for‐age (Indonesia 1991; Brazil 2006; Brazil 2008) or length or height‐for‐age (Indonesia 1991; Brazil 2006; Brazil 2008) or weight‐for‐length or height (Jamaica 1991; Brazil 2006; Brazil 2008) at the end of the intervention; and change in weight‐for‐age and height‐for‐age z‐score during the intervention (China 2005). Only four studies reported on secondary outcomes: triceps and subscapular thickness (mm) (Jamaica 1991), head and arm circumferences (cm) (Jamaica 1991; Indonesia 2000; China 2005) and adverse effects (Brazil 2008).
We grouped the included studies into two categories: a) studies without formal assessment of malnourishment at baseline (Indonesia 1991; Guatemala 1995) and b) studies involving children formally assessed as malnourished (Jamaica 1991; Multicountry study 1996; Indonesia 2000; China 2005; Brazil 2006; Brazil 2008).
a) Studies without formal assessment of malnourishment at baseline (n = 2)
Indonesia 1991; Guatemala 1995
Developmental effects of short‐term supplementary feeding in nutritionally‐at‐risk Indonesian infants
Indonesia 1991 was a cluster‐randomised study designed to assess the effects of supplementary feeding on mental, motor and cognitive development of preschool children at six tea plantations in West Java, Indonesia. Children at the plantations were considered to be nutritionally‐at‐risk. Day care centres (DCCs) within the plantations provided caretaking services and food free of charge to children. Twenty DCCs were selected for the study based on their having more than 15 children whose ages ranged from six to 59 months. Selected children were later on divided into two age groups according to the psychological tests administered to them. DCC assignment to the two types of interventions was randomised and stepwise by pairs. The daily supplement consisted of twice‐a‐day snacks given six days a week for three months. Weight and length measurements were taken at the beginning and after three months of intervention and reported only for the young children group, that is, infants from six to 20 months. Pre‐treatment mean weight and length z‐scores were different between the study groups although authors stated that the difference was not statistically significant.
Nutritional impact of supplementation in the Instituto de Nutrición de Centro América y Panamá (INCAP) longitudinal study: analytic strategies and inferences
Guatemala 1995 was a cluster‐randomised controlled trial conducted between 1969 and 1977 in four rural Guatemalan villages to test the impact of early nutritional supplementation on child growth and development. Four villages were selected on the basis of similarities in sociocultural, anthropometric, dietary and morbidity characteristics. One pair of villages was relatively large (about 900 people each) and one pair was small (about 500 people each). Two pairs of study villages (one large and one small village) were randomly allocated to receive a skimmed milk‐based, high‐energy and high‐protein supplement (Atole) or a no‐protein, low‐energy supplement (Fresco). Both drinks were enriched with vitamins and minerals in equal concentrations but differed in appearance and taste, making cluster‐randomisation sensible as neighbours would not detect differences locally. The supplements were consumed on a voluntary basis by all residents of the villages at feeding stations. Ingestion was measured and recorded only for target participants, namely, pregnant and lactating woman aged 15 years and older and children up to the age of seven years. Children in the studied population were born before the intervention began or throughout the seven year study period. Therefore, depending on the date of birth, some of their mothers could also have been ingesting supplementary feeding for several years prior to pregnancy. Primary health care and vaccination services were available in all villages.
b) Studies involving children formally assessed as malnourished (n = 6)
Jamaica 1991; Multicountry study 1996; Indonesia 2000; China 2005; Brazil 2006; Brazil 2008.
Nutritional supplementation, psychosocial stimulation and mental development of stunted children: the Jamaican study
Jamaica 1991 aimed to assess the effects of home delivery of nutritional supplementation and psychosocial stimulation on the growth, development and morbidity of stunted children (height‐for‐age below ‐2 SD of the median of the National Center for Health Statistics (NCHS)/WHO reference values) aged nine to 24 months. The inclusion criteria were: singleton pregnancy, birth weight over 1.8 kg, standard of housing and maternal education below defined levels and no obvious mental or physical handicap. Children were randomly assigned to one of four groups: food supplementation; stimulation; food supplementation plus stimulation; and control. In addition to the food supplement, cornmeal and skimmed milk powder were provided to the family in an attempt to reduce sharing of the child's supplement. Free medical care was available for all children. We compared the supplemented (n = 32) versus control group (n = 33). However, results should be interpreted with caution due to the small samples and baseline differences in birth weight between the study groups (21% of the children in the control group weighed 1.8 to 2.3 kg and 100% of the children in the intervention group weighed more than 2.3 kg at enrolment).
Effect of early, short‐term supplementation on weight and linear growth of four to seven‐month old infants in developing countries: a four country randomised trial
Multicountry study 1996 was conducted in poor settings, including two rural (Senegal and New Caledonia) and two peri‐urban (Bolivia and Congo) areas. The education level of parents was low in Bolivia and Senegal and high in Congo and New Caledonia. The inclusion criteria were: single born, breastfed and no bottle feeding at entry to the trial (that is, at four months of age), length‐for‐age ≥ ‐2.5 SD and weight‐for‐length ≥ ‐2 SD based on the NCHS reference. In New Caledonia, weaned infants were also included due to the low rate of breastfeeding. The supplement was a cereal‐based precooked porridge enriched with vitamins and minerals to be mixed with boiled water for hygienic preparation. The packets were delivered at home twice daily for three months by a fieldworker who monitored their consumption. Introduction was progressive, 25 g dry supplement in 75 ml water per meal, that is, 103 kcal in 100 g from four to five months and 50 g supplement and 135 ml water per meal, that is, 205 kcal in 185 g from five to seven months. No food was given for other family members. The exclusion criteria were death of mother or child, lack of supplementation more than a week, missed measurements and refusal to continue participation. Anthropometric measurements were taken at the families' homes in all countries but Bolivia, where children were assessed at a health facility. Intercountry reliability was not performed. The outcomes were monthly increments of weight (kg) and length (cm).
Effects of an energy and micronutrient supplement on anthropometry in undernourished children in Indonesia
Indonesia 2000 was conducted in six tea plantations in Panganlengan, West Java, to assess the consequences of food supplements on the growth, physical activity and various aspects of development in nutritionally‐at‐risk young children (length‐for‐age below ‐1 SD; weight‐for‐length between ‐1 and ‐2 SD of the median of NCHS/WHO reference values). At the time of the study, the majority of mothers employed on the plantation left their children aged one month to six years in day care centres (DCCs). Two age cohorts of children at 12 and 18 months of age were recruited from 24 community‐run DCCs. These children were randomly assigned to three nutritional interventions (condensed milk plus micronutrients, skimmed milk plus micronutrients, and skimmed milk). According to our inclusion criteria and comparison group definition, we considered two of the three intervention schemes in both study cohort: condensed milk (high energy) plus micronutrient tablet as the supplemented group (n = 38) and skimmed milk (low energy) plus micronutrients as the control group (n = 37).
Effects of yogurt supplementation on the growth of preschool children in Beijing suburbs
China 2005 was conducted in seven kindergartens of Beijing and enrolled healthy children aged three to five years with birth weight higher than 2.5 kg but with a height‐for‐age or weight‐for‐age, or both less than the growth reference level (the cut‐off limit used was not stated). Children in the experimental group (n = 201) received a daily serving of yogurt (125 g/cup) for nine months while children in the control group (n = 201) did not receive any supplementation. The exclusion criteria were: overweight or obesity; congenital or chronic infectious diseases; a history of gastrointestinal operation; taking antibiotics for more than one week; intrauterine growth retardation; disliking yogurt; or no parental consent. All children continued with the usual diet provided by the kindergartens during the study.
Impact of a dietary supplement on the nutritional status of preschool children enrolled in day care centres
Brazil 2006 was a two‐month double‐blinded study that recruited children with ages ranging from one to six years from four randomly selected DDCs at João Pessoa, Paraíba. The objective of this study was to evaluate the impact of a diet supplemented with a bran‐based cereal mixture on the nutritional status of preschool children presenting nutritional risk according to the NCHS reference data. The exclusion criteria were: administration of ferrous sulphate; vitamins or any other drug; absent for more than six days; and weight‐for‐age below ‐3 SD. Children were divided into three groups: intervention 1 (GI1); intervention 2 (GI2); and control (CG), receiving 5 g and 10 g of the multi‐mixture and placebo, respectively. We compared GI2 (n = 42) versus placebo (n = 45) after two months of intervention.
Effects of the consumption of 'multi‐mixture' on nutritional status: a community trial involving children from a slum district on the outskirts of Maceió, State of Alagoas, Brazil
Brazil 2008 involved children aged six to 60 months of age from a poor area of Maceió city who had been previously classified based on their weight‐for‐age z‐score and according to the NCHS/CDC reference data. The children with lowest weight‐for‐age z‐score were randomly assigned, by drawing lots, to two tablespoon of a multi‐mixture per day (intervention group, n = 48) or to no supplementation (control group, n = 60) for 10 months. Exclusion criteria were: no parental consent; severe undernutrition defined by anthropometrical indicators below ‐3 SD; malformations or diseases. After entry to the study and during the data collection phase, children were also excluded in cases of nutritional status deterioration, adverse events in response to multi‐mixture consumption, refusal of parents to continue in the study, and no participation in all study phases. A polyvalent anthelmintic drug was provided to all children.
For further details, see the Characteristics of included studies table.
Excluded studies
Otherwise relevant studies (n = 8) were excluded either because supplementary feeding was part of complex 'packages' of interventions that precluded evaluation of the effects separately (Mexico 2004; Haiti 2008) or the intervention groups did not fit in with our inclusion criteria (Colombia 1981; Bangladesh 1992; Gambia 1998; India 2001; Malawi 2004; Brazil 2007).
For further details see Characteristics of excluded studies, Figure 1 and Figure 2.
Risk of bias in included studies
In general, the trials included in this review were at relatively high risk of bias (see Figure 3 and Figure 4).
3.
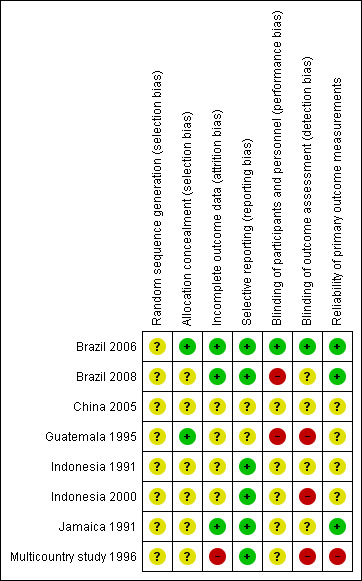
Risk of bias summary: review authors' judgements about each risk of bias domain for each included study
4.
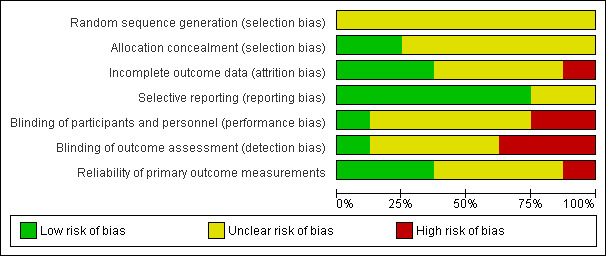
Risk of bias graph: review authors' judgements about each risk of bias domain presented as percentages across all included studies
Information about the random sequence generation was only reported in three studies (Multicountry study 1996; Brazil 2006; Brazil 2008). Allocation concealment was not described in any of the included studies (Indonesia 1991; Jamaica 1991; Guatemala 1995; Multicountry study 1996; Indonesia 2000; China 2005; Brazil 2006; Brazil 2008).
Sample sizes were not calculated for a specific magnitude of effect in five of the eight included trials (Indonesia 1991; Jamaica 1991; Guatemala 1995; China 2005; Brazil 2008).
Bias related to blinding of growth outcome assessment was unclear in six studies (Indonesia 1991; Jamaica 1991; Indonesia 2000; China 2005; Brazil 2006; Brazil 2008) and high in two (Guatemala 1995; Multicountry study 1996).
Incomplete outcome data were not clearly reported in four studies (Indonesia 1991; Guatemala 1995; Indonesia 2000; China 2005). Attrition bias was particularly high in the four country RCT (Multicountry study 1996) and the reasons for incomplete outcome data were as follows.
Bolivia: 24% (control group: 15 refusals, 5 absences) and 16% (intervention group: 9 refusals, 4 absences).
Congo: 11% (control group: 1 death, 6 absences) and 32% (intervention group: 2 deaths, 12 refusals, 7 absences).
New Caledonia: 11% (control group: 6 absences) and 31% (intervention group: 8 refusals, 11 absences, 1 illness).
Senegal: 16% (control group: 3 deaths, 2 refusals, 5 absences, 1 illness) and 20% (intervention group: 2 deaths, 7 refusals, 3 absences, 1 illness).
The method for taking anthropometric measurements, the growth reference and the cut‐off limits used were described in most of the included studies but details on staff training and number of replicates of measurements were not always provided.
For further details, see Risk of bias in included studies.
Effects of interventions
See: Table 1; Table 2; Table 3; Table 4; Table 5; Table 6; Table 7; Table 8
We presented primary and secondary results in the order planned at protocol stage, grouping the included trials into two categories: a) studies without formal assessment of malnourishment at baseline (Indonesia 1991; Guatemala 1995) and b) studies involving children formally assessed as malnourished (Jamaica 1991; Multicountry study 1996; Indonesia 2000, China 2005; Brazil 2006; Brazil 2008). High clinical heterogeneity among studies was found regarding the participants, intervention and outcomes measures. Nevertheless, in order to present pooled estimates of effects, we decided to combine studies according to prespecified characteristics: age of the children (younger or older than 24 months), nutritional status at baseline (stunting or wasting, or not) and duration of the intervention (less or more than 12 months).
Primary outcomes
a) Studies without formal assessment of malnourishment at baseline (n = 2)
Indonesia 1991; Guatemala 1995
Both studies were cluster‐RCTs. Indonesia 1991 included 11 DCCs in the intervention group (n = 75 children) receiving supplementary feeding and 9 DCCs in the control group (n = 38 children). Guatemala 1995 included four villages as the unit of analysis (exact sample sizes were not provided). As implemented, the effects of interventions were ascertained through comparisons of results before and after the intervention in the two 'Atole' (high‐energy protein drink) and two 'Fresco' (low‐energy protein drink) villages. The before‐after comparison was possible only for selected variables (such as length) collected during 1968, before the intervention began.
Weight‐for‐age and height‐for‐age z‐score at the end of the intervention
Energy‐protein supplementation versus no supplementation in poor children after three months (Indonesia 1991)
In the absence of a relevant intracluster coefficient and in order to use reported data, we used the numbers of children in each comparison group to calculate the effect size after three months of intervention.
The mean difference in weight and height z‐scores for the intervention group compared to controls was 0.19 (95% CI ‐0.18 to 0.56) (Analysis 3.1) and 0.12 (95% CI ‐0.31 to 0.55) (Analysis 3.2), respectively.
3.1. Analysis.

Comparison 3 Energy‐protein supplementation versus no supplementation in poor children after three months, Outcome 1 Weight z‐scores at the end of the intervention.
3.2. Analysis.
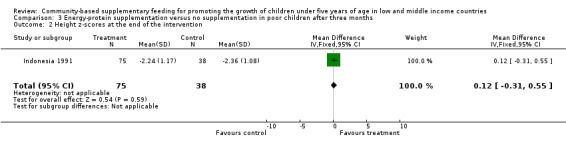
Comparison 3 Energy‐protein supplementation versus no supplementation in poor children after three months, Outcome 2 Height z‐scores at the end of the intervention.
Length (cm) before and after the intervention
High‐energy protein versus no low‐energy protein supplementation in poor children after three years of supplementation (Guatemala 1995)
The length of three‐year‐old children born between 1969 and 1973 was reported in a table published in Guatemala 1995, which is reproduced in full in Table 10. According to this analysis, the difference in net change in the large villages was 2.55 cm and in the small villages was 2.35 cm. The mean of these differences was 2.45 ± 0.10 cm (mean ± SD).
2. Length [1] of three‐year‐old children before and after supplementation by village.
| GUATEMALA STUDY 1995 | Large village‐Atole | Large village‐Fresco | Small village‐Atole | Small village‐Fresco |
| After [2] | 86.70 | 84.00 | 85.95 | 84.35 |
| Before [3] | 83.45 | 83.30 | 83.40 | 84.15 |
| Change | 3.25 | 0.70 | 2.55 | 0.20 |
| Difference in change (large villages): 2.55 | ||||
| Difference in change (small villages): 2.35 | ||||
| Overall difference in change: mean = 2.45 ± 0.10, t‐test = 24.50, P < 0.005 (Two‐tailed probability, df = 2). |
[1] Means of sex‐specific data calculated from Table 3 in Martorell et al (1982). [2] Born between 1969 and 1973. [3] Measured in 1968.
b) Studies involving children formally assessed as malnourished (n = 6)
Jamaica 1991; Multicountry study 1996; Indonesia 2000; China 2005; Brazil 2006; Brazil 2008
In Jamaica 1991, data on mean weight, length, head circumference, arm circumference and skinfolds were reported at six and 12 months after the intervention began. For the present analysis, we considered the results in the intervention group (food supplementation) compared to controls (no food supplementation) after 12 months of supplementation.
The four country RCT (Multicountry study 1996) compared supplementary feeding (intervention group) versus no supplementation (control group) and reported the monthly weight (kg) and length (cm) gain separately for each country. We included mean weight and length of each study group at the end of the study period, and the weight and length gain during the three months of supplementation in each study setting.
Indonesia 2000 provided means of the effects of supplementary feeding in comparison to no supplementation on weight, length, head and arm circumferences, stratified by cohort (12 or 18 months of age), by time, sex and supplement. Standard deviations (SDs) missing from the original papers were supplied by one of the trial's authors (Aitchison 2005). We calculated single group means and SDs for intervention and control groups, combining the data presented by sex and age.
China 2005 reported on increments of weight (kg), height (cm), mid‐upper arm circumference (cm) and change in height‐for‐age, weight‐for‐age z‐score after three, six and nine months of daily supplementation with yogurt versus no supplementation.
The Brazilian study from João Pessoa (Brazil 2006) evaluated the impact of a bran‐based cereal mixture on the height‐for‐age, weight‐for‐age and weight‐for‐height z‐scores after two months of supplementation (intervention group) compared to controls (no supplementation group). Other outcome measures were the prevalence of underweight, stunting and wasting.
The Brazilian study from Maceió (Brazil 2008) assessed the impact of a daily bran‐based cereal mixture on the mean height‐for‐age, weight‐for‐age and weight‐for‐height z‐score after 10 months of supplementation (intervention group) compared to controls (no supplementation group).
Weight (kg) at the end of the intervention
Three trials reported on this outcome (Jamaica 1991; Multicountry study 1996; Indonesia 2000). Pooled estimates based on the age of children (younger than 24 months), the nutritional status of children (stunted or wasted versus not stunted or wasted) and the duration of the intervention (supplementary feeding less than 12 months versus supplementary feeding equal or longer than12 months) were not statistically significant (MD ‐0.03; 95% CI ‐0.17 to 0.12) (Analysis 12.1; Analysis 13.1; Analysis 14.1). No heterogeneity was reported (Chi² = 5.41, df = 5 (P = 0.37); I² = 8%).
12.1. Analysis.
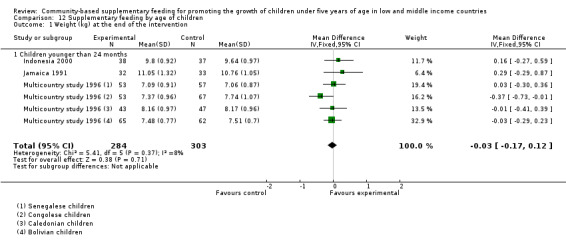
Comparison 12 Supplementary feeding by age of children, Outcome 1 Weight (kg) at the end of the intervention.
13.1. Analysis.
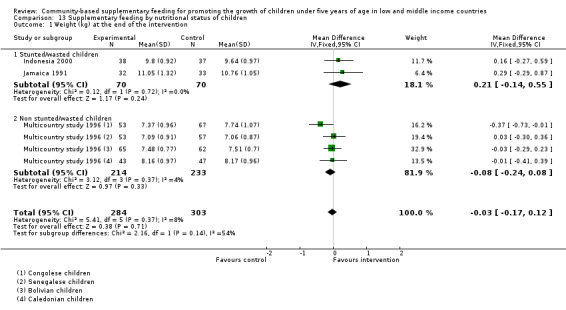
Comparison 13 Supplementary feeding by nutritional status of children, Outcome 1 Weight (kg) at the end of the intervention.
14.1. Analysis.
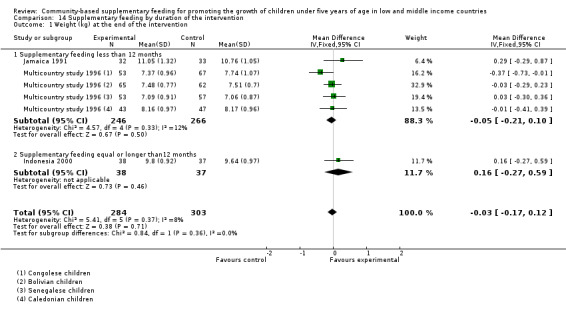
Comparison 14 Supplementary feeding by duration of the intervention, Outcome 1 Weight (kg) at the end of the intervention.
Energy‐protein supplementation versus no supplementation in stunted children after 12 months (Jamaica 1991)
The mean difference between study groups was 0.29 kg (95% CI ‐0.29 to 0.87) (Analysis 1.1).
1.1. Analysis.
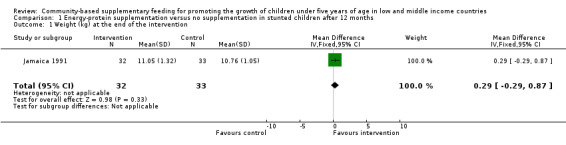
Comparison 1 Energy‐protein supplementation versus no supplementation in stunted children after 12 months, Outcome 1 Weight (kg) at the end of the intervention.
Energy‐protein supplementation versus no supplementation in poor children after three months (Multicountry study 1996)
The mean difference between study groups was ‐0.03 kg (95% CI ‐0.29 to 0.23) in Bolivia (Analysis 7.1); ‐0.01 kg (95% CI ‐0.41 to 0.39) in New Caledonia (Analysis 8.1); ‐0.37 kg (95% CI ‐0.73 to ‐0.01) in Congo (Analysis 9.1); and 0.03 kg (95% CI ‐0.30 to 0.36) in Senegal (Analysis 10.1).
7.1. Analysis.

Comparison 7 Energy‐protein supplementation versus no supplementation in poor Bolivian children after three months, Outcome 1 Weight (kg) at the end of the intervention.
8.1. Analysis.

Comparison 8 Energy‐protein supplementation versus no supplementation in poor Caledonian children after three months, Outcome 1 Weight (kg) at the end of the intervention.
9.1. Analysis.
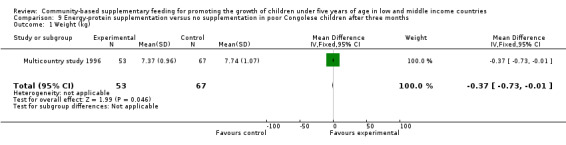
Comparison 9 Energy‐protein supplementation versus no supplementation in poor Congolese children after three months, Outcome 1 Weight (kg).
10.1. Analysis.
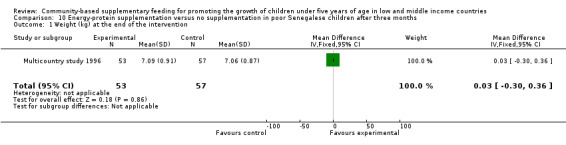
Comparison 10 Energy‐protein supplementation versus no supplementation in poor Senegalese children after three months, Outcome 1 Weight (kg) at the end of the intervention.
High energy and protein supplementation versus low‐energy, low protein supplementation in stunted or wasted children after 12 months (Indonesia 2000)
The mean difference between study groups was 0.16 kg (95% CI ‐0.27 to 0.59) (Analysis 2.1).
2.1. Analysis.
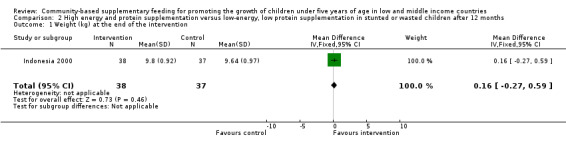
Comparison 2 High energy and protein supplementation versus low‐energy, low protein supplementation in stunted or wasted children after 12 months, Outcome 1 Weight (kg) at the end of the intervention.
Length or height (cm) at the end of the intervention
Three trials reported on this outcome (Jamaica 1991; Multicountry study 1996; Indonesia 2000). Pooled estimates based on the age of children (younger than 24 months), the nutritional status of children (stunted or wasted versus not stunted or wasted) and the duration of the intervention (supplementary feeding less than 12 months versus supplementary feeding equal or longer than12 months) were not statistically significant (MD 0.28; 95% CI ‐0.11 to 0.67) (Analysis 12.2; Analysis 13.2; Analysis 14.2). No heterogeneity was reported (Chi² = 6.70, df = 5 (P = 0.24); I² = 25%).
12.2. Analysis.
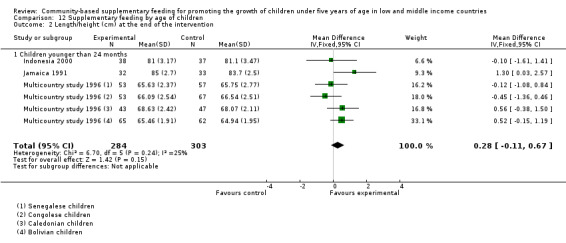
Comparison 12 Supplementary feeding by age of children, Outcome 2 Length/height (cm) at the end of the intervention.
13.2. Analysis.
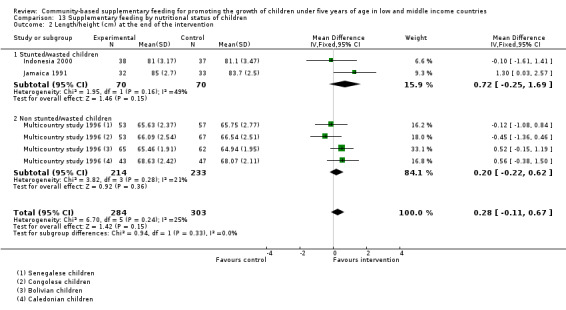
Comparison 13 Supplementary feeding by nutritional status of children, Outcome 2 Length/height (cm) at the end of the intervention.
14.2. Analysis.
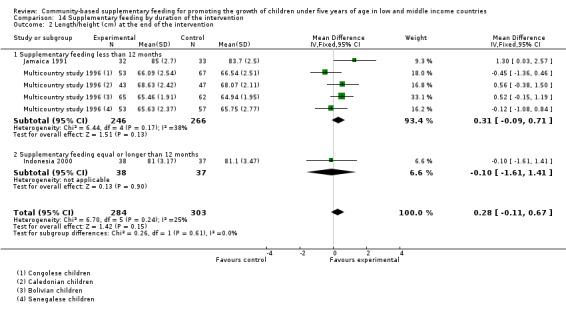
Comparison 14 Supplementary feeding by duration of the intervention, Outcome 2 Length/height (cm) at the end of the intervention.
Energy‐protein supplementation versus no supplementation in stunted children after 12 months (Jamaica 1991)
The mean difference between study groups was 1.3 cm (95% CI 0.03 to 2.57) (Analysis 1.2).
1.2. Analysis.
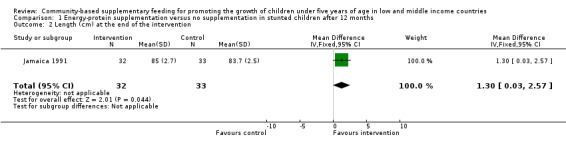
Comparison 1 Energy‐protein supplementation versus no supplementation in stunted children after 12 months, Outcome 2 Length (cm) at the end of the intervention.
Energy‐protein supplementation versus no supplementation in poor children after three months (Multicountry study 1996)
The mean difference between study groups was 0.52 cm (95% CI ‐0.15 to 1.19) in Bolivia (Analysis 7.2); 0.56 cm (95% CI ‐0.38 to 1.50) in New Caledonia (Analysis 8.2); ‐0.45 cm (95% CI ‐1.36 to 0.46) in Congo (Analysis 9.2); and ‐0.12 cm (95% CI ‐1.08 to 0.84) in Senegal (Analysis 10.2).
7.2. Analysis.
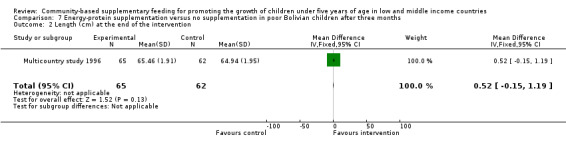
Comparison 7 Energy‐protein supplementation versus no supplementation in poor Bolivian children after three months, Outcome 2 Length (cm) at the end of the intervention.
8.2. Analysis.

Comparison 8 Energy‐protein supplementation versus no supplementation in poor Caledonian children after three months, Outcome 2 Length (cm) at the end of the intervention.
9.2. Analysis.
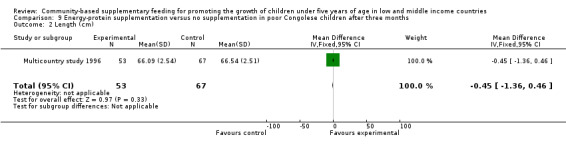
Comparison 9 Energy‐protein supplementation versus no supplementation in poor Congolese children after three months, Outcome 2 Length (cm).
10.2. Analysis.
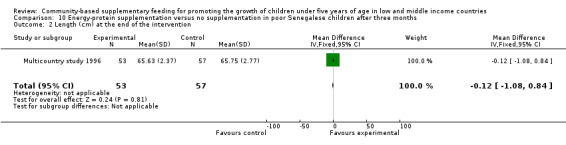
Comparison 10 Energy‐protein supplementation versus no supplementation in poor Senegalese children after three months, Outcome 2 Length (cm) at the end of the intervention.
High‐energy and protein supplementation versus low‐energy, low protein supplementation in stunted or wasted children after 12 months (Indonesia 2000)
The mean difference between study groups was ‐0.10 cm (95% CI ‐1.61 to 1.41) (Analysis 2.2).
2.2. Analysis.

Comparison 2 High energy and protein supplementation versus low‐energy, low protein supplementation in stunted or wasted children after 12 months, Outcome 2 Height/length (cm) at the end of the intervention.
Weight (kg) and length (cm) gain during the intervention
Two trials reported on this outcome (Multicountry study 1996; China 2005). Pooled estimates for weight gain based on the age of children (younger versus older than 24 months) and the duration of the intervention (supplementary feeding less than 12 months versus supplementary feeding equal or longer than 12 months) were not statistically significant (MD 0.04; 95% CI ‐0.03, 0.11) (Analysis 12.4). Conversely, a difference of effect was found for length gain during the intervention (MD 0.19; 95% CI 0.07, 0.31) (Analysis 14.4). The heterogeneity reported was not important (Chi² = 5.26, df = 4 (P = 0.26); I² = 24%).
12.4. Analysis.
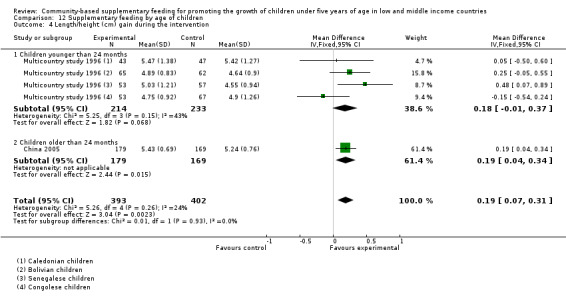
Comparison 12 Supplementary feeding by age of children, Outcome 4 Length/height (cm) gain during the intervention.
14.4. Analysis.
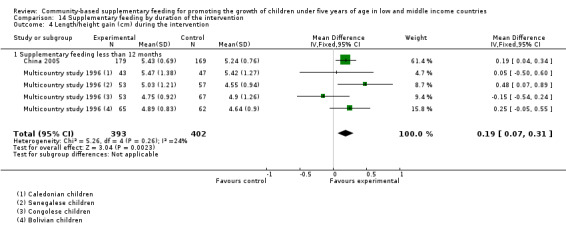
Comparison 14 Supplementary feeding by duration of the intervention, Outcome 4 Length/height gain (cm) during the intervention.
Yogurt supplementation versus no supplementation in nutritionally‐at‐risk children after nine months (China 2005)
The mean difference between study groups was 0.22 kg (95% CI 0.07 to 0.37) (Analysis 5.1) and 0.19 cm (95% CI 0.04 to 0.34) (Analysis 5.2).
5.1. Analysis.

Comparison 5 Yogurt supplementation versus no supplementation in nutritionally‐at‐risk children after nine months, Outcome 1 Weight gain (kg) during the intervention.
5.2. Analysis.

Comparison 5 Yogurt supplementation versus no supplementation in nutritionally‐at‐risk children after nine months, Outcome 2 Height gain (cm) during the intervention.
Energy‐protein supplementation versus no supplementation in poor children after three months (Multicountry study 1996)
The mean difference in weight gain between study groups was 0.05 kg (95% CI ‐0.07 to 0.17) in Bolivia (Analysis 7.3); ‐0.08 kg (95% CI ‐0.25 to 0.09) in New Caledonia (Analysis 8.3); ‐0.12 kg (95% CI ‐0.29 to 0.05) in Congo (Analysis 9.3); and 0.05 kg (95% CI ‐0.14 to 0.24) in Senegal (Analysis 10.3).
7.3. Analysis.
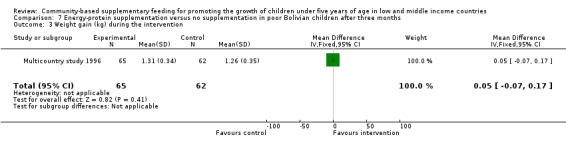
Comparison 7 Energy‐protein supplementation versus no supplementation in poor Bolivian children after three months, Outcome 3 Weight gain (kg) during the intervention.
8.3. Analysis.
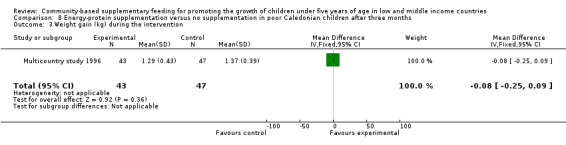
Comparison 8 Energy‐protein supplementation versus no supplementation in poor Caledonian children after three months, Outcome 3 Weight gain (kg) during the intervention.
9.3. Analysis.

Comparison 9 Energy‐protein supplementation versus no supplementation in poor Congolese children after three months, Outcome 3 Weight gain (kg).
10.3. Analysis.

Comparison 10 Energy‐protein supplementation versus no supplementation in poor Senegalese children after three months, Outcome 3 Weight gain (kg) during the intervention.
The mean difference in length gain between study groups was 0.25 cm (95% CI ‐0.05 to 0.55) in Bolivia (Analysis 7.4); 0.05 cm (95% CI ‐0.50 to 0.60) in New Caledonia (Analysis 8.4); ‐0.15 cm (95% CI ‐0.54 to 0.24) in Congo (Analysis 9.4); and 0.48 cm (95% CI 0.07 to 0.89) in Senegal (Analysis 10.4).
7.4. Analysis.

Comparison 7 Energy‐protein supplementation versus no supplementation in poor Bolivian children after three months, Outcome 4 Length gain (cm) during the intervention.
8.4. Analysis.
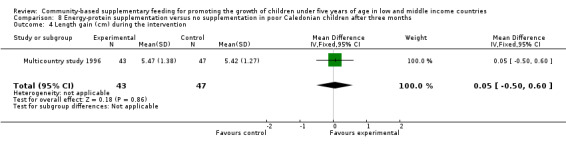
Comparison 8 Energy‐protein supplementation versus no supplementation in poor Caledonian children after three months, Outcome 4 Length gain (cm) during the intervention.
9.4. Analysis.
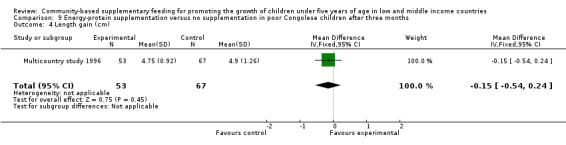
Comparison 9 Energy‐protein supplementation versus no supplementation in poor Congolese children after three months, Outcome 4 Length gain (cm).
10.4. Analysis.
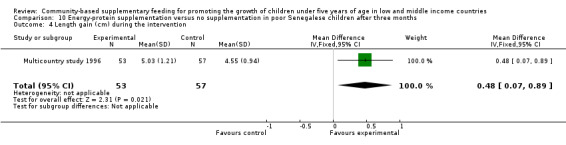
Comparison 10 Energy‐protein supplementation versus no supplementation in poor Senegalese children after three months, Outcome 4 Length gain (cm) during the intervention.
Weight‐for‐age z‐score at the end of the intervention
Two trials reported on this outcome (Brazil 2006; Brazil 2008). Pooled estimates based on the age of children (that is, six months to six years) and the duration of the intervention (supplementary feeding less than 12 months) were not statistically significant (MD ‐0.18; 95% CI ‐0.49 to 0.12) (Analysis 12.5; Analysis 14.5). No heterogeneity was reported (Chi² = 0.03, df = 1 (P = 0.86); I² = 0%).
12.5. Analysis.
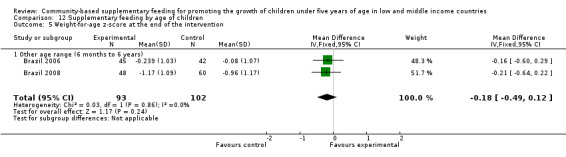
Comparison 12 Supplementary feeding by age of children, Outcome 5 Weight‐for‐age z‐score at the end of the intervention.
14.5. Analysis.

Comparison 14 Supplementary feeding by duration of the intervention, Outcome 5 Weight‐for‐age z‐score at the end of the intervention.
Multi‐mixture versus placebo in nutritionally‐at‐risk children after two months (Brazil 2006)
The mean difference between study groups was ‐0.16 (95% CI ‐0.60 to 0.29) (Analysis 6.1).
6.1. Analysis.

Comparison 6 Multi‐mixture versus placebo in nutritionally‐at‐risk children after two months, Outcome 1 Weight‐for‐age z‐score at the end of the intervention.
Multi‐mixture versus no supplementation in poor children after 10 months (Brazil 2008)
The mean difference between study groups was ‐0.21 (95% CI ‐0.64 to 0.22) (Analysis 4.1).
4.1. Analysis.
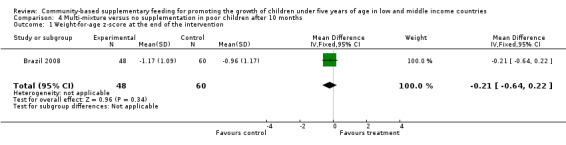
Comparison 4 Multi‐mixture versus no supplementation in poor children after 10 months, Outcome 1 Weight‐for‐age z‐score at the end of the intervention.
Height‐for‐age z‐score at the end of the intervention
Two trials reported on this outcome (Brazil 2006; Brazil 2008). Pooled estimates based on the age of children (that is, six months to six years) and the duration of the intervention (supplementary feeding less than 12 months) were not statistically significant (MD 0.02; 95% CI ‐0.29 to 0.32) (Analysis 12.6; Analysis 14.6). Reported heterogeneity was high (Chi² = 3.46, df = 1 (P = 0.06); I² = 71%).
12.6. Analysis.
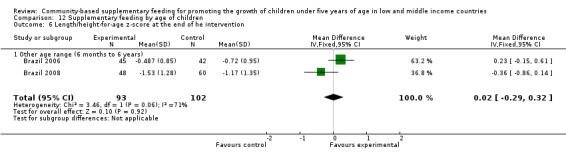
Comparison 12 Supplementary feeding by age of children, Outcome 6 Length/height‐for‐age z‐score at the end of he intervention.
14.6. Analysis.
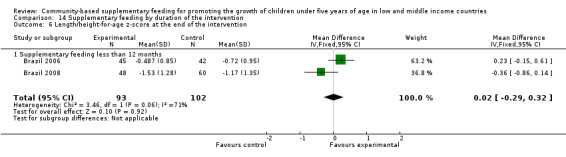
Comparison 14 Supplementary feeding by duration of the intervention, Outcome 6 Length/height‐for‐age z‐score at the end of the intervention.
Multi‐mixture versus placebo in nutritionally‐at‐risk children after two months (Brazil 2006)
The mean difference between study groups was 0.23 (95% CI ‐0.15 to 0.61) (Analysis 6.2).
6.2. Analysis.
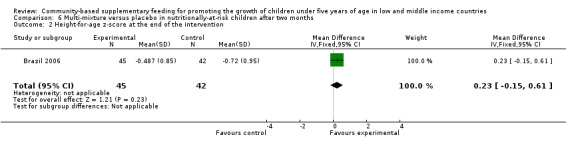
Comparison 6 Multi‐mixture versus placebo in nutritionally‐at‐risk children after two months, Outcome 2 Height‐for‐age z‐score at the end of the intervention.
Multi‐mixture versus no supplementation in poor children after 10 months (Brazil 2008)
The mean difference between study groups was ‐0.36 (95% CI ‐0.86 to 0.14) (Analysis 4.2).
4.2. Analysis.
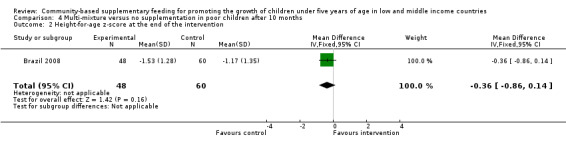
Comparison 4 Multi‐mixture versus no supplementation in poor children after 10 months, Outcome 2 Height‐for‐age z‐score at the end of the intervention.
Weight‐for‐length or height z‐score at the end of the intervention
Three trials reported on this outcome (Jamaica 1991; Brazil 2006; Brazil 2008). Pooled estimates based on the age of children (younger versus older than 24 months), the nutritional status of children (stunted or wasted versus not stunted or wasted), and the duration of the intervention (supplementary feeding less than 12 months) were not statistically significant (MD ‐0.10; 95% CI ‐0.33 to 0.13) (Analysis 12.7; Analysis 13.3; Analysis 14.7). No heterogeneity was reported (Chi² = 1.44, df = 2 (P = 0.49); I² = 0%).
12.7. Analysis.
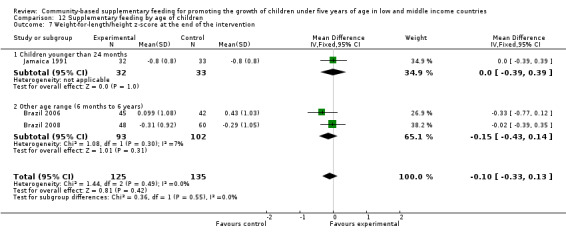
Comparison 12 Supplementary feeding by age of children, Outcome 7 Weight‐for‐length/height z‐score at the end of the intervention.
13.3. Analysis.
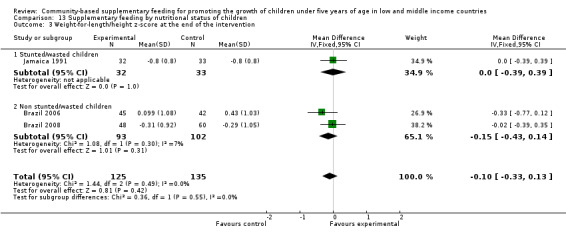
Comparison 13 Supplementary feeding by nutritional status of children, Outcome 3 Weight‐for‐length/height z‐score at the end of the intervention.
14.7. Analysis.
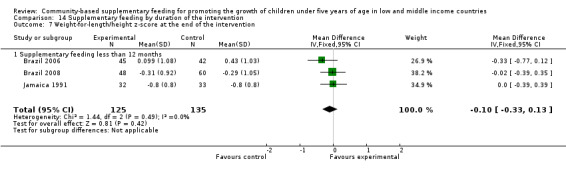
Comparison 14 Supplementary feeding by duration of the intervention, Outcome 7 Weight‐for‐length/height z‐score at the end of the intervention.
Energy‐protein supplementation versus no supplementation in stunted children after 12 months (Jamaica 1991)
There was no difference between study groups (MD 0.00; 95% CI ‐0.39 to 0.39) (Analysis 1.3).
1.3. Analysis.
Comparison 1 Energy‐protein supplementation versus no supplementation in stunted children after 12 months, Outcome 3 Weight‐for‐length z‐score at the end of the intervention.
Multi‐mixture versus placebo in nutritionally‐at‐risk children after two months (Brazil 2006)
The mean difference between study groups was ‐0.33 (95% CI ‐0.77 to 0.12) (Analysis 6.3).
6.3. Analysis.
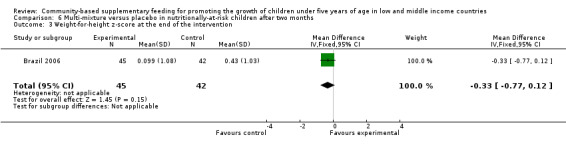
Comparison 6 Multi‐mixture versus placebo in nutritionally‐at‐risk children after two months, Outcome 3 Weight‐for‐height z‐score at the end of the intervention.
Multi‐mixture versus no supplementation in poor children after 10 months (Brazil 2008)
No difference between study groups was found in this study from Maceió (MD ‐0.02; 95% CI ‐0.39 to 0.35) (Analysis 4.3).
4.3. Analysis.
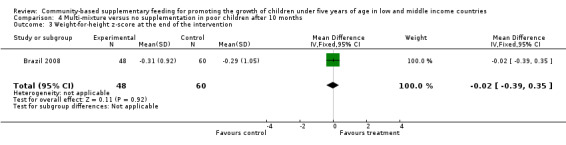
Comparison 4 Multi‐mixture versus no supplementation in poor children after 10 months, Outcome 3 Weight‐for‐height z‐score at the end of the intervention.
Change in weight‐for‐age and height‐for‐age z‐scores during the intervention
Yogurt supplementation versus no supplementation in nutritionally‐at‐risk children after nine months (China 2005)
Only one study from China reported on these outcomes. A statistically significant change between study groups was found both for the weight‐for‐age z‐score (MD 0.12; 95% CI 0.05 to 0.19) (Analysis 5.4) and the height‐for‐age z‐score (MD 0.05; 95% CI 0.01 to 0.08) (Analysis 5.5).
5.4. Analysis.
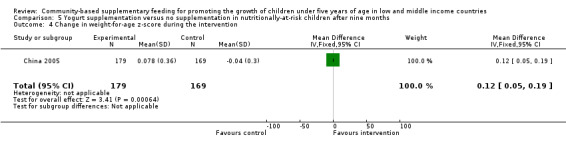
Comparison 5 Yogurt supplementation versus no supplementation in nutritionally‐at‐risk children after nine months, Outcome 4 Change in weight‐for‐age z‐score during the intervention.
5.5. Analysis.
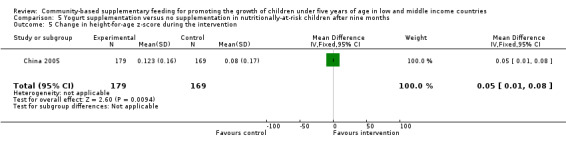
Comparison 5 Yogurt supplementation versus no supplementation in nutritionally‐at‐risk children after nine months, Outcome 5 Change in height‐for‐age z‐score during the intervention.
Secondary outcomes
No pooled estimates were calculated for secondary outcomes.
Head and arm circumferences (cm) at the end of the intervention
Energy‐protein supplementation versus no supplementation in stunted children after 12 months (Jamaica 1991)
Mean differences in head and arm circumferences between study groups were reported as 0.40 cm (95% CI ‐0.21 to 1.01) (Analysis 1.4) and 0.20 cm (95% CI ‐0.29 to 0.69) (Analysis 1.5), respectively.
1.4. Analysis.
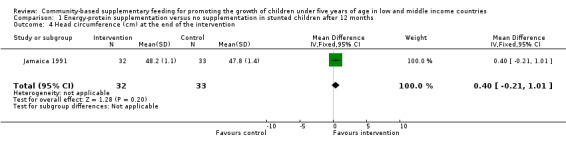
Comparison 1 Energy‐protein supplementation versus no supplementation in stunted children after 12 months, Outcome 4 Head circumference (cm) at the end of the intervention.
1.5. Analysis.
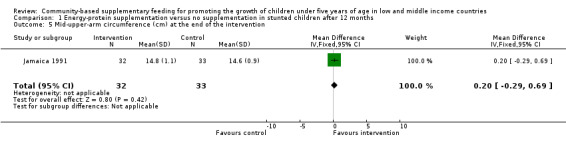
Comparison 1 Energy‐protein supplementation versus no supplementation in stunted children after 12 months, Outcome 5 Mid‐upper‐arm circumference (cm) at the end of the intervention.
High energy and protein supplementation versus low‐energy, low protein supplementation in stunted or wasted children after 12 months (Indonesia 2000)
Mean differences in head and arm circumferences between study groups were reported as 0.19 cm (MD 0.19; 95% CI ‐0.41 to 0.79) (Analysis 2.3) and 0.10 cm (95% CI ‐0.22 to 0.42) (Analysis 2.4), respectively.
2.3. Analysis.
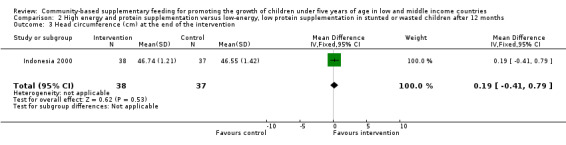
Comparison 2 High energy and protein supplementation versus low‐energy, low protein supplementation in stunted or wasted children after 12 months, Outcome 3 Head circumference (cm) at the end of the intervention.
2.4. Analysis.
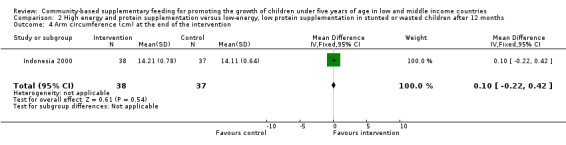
Comparison 2 High energy and protein supplementation versus low‐energy, low protein supplementation in stunted or wasted children after 12 months, Outcome 4 Arm circumference (cm) at the end of the intervention.
Yogurt supplementation versus no supplementation in nutritionally‐at‐risk children after nine months (China 2005)
No difference between study groups was reported for the arm circumference measurement (MD ‐0.08; 95% CI ‐0.31 to 0.15) (Analysis 5.3).
5.3. Analysis.
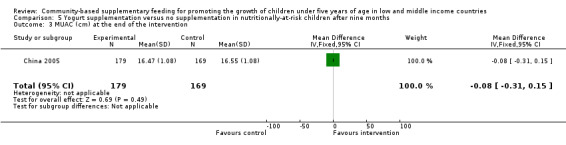
Comparison 5 Yogurt supplementation versus no supplementation in nutritionally‐at‐risk children after nine months, Outcome 3 MUAC (cm) at the end of the intervention.
Triceps and subscapular thickness (mm) at the end of the intervention
Energy‐protein supplementation versus no supplementation in stunted children after 12 months (Jamaica 1991)
The mean difference between study groups for the tricipital and subscapular skinfold thickness were 0.20 mm (95% CI ‐0.51 to 0.91) (Analysis 1.6) and 0.20 mm (95% CI ‐0.34 to 0.74) (Analysis 1.7), respectively.
1.6. Analysis.
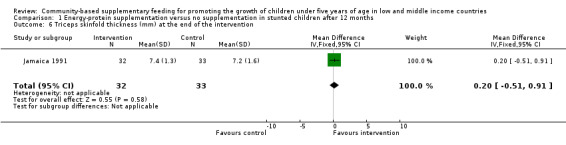
Comparison 1 Energy‐protein supplementation versus no supplementation in stunted children after 12 months, Outcome 6 Triceps skinfold thickness (mm) at the end of the intervention.
1.7. Analysis.

Comparison 1 Energy‐protein supplementation versus no supplementation in stunted children after 12 months, Outcome 7 Subscapular skinfold thickness (mm) at the end of the intervention.
Adverse effects
Multi‐mixture versus no supplementation in poor children after 10 months (Brazil 2008)
Only the study from Maceió reported on diarrhoea (odds ratio (OR) 1.04; 95% CI 0.67 to 1.62) and vomiting (OR 0.89; 95% CI 0.38 to 2.10).
Discussion
Undernutrition in young children is a major public health problem in low‐ and middle‐income countries (de Onis 2011). In an attempt to address this problem, supplementary feeding is commonly implemented. Supplementary feeding is thought to be beneficial by optimising the nutritional value of the diet and improving the general health of disadvantaged families.
In this context, it is essential to know the evidence in favour of supplementary feeding as a beneficial intervention for promoting the growth of young children. How to approach the assessment of the quality of the evidence starts by considering the study design. Randomised controlled trials (RCTs) provide high quality evidence for evaluating the effects of healthcare interventions (Chalmers 1983; Villar 1996) because the possibility of systematic errors (bias) is minimised. It is expected that the only relevant variable that distinguishes the experimental and the control groups in a RCT is the intervention exposure. However, the quality of the evidence from a RCT will be lower if there are problems related to the study design and execution, inconsistency and imprecision of results, and reporting bias.
Summary of main results
In all, eight RCTs met the inclusion criteria for this review, with three of them conducted in Brazil and China during the last seven years. Decisions about which studies are similar enough for their results to be grouped together require an understanding of the problem that the review addresses and the authors' clinical judgment. For the present version of the review, it was agreed to calculate a summary (pooled) effect estimate of studies reporting on the same growth outcome. However, numerical results were combined according to prespecified characteristics such as the age of the children (younger or older than 24 months), the nutritional status at baseline (stunting or wasting, or not) and the duration of the intervention (less or more than 12 months). In general, supplementary feeding appeared to have a negligible impact on child growth, but pooled results should be interpreted with caution because the studies are clinically diverse (see Table 9).
Overall completeness and applicability of evidence
In low‐ and middle‐income countries, the problems supplementary feeding aims to address are entwined with poverty and deprivation. Drinking of unsafe water and lack of access to effective sanitation contribute greatly to the slow progress being made in child morbidity and mortality rates, particularly in some poor countries. In this scenario, child undernutrition cannot be overcome by simply resorting to supplementary feeding interventions. Appropriate drinking and sanitary facilities should be seen as necessary conditions for the effective impact of supplementary feeding. Other relevant contextual factors include availability of basic health services and medical care, nutritional education and parental knowledge and care (WHO 1999).
Therefore, the findings of an RCT evaluating the effects of community‐based supplementary feeding on child growth in one country cannot always be generalised or extrapolated to other settings (that is, they may not have external validity).
Quality of the evidence
In general, the trials included in this review are at relatively high risk of bias (see also the 'Risk of bias' summary in Figure 3 and 'Risk of bias' graph in Figure 4). Authors should, as a minimum, explicitly describe their approaches to random sequence generation, allocation concealment, blinding and handling of exclusions after allocation to interventions.
Adequate sample sizes are essential to ensure that the study has a good chance of detecting a statistically significant result. To say that there is a significant statistically difference between one group and another means that there is likely to be a genuine difference between the groups. However, the term 'statistically significant' should not be confused with clinical significance. In other words, the number of children should be sufficient to detect an effect on child growth that is of clinical importance.
Difficulties with blinding in the delivery of supplemental food may affect outcome assessments as well. There is a possibility that the field workers behave differently towards the participants in the intervention and control groups. For instance, outcome assessors might give greater encouragement to the mothers to attend the feeding centre in the intervention group and this, in turn, may affect participation.
In order to have an impact on linear growth in young children, another key factor is the duration of the supplementation. In this regard, supplementary feeding was provided for a very short period in some of the included trials (Indonesia 1991; Brazil 2006; Multicountry study 1996).
Potential biases in the review process
Based on the objectives of the review, a comprehensive search strategy was developed and a large body of the published literature was reviewed and scrutinised. However, handsearching of key journals was not undertaken and no specific databases for official reports from international institutions or aid agencies, nor grey literature websites, were explored for this update. A potential publication bias should be taken into account when interpreting the review findings as this omission could potentially either lead to an underestimate or overestimate of the effects of supplementary feeding on growth in young children.
We would also like to highlight that the only implemented strategy to deal with missing outcome data was to write to the principal investigators of included studies asking for missing information when their contact details were provided.
Agreements and disagreements with other studies or reviews
Several reviews about supplementary feeding in young children have been published (Beaton 1982; Caulfield 1999; WHO 1999; Dewey 2008). Two of these reviews (Beaton 1982; WHO 1999) focused on the importance of the planning and implementation process as key factors to programme effectiveness and sustainability beyond the specific content and type of supplementary feeding intervention.
The review published by Caulfield 1999 described scientific papers and programme projects documents about supplementary feeding in children aged six to 12 months in developing countries to estimate improvement on child malnutrition and survival. The review concluded that the magnitude of improvement on growth rates ranged from 0.10 to 0.50 standard deviations of the NCHS international reference. However, no details on search strategies, inclusion and exclusion criteria, number of studies found and considered, and quality of trials were reported.
The systematic review conducted by Dewey 2008 included studies from low‐ and middle‐income countries that assessed the effects of any relevant intervention on growth, morbidity and child development in children aged six to 24 months. The impact of these interventions (micronutrient fortification, provision of complementary food, nutrition education etc) on child growth was mixed and modest. One non‐RCT reported no benefits after milk supplementation.
It is arguable whether including other study designs would have changed the review conclusions. One of the main reasons for including only RCTs is that randomisation (if performed properly) is a well known method to minimise selection bias, as assignment of children to study groups is purely by the play of chance (Pocock 1990). In the case of supplementary feeding interventions, the way in which non‐randomised controlled trials are done resembles that of cohort studies. Children receiving the intervention are the exposed group and the no intervention or placebo group are the unexposed group. Both exposed and unexposed groups are followed forward in time to determine the frequency of the outcomes of interest. If the exposed children show a lower incidence of undernutrition or show better anthropometric outcomes, then supplementary feeding can be associated with a beneficial effect. However, selection bias can occur. Selection bias results from the different manner in which families enter into the study groups. For example, low socioeconomic and educational maternal backgrounds in the experimental group compared to controls may influence maternal attitude and understanding. Likewise, rates of child participation and food family sharing may not be comparable if the control group is drawn from a more privileged population. In other words, selection bias may lead to an unequal distribution of possible confounding variables (both known and unknown) with a subsequent distortion in the estimate of treatment effect.
Supplementary feeding (SF) is an intervention to be implemented in real life settings where contextual factors are present. Within this perspective, an important reason for considering community‐based trials conducted under highly supervised circumstances is to have high coverage of the intervention. In the case of RCTs evaluating supplementary feeding versus placebo (that is, low protein, low calorie food), the factors that may potentially interfere with the intake of supplemental foods for young children, such as sharing with other family members and substitution of foods that would otherwise have been consumed, are expected to be balanced across study groups. Therefore, it is unlikely that the lack of anthropometric change or difference from a control population could be explained by the low level of food supplementation.
Authors' conclusions
Implications for practice.
Based on the evidence reviewed, clinicians and public health policy makers should not place undue expectations on the effectiveness of supplementary feeding for promoting the growth of children under five years of age living in low and middle income countries.
Whereas well conducted research is essential for the optimal allocation of resources and scaling up of public healthcare interventions, poor families and children cannot wait for future trials. They must have access both to adequate amounts of nutritious food and appropriate health care and sanitation.
Implications for research.
Recommendations for research were made when the review was first published in 2005, suggesting that new well‐conducted trials were needed. Issues of research design such as sample size calculation to detect a meaningful clinical impact and blinding were identified as critical aspects of studies evaluating the effectiveness of supplementary feeding.
Main flaws in the methodological quality of the included studies are summarised as follows:
inadequate sample sizes;
poor quality of reporting, including the method of randomisation, concealment allocation of treatments, and rates of and reasons for losses to follow‐up;
lack of adequate blinding of outcome assessors;
inconsistency of anthropometric outcome measurements.
Overall, further studies in this area would need to do the following.
Develop and implement appropriate measures to prevent or minimise the selection bias when allocating participants to groups. Experimental studies using random allocation of participants (with concealed allocation sequence) produce comparison groups that are expected to be balanced.
Calculate the sample size to detect a meaningful magnitude of effects.
Identify and define relevant outcomes according to the main objectives of the investigation. These include anthropometric variables and could explore other potential benefits of supplementary feeding, such as the impact on morbidity and child development.
Define the proportion (%) of current recommended dietary allowances or total of kcal per day or ration provided by the supplementary food (net increases of daily total energy and protein intake, including energy intake form breastmilk), or both, and the minimal duration of supplementary feeding to detect meaningful changes in linear growth, that is, 12 to 18 months.
Guarantee the blinding of outcome assessors to group allocation for preventing both performance and measurement bias.
Describe the standardisation of procedures and calibration of anthropometric equipment.
Prevent attrition bias by ensuring adequate follow‐up of participants and using intention‐to‐treat analysis.
Provide complete information (numbers and reasons) for withdrawals.
Describe and report possible side effects (even when no statistical differences were found among study groups).
Randomisation of nutritional interventions among families in need may raise ethical concerns. A complete revision of the study protocols centred on ethical aspects of research is mandatory.
What's new
| Date | Event | Description |
|---|---|---|
| 15 August 2011 | New citation required but conclusions have not changed | Four new trials included. Conclusions unchanged. |
| 31 January 2011 | New search has been performed | Literature searches updated in January 2011. Contact details updated. New review author added. Title modified. |
History
Protocol first published: Issue 4, 2004 Review first published: Issue 4, 2005
| Date | Event | Description |
|---|---|---|
| 17 February 2010 | Amended | Contact details updated |
| 23 June 2008 | Amended | Converted to new review format. |
| 4 July 2005 | Amended | A change in the title was made by the review authors following discussion. It was felt that 'programmes' should be deleted to make it clear that the effects of the nutritional intervention was to be assessed independently of other interventions. |
| 3 July 2005 | New citation required and conclusions have changed | Substantive amendment. |
Acknowledgements
We thank the Department of Nutrition of the World Health Organization, the National Ministry of Health and Environment of Argentina and the Aubrey Sheiham Scholarship in Public Health Promotion and Primary Care for financial support to assist the completion of the first version of the systematic review published in 2005. We would also like to thank the Cochrane Developmental, Psychosocial and Learning Problems Group (CDPLPG) for valuable advice and assistance and Shailen Nandy from the University of Bristol, UK, for his comments on the background section of the review protocol. We acknowledge Dr Edgardo Abalos, subdirector of Centro Rosarino de Estudios Perinatales (CREP), Argentina, and Esther Coren from the Social Care Institute for Excellence, UK, for their contributions to draft versions of the first version of the review. We are also grateful to Dr Reynaldo Martorell for his help in clarifying details of the Guatemalan study. We appreciate very much the data provided by Dr Tom Aitchison regarding the Indonesian study published in 2000.
We are especilly grateful to Professor Geraldine Macdonald, Director of the Institute of Child Care Research, Belfast, for her valid inputs and recommendations for the updating process; to Margaret Anderson, Trials Search Coordinator of the CDPLPG, who co‐ordinated the literature search for this update, and to Laura MacDonald, Managing Editor of the CDPLPG, for her wholehearted support.
We are thankful to Maria Isern for the translation of Portuguese articles into English and to Cristina Cuesta, Senior Statistician of CREP, for her expert advice.
Appendices
Appendix 1. MEDLINE search strategy
Ovid MEDLINE(R) 1948 to January Week 3 2011
1 exp GROWTH/
2 Anthropometry/
3 (grow$ or anthropometr$ or weigh$ or height or length).tw.
4 Body Weight/
5 Body Height/
6 Body Composition/
7 Body Size/
8 Weight Gain/
9 or/1‐8
10 ((supplement$ or extra) adj5 (food or feed$ or diet$ or nutrition$)).tw.
11 Infant Nutritional Physiological Phenomena/
12 Child Nutritional Physiological Phenomena/
13 Growth Disorders/dh
14 Child Nutrition Disorders/dh
15 Infant Nutrition Disorders/dh
16 Malnutrition/dh
17 Diet Therapy/
18 Nutrition Therapy/
19 or/10‐18
20 exp Child/
21 exp Infant/
22 (child$ or infan$ or baby or babies or preschool$ or preschool$).tw.
23 or/20‐22
24 randomized controlled trial.pt.
25 controlled clinical trial.pt.
26 randomi#ed.ab.
27 placebo$.ab.
28 drug therapy.fs.
29 randomly.ab.
30 trial.ab.
31 groups.ab.
32 or/24‐31
33 exp animals/ not humans.sh.
34 32 not 33
35 9 and 19 and 23 and 34
Appendix 2. EMBASE search strategy
EMBASE <1980 to 2011 Week 04>
1 exp growth/
2 body weight/
3 body height/
4 anthropometry/
5 (grow$ or anthropometr$ or weigh$ or height or length).tw.
6 body size/
7 body composition/
8 weight gain/
9 or/1‐8
10 ((supplement$ or extra) adj5 (food or feed$ or diet$ or nutrition$)).tw. (37469)
11 growth disorder/th
12 nutritional disorder/th
13 nutritional deficiency/th
14 malnutrition/th
15 diet therapy/
16 diet supplementation/
17 infant nutrition/
18 child nutrition/
19 or/10‐18
20 Child/
21 Infant/
22 (child$ or infan$ or baby or babies or preschool$ or preschool$).tw.
23 or/20‐22
24 Clinical trial/
25 Randomized controlled trial/
26 randomisation/
27 Single blind procedure/
28 Double blind procedure/
29 Crossover procedure/
30 Placebo/
31 Randomi#ed.tw.
32 RCT.tw.
33 (random$ adj3 (allocat$ or assign$)).tw.
34 randomly.ab.
35 groups.ab.
36 trial.ab.
37 ((singl$ or doubl$ or trebl$ or tripl$) adj3 (blind$ or mask$)).tw.
38 Placebo$.tw.
39 Prospective study/
40 (crossover or cross‐over).tw.
41 prospective.tw.
42 or/24‐41
43 9 and 19 and 23 and 42
Appendix 3. CINAHL search strategy
S36 S9 and S18 and S21 and S35
S35 S22 or S23 or S24 or S25 or S26 or S27 or S28 or S29 or S30 or S31 or S32 or S33 or S34
S34 "cross over*"
S33 crossover*
S32 (MH "Crossover Design")
S31 (tripl* N3 mask*) or (tripl* N3 blind*)
S30 (trebl* N3 mask*) or (trebl* N3 blind*)
S29 (doubl* N3 mask*) or (doubl* N3 blind*)
S28 (singl* N3 mask*) or (singl* N3 blind*)
S27 (clinic* N3 trial*) or (control* N3 trial*)
S26 (random* N3 allocat* ) or (random* N3 assign*)
S25 randomis* or randomiz*
S24 (MH "Meta Analysis")
S23 (MH "Clinical Trials+")
S22 MH random assignment
S21 S19 or S20
S20 (TI (child* or infan* or baby or babies or preschool* or preschool*) or AB (child* or infan* or baby or babies or preschool* or preschool*))
S19 (MH "Child+")
S18 S10 or S11 or S12 or S13 or S14 or S15 or S16 or S17
S17 (MH "Malnutrition/DH")
S16 TI ((extra N5 food) or (extra N5 feed*) or (extra N5 diet*) or (extra N5 nutrition*)) or AB((extra N5 food) or (extra N5 feed*) or (extra N5 diet*) or (extra N5 nutrition*))
S15 TI ((supplement* N5 food) or (supplement* N5 feed*) or (supplement* N5 diet*) or (supplement* N5 nutrition*)) or
AB((supplement* N5 food) or (supplement* N5 feed*) or (supplement* N5 diet*) or (supplement* N5 nutrition*))
S14 (MH "Growth Disorders/DH")
S13 (MH "Diet Therapy")
S12 (MH "Infant Nutrition Disorders/DH")
S11 (MH "Child Nutrition Disorders/DH")
S10 (MH "Infant Nutritional Physiology") OR (MH "Child Nutritional Physiology")
S9 S1 or S2 or S3 or S4 or S5 or S6 or S7 or S8
S8 (MH "Body Size")
S7 (MH "Weight Gain")
S6 (MH "Body Composition")
S5 (MH "Body weight")
S3 (MH "Anthropometry")
S2 TI (grow* or anthropometr* or weigh* or height or length) or AB(grow* or anthropometr* or weigh* or height or length)
S1 (MH "Growth+")
Appendix 4. CENTRAL 2011 search database
CENTRAL 2011 (Issue 1) searched using The Cochrane Library January 2011 (on DVD), Wiley‐Blackwell, 2011
#1 MeSH descriptor growth explode all trees
#2 MeSH descriptor Anthropometry this term only
#3 MeSH descriptor Body Weight this term only
#4 MeSH descriptor Body Height this term only
#5 MeSH descriptor Body Composition this term only
#6 MeSH descriptor Body Size this term only
#7 MeSH descriptor Weight Gain this term only
#8 (grow* in All Text or anthropometr* in All Text or weigh* in All Text or height in All Text or length in All Text)
#9 (#1 or #2 or #3 or #4 or #5 or #6 or #7 or #8)
#10 MeSH descriptor Infant Nutritional Physiological Phenomena this term only
#11 MeSH descriptor Child Nutritional Physiological Phenomena this term only
#12 MeSH descriptor Growth Disorders this term only
#13 MeSH descriptor Child Nutrition Disorders this term only
#14 MeSH descriptor Malnutrition this term only
#15 MeSH descriptor Diet Therapy this term only
#16 MeSH descriptor Nutrition Therapy this term only
#17 MeSH descriptor infant nutrition disorders this term only
#18 ( (supplement* in All Text near/6 food in All Text) or (supplement* in All Text near/6 feed* in All Text) or (supplement* in All Text near/6 diet* in All Text) or (supplement* in All Text near/6 nutrition* in All Text) )
#19 ( (extra* in All Text near/6 food in All Text) or (extra* in All Text near/6 feed* in All Text) or (extra* in All Text near/6 diet* in All Text) or (extra* in All Text near/6 nutrition* in All Text) )
#20 (#10 or #11 or #12 or #13 or #14 or #15 or #16 or #17 or #18 or #19)
#21 (child* in All Text or infan* in All Text or baby in All Text or babies in All Text or preschool* in All Text or preschool* in All Text)
#22 MeSH descriptor child explode all trees
#23 MeSH descriptor infant explode all trees
#24 (child* or infan* in Title, Abstract or Keywords or baby in Title, Abstract or Keywords or babies in Title, Abstract or Keywords or preschool* in Title, Abstract or Keywords or preschool* in Title, Abstract or Keywords)
#25 (#22 or #23 or #24)
#26 (#9 and #20 and #25)
#27 (#9 and #20 and #25) from 2005 to 2011
Appendix 5. LILACS search strategy
(child$ or infan$ or baby or babies or preschool$ or preschool$) AND (food or feed$ or diet$ or nutrition) AND (supplement$ or extra) [Words] and ((Pt randomized controlled trial OR Pt controlled clinical trial OR Mh randomized controlled trials OR Mh random allocation OR Mh double‐blind method OR Mh single‐blind method) AND NOT (Ct animal AND NOT (Ct human and Ct animal)) OR (Pt clinical trial OR Ex E05.318.760.535$ OR (Tw clin$ AND (Tw trial$ OR Tw ensa$ OR Tw estud$ OR Tw experim$ OR Tw investiga$)) OR ((Tw singl$ OR Tw simple$ OR Tw doubl$ OR Tw doble$ OR Tw duplo$ OR Tw trebl$ OR Tw trip$) AND (Tw blind$ OR Tw cego$ OR Tw ciego$ OR Tw mask$ OR Tw mascar$)) OR Mh placebos OR Tw placebo$ OR (Tw random$ OR Tw randon$ OR Tw casual$ OR Tw acaso$ OR Tw azar OR Tw aleator$) OR Mh research design) AND NOT (Ct animal AND NOT (Ct human and Ct animal)) OR (Ct comparative study OR Ex E05.337$ OR Mh follow‐up studies OR Mh prospective studies OR Tw control$ OR Tw prospectiv$ OR Tw volunt$ OR Tw volunteer$) AND NOT (Ct animal AND NOT (Ct human and Ct animal))) [Words] and "2005" or "2006" or "2007" or "2008" or "2009" or "2010" or "2011" [Country, year publication]
Appendix 6. World Cat search strategy
OCLC WorldCat
Search limited to theses/dissertation subtype
(supplement* or extra) and (feed* or food or diet* or nutrition) and (child or children or infant* or babies or baby)
Appendix 7. ControlledTrials.gov search strategy
Search terms: supplement* AND feed*
Filtered by Child and Intervention studies
Data and analyses
Comparison 1. Energy‐protein supplementation versus no supplementation in stunted children after 12 months.
| Outcome or subgroup title | No. of studies | No. of participants | Statistical method | Effect size |
|---|---|---|---|---|
| 1 Weight (kg) at the end of the intervention | 1 | 65 | Mean Difference (IV, Fixed, 95% CI) | 0.29 [‐0.29, 0.87] |
| 2 Length (cm) at the end of the intervention | 1 | 65 | Mean Difference (IV, Fixed, 95% CI) | 1.30 [0.03, 2.57] |
| 3 Weight‐for‐length z‐score at the end of the intervention | 1 | 65 | Mean Difference (IV, Fixed, 95% CI) | 0.0 [‐0.39, 0.39] |
| 4 Head circumference (cm) at the end of the intervention | 1 | 65 | Mean Difference (IV, Fixed, 95% CI) | 0.40 [‐0.21, 1.01] |
| 5 Mid‐upper‐arm circumference (cm) at the end of the intervention | 1 | 65 | Mean Difference (IV, Fixed, 95% CI) | 0.20 [‐0.29, 0.69] |
| 6 Triceps skinfold thickness (mm) at the end of the intervention | 1 | 65 | Mean Difference (IV, Fixed, 95% CI) | 0.20 [‐0.51, 0.91] |
| 7 Subscapular skinfold thickness (mm) at the end of the intervention | 1 | 65 | Mean Difference (IV, Fixed, 95% CI) | 0.20 [‐0.34, 0.74] |
Comparison 2. High energy and protein supplementation versus low‐energy, low protein supplementation in stunted or wasted children after 12 months.
| Outcome or subgroup title | No. of studies | No. of participants | Statistical method | Effect size |
|---|---|---|---|---|
| 1 Weight (kg) at the end of the intervention | 1 | 75 | Mean Difference (IV, Fixed, 95% CI) | 0.16 [‐0.27, 0.59] |
| 2 Height/length (cm) at the end of the intervention | 1 | 75 | Mean Difference (IV, Fixed, 95% CI) | ‐0.10 [‐1.61, 1.41] |
| 3 Head circumference (cm) at the end of the intervention | 1 | 75 | Mean Difference (IV, Fixed, 95% CI) | 0.19 [‐0.41, 0.79] |
| 4 Arm circumference (cm) at the end of the intervention | 1 | 75 | Mean Difference (IV, Fixed, 95% CI) | 0.10 [‐0.22, 0.42] |
Comparison 3. Energy‐protein supplementation versus no supplementation in poor children after three months.
| Outcome or subgroup title | No. of studies | No. of participants | Statistical method | Effect size |
|---|---|---|---|---|
| 1 Weight z‐scores at the end of the intervention | 1 | 113 | Mean Difference (IV, Fixed, 95% CI) | 0.19 [‐0.18, 0.56] |
| 2 Height z‐scores at the end of the intervention | 1 | 113 | Mean Difference (IV, Fixed, 95% CI) | 0.12 [‐0.31, 0.55] |
Comparison 4. Multi‐mixture versus no supplementation in poor children after 10 months.
| Outcome or subgroup title | No. of studies | No. of participants | Statistical method | Effect size |
|---|---|---|---|---|
| 1 Weight‐for‐age z‐score at the end of the intervention | 1 | 108 | Mean Difference (IV, Fixed, 95% CI) | ‐0.21 [‐0.64, 0.22] |
| 2 Height‐for‐age z‐score at the end of the intervention | 1 | 108 | Mean Difference (IV, Fixed, 95% CI) | ‐0.36 [‐0.86, 0.14] |
| 3 Weight‐for‐height z‐score at the end of the intervention | 1 | 108 | Mean Difference (IV, Fixed, 95% CI) | ‐0.02 [‐0.39, 0.35] |
Comparison 5. Yogurt supplementation versus no supplementation in nutritionally‐at‐risk children after nine months.
| Outcome or subgroup title | No. of studies | No. of participants | Statistical method | Effect size |
|---|---|---|---|---|
| 1 Weight gain (kg) during the intervention | 1 | 348 | Mean Difference (IV, Fixed, 95% CI) | 0.22 [0.07, 0.37] |
| 2 Height gain (cm) during the intervention | 1 | 348 | Mean Difference (IV, Fixed, 95% CI) | 0.19 [0.04, 0.34] |
| 3 MUAC (cm) at the end of the intervention | 1 | 348 | Mean Difference (IV, Fixed, 95% CI) | ‐0.08 [‐0.31, 0.15] |
| 4 Change in weight‐for‐age z‐score during the intervention | 1 | 348 | Mean Difference (IV, Fixed, 95% CI) | 0.12 [0.05, 0.19] |
| 5 Change in height‐for‐age z‐score during the intervention | 1 | 348 | Mean Difference (IV, Fixed, 95% CI) | 0.05 [0.01, 0.08] |
Comparison 6. Multi‐mixture versus placebo in nutritionally‐at‐risk children after two months.
| Outcome or subgroup title | No. of studies | No. of participants | Statistical method | Effect size |
|---|---|---|---|---|
| 1 Weight‐for‐age z‐score at the end of the intervention | 1 | 87 | Mean Difference (IV, Fixed, 95% CI) | ‐0.16 [‐0.60, 0.29] |
| 2 Height‐for‐age z‐score at the end of the intervention | 1 | 87 | Mean Difference (IV, Fixed, 95% CI) | 0.23 [‐0.15, 0.61] |
| 3 Weight‐for‐height z‐score at the end of the intervention | 1 | 87 | Mean Difference (IV, Fixed, 95% CI) | ‐0.33 [‐0.77, 0.12] |
Comparison 7. Energy‐protein supplementation versus no supplementation in poor Bolivian children after three months.
| Outcome or subgroup title | No. of studies | No. of participants | Statistical method | Effect size |
|---|---|---|---|---|
| 1 Weight (kg) at the end of the intervention | 1 | 127 | Mean Difference (IV, Fixed, 95% CI) | ‐0.03 [‐0.29, 0.23] |
| 2 Length (cm) at the end of the intervention | 1 | 127 | Mean Difference (IV, Fixed, 95% CI) | 0.52 [‐0.15, 1.19] |
| 3 Weight gain (kg) during the intervention | 1 | 127 | Mean Difference (IV, Fixed, 95% CI) | 0.05 [‐0.07, 0.17] |
| 4 Length gain (cm) during the intervention | 1 | 127 | Mean Difference (IV, Fixed, 95% CI) | 0.25 [‐0.05, 0.55] |
Comparison 8. Energy‐protein supplementation versus no supplementation in poor Caledonian children after three months.
| Outcome or subgroup title | No. of studies | No. of participants | Statistical method | Effect size |
|---|---|---|---|---|
| 1 Weight (kg) at the end of the intervention | 1 | 90 | Mean Difference (IV, Fixed, 95% CI) | ‐0.01 [‐0.41, 0.39] |
| 2 Length (cm) at the end of the intervention | 1 | 90 | Mean Difference (IV, Fixed, 95% CI) | 0.56 [‐0.38, 1.50] |
| 3 Weight gain (kg) during the intervention | 1 | 90 | Mean Difference (IV, Fixed, 95% CI) | ‐0.08 [‐0.25, 0.09] |
| 4 Length gain (cm) during the intervention | 1 | 90 | Mean Difference (IV, Fixed, 95% CI) | 0.05 [‐0.50, 0.60] |
Comparison 9. Energy‐protein supplementation versus no supplementation in poor Congolese children after three months.
| Outcome or subgroup title | No. of studies | No. of participants | Statistical method | Effect size |
|---|---|---|---|---|
| 1 Weight (kg) | 1 | 120 | Mean Difference (IV, Fixed, 95% CI) | ‐0.37 [‐0.73, ‐0.01] |
| 2 Length (cm) | 1 | 120 | Mean Difference (IV, Fixed, 95% CI) | ‐0.45 [‐1.36, 0.46] |
| 3 Weight gain (kg) | 1 | 120 | Mean Difference (IV, Fixed, 95% CI) | ‐0.12 [‐0.29, 0.05] |
| 4 Length gain (cm) | 1 | 120 | Mean Difference (IV, Fixed, 95% CI) | ‐0.15 [‐0.54, 0.24] |
Comparison 10. Energy‐protein supplementation versus no supplementation in poor Senegalese children after three months.
| Outcome or subgroup title | No. of studies | No. of participants | Statistical method | Effect size |
|---|---|---|---|---|
| 1 Weight (kg) at the end of the intervention | 1 | 110 | Mean Difference (IV, Fixed, 95% CI) | 0.03 [‐0.30, 0.36] |
| 2 Length (cm) at the end of the intervention | 1 | 110 | Mean Difference (IV, Fixed, 95% CI) | ‐0.12 [‐1.08, 0.84] |
| 3 Weight gain (kg) during the intervention | 1 | 110 | Mean Difference (IV, Fixed, 95% CI) | 0.05 [‐0.14, 0.24] |
| 4 Length gain (cm) during the intervention | 1 | 110 | Mean Difference (IV, Fixed, 95% CI) | 0.48 [0.07, 0.89] |
Comparison 11. Energy‐protein supplementation versus no supplementation in children from four countries after three months.
| Outcome or subgroup title | No. of studies | No. of participants | Statistical method | Effect size |
|---|---|---|---|---|
| 1 Weight (kg) at the end of the intervention | 1 | 447 | Mean Difference (IV, Fixed, 95% CI) | ‐0.08 [‐0.24, 0.08] |
| 2 Length (cm) at the end of the intervention | 1 | 447 | Mean Difference (IV, Fixed, 95% CI) | 0.20 [‐0.22, 0.62] |
| 3 Weight gain (kg) during the intervention | 1 | 447 | Mean Difference (IV, Fixed, 95% CI) | ‐0.01 [‐0.09, 0.07] |
| 4 Length gain (cm) during the intervention | 1 | 447 | Mean Difference (IV, Fixed, 95% CI) | 0.18 [‐0.01, 0.37] |
11.1. Analysis.
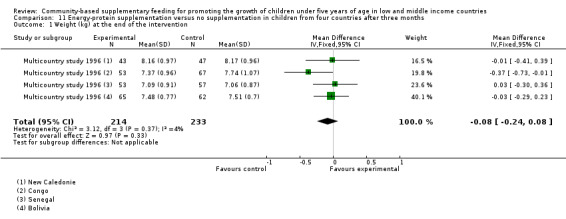
Comparison 11 Energy‐protein supplementation versus no supplementation in children from four countries after three months, Outcome 1 Weight (kg) at the end of the intervention.
11.2. Analysis.
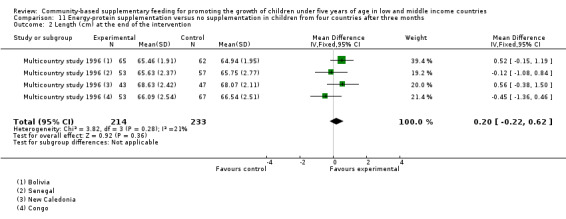
Comparison 11 Energy‐protein supplementation versus no supplementation in children from four countries after three months, Outcome 2 Length (cm) at the end of the intervention.
11.3. Analysis.
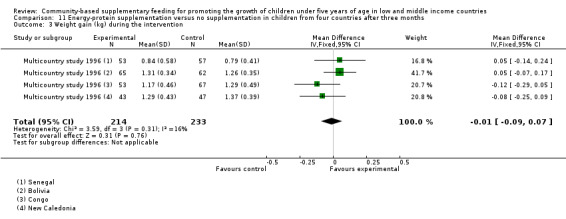
Comparison 11 Energy‐protein supplementation versus no supplementation in children from four countries after three months, Outcome 3 Weight gain (kg) during the intervention.
11.4. Analysis.
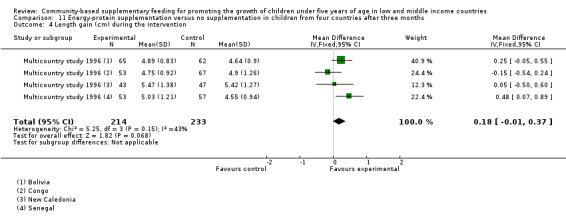
Comparison 11 Energy‐protein supplementation versus no supplementation in children from four countries after three months, Outcome 4 Length gain (cm) during the intervention.
Comparison 12. Supplementary feeding by age of children.
| Outcome or subgroup title | No. of studies | No. of participants | Statistical method | Effect size |
|---|---|---|---|---|
| 1 Weight (kg) at the end of the intervention | 3 | 587 | Mean Difference (IV, Fixed, 95% CI) | ‐0.03 [‐0.17, 0.12] |
| 1.1 Children younger than 24 months | 3 | 587 | Mean Difference (IV, Fixed, 95% CI) | ‐0.03 [‐0.17, 0.12] |
| 2 Length/height (cm) at the end of the intervention | 3 | 587 | Mean Difference (IV, Fixed, 95% CI) | 0.28 [‐0.11, 0.67] |
| 2.1 Children younger than 24 months | 3 | 587 | Mean Difference (IV, Fixed, 95% CI) | 0.28 [‐0.11, 0.67] |
| 3 Weight (kg) gain during the intervention | 2 | 795 | Mean Difference (IV, Fixed, 95% CI) | 0.04 [‐0.03, 0.11] |
| 3.1 Children younger than 24 months | 1 | 447 | Mean Difference (IV, Fixed, 95% CI) | ‐0.01 [‐0.09, 0.07] |
| 3.2 Children older than 24 months | 1 | 348 | Mean Difference (IV, Fixed, 95% CI) | 0.22 [0.07, 0.37] |
| 4 Length/height (cm) gain during the intervention | 2 | 795 | Mean Difference (IV, Fixed, 95% CI) | 0.19 [0.07, 0.31] |
| 4.1 Children younger than 24 months | 1 | 447 | Mean Difference (IV, Fixed, 95% CI) | 0.18 [‐0.01, 0.37] |
| 4.2 Children older than 24 months | 1 | 348 | Mean Difference (IV, Fixed, 95% CI) | 0.19 [0.04, 0.34] |
| 5 Weight‐for‐age z‐score at the end of the intervention | 2 | 195 | Mean Difference (IV, Fixed, 95% CI) | ‐0.18 [‐0.49, 0.12] |
| 5.1 Other age range (6 months to 6 years) | 2 | 195 | Mean Difference (IV, Fixed, 95% CI) | ‐0.18 [‐0.49, 0.12] |
| 6 Length/height‐for‐age z‐score at the end of he intervention | 2 | 195 | Mean Difference (IV, Fixed, 95% CI) | 0.02 [‐0.29, 0.32] |
| 6.1 Other age range (6 months to 6 years) | 2 | 195 | Mean Difference (IV, Fixed, 95% CI) | 0.02 [‐0.29, 0.32] |
| 7 Weight‐for‐length/height z‐score at the end of the intervention | 3 | 260 | Mean Difference (IV, Fixed, 95% CI) | ‐0.10 [‐0.33, 0.13] |
| 7.1 Children younger than 24 months | 1 | 65 | Mean Difference (IV, Fixed, 95% CI) | 0.0 [‐0.39, 0.39] |
| 7.2 Other age range (6 months to 6 years) | 2 | 195 | Mean Difference (IV, Fixed, 95% CI) | ‐0.15 [‐0.43, 0.14] |
| 8 Change in weight‐for‐age z‐score during the intervention | 1 | 348 | Mean Difference (IV, Fixed, 95% CI) | 0.12 [0.05, 0.19] |
| 8.1 Children older 24 months | 1 | 348 | Mean Difference (IV, Fixed, 95% CI) | 0.12 [0.05, 0.19] |
| 9 Change in height‐for‐age z‐score | 1 | 348 | Mean Difference (IV, Fixed, 95% CI) | 0.05 [0.01, 0.08] |
| 9.1 Children older than 24 months | 1 | 348 | Mean Difference (IV, Fixed, 95% CI) | 0.05 [0.01, 0.08] |
12.3. Analysis.
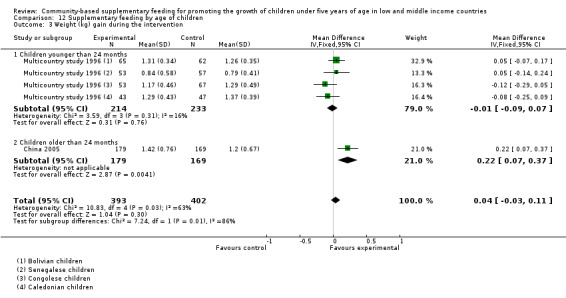
Comparison 12 Supplementary feeding by age of children, Outcome 3 Weight (kg) gain during the intervention.
12.8. Analysis.
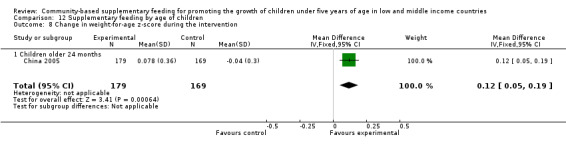
Comparison 12 Supplementary feeding by age of children, Outcome 8 Change in weight‐for‐age z‐score during the intervention.
12.9. Analysis.
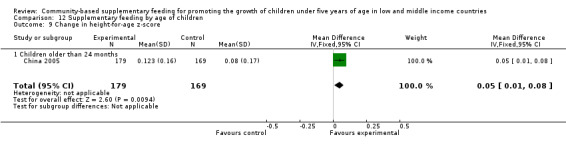
Comparison 12 Supplementary feeding by age of children, Outcome 9 Change in height‐for‐age z‐score.
Comparison 13. Supplementary feeding by nutritional status of children.
| Outcome or subgroup title | No. of studies | No. of participants | Statistical method | Effect size |
|---|---|---|---|---|
| 1 Weight (kg) at the end of the intervention | 3 | 587 | Mean Difference (IV, Fixed, 95% CI) | ‐0.03 [‐0.17, 0.12] |
| 1.1 Stunted/wasted children | 2 | 140 | Mean Difference (IV, Fixed, 95% CI) | 0.21 [‐0.14, 0.55] |
| 1.2 Non stunted/wasted children | 1 | 447 | Mean Difference (IV, Fixed, 95% CI) | ‐0.08 [‐0.24, 0.08] |
| 2 Length/height (cm) at the end of the intervention | 3 | 587 | Mean Difference (IV, Fixed, 95% CI) | 0.28 [‐0.11, 0.67] |
| 2.1 Stunted/wasted children | 2 | 140 | Mean Difference (IV, Fixed, 95% CI) | 0.72 [‐0.25, 1.69] |
| 2.2 Non stunted/wasted children | 1 | 447 | Mean Difference (IV, Fixed, 95% CI) | 0.20 [‐0.22, 0.62] |
| 3 Weight‐for‐length/height z‐score at the end of the intervention | 3 | 260 | Mean Difference (IV, Fixed, 95% CI) | ‐0.10 [‐0.33, 0.13] |
| 3.1 Stunted/wasted children | 1 | 65 | Mean Difference (IV, Fixed, 95% CI) | 0.0 [‐0.39, 0.39] |
| 3.2 Non stunted/wasted children | 2 | 195 | Mean Difference (IV, Fixed, 95% CI) | ‐0.15 [‐0.43, 0.14] |
Comparison 14. Supplementary feeding by duration of the intervention.
| Outcome or subgroup title | No. of studies | No. of participants | Statistical method | Effect size |
|---|---|---|---|---|
| 1 Weight (kg) at the end of the intervention | 3 | 587 | Mean Difference (IV, Fixed, 95% CI) | ‐0.03 [‐0.17, 0.12] |
| 1.1 Supplementary feeding less than 12 months | 2 | 512 | Mean Difference (IV, Fixed, 95% CI) | ‐0.05 [‐0.21, 0.10] |
| 1.2 Supplementary feeding equal or longer than12 months | 1 | 75 | Mean Difference (IV, Fixed, 95% CI) | 0.16 [‐0.27, 0.59] |
| 2 Length/height (cm) at the end of the intervention | 3 | 587 | Mean Difference (IV, Fixed, 95% CI) | 0.28 [‐0.11, 0.67] |
| 2.1 Supplementary feeding less than 12 months | 2 | 512 | Mean Difference (IV, Fixed, 95% CI) | 0.31 [‐0.09, 0.71] |
| 2.2 Supplementary feeding equal or longer than 12 months | 1 | 75 | Mean Difference (IV, Fixed, 95% CI) | ‐0.10 [‐1.61, 1.41] |
| 3 Weight gain (kg) during the intervention | 2 | 795 | Mean Difference (IV, Fixed, 95% CI) | 0.04 [‐0.03, 0.11] |
| 3.1 Supplementary feeding less than 12 months | 2 | 795 | Mean Difference (IV, Fixed, 95% CI) | 0.04 [‐0.03, 0.11] |
| 4 Length/height gain (cm) during the intervention | 2 | 795 | Mean Difference (IV, Fixed, 95% CI) | 0.19 [0.07, 0.31] |
| 4.1 Supplementary feeding less than 12 months | 2 | 795 | Mean Difference (IV, Fixed, 95% CI) | 0.19 [0.07, 0.31] |
| 5 Weight‐for‐age z‐score at the end of the intervention | 2 | 195 | Mean Difference (IV, Fixed, 95% CI) | ‐0.18 [‐0.49, 0.12] |
| 5.1 Supplementary feeding less than 12 months | 2 | 195 | Mean Difference (IV, Fixed, 95% CI) | ‐0.18 [‐0.49, 0.12] |
| 6 Length/height‐for‐age z‐score at the end of the intervention | 2 | 195 | Mean Difference (IV, Fixed, 95% CI) | 0.02 [‐0.29, 0.32] |
| 6.1 Supplementary feeding less than 12 months | 2 | 195 | Mean Difference (IV, Fixed, 95% CI) | 0.02 [‐0.29, 0.32] |
| 7 Weight‐for‐length/height z‐score at the end of the intervention | 3 | 260 | Mean Difference (IV, Fixed, 95% CI) | ‐0.10 [‐0.33, 0.13] |
| 7.1 Supplementary feeding less than 12 months | 3 | 260 | Mean Difference (IV, Fixed, 95% CI) | ‐0.10 [‐0.33, 0.13] |
| 8 Change of weight‐for‐age z‐score during the intervention | 1 | 348 | Mean Difference (IV, Fixed, 95% CI) | 0.12 [0.05, 0.19] |
| 8.1 Supplementary feeding less than 12 months | 1 | 348 | Mean Difference (IV, Fixed, 95% CI) | 0.12 [0.05, 0.19] |
| 9 Change in height‐for‐age z‐score during the intervention | 1 | 348 | Mean Difference (IV, Fixed, 95% CI) | 0.05 [0.01, 0.08] |
| 9.1 Supplementary feeding less than 12 months | 1 | 348 | Mean Difference (IV, Fixed, 95% CI) | 0.05 [0.01, 0.08] |
14.3. Analysis.
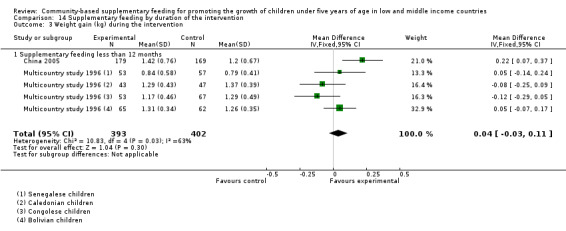
Comparison 14 Supplementary feeding by duration of the intervention, Outcome 3 Weight gain (kg) during the intervention.
14.8. Analysis.
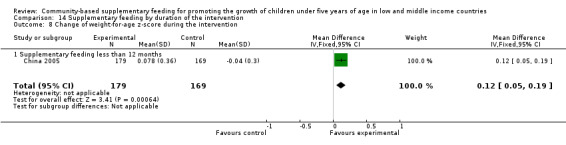
Comparison 14 Supplementary feeding by duration of the intervention, Outcome 8 Change of weight‐for‐age z‐score during the intervention.
14.9. Analysis.

Comparison 14 Supplementary feeding by duration of the intervention, Outcome 9 Change in height‐for‐age z‐score during the intervention.
Characteristics of studies
Characteristics of included studies [ordered by study ID]
Brazil 2006.
| Methods | Double‐blind RCT with a longitudinal follow‐up of children. | |
| Participants | Children aged 1 to 6 years attending 4 municipal crèches of João Pessoa, Paraíba, Brazil. | |
| Interventions | Exp (n = 45): 10 g of multi‐mixture per day during 2 mo. For each 100 g of preparation the intervention contains: 47.5% of wheat flour, 47.5% of cornmeal, 4% of melon seed powder, sesame, gourd and peanut, 0.5% of cassava leaf powder and 0.5% of eggshells, and presents the following centesimal composition: 2.7 g of ashes, 5.2 g of lipids, 11.7 g of proteins, 74.2 g of carbohydrate and 6.2 g of fibres. The mineral composition was: 8 mg of iron, 357 mg of calcium, 235 mg de magnesium, 677 mg of potassium, 570 mg de phosphorus and 7 mg of sodium. Total amount of calories/100 g of multi‐mixture estimated: 390 kcal. Control (n = 42): 5 g of cassava flour similar to mixture in colour and thickness of grains. For each 100 g of preparation the mixture contains the following centesimal composition: 336.8 calories, 81.1 g of carbohydrate, 2.2 g of proteins, 0.05 g of lipids, 21 mg of calcium, 105 mg of phosphorus and 0.8 mg of iron. |
|
| Outcomes | Mean W‐F‐A, H‐F‐A and W‐F‐H z‐scores; and prevalence of underweight, stunting, wasting, and overweight. | |
| Notes | The trial profile was based on three study groups: intervention 1 (GI1 = 48), intervention 2 (GI2 = 45) and control (CG = 42), receiving 5 g and 10 g of multi‐mixture and placebo, respectively. | |
| Risk of bias | ||
| Bias | Authors' judgement | Support for judgement |
| Random sequence generation (selection bias) | Unclear risk | Four out of 15 crèches were selected by drawing lots to participate in the study. No further information was provided. |
| Allocation concealment (selection bias) | Low risk | The food supplement was concealed (intervention versus placebo). |
| Incomplete outcome data (attrition bias) All outcomes | Low risk | No losses to follow‐up in any of the study groups. |
| Selective reporting (reporting bias) | Low risk | The study published results with lack of clinical importance or lack of statistical significance. |
| Blinding of participants and personnel (performance bias) All outcomes | Low risk | The multi‐mixture of the intervention group was similar to mixture of the placebo group in colour and thickness of grains. There was not any modification on the feeding scheme at crèches. The plates of children were marked with the child's name plus a code. Only one trained member of the research team was in charge of providing the multi‐mixture (bran‐based cereal mixture or placebo) to the study groups daily. |
| Blinding of outcome assessment (detection bias) All outcomes | Low risk | The authors said that the study was double blind but no details on blinding of outcome assessors were provided. |
| Reliability of primary outcome measurements | Low risk | Information about anthropometric procedures and instruments used was provided. |
Brazil 2008.
| Methods | Community randomised controlled study. The slum of Lona in Maceió city was divided in two sectors (A and B) taking a central street as reference. All children were evaluated and 50 children with the lowest W‐F‐A z‐score were selected in each sector. Authors said "children were randomly assigned to the intervention or the control group by drawing lots" but the method was not clearly described. | |
| Participants | Children aged 6 to 60 months from a slum area in the city of Maceió, State of Alago, Brazil, classified according to their W‐F‐A at baseline. | |
| Interventions | Exp (n = 48 children): two tablespoons of multi‐mixture during the child meals for 10 mo. The multi‐mixture contained 80% wheat flour, 10% of cassava leaf powder, and 10% of eggs shells. These ingredients were cooked over a low heat for 5 to 10 minutes and then the heat was stifled for their homogenisation. The food supplement was delivered at home on a fortnightly basis. Control (n = 60): no supplementation. |
|
| Outcomes | Mean H‐F‐A, W‐F‐A and W‐F‐H z‐ score. | |
| Notes | ||
| Risk of bias | ||
| Bias | Authors' judgement | Support for judgement |
| Random sequence generation (selection bias) | Unclear risk | The random sequence generation was not described. |
| Allocation concealment (selection bias) | Unclear risk | The method of allocation concealment was not reported. |
| Incomplete outcome data (attrition bias) All outcomes | Low risk | Two children of the intervention group excluded from the analysis. |
| Selective reporting (reporting bias) | Low risk | The study published results with lack of clinical importance or lack of statistical significance. |
| Blinding of participants and personnel (performance bias) All outcomes | High risk | Each child received a special package containing a quantity of multi‐mixture for 15 days. A member of the research team visited the family every fortnight in order to monitoring the multi‐mixture utilisation and consumption. |
| Blinding of outcome assessment (detection bias) All outcomes | Unclear risk | The anthropometric measurements were taken by trained students graduated in nutrition but no details about blinding of outcome assessment were provided. |
| Reliability of primary outcome measurements | Low risk | Information about anthropometric procedures and instruments used was provided. |
China 2005.
| Methods | Randomised controlled trial. The authors said “subjects were randomly allocated to either the control group or the yogurt group”. | |
| Participants | Children aged 3‐5 years from 7 kindergartens in Beijing suburbs, China. | |
| Interventions | Exp (n = 179): a daily serving of yogurt (125 g/cup) with 3.8 g of protein, 150 mg of calcium, 0.19 mg of vitamin B2 from Monday to Friday during 9 mo. Control (n = 169): no supplementation. |
|
| Outcomes | Increase in weight (kg), height (cm), and MUAC (cm), and change of H‐F‐A, W‐F‐A z‐score at baseline and after 3, 6, and 9 months of study. | |
| Notes | Other outcomes reported were morbidity and bone mineral density of forearm. | |
| Risk of bias | ||
| Bias | Authors' judgement | Support for judgement |
| Random sequence generation (selection bias) | Unclear risk | Random sequence generation was not described. |
| Allocation concealment (selection bias) | Unclear risk | The method of allocation concealment was not reported. |
| Incomplete outcome data (attrition bias) All outcomes | Unclear risk | The information was not reported by trialist. However, according to the footnotes of two tables (Table 4 and 6) of the study published report, 16% and 11% of the children were lost to follow‐up in the control and intervention groups, respectively. |
| Selective reporting (reporting bias) | Unclear risk | The study published harmful effects and results with lack of clinical or statistical relevance. |
| Blinding of participants and personnel (performance bias) All outcomes | Unclear risk | Blinding of participants and personnel was not described. |
| Blinding of outcome assessment (detection bias) All outcomes | Unclear risk | Blinding of outcome assessors was not described. |
| Reliability of primary outcome measurements | Unclear risk | Only information on instruments for anthropometrical measurements and the growth reference used were provided. |
Guatemala 1995.
| Methods | Cluster randomised controlled study. The authors said "allocation of treatment across villages was random paired to be as similar as possible (one pair was large, i.e. about 900 inhabitants and one pair was small, i.e. about 500 people in each)". | |
| Participants | Pregnant and lactating women and children younger than 7 years of age living in four rural Guatemalan villages. This intervention was provided "universally", i.e. inclusion criteria were not based on nutritional status at baseline. | |
| Interventions | Exp (n = 2 villages, one small and one large): high‐energy protein drink called Atole (90.5 kcal and 6.3 g of protein/100 ml). Control (n = 2 villages, one small and one large): low‐energy, no protein drink called Fresco (33 kcal/100 ml). Both drinks were enriched with vitamins and minerals in equal concentrations. However, Atole differed in name, appearance, and taste. These drinks were distributed at a feeding centre twice a day, and were available on demand to all members of the community, including at week‐ends. |
|
| Outcomes | Length (cm), weight (g) before and after the beginning of the study. | |
| Notes | Originally, three pairs of villages were selected. Due to budgetary constraints, the number was reduced to two pairs, with dire consequences for statistical power. The number of children included in each study group was not provided. | |
| Risk of bias | ||
| Bias | Authors' judgement | Support for judgement |
| Random sequence generation (selection bias) | Unclear risk | Random sequence generation was not described. |
| Allocation concealment (selection bias) | Low risk | The authors said that "allocation of treatment was assigned across villages paired to be as similar as possible" (a table with the selection criteria of villages was provided) and that "the villages were far enough apart from each other, to make contact among villages unlikely”. |
| Incomplete outcome data (attrition bias) All outcomes | Unclear risk | No information provided. |
| Selective reporting (reporting bias) | Unclear risk | The before‐after comparison was possible only for selected variables collected with adequate sample sizes in 1968, before the intervention began, or for variables collected in the first months of the study which could not be affected by supplementation. |
| Blinding of participants and personnel (performance bias) All outcomes | High risk | The intervention had to be prepared at the time of ingestion and therefore required a central kitchen and feeding hall, precluding blinding of people and staff. |
| Blinding of outcome assessment (detection bias) All outcomes | High risk | The study team rotated through all the villages for equal durations of time and visited the families twice a month. The enthusiasm for participation or follow‐up may be influenced by group allocation. |
| Reliability of primary outcome measurements | Unclear risk | No information provided. |
Indonesia 1991.
| Methods | Cluster‐randomised controlled study. The study children were divided into two age groups according to the types of psychological tests to be administered to them. Authors said "DCC assignment to the two types of intervention was randomized and stepwise by pairs". | |
| Participants | Children attending to DCCs at six plantations in West Java, Indonesia. The younger age group (6 to 20 mo) was considered for anthropometrical assessment. | |
| Interventions | Exp (n = 9 DCCs, 75 children). The daily supplement consisted of twice‐a‐day snacks given 6 d/week for 90 days. They included rice, rice flour, wheat flour, bread, cassava, potatoes, sweet potatoes, coconut milk, refined sugar, brown sugar and edible oil. Based on 20 different recipes used, the energy of the snacks varied from 187 kcal to 216 kcal and protein content ranged from 1.8 g to 4.4 g. On average, the daily supplement provided 400 kcal and 5 g protein. Control (n = 11 DCCs, 38 children): no food supplementation. |
|
| Outcomes | Weight and height z‐scores. | |
| Notes | The study was designed to compare pre‐ to post‐treatment changes for children with and without supplementation, focusing on motor maturation. DCCs were selected for the study based on their having more than 15 children aged from 6 to 59 mo inclusive. | |
| Risk of bias | ||
| Bias | Authors' judgement | Support for judgement |
| Random sequence generation (selection bias) | Unclear risk | Random sequence generation was not described. |
| Allocation concealment (selection bias) | Unclear risk | The method of allocation concealment was not reported. |
| Incomplete outcome data (attrition bias) All outcomes | Unclear risk | No information provided. |
| Selective reporting (reporting bias) | Low risk | The study published results with lack of clinical importance or lack of statistical significance. |
| Blinding of participants and personnel (performance bias) All outcomes | Unclear risk | Blinding of participants and personnel not described. |
| Blinding of outcome assessment (detection bias) All outcomes | Unclear risk | Blinding of outcome assessors not described. |
| Reliability of primary outcome measurements | Unclear risk | Only information on instruments for anthropometrical measurements and the growth reference used were provided. |
Indonesia 2000.
| Methods | The study design included the randomisation of treatment by community‐run DCCs to different intervention schemes. The authors said "two cohorts of children were randomly assigned to three treatments". | |
| Participants | A 12‐month‐old and an 18‐month‐old cohort of moderately stunted and wasted children (L‐F‐A below ‐1 SD and W‐F‐L between ‐1 and ‐2 SD of the median of the NCHS/WHO references values, respectively) recruited from 24 community‐run DCCs in tea plantations of West Java, Indonesia. Excluded: children with signs of chronic disease. | |
| Interventions | Exp (n = 38): 11 teaspoons of condensed milk (250 kcal and 6 g of protein per ration) and a dissolved tablet of micronutrients. Placebo (n = 37): 11 teaspoons of skimmed milk (20 kcal and 1.35 g of protein per ration) and a dissolved tablet of micronutrients. The supplements were given twice daily at the DCC, 6 days a week for 12 months. |
|
| Outcomes | Height (cm), weight (g), HC (cm), MUAC (cm). | |
| Notes | The trial profile was based on three study groups: E = condensed milk plus micronutrients, and M = skimmed milk plus micronutrients, S = skimmed milk plus placebo tablet. | |
| Risk of bias | ||
| Bias | Authors' judgement | Support for judgement |
| Random sequence generation (selection bias) | Unclear risk | Random sequence generation was not described. |
| Allocation concealment (selection bias) | Unclear risk | The method of allocation concealment was not reported. |
| Incomplete outcome data (attrition bias) All outcomes | Unclear risk | No information provided. |
| Selective reporting (reporting bias) | Low risk | The study published results with lack of clinical importance or lack of statistical significance. |
| Blinding of participants and personnel (performance bias) All outcomes | Unclear risk | Blinding of participants and personnel not described. |
| Blinding of outcome assessment (detection bias) All outcomes | High risk | Outcome assessors were not blinded. |
| Reliability of primary outcome measurements | Unclear risk | Only information on instruments for anthropometrical measurements and the growth reference used were provided. |
Jamaica 1991.
| Methods | The authors said that "children were randomly assigned to four study groups". | |
| Participants | Stunted children (recumbent lengths < ‐ 2 SD of the NCHS reference) aged 9‐24 months. Excluded: children with W‐F‐H > the NCHS median considered more likely to be genetically short. | |
| Interventions | Exp (n = 32): 1 kg of a milk‐based formula per week containing 525 kcal and 14 g protein/100 g. The supplement was delivered weekly to the home for 12 months. In addition, 0.9 kg cornmeal and skimmed milk powder were given to the family. Control (n = 33): no food supplementation. |
|
| Outcomes | Length (cm), weight (g), HC (cm), MUAC (cm), TSF (mm), SSF (mm), W‐F‐L z‐ score. | |
| Notes | Stunted children were recruited by house‐to‐house survey. The trial profile was based on four groups: 1 ‐ Supplementation group (n = 32), 2 ‐ Stimulation group (n = 30), 3 ‐ Supplementation and stimulation (n = 32), 4 ‐ Control group (n = 33). In this regard, there were two important basic disparities among the children in the control and the supplemented groups, such as birthweight (21% weighted 1.8‐2.3 kg and 100% weighted more than 2.3 kg at enrolment, respectively) and guardian's employment (75% versus 94% were unemployed, respectively). | |
| Risk of bias | ||
| Bias | Authors' judgement | Support for judgement |
| Random sequence generation (selection bias) | Unclear risk | Random sequence generation was not described. |
| Allocation concealment (selection bias) | Unclear risk | The method of allocation concealment was not reported. |
| Incomplete outcome data (attrition bias) All outcomes | Low risk | No losses to follow‐up. |
| Selective reporting (reporting bias) | Low risk | The study published results with lack of clinical importance or lack of statistical significance. |
| Blinding of participants and personnel (performance bias) All outcomes | Unclear risk | Blinding of participants and personnel not described. |
| Blinding of outcome assessment (detection bias) All outcomes | Unclear risk | Blinding of child growth outcome assessors not described. |
| Reliability of primary outcome measurements | Low risk | Information about anthropometrical procedures and instruments used was provided. |
Multicountry study 1996.
| Methods | Four country RCT. | |
| Participants | Children aged 4 to 7 months. | |
| Interventions | Exp (n = 214 children): a cereal based precooked porridge enriched with vitamins and minerals to be mixed with boiled water for hygienic preparation. Per 100 g of dry porridge the supplemental food provided: 410 kcal, 9 g of protein, 10 g of lipids, and 67 g of carbohydrates. It also contained micronutrients, vitamins and minerals. The packets were delivered at home twice daily for 3 months by a fieldworker who monitored its consumption. Introduction was progressive, 25 g dry supplement in 75 ml water per meal, i.e.103 kcal in 100 g from 4 to 5 months and 50 g supplement and 135 ml water per meal, i.e. 205 kcal in 185 g from 5 to 7 months. No food was given for other family members. Controls (n = 233): no supplementation. |
|
| Outcomes | Weight and length at the end of the intervention, and 4 to 7 months weight and length increments. | |
| Notes | The authors reported the results of the four included countries separately. | |
| Risk of bias | ||
| Bias | Authors' judgement | Support for judgement |
| Random sequence generation (selection bias) | Unclear risk | Randomisation was done after inclusion of each child by drawing lots. No further information was provided. |
| Allocation concealment (selection bias) | Unclear risk | The method of allocation concealment was not reported. |
| Incomplete outcome data (attrition bias) All outcomes | High risk | Percentages of excluded children were higher than 20% in many of the study groups during three months of intervention. Reasons for exclusions were: death, illness, refusals and absences. ‐Bolivia: 24% (control) and 16% (intervention). ‐Congo: 11% (control) and 32% (intervention). ‐New Caledonia: 11% (control) and 31% (intervention). ‐Senegal: 16% (control) and 20% (intervention). |
| Selective reporting (reporting bias) | Low risk | The study published results with lack of clinical importance or lack of statistical significance. |
| Blinding of participants and personnel (performance bias) All outcomes | Unclear risk | Blinding of participants and personnel not described. |
| Blinding of outcome assessment (detection bias) All outcomes | High risk | Outcome assessors were not blinded. |
| Reliability of primary outcome measurements | High risk | Reliability of personnel in charge of taken anthropometric measurement among study sites was not assessed. This is judged as inadequate training of outcome assessors. |
cm = centimeter, d = day, DCCs = day care centres, Exp = experimental, g = gram, HC = head circumference, H‐F‐A = height‐for‐age, kg = kilogram, L‐F‐A = length‐for‐age, mo = months, MUAC = mid‐upper arm circumference, n = number, NCHS = National Center Health Statistics, SD = standard deviation, SSF = subscapular skinfold thickness, TSF = triceps skinfold thickness, W‐F‐A = weight‐for‐age, W‐F‐L = weight‐for‐length, W‐F‐H = weight‐for‐height, wk = weeks, WHO = World Health Organization.
Characteristics of excluded studies [ordered by study ID]
| Study | Reason for exclusion |
|---|---|
| Bangladesh 1992 | The intervention is an energy‐dense supplementary food together with nutritional education versus nutritional education alone. Method: random generation after obtaining caregiver consent was done by using a computer‐generated random number table. Participants: children aged 6‐12 months with a MUAC between 110 and 129 mm. Intervention: 450 g of premixed roasted and packed rice, wheat and lentil powder along with 90 g of cooking oil. The mothers were taught by local community nutrition workers how to prepare an energy‐dense porridge from these ingredients, adding salt or sugar as appropriate (energy content of 163 kcal/100 g). They were instructed to give it three times daily. Families with older siblings under five years of age received an additional packet to compensate for the effect of food sharing. Outcomes: mean monthly weight gain. |
| Brazil 2007 | 39% of children aged more than 60 months of age at the start of the study. Method: cluster‐randomised controlled trial. The control and intervention groups were defined by drawing lots to choose schools that had previously been paired for nutritional status based on the mean z‐score for H‐F‐A. No further information was provided. Participants: 1464 children aged more than 12 months and attending 24 preschools in the suburban neighbourhoods of the city of Pelotas, Brazil. Intervention: multi‐mixture supplementation (12 school, 549 children) versus no supplementation (12 schools, 526 children). 10 g of daily multi‐mixture added to the food provided by the school from Monday to Friday for 6 months. The multi‐mixture was made up of 30% rice bran, 30% wheat bran, 10% wheat flour, 15% corn flour, 5% powdered cassava leaves, 5% powdered egg shells and 5% powdered pumpkin or sunflower seeds. Outcomes: mean W‐F‐A, H‐F‐A, W‐F‐H z‐scores after 6 months of supplementation. 24% of children excluded in the intervention group (21% lost during follow‐up and 3% lost during analysis). |
| Colombia 1981 | 23% of children excluded after randomisation (4 stillbirth, 4 multiple births, 3 changes of address, 8 missing data after birth, and 22 without a clearly reason for exclusion (mortality or changes of address). Food supplements were provided from the onset of the third trimester of pregnancy until the children reached the age of 3 years old. Though, supplementation of mothers during pregnancy complicates the interpretation of results because effects cannot be analysed separately. Method: "families were randomly assigned to control and supplemented groups". No further information provided. Participants: 131 Colombian children aged 0‐36 months. Intervention: food supplementation vs no supplementation. The supplement was delivered weekly at home. Infants aged 3‐12 mo received a high‐protein, whole‐powered‐milk‐and vegetable mixture. After 12 mo of age, they received enriched bread, powered skim milk, and vegetable oil as did all other family members. In addition, children were also provided with 7.5 mg or 15 mg ferrous sulphate daily in the form of oral drops and a standard dose of 60,000 ug of vitamin A every 6 months. Outcomes: prevalence of malnutrition, physical growth and child morbidity during the first 3 year of life. |
| Gambia 1998 | The age of the children participating in the study was 68 ± 21 mo (values are given as mean ± SD). Method: groups were randomly allocated to receive either a high fat supplement, an isocaloric high CHO supplement or no supplement at all. No further information was provided. Participants: 90 stunted children with a H‐F‐A z score < ‐2 aged between 3 and 9 years old. Wasted children with a H‐F‐A z score < ‐2 were excluded. Intervention: children were supplemented with biscuits containing different proportions of rice, flour, roasted groundnuts, sugar, vegetable oil and honey. They were similar regarding their micronutrient and vitamin constitution with exception that high fat biscuits contained notably more vitamin E. The high CHO biscuit contains 533 kcal/100 g of raw biscuit. The supplements were given 5 d/week for 12 mo. Outcomes: weight (kg), height (cm), skinfolds (mm), HC (cm), MUAC (cm). |
| Haiti 2008 | This cluster‐randomised trial aimed to compare the effect on child growth of a preventive and a recuperative approach of targeting food assistance. The study compared two different models of targeting food assistance to children: the traditional (recuperative model) that provides food assistance for 9 months which to underweight children (W‐F‐A z‐scores <–2) aged 6–59 months; and the preventive model which targets all children aged 6–23 months and provides them food assistance up to 18 months. Method: 20 clusters of communities were selected for the evaluation from programme areas in Central Plateau, Haiti. For each pair of matched clusters the group assignment was determined by drawing lots. The first cluster drawn from the pair was assigned to the preventive group and the one remaining was assigned to the recuperative group. Participants: all children aged 6–23 months (preventive model) and underweight (W‐F‐A z‐score <–2) children aged 6–60 months (recuperative model). Both models also targeted pregnant and lactating women up to 6 months postpartum. Intervention: a packet of interventions was offered to all community members, including prenatal and postnatal consultations, health education, growth monitoring, services for preventive maternal and child health and nutrition, immunisation, vitamin A supplementation, the provision of oral rehydration salts and anthelmintic drugs, and home visits for newborn infants or severely undernourished children. Monthly food ration targeted only to pregnant and lactating women (up to 6 months postpartum) and to children 0‐59 months of age identified as underweight (W‐F‐A z‐scores <–2). The monthly food ration for pregnant and lactating women consists of 5 kg of soy‐fortified bulgur, 1·5 kg of vegetable oil, and 2 kg of lentils, and an indirect (family) ration of 5 kg of wheat‐soy blend, 1·5 kg of oil, and 2 kg of lentils. The monthly food ration for children consists of 8 kg of micronutrient‐fortified wheat soy blend and 2 kg of oil, and an indirect ration intended for general household consumption of 10 kg of wheat‐soy blend and 2·5 kg of lentils. Food assistance was conditional on monthly participation in the rally posts and mothers’ clubs. Outcomes: mean z‐scores for H‐F‐A, W‐F‐A, and W‐F‐H, and the prevalence of childhood stunting, underweight and wasting. |
| India 2001 | The intervention is a micronutrient‐fortified food supplement supported by counselling or nutritional counselling. Method: "children were randomly assigned to one of four study groups". No further information. Participants: 418 infants aged 4‐12 months. Intervention: milk‐based cereal supplement and nutritional counselling (a packet of 50 g was delivered at home during the twice‐weekly visits for morbidity ascertainment) versus no intervention. Outcomes: anthropometric outcomes (weight and length), morbidity, impact on breastfeeding rates and energy intake. |
| Malawi 2004 | A 12‐week supplementation trial among underweight and stunted children aged 42 to 60 months of age who were randomised to receive either RTUF or maize and soy flour. Method: "allocation to the study group was made using computer‐generated random numbers by one author not participating in data collection". Group allocation was sealed in individual opaque envelopes at study commencement. Research assistant and participant's guardian were aware of the group allocation, while the study physician remained blinded until study completion. Participants: 61 underweight, stunted children 42 to 60 months of age from a rural community in Malawi, south eastern Africa. Intervention: RTUF (92 g/day) versus maize and soy flour (140 g/day). They were intended to provide 500 kcal/day energy and additional macro‐and micronutrients. RTUF could be eaten without additional preparation, whereas the maize and soy flour required cooking. Both food supplements were delivered fortnightly to the child's home. Outcomes: weight and height were measured at baseline and intervention periods, and at the end of the 12‐week follow‐up. |
| Mexico 2004 | Children and pregnant and lactating women in participating households received fortified nutrition supplements, and the families received nutrition education, health care and cash transfers. Method: 506 communities were randomly selected from a pool of communities that were eligible to receive the program benefits, 320 of these were randomly assigned to receive a packet of interventions, whereas the rest of the communities (n = 186) were assigned to act as controls. The nutritional impact was conducted in a random selection of 205 of the 320 intervention communities and in 142 communities randomly selected from the 186 (control group). Random generation not described. Participants: children aged 4 to 23 months, underweight children aged 2 to 4 years, pregnant and lactating women in low‐income rural households. Intervention: 205 intervention communities (n = 461 children aged < or equal 12 months) received 240 g packages containing 5 daily rations of dry whole milk, sugar, maltodextrin, and micronutrients (iron, zinc, vit A, E, C, B12, folic acid) for 24 months. They were distributed at health centres where mothers were instructed to add 4 spoons of boiled water to one ration, which produces a puree consistency. In addition, other interventions such as cash transfers and maternal health and nutrition education were included in the program. The 142 control communities (n = 334 children aged < or equal 12 months) were enrolled 12 months later and are referred to as crossover intervention communities. Outcomes: two‐year height increments and anaemia rates as measured by blood haemoglobin levels. |
CHO = carbohydrate, g = gram, HC = head circumference, H‐F‐A = height‐for‐age, Kcal = kilocalories, kg = kilogram, mg = milligram, ml = millilitre, mo = months, MUAC = mid upper arm circumference, RTUF = ready‐to‐use food, SD = standard deviation, ug = microgram, W‐F‐A = weight‐for‐age, W‐F‐H = weight‐for‐height, y = years.
Differences between protocol and review
At the protocol stage, individually‐randomised trials were excluded if 20% or more participants were lost to follow‐up in any of the comparison groups. This was considered a threshold flexible enough for RCTs on community‐based nutritional interventions. This exclusion criterion allowed review authors to straightforwardly dispose of trials with high risk of attrition bias due to the amount of incomplete outcome data. For the current version of the review, Professor Geraldine MacDonald, the Coordinating Editor of the CDPLPG suggested we remove this criterion. This decision was made after discussion and the main reasons were: the small number of RCTs retrieved by searches and the strategies to deal with missing data of primary studies available in the latest version of the Cochrane Handbook of Systematic Reviews of Interventions (Higgins 2009).
Potential adverse effects of supplementary feeding such as decrease in breastfeeding rates, overweight and diarrhoea were added as secondary outcomes.
The 'Risk of bias' tool was changed by The Cochrane Collaboration during the preparation of the updated review.
The World Bank list of economies of Member States was used for the updated review (July 2009). Washington, DC, World Bank, July 2009: http://siteresources.worldbank.org/DATASTATISTICS/Resources/CLASS.XLS. The term 'developing countries' was replaced by low‐ and middle‐income countries.
Contributions of authors
YS, MDO, and GC contributed to the drafting of the protocol. Originally, YS developed the search strategy and performed the searches; YS and GC selected studies for relevance; YS and GC extracted the data; YS entered all the data into RevMan and drafted and completed the review. MDO provided expertise and guidance and contributed to the writing and editing of the review. GC extracted and double checked the data, provided methodological advice and helped to write the review.
For the updated version of this review, YS performed the initial screening of references, developed the corresponding flowchart, made the final selection of included studies, independently rated the study quality, extracted the data into Review Manager, prepared the 'Summary of findings' tables and made all amendments in the text. MDO provided expert guidance on many aspects of the update process and contributed to the editing of the review at all stages. AMB carried out independent screening of all citations located in the updated literature search, independently rated each study for eligibility and independently checked the data entry into Review Manager 5.1. GC provided methodological expertise and contributed to the risk of bias assessment.
Sources of support
Internal sources
Centro Rosarino de Estudios Perinatales (CREP), Rosario, Argentina.
National Ministry of Health and Environment (Beca "Ramón Carrillo‐Arturo Oñativia", CONAPRIS) Buenos Aires, Argentina.
External sources
Department of Nutrition of the World Health Organization, Geneva, Switzerland.
The Aubrey Sheiham Public Health and Primary Care Scholarship, The UK Cochrane Centre, UK.
Declarations of interest
Yanina Sguassero: I have received fees for participation in review activities from HQ/NHD Nutrition for Health and Development, World Health Organization. This did not influence my work on this review. Mercedes de Onis: none known. Ana María Bonotti: none known. Guillermo Carroli: none known.
New search for studies and content updated (no change to conclusions)
References
References to studies included in this review
Brazil 2006 {published data only}
- Oliveira SMSd, Costa MJdC, Rivera MAA, Santos LMP, Ribeiro MdLC, Soares Gd, supplementary feeding, et al. Impact of a dietary supplement on the nutritional status of preschool children enrolled in day care centers [ Impacto da mistura no estado nutricional de pré‐escolares matriculados em creches]. Revista de Nutrição 2006;19(2):169‐76. [Google Scholar]
Brazil 2008 {published data only}
- Ferreira HdS, Cavalcante SdA, Cabral JrCR, Paffer ATd. Effects of the consumption of "multi‐mixture" on nutritional status: a community trial involving children from a slum district on the outskirts of Maceió, State of Alagoas, Brazil [Efeitos do consumo da multimistura sobre o estado nutricional: ensaio comunitário envolvendo crianças de uma favela daperiferia de Maceió, Alagoas, Brasil]. Revista Brasileira de Saúde Materno Infantil 2008;8(3):309‐18. [Google Scholar]
China 2005 {published data only}
- He M, Yang YX, Han H, Men JH, Bian LH, Wang GD. Effects of yogurt supplementation on the growth of preschool children in Beijing suburbs. Biomedical and Environmental Sciences 2005;18(3):192‐5. [PubMed] [Google Scholar]
Guatemala 1995 {published data only}
- Habicht JP, Martorell R. Objectives, research design, and implementation of the INCAP longitudinal study. Food and Nutrition Bulletin 1993; Vol. 14:176‐90.
- Habicht JP, Martorell R, Rivera JA. Nutritional impact of supplementation in the INCAP longitudinal study: analytic strategies and inferences. The Journal of Nutrition 1995;125:1042S‐50S. [DOI] [PubMed] [Google Scholar]
- Martorell R, Habicht JP, Rivera JA. History and design of the INCAP longitudinal study (1969‐1977) and its follow‐up (1988‐1989). The Journal of Nutrition 1995;125:1027S‐41S. [DOI] [PubMed] [Google Scholar]
- Read MS, Habicht JP. History of the INCAP longitudinal study on the effects of early nutrition supplementation in child growth and development. Food and Nutrition Bulletin 1993; Vol. 14:169‐75.
- Rivera JA, Habicht JP. Effect of supplementary feeding on the prevention of mild‐to‐moderate wasting in conditions of endemic malnutrition in Guatemala. Bulletin of the World Health Organization 2002;80(12):926‐32. [PMC free article] [PubMed] [Google Scholar]
- Rivera JA, Habicht JP. The recovery of Guatemalan children with mild to moderate wasting: factors enhancing the impact of supplementary feeding. American Journal of Public Health 1996;86(10):1430‐4. [DOI] [PMC free article] [PubMed] [Google Scholar]
- Rivera JA, Habicht JP, Robson DS. Effect of supplementary feeding on recovery from mild to moderate wasting in preschool children. The American Journal of Clinical Nutrition 1991;54(1):62‐8. [DOI] [PubMed] [Google Scholar]
- Rivera JA, Martorell R, Ruel MT, Habicht JP, Hass JD. Nutritional supplementation during the preschool years influences body size and composition of Guatemalan adolescents. The Journal of Nutrition 1995;125 Suppl(4):1068‐77. [DOI] [PubMed] [Google Scholar]
- Schroeder DG, Martorell R, Rivera JA, Ruel MT, Habicht JP. Age differences in the impact of nutritional supplementation on growth. The Journal of Nutrition 1995;125 Suppl(4):1051‐9. [DOI] [PubMed] [Google Scholar]
Indonesia 1991 {published data only}
- Husaini MA, Karyadi L, Husaini YK, Sandjaja DK, Pollitt E. Developmental effects of short‐term supplementary feeding in nutritionally‐at‐risk Indonesian infants. American Journal of Clinical Nutrition 1991;54:799‐804. [DOI] [PubMed] [Google Scholar]
Indonesia 2000 {published data only}
- Aitchison TC, Durnin JVGA, Beckett C, Pollit E. Effects of an energy and micronutrient supplement on growth and activity, correcting for non‐supplemental sources of energy input in undernourished children in Indonesia. European Journal of Clinical Nutrition 2000;54:S69‐73. [DOI] [PubMed] [Google Scholar]
- Beckett C, Durnin JVGA, Aitchison TC, Pollit E. Effects of an energy and micronutrient supplement on anthropometry in undernourished children in Indonesia. European Journal of Clinical Nutrition 2000;54 Suppl 2:52‐9. [DOI] [PubMed] [Google Scholar]
- Pollit E, Saco‐Pollit C, Jahari A, Husaini MA, Huang J. Effects of an energy and micronutrient supplement on mental development and behavior under natural conditions in undernourished children in Indonesia. European Journal of Clinical Nutrition 2000;54 Suppl 2:80‐90. [DOI] [PubMed] [Google Scholar]
- Saco‐Pollit C, Triana N, Harahap H, Husaini M, Jahari AB, Pollit E. The eco‐cultural context of the undernourished children in a study on the effects of early supplementary feeding in Indonesia. European Journal of Clinical Nutrition 2000;54 Suppl 2:11‐5. [DOI] [PubMed] [Google Scholar]
Jamaica 1991 {published data only}
- Grantham‐McGregor SM, Powell CA, Walker SP, Himes JH. Nutritional supplementation, psychosocial stimulation, and mental development of stunted children: the Jamaican study. The Lancet 1991;338(8758):1‐5. [DOI] [PubMed] [Google Scholar]
- Grantham‐McGregor SM, Walker SP, Himes JH, Powell CA. The effect of nutritional supplementation and stunting on morbidity in young children: the Jamaican study. Transactions of the Royal Society of Tropical and Hygiene 1993;87:109‐13. [DOI] [PubMed] [Google Scholar]
- Walker SP, Grantham‐McGregor SM, Himes JH, Powell CA, Chang SM. Early childhood supplementation does not benefit the long‐term growth of stunted children in Jamaica. The Journal of Nutrition 1996;126(12):3017‐24. [DOI] [PubMed] [Google Scholar]
- Walker SP, Powell CA, Grantham‐McGregor SM, Himes JH, Chang SM. Nutritional supplementation, psychosocial stimulation, and growth of stunted children: the Jamaican study. American Journal of Clinical Nutrition 1991;54:642‐8. [DOI] [PubMed] [Google Scholar]
Multicountry study 1996 {published data only}
- Simondon KB, Gartner A, Berger J, Cornu A, Massamba JP, San Miguel JL, et al. Effect of early, short‐term supplementation on weight and linear growth of 4‐7‐mo‐old infants in developing countries: a four‐country randomized trial. Effect of early, short‐term supplementation on weight and linear growth of 4‐7‐mo‐old infants in developing countries: a four‐country randomized trial 1996;64(4):537‐45. [DOI] [PubMed] [Google Scholar]
- Simondon, et al. Berger J, Simondon KB, Cornu A, Ly C, Massamba JP, et al. Effect of early, short‐term supplementation on weight and linear growth of 4‐7‐mo‐old infants in developing countries: a four‐country randomized trial. Revue d' Épidemiologie et de Santé Publique 1997;45:S109. [DOI] [PubMed] [Google Scholar]
References to studies excluded from this review
Bangladesh 1992 {published data only}
- Fauveau C, Siddiqui M, Briend A, Silimperi DR, Begum N, Fauveau V. Limited impact of a targeted food supplementation programme in Bangladeshi urban slum children. Annals of Tropical Paediatrics 1992;12(1):41‐6. [DOI] [PubMed] [Google Scholar]
Brazil 2007 {published data only}
- Gigante DP, Buchweitz M, Helbig E, Almeida AS, Araújo CL, Neuman NA, et al. Randomized clinical trial of the impact of a nutritional supplement “multi‐mixture” on the nutritional status of children enrolled at preschools. Jornal de Pediatria 2007;83(4):363‐9. [DOI] [PubMed] [Google Scholar]
Colombia 1981 {published data only}
- Lutter CK, Mora JO, Habicht JP, Rasmussen KM, Robson DS, Herrera MG. Age‐specific responsiveness of weight and length to nutritional supplementation. American Journal of Clinical Nutrition 1990;51:359‐64. [DOI] [PubMed] [Google Scholar]
- Mora JO, Herrera MG, Suescun J, Navarro L, Wagner M. The effects of nutritional supplementation on physical growth of children at risk of malnutrition. American Journal of Clinical Nutrition 1981;34:1885‐92. [DOI] [PubMed] [Google Scholar]
Gambia 1998 {published data only}
- Krähenbühl JD, Schutz Y, Jéquier E. High fat versus high carbohydrate nutritional supplementation: a one year trial in stunted rural Gambian children. European Journal of Clinical Nutrition 1998;52(3):213‐22. [DOI] [PubMed] [Google Scholar]
Haiti 2008 {published data only}
- Ruel MT, Menon P, Habicht JP, Loechl C, Bergeron G, Pelto G, et al. Age‐based preventive targeting of food assistance and behaviour change and communication for reduction of childhood undernutrition in Haiti: a cluster randomised trial. Lancet 2008;371(9612):588‐95. [DOI] [PubMed] [Google Scholar]
India 2001 {published data only}
- Bhandari N, Balh R, Nayvar B, Khokhar P, Rohde JE, Bhan MK. Food supplementation with encouragement to feed it to infants from 4 to 12 months of age has a small impact on weight gain. Journal of Clinical Nutrition 2001;131:1946‐51. [DOI] [PubMed] [Google Scholar]
Malawi 2004 {published data only}
- Maleta K, Kuittinen J, Duggan MB, Briend A, Manary M, Wales J, et al. Supplementary feeding of underweight, stunted Malawian children with a ready‐to‐use food. Journal of Pediatric Gastroenterology and Nutrition 2004;38(2):152‐8. [DOI] [PubMed] [Google Scholar]
Mexico 2004 {published data only}
- Rivera JA, Sotrez‐Alvarez D, Habicht JP, Shamah T, Villalpando S. Impact of the Mexican program for education, health, and nutrition (PROGRESA) on rates of growth and anemia in infants and young children. A randomized effectiveness study. JAMA 2004;291(21):2563‐70. [DOI] [PubMed] [Google Scholar]
Additional references
Aitchison 2005
- Aitchison TC. Personal communication (sending standard deviations from Beckett 2000 paper) to Jane Dennis 2005 (14 June).
Beaton 1982
- Beaton GH, Ghassemi H. Supplementary feeding programs for young children in developing countries. The American Journal of Clinical Nutrition 1982;35:864‐915. [DOI] [PubMed] [Google Scholar]
Black 2008
- Black RE, Allen LH, Bhutta ZA, Caulfield LE, Onis M, Ezzati M, et al. Maternal and child undernutrition: global and regional exposures and health consequences. Lancet 2008;371(9608):243‐60. [DOI] [PubMed] [Google Scholar]
BMJ 1995
- Cynthia D Mulrow. Systematic reviews. In: Chalmers I, Altman DG editor(s). BMJ Publishing Group. London: BMJ Publishing Group, 1995:1‐7. [Google Scholar]
Caulfield 1999
- Caufield LE, Huffman SL, Piwoz EG. Interventions to improve intake of complementary foods by infants 6 to 12 months of age in developing countries: impact on growth and on the prevalence of malnutrition and potential contribution on child survival. Food and Nutrition Bulletin 1999;20:183‐200. [Google Scholar]
Chalmers 1983
- Chalmers TC, Celano P, Sacks HS, Smith H Jr. Bias in treatment assignment in controlled clinical trials. New England Journal of Medicine 1983;309(22):1358‐61. [DOI] [PubMed] [Google Scholar]
de Onis 2011
- Onis M, Blo¨ssner M, Borghi E. Prevalence and trends of stunting among pre‐school children,1990–2020. Public Health Nutrition 2011;DOI:10.1017/S1368980011001315:1‐7. [DOI] [PubMed] [Google Scholar]
Dewey 2008
- Dewey KG, Adu‐Afarwuah S. Systematic review of the efficacy and effectiveness of complementary feeding interventions in developing countries. Maternal & Child Nutrition 2008;4 Suppl 1:24‐85. [DOI] [PMC free article] [PubMed] [Google Scholar]
Egger 1997
- Egger M, Davey‐Smith, Schneider M, Minder C. Bias in meta‐analysis detected by a simple, graphical test. BMJ 1997;315(7109):629‐34. [DOI] [PMC free article] [PubMed] [Google Scholar]
FNB 2009
Higgins 2002
- Higgings JPT, Thompson SG. Quantifying heterogeneity in a meta‐analysis. Statistics in Medicine 2002;21(11):1539‐58. [DOI] [PubMed] [Google Scholar]
Higgins 2009
- Higgins JPT, Green S, editors. Cochrane Handbook for Systematic Reviews of Interventions Version 5.0.2 [updated September 2009]. The Cochrane Collaboration, 2009. Available from www.cochrane‐handbook.org.
Lefebvre 2008
- Lefebvre C, Manheimer E, Glanville J. Chapter 6: Searching for studies. In: Higgins JPT, Green S editor(s). Cochrane Handbook for Systematic Reviews of Interventions. Chichester, UK: John Wiley & Sons, 2008. [Google Scholar]
Pocock 1990
- Pocock SJ. Clinical Trials: A Practical Approach. Chichester: John Wiley & Sons Ltd , 1990. [Google Scholar]
Rev Man 2011 [Computer program]
- The Nordic Cochrane Centre, The Cochrane Collaboration. Review Manager (RevMan). Version 5.1. Copenhagen: The Nordic Cochrane Centre, The Cochrane Collaboration, 2011.
UNICEF 2009
- United Nations Children's Fund (UNICEF). Tracking progression on child and Maternal Nutrition. A Survival and Development Priority. New York: UNICEF, 2009. [Google Scholar]
Victora 2008
- Victora CG, Adair L, Fall C, Hallat PC, Martorell R, Ritcher L, et al. Maternal and child undernutrition: consequences for adult health and human capital. Lancet 2008;371(9609):340‐57. [DOI] [PMC free article] [PubMed] [Google Scholar]
Victora 2010
- Victora CG, Onis M, Hallal PC, Blössner M, Shrimpton R. Worldwide timing of growth faltering: revisiting implications for interventions. Pediatrics 2010;125(3):e473‐80. [DOI] [PubMed] [Google Scholar]
Villar 1996
- Villar J, Carroli G. Methodological issues of randomized controlled trials for the evaluation of reproductive health interventions. Preventive Medicine 1996;25(3):365‐75. [DOI] [PubMed] [Google Scholar]
WHO 1999
- World Health Organization. A Critical Link: Interventions for Physical Growth and Psychological Development. Geneva: World Health Organization, 1999. [Google Scholar]
References to other published versions of this review
Sguassero 2005
- Sguassero Y, Onis M, Carroli G. Community‐based supplementary feeding for promoting the growth of young children in developing countries. Cochrane Database of Systematic Reviews 2005, Issue 4. [DOI: 10.1002/14651858.CD005039.pub2] [DOI] [PubMed] [Google Scholar]
Sguassero 2007
- Sguassero Y, Onis M, Carroli G. Effectiveness of supplementary feeding in developing countries: a systematic review [Efectividad de la alimentación suplementaria en países en vías de desarrollo: revisión sistemática]. Archivos Argentinos de Pediatría 2007;105(3):198‐205. [Google Scholar]