

Abstract
Background
Aphasia is an acquired language impairment following brain damage that affects some or all language modalities: expression and understanding of speech, reading, and writing. Approximately one third of people who have a stroke experience aphasia.
Objectives
To assess the effects of speech and language therapy (SLT) for aphasia following stroke.
Search methods
We searched the Cochrane Stroke Group Trials Register (last searched 9 September 2015), CENTRAL (2015, Issue 5) and other Cochrane Library Databases (CDSR, DARE, HTA, to 22 September 2015), MEDLINE (1946 to September 2015), EMBASE (1980 to September 2015), CINAHL (1982 to September 2015), AMED (1985 to September 2015), LLBA (1973 to September 2015), and SpeechBITE (2008 to September 2015). We also searched major trials registers for ongoing trials including ClinicalTrials.gov (to 21 September 2015), the Stroke Trials Registry (to 21 September 2015), Current Controlled Trials (to 22 September 2015), and WHO ICTRP (to 22 September 2015). In an effort to identify further published, unpublished, and ongoing trials we also handsearched the International Journal of Language and Communication Disorders (1969 to 2005) and reference lists of relevant articles, and we contacted academic institutions and other researchers. There were no language restrictions.
Selection criteria
Randomised controlled trials (RCTs) comparing SLT (a formal intervention that aims to improve language and communication abilities, activity and participation) versus no SLT; social support or stimulation (an intervention that provides social support and communication stimulation but does not include targeted therapeutic interventions); or another SLT intervention (differing in duration, intensity, frequency, intervention methodology or theoretical approach).
Data collection and analysis
We independently extracted the data and assessed the quality of included trials. We sought missing data from investigators.
Main results
We included 57 RCTs (74 randomised comparisons) involving 3002 participants in this review (some appearing in more than one comparison). Twenty‐seven randomised comparisons (1620 participants) assessed SLT versus no SLT; SLT resulted in clinically and statistically significant benefits to patients' functional communication (standardised mean difference (SMD) 0.28, 95% confidence interval (CI) 0.06 to 0.49, P = 0.01), reading, writing, and expressive language, but (based on smaller numbers) benefits were not evident at follow‐up. Nine randomised comparisons (447 participants) assessed SLT with social support and stimulation; meta‐analyses found no evidence of a difference in functional communication, but more participants withdrew from social support interventions than SLT. Thirty‐eight randomised comparisons (1242 participants) assessed two approaches to SLT. Functional communication was significantly better in people with aphasia that received therapy at a high intensity, high dose, or over a long duration compared to those that received therapy at a lower intensity, lower dose, or over a shorter period of time. The benefits of a high intensity or a high dose of SLT were confounded by a significantly higher dropout rate in these intervention groups. Generally, trials randomised small numbers of participants across a range of characteristics (age, time since stroke, and severity profiles), interventions, and outcomes.
Authors' conclusions
Our review provides evidence of the effectiveness of SLT for people with aphasia following stroke in terms of improved functional communication, reading, writing, and expressive language compared with no therapy. There is some indication that therapy at high intensity, high dose or over a longer period may be beneficial. HIgh‐intensity and high dose interventions may not be acceptable to all.
Keywords: Humans, Language Therapy, Social Support, Speech Therapy, Aphasia, Aphasia/etiology, Aphasia/therapy, Randomized Controlled Trials as Topic, Stroke, Stroke/complications
Plain language summary
Speech and language therapy for language problems after a stroke
Review question
We reviewed the evidence of the effect of speech and language therapy (SLT) on language problems experienced by people after a stroke (known as aphasia).
Background
About a third of people who suffer a stroke develop aphasia. One or more areas of communication can be affected: speaking, oral comprehension, reading, and writing. Speech and language therapists assess, diagnose, and treat aphasia at all stages of recovery after stroke. They work closely with the person with aphasia, families, and other healthcare professionals. We wanted to see whether SLT for aphasia was effective and whether it was better or worse than non‐specialist social support. We also wanted to see which approaches to therapy offered the best recovery.
Study characteristics
The evidence is current to September 2015. We found and included 57 studies involving 3002 people with aphasia in our review. We reviewed all SLT types, regimens, and methods of delivery.
Key results
Based on 27 studies (and 1620 people with aphasia), speech and language therapy benefits functional use of language, language comprehension (for example listening or reading), and language production (speaking or writing), when compared with no access to therapy, but it was unclear how long these benefits may last.
There was little information available to compare SLT with social support. Information from nine trials (447 people with aphasia) suggests there may be little difference in measures of language ability. However, more people stopped taking part in social support compared with those that attended SLT.
Thirty‐eight studies compared two different types of SLT (involving 1242 people with aphasia). Studies compared SLT that differed in therapy regimen (intensity, dosage and duration), delivery models (group, one‐to‐one, volunteer, computer‐facilitated), and approach. We need more information on these comparisons. Many hours of therapy over a short period of time (high intensity) appeared to help participants' language use in daily life and reduced the severity of their aphasia problems. However, more people stopped attending these highly intensive treatments (up to 15 hours a week) than those that had a less intensive therapy schedule.
Quality of the evidence
Generally, the quality of the studies conducted and reported could be improved. Key quality features were only reported by half of the latest trials. Thus, it is unclear whether this was the result of poorly conducted studies or poorly reported studies. Most comparisons we made would benefit from the availability of more studies involving more people with aphasia.
Summary of findings
Summary of findings for the main comparison. Summary of findings: SLT versus no SLT (immediate outcome).
| SLT versus no SLT for aphasia following stroke (immediate outcomes) | ||||
|
Patient or population: adults with aphasia following stroke Intervention: SLT Comparison: no SLT | ||||
| Outcomes | No of participants (trials) | Relative effect (95% CI) | Direction of effect | Quality of the evidence (GRADE) |
| Functional communication | 376 participants (10 trials) | SMD: 0.28 (0.06 to 0.49) | Favours SLT | ⊕⊕⊕⊝ Moderatea,b |
|
Receptive language: auditory comprehension |
399 participants (9 trials) |
SMD: 0.06 (−0.15 to 0.26) | No evidence of benefit or harm |
⊕⊕⊝⊝ Lowa,b,c |
|
Receptive language: reading comprehension |
253 participants (8 trials) |
SMD: 0.29 (0.03 to 0.55) | Favours SLT | ⊕⊕⊕⊝ Moderatea,b |
|
Expressive language: naming |
275 participants (7 trials) |
SMD: 0.14 (−0.10 to 0.38) | No evidence of benefit or harm |
⊕⊕⊝⊝ Lowa,b,c |
|
Expressive language: general |
248 participants (7 trials) |
SMD: 1.28 (0.38 to 2.19) | Favours SLT | ⊕⊕⊕⊝ Lowa,b,c |
|
Expressive language: written |
253 participants (8 trials) |
SMD: 0.41 (0.14 to 0.67) | Favours SLT | ⊕⊕⊕⊝ Moderatea,b |
|
Number of dropouts (for any reason) |
921 (13 trials) |
OR: 0.89 (0.64 to 1.25) | No evidence of benefit or harm |
⊕⊕⊕⊝ Moderatea,b |
| CI: confidence interval; OR: odds ratio; SMD: standardised mean difference. | ||||
| GRADE Working Group grades of evidence High quality: Further research is very unlikely to change our confidence in the estimate of effect. Moderate quality: Further research is likely to have an important impact on our confidence in the estimate of effect and may change the estimate. Low quality: Further research is very likely to have an important impact on our confidence in the estimate of effect and is likely to change the estimate. Very low quality: We are very uncertain about the estimate. | ||||
aDowngraded 1 level from high to moderate as there were serious limitations identified in the risk of bias (either unclear randomisation sequence, unclear or high risk of bias for allocation concealment, or both in 1 or more of the trials). bSee notes about dropouts. cDowngraded 1 level of evidence as wide confidence intervals identified.
Summary of findings 2. Summary of findings: SLT versus no SLT (follow‐up at 6 months).
| SLT compared versus no SLT for aphasia following stroke at 6 months follow‐up | ||||
|
Patient or population: adults with aphasia following stroke Intervention: SLT Comparison: no SLT | ||||
| Outcomes | No of participants (trials) | Relative effect (95% CI) | Direction of effect | Quality of the evidence (GRADE) |
|
Functional communication (6 months follow‐up) |
111 participants (2 trials) |
SMD: 0.19 (−0.80 to 1.18) | No evidence of benefit or harm |
⊕⊝⊝⊝ Very lowa,b,c |
|
Receptive language: auditory comprehension (6 months follow‐up) |
111 participants (2 trials) |
MD: 1.38 (−1.39 to 4.15) | No evidence of benefit or harm |
⊕⊝⊝⊝ Very lowa,b,c |
|
Expressive language: naming (6 months follow‐up) |
111 participants (3 trials) |
SMD: 0.07 (−0.59 to 0.73) | No evidence of benefit or harm |
⊕⊝⊝⊝ Very lowa,b,c |
|
Number of dropouts (for any reason) |
322 (6 trials) |
OR: 0.73 (0.38 to 1.39) | No evidence of benefit or harm |
⊕⊕⊕⊝ Moderatea,c |
| CI: confidence interval; MD: mean difference; SMD: standardised mean difference. | ||||
| GRADE Working Group grades of evidence High quality: Further research is very unlikely to change our confidence in the estimate of effect. Moderate quality: Further research is likely to have an important impact on our confidence in the estimate of effect and may change the estimate. Low quality: Further research is very likely to have an important impact on our confidence in the estimate of effect and is likely to change the estimate. Very low quality: We are very uncertain about the estimate. | ||||
aSerious limitations identified in the risk of bias. bLow number of studies/participants. cSee notes about dropouts.
Summary of findings 3. Summary of findings: SLT versus social support and stimulation.
| SLT versus social support and stimulation for aphasia following stroke | ||||
|
Patient or population: adults with aphasia following stroke Intervention: SLT Comparison: social support and stimulation | ||||
| Outcomes | No of participants (trials) | Relative effect (95% CI) | Direction of effect | Quality of the evidence (GRADE) |
| Functional communication | — | Not estimable | — | Not appropriate to pool the evidence as the data is reported using different outcome measures |
|
Expressive language: naming |
33 participants (3 studies) |
SMD: 1.24 (−1.70 to 4.18) | No evidence of benefit or harm |
⊕⊝⊝⊝ Very lowa,b,c |
|
Number of dropouts for any reason |
413 participants (5 studies) |
OR: 0.51 (0.32 to 0.82) | Favours SLT | ⊕⊕⊝⊝ Lowa,c |
| CI: confidence interval; OR: odds ratio; SMD: standardised mean difference. | ||||
| GRADE Working Group grades of evidence High quality: Further research is very unlikely to change our confidence in the estimate of effect. Moderate quality: Further research is likely to have an important impact on our confidence in the estimate of effect and may change the estimate. Low quality: Further research is very likely to have an important impact on our confidence in the estimate of effect and is likely to change the estimate. Very low quality: We are very uncertain about the estimate. | ||||
aSerious limitations identified in the risk of bias. bLow number of studies/participants. cSee notes about dropouts.
Summary of findings 4. Summary of findings: SLT A versus SLT B for functional communications outcomes.
| SLT A versus SLT B for aphasia following stroke for functional communication | |||||
|
Patient or population: adults with aphasia following stroke Intervention: SLT A Comparison: SLT B | |||||
| Outcome | SLT comparison | No of participants (trials) | Relative effect (95% CI) | Direction of effect | Quality of the evidence (GRADE) |
| Functional communication | High‐intensity SLT versus low‐intensity SLT |
84 participants (2 trials) |
MD: 11.75 (4.09 to 19.40) | Favours high‐intensity SLT | ⊕⊕⊝⊝ Lowa,b,c |
| Short duration SLT versus long duration SLT |
50 participants (2 trials) |
SMD: 0.81 (0.23, 1.40) | Favours long duration of therapy |
⊕⊝⊝⊝ Very lowa,b,c | |
| Group SLT compared to one‐to‐one SLT |
46 participants (3 trials) |
SMD: 0.41 (−0.19 to 1.00) | No evidence of benefit or harm |
⊕⊝⊝⊝ Very lowa,b,c | |
| Computer‐mediated versus professional SLT |
55 participants (3 trials) |
SMD: 0.44 (−0.10 to 0.98) | No evidence of benefit or harm |
⊕⊝⊝⊝ Very lowa,b,c | |
| Constraint‐induced aphasia therapy versus other SLT |
126 participants (3 trials) |
SMD: 0.15 (−0.21 to 0.50) | No evidence of benefit or harm |
⊕⊕⊝⊝ Lowa,b | |
| CI: confidence interval; MD: mean difference; SMD: standardised mean difference. | |||||
| GRADE Working Group grades of evidence High quality: Further research is very unlikely to change our confidence in the estimate of effect. Moderate quality: Further research is likely to have an important impact on our confidence in the estimate of effect and may change the estimate. Low quality: Further research is very likely to have an important impact on our confidence in the estimate of effect and is likely to change the estimate. Very low quality: We are very uncertain about the estimate. | |||||
aSee notes about dropouts. bLow number of studies/participants. cSerious limitations identified in the risk of bias in 1 or more of the included trials.
Summary of findings 5. Summary of findings: SLT A versus SLT B for severity of impairment outcomes.
| SLT A versus SLT B for aphasia following stroke for severity of impairment | |||||
|
Patient or population: adults with aphasia following stroke Intervention:SLT A Comparison:SLT B | |||||
| Outcome | SLT comparison | No. of Participants (trials) | Relative effect (95% CI) | Direction of Effect | Quality of the evidence (GRADE) |
| Severity of impairment | High‐intensity SLT versus low‐intensity SLT |
187 participants (5 trials) |
SMD: 0.38 (0.07 to 0.69) | Favours high‐intensity SLT | ⊕⊕⊕⊝ Moderatea,c |
| High dose SLT versus low dose SLT |
145 participants (3 trials) |
SMD: 0.35 (−0.16 to 0.85) | No evidence of benefit or harm |
⊕⊕⊝⊝ Lowa,b,c | |
| Short duration SLT versus long duration SLT |
98 participants (4 trials) |
SMD: 0.22 (−0.26 to 0.71) | No evidence of benefit or harm |
⊕⊕⊝⊝ Lowa,b,c | |
| Group SLT compared to one‐to‐one SLT |
122 participants (4 trials) |
SMD: 0.15 (−0.21 to 0.50) | No evidence of benefit or harm |
⊕⊕⊝⊝ Lowa,b,c | |
| Constraint‐induced aphasia therapy versus other SLT |
34 participants (2 trials) |
SMD: 0.11 (−0.57 to 0.79) | No evidence of benefit or harm |
⊕⊝⊝⊝ Very lowa,b,c | |
| CI: Confidence interval; MD: Mean difference; OR: Odds ratio; SMD: Standardised mean difference. | |||||
| GRADE Working Group grades of evidence High quality: Further research is very unlikely to change our confidence in the estimate of effect. Moderate quality: Further research is likely to have an important impact on our confidence in the estimate of effect and may change the estimate. Low quality: Further research is very likely to have an important impact on our confidence in the estimate of effect and is likely to change the estimate. Very low quality: We are very uncertain about the estimate. | |||||
aSee notes about dropouts. bLow number of studies/participants. cSerious limitations identified in the risk of bias in one or more of the included trials.
Background
Description of the condition
The term aphasia (less commonly referred to as dysphasia) is used to describe an acquired loss or impairment of the language system following brain damage (Benson 1996). Usually associated specifically with language problems arising after a stroke, it excludes other communication difficulties attributed to sensory loss, confusion, dementia or speech difficulties due to muscular weakness or dysfunction, such as dysarthria. The most common cause of aphasia is a stroke (or cerebrovascular accident), mainly to the left hemisphere, where the language function of the brain is usually situated for right‐handed people. About a third of all people who experience a stroke develop aphasia (Engelter 2006; Laska 2001). The aphasic population is heterogeneous, with individual profiles of language impairment varying in terms of severity and degree of involvement across the modalities of language processing, including the expression and comprehension of speech, reading, writing, and gesture (Code 2003; Parr 1997). Variation in the severity of expressive impairments, for example, may range from the individual experiencing occasional word‐finding difficulties to having no effective means of verbal communication. The severity of aphasia can also change over time as one aspect of language difficulty may improve while others remain impaired. The impact and the consequential implications of having aphasia for the individuals themselves, their families, and society highlight the importance of the effective management and rehabilitation of language difficulties caused by aphasia.
Description of the intervention
The primary aim of speech and language therapy (SLT)* in aphasia management and rehabilitation is to maximise individuals' language and communication abilities, activity, and participation. Speech and language therapists are typically responsible for the assessment, diagnosis, and, where appropriate, rehabilitation of aphasia arising as a result of stroke. The ability to successfully communicate a message via spoken, written, or non‐verbal modalities (or a combination of these) within day‐to‐day interactions is known as functional communication. Recent developments have seen speech and language therapists working closely with the person with aphasia, and in partnership with their families and caregivers, to maximise the individual's functional communication and participation.
* For the purposes of clarity within this review we have reserved SLT as an abbreviation for speech and language therapy alone.
Why it is important to do this review
There is no universally accepted treatment that can be applied to every person with aphasia, and typically therapists select from a variety of theoretical approaches, delivery models, and intervention regimens to manage and facilitate rehabilitation. We undertook this 2016 review update to incorporate new evidence and systematic review methodologies and to reflect recent developments in clinical practice. A summary of the differences between the 2016 version and the original 1999 review is presented in Differences between protocol and review.
Objectives
To assess the effects of speech and language therapy (SLT) for aphasia following stroke. In particular, we aimed to investigate whether:
SLT is more effective than no SLT;
SLT is more effective than social support and stimulation;
one SLT intervention (SLT A) is more effective than another SLT intervention (SLT B).
SLT intervention A or B refers to variations in intervention that differ in duration, intensity, frequency, method, or theoretical basis (e.g. early SLT versus delayed SLT interventions).
Methods
Criteria for considering studies for this review
Types of studies
Randomised controlled trials (RCTs) that evaluated one or more SLT interventions designed to improve language or communication. We included trials that recruited participants with mixed aetiologies or impairments provided it was possible to extract the data specific to individuals with poststroke aphasia. We did not employ any language restriction.
Types of participants
Adults (as defined by the trialists) who had acquired aphasia as a result of a stroke, and families of participating stroke survivors.
Types of interventions
In a change from the 1999 version of the review, all subsequent updates compressed the intervention into three broad groups. We included trials that reported a comparison between a group that received an SLT intervention designed to have an impact on communication and a group that received:
no SLT intervention;
social support and stimulation; or
an alternative SLT intervention.
SLT
We considered SLT interventions to be any form of targeted practice tasks or methodologies with the aim of improving language or communication abilities, activities, or participation. These are typically delivered by speech and language therapists. In the UK, 'speech and language therapist' is a protected professional title and refers to individuals holding a professional qualification recognised by the Royal College of Speech and Language Therapists and registered with the Health and Care Professions Council, UK. For the purposes of this review, we extended this definition to include therapists belonging to a body of similar professional standing elsewhere in the world.
We are aware that the SLT profession does not exist in many countries. In trials conducted in such settings, where other clinical staff (e.g. medical or nursing staff) led targeted interventions that aimed to improve participants' communicative functioning, we included these interventions within this review as SLT interventions. We planned a sensitivity analysis of the impact of professional SLT training on the provision of an intervention where data allowed.
We also recognise that current rehabilitation practice may include SLT interventions that aim to improve communicative functioning but are delivered by non‐therapists (family members, SLT assistants, SLT students, voluntary support groups). Where those delivering the intervention received training from a speech and language therapist and delivered an intervention designed by a speech and language therapist, we described these as volunteer‐facilitated SLT interventions.
Social support and stimulation
Social support and stimulation refers to an intervention that provides social support or stimulation but does not include targeted therapeutic interventions that aim to resolve participants' expressive or receptive speech and language impairments. Interventions in this category might include, for example, emotional, psychological, or creative interventions (such as art, dance, or music) as delivered by other healthcare professionals (e.g. art, physical, or music therapists). Other social stimulation interventions, such as conversation or other informal, unstructured communicative interactions, are also included in this category.
We did not include pharmacological interventions for aphasia as they are addressed within a separate review (Greener 2001). We also excluded magnetic or electrical stimulation interventions (e.g. transcranial direct current stimulation (tDCS), transcranial magnetic stimulation, or epidural cortical stimulation) or auditory temporal processing training procedures, as we considered these to be adjuncts to SLT rather than an SLT approach. The effectiveness of tDCS interventions for aphasia is addressed within a separate review (Elsner 2012).
Types of outcome measures
Primary outcomes
The primary outcome chosen to indicate the effectiveness of an intervention that aims to improve communicative ability must reflect communication activity in real world settings, that is, functional communication. Providing a definition for the concept of functional communication is problematic and makes evaluation difficult. The ability to functionally communicate relates to language or communicational skills sufficient to permit the transmission of a message via spoken, written, or non‐verbal modalities, or through a combination of these channels. Success is typically and naturalistically demonstrated through successful communication of the message ‐ the speaker communicates their message, and the listener understands the message communicated. Attempts to measure this communication success formally vary from analysis of discourse interaction in real life or sampling of discourse during specific tasks (known as discourse analysis). Other more formal tools might include the Communicative Abilities of Daily Living (CADL) or the Communicative Effectiveness Index (CETI) (Holland 1980; Lomas 1989).
Secondary outcomes
Given the lack of a comprehensive, reliable, valid, and globally accepted functional communication evaluation tool, surrogate outcome measures of communication impairment (or ability) include formal measures of receptive language (oral, written and gestural), expressive language (oral, written and gestural) or overall level of severity of aphasia where receptive and expressive language are measured using language batteries. Such tools might include, for example, the Western Aphasia Battery (WAB) or the Porch Index of Communicative Abilities (PICA) (Kertesz 1982; Porch 1967). Other secondary outcomes of relevance to this review include psychosocial impact (i.e. impact on psychological or social well‐being including mood, depression, anxiety, and distress), satisfaction with intervention, number of dropouts (i.e. the number of participants dropping out at treatment or follow‐up phases for any reason), adherence to allocated intervention (i.e. the number of participants voluntarily withdrawing from their allocated intervention), economic outcomes (such as costs to the patient, caregivers, families, health service, and society) and caregiver and family quality of life. We extracted measures of overall functional status (e.g. Barthel) in the original review as one of a number of primary outcomes. We also extracted these data, where available, as an indicator of overall severity of stroke, but this information is now presented as a patient descriptor within the Characteristics of included studies table. A full list of outcome measures included in the review and their references can be found in Appendix 1.
Search methods for identification of studies
See the 'Specialized register' section in the Cochrane Stroke Group module. We did not impose any language restrictions.
Electronic searches
We searched the Cochrane Stroke Group Trials Register (last searched 9 September 2015), CENTRAL (2015, Issue 5) and other Cochrane Library Databases (CDSR, DARE, HTA, to 22 September 2015) (Appendix 2), MEDLINE (1946 to September 2015) (Appendix 3), EMBASE (1980 to September 2015) (Appendix 4), CINAHL (1982 to September 2015) (Appendix 5), AMED (1985 to September 2015) (Appendix 6), LLBA (1973 to September 2015), and SpeechBITE (2008 to September 2015) using comprehensive search strategies.
We also searched major trials registers for ongoing trials including ClinicalTrials.gov (to 21 September 2015) (http://www.clinicaltrials.gov/), the Stroke Trials Registry (to 21 September 2015) (www.strokecenter.org/trials/), Current Controlled Trials (to 22 September 2015) (www.controlled‐trials.com), and WHO ICTRP (http://www.who.int/ictrp/search/en/) (to 22 September 2015).
Searching other resources
We handsearched the International Journal of Language and Communication Disorders (formerly the International Journal of Disorders of Communication, the European Journal of Disorders of Communication, and the British Journal of Disorders of Communication) from 1969 to December 2005. Since 2006, this journal has been indexed in MEDLINE so our comprehensive electronic search identified any relevant trials published in the journal after that date.
We checked reference lists of all relevant articles to identify other potentially relevant randomised studies.
We contacted all British universities and colleges where speech and language therapists receive training and all relevant Special Interest Groups in the UK to enquire about any relevant published, unpublished, or ongoing studies.
We approached colleagues and authors of relevant randomised trials to identify additional studies of relevance to this review.
Data collection and analysis
Selection of studies
Our selection criteria for inclusion in this review were as follows.
Study participants included people with aphasia as a result of stroke, together with their families.
The SLT intervention was designed to have an impact on communication.
The methodological design was a randomised controlled trial.
One review author (PC) screened titles and abstracts of the records identified through the electronic searches described above and excluded obviously irrelevant studies. We obtained full‐text copies of all the remaining studies that fulfilled the listed inclusion criteria. Two review authors (MB and PC) independently assessed the studies based on the inclusion criteria and decided whether to include or exclude studies. We resolved any disagreements through discussion and involvement of the wider review team. Studies judged ineligible for inclusion, together with reasons for their exclusion, are listed in the Characteristics of excluded studies table.
Data extraction and management
We created and piloted an electronic data extraction tool for use in this 2016 review update. Two review authors (MB and PC) independently confirmed the data for the trials included and extracted the data for the additional trials included in this update. We resolved any disagreements through discussion. We extracted many data elements, including: number and location of sites, methods of randomisation, blinding, attrition from intervention, co‐interventions, confounder details, number of participants, age, education, handedness, sex, native language, severity of aphasia, time post onset, inclusion and exclusion criteria, details of intervention in accordance with the template for intervention description and replication (TIDieR) checklist (Hoffmann 2014), outcome measures and time points used, evidence of an a priori sample size calculation, intention‐to‐treat (ITT) analysis, and summary data. We attempted to contact investigators for any missing data (or data in a suitable format) for inclusion in the review.
Where we identified a cross‐over trial, we based decisions relating to the suitability of the data (either up to or beyond the cross‐over phase) on careful consideration of a range of factors including the intervention(s) used, the timing of the intervention(s), the impact of any treatment carryover, and whether data from relevant paired comparisons within the trial were available. Whenever possible, in such cases we sought individual patient data.
Assessment of risk of bias in included studies
We assessed the trials for methodological quality, paying attention to whether there was protection from the following types of bias: selection bias (i.e. true random sequencing and true concealment up to the time of allocation), performance bias (i.e. differences in co‐interventions between the groups), attrition bias (i.e. withdrawal after trial entry), and detection bias (i.e. 'unmasked' assessment of outcome). We coded concealed allocation as 'low risk', 'unclear' or 'high risk' according to the Cochrane Handbook for Systematic Reviews of Interventions (Higgins 2011). In addition, we extracted information on whether trialists employed power calculations and ITT analyses. In some cases, for example where all participants were accounted for in the final results, this was not applicable.
Measures of treatment effect
We conducted the review using Review Manager 5 (RevMan) for statistical analysis (RevMan 2014). We recorded descriptive information for each trial (characteristics of participants, interventions, and outcomes) in the Characteristics of included studies table and issues relating to the methodological quality of the trial in the 'Risk of bias' tables. Where trials made a similar comparison and appeared to be sufficiently similar with respect to their descriptive information, we pooled the summary data (where available) using meta‐analysis. We expressed continuous data as differences in means or standardised difference in means and dichotomised data as odds ratios (OR). We used 95% confidence intervals (CI) throughout the review.
The results of the trials in this review reported measures based on differences in final value scores (scores taken at the end of the intervention) and change‐from‐baseline scores (also known as change scores). Although the mean differences (MD) based on change‐from‐baseline scores in randomised trials can generally be assumed to address the same intervention effects as MD analysis based on final value scores, change‐from‐baseline scores are given higher weights in analysis than final value scores (Higgins 2011). For this reason, we have used final value scores within the meta‐analyses wherever possible. We do not report change‐from‐baseline scores unless they were the only available values (Higgins 2011).
Assessment of heterogeneity
We assessed heterogeneity using the I2 statistic, where any heterogeneity observed may be considered moderate (an I2 value of 30% to 60%), substantial (50% to 90%) or considerable (75% to 100%) (Higgins 2011). Where we observed important heterogeneity (based of the I2 value together with significant evidence of heterogeneity as per the Chi2 test P value), we used a random‐effects model (Higgins 2011).
Data synthesis
Where a single outcome measure was assessed and reported across trials using different measurement tools, we presented these data in a meta‐analysis using a standardised mean difference (SMD) summary statistic. In cases where the direction of measurement differed, it was necessary to adjust the direction of some measures to ensure that all the scales operated in the same direction. For example, measures of comprehension ability generally increase with increasing ability, but in some cases (e.g. the Token Test) improving comprehension skills might be reflected by decreasing scores, so it was necessary to multiply the mean values by −1 to ensure that all the scales operated in the same direction. This method did not affect standard deviation (SD) values, and we have presented these within the meta‐analyses without the need for a directional change.
In cases where trials only reported partial summary data, for example mean final value scores but not SDs (for example Wertz 1981), we attempted to calculate these values from available information. When this was not possible, we imputed the SD to facilitate inclusion of the trial within the review by using a SD value from a similar participant group (Higgins 2011). We have reported details of the source of any imputed SD values within the text. Where there was a choice of possible SD values, we imputed the highest and lowest values to ensure that both methods provided a similar overall conclusion and then used the highest value in the presentation of the trial within the forest plot.
Where results in a particular comparison were only available in a mixture of final value and change‐from‐baseline scores, we presented these data graphically using SMDs, but we were unable to pool these results in a meta‐analysis.
Subgroup analysis and investigation of heterogeneity
We did not plan any subgroup analyses.
Sensitivity analysis
The original 1999 review did not include any planned sensitivity analyses. However, we aimed to reflect developments in clinical practice including trials where SLT interventions were delivered or facilitated by non‐speech and language therapists. We planned to conduct sensitivity analyses to evaluate any impact the inclusion of these groups of trials may have had on the results of the review and the impact of trial quality.
Results
Description of studies
The 1999 version of this review included 12 trials, including Kinsey 1986 and Hartman 1987. Following access to unpublished data from the authors, we excluded quasi‐randomised trials such as Hartman 1987. We also excluded Kinsey 1986, which is a comparison of methods of providing therapy materials rather than a comparison of therapy interventions. Thus, of the 12 trials included in the 1999 review, 10 trials remained in the subsequent review updates. We identified an additional 46 trials in the search updates, and we revised the decision to exclude one other trial, Shewan 1984, from the original review following communication with the trialists, who confirmed that it was an RCT. This updated review is based on data from a total of 57 included trials.
Results of the search
Our search strategy identified 11,314 records from electronic databases. The flow of literature through the searching and screening process is shown in the PRISMA flow diagram (Figure 1). Details of the information requested from the authors of included trials, and whether this was obtained, are given in the Characteristics of included studies table.
1.

Study flow diagram.
Following our updated search, we identified 18 new trials (23 randomised comparisons) for inclusion in this 2016 review update (B.A.Bar 2011i; B.A.Bar 2011ii; CACTUS 2013; Conklyn 2012; Crosson 2014; FUATAC; Mattioli 2014; MIT 2014i; MIT 2014ii; NARNIA 2013; SEMaFORE; Sickert 2014; SP‐I‐RiT; Szaflarski 2014; Varley 2016i; Varley 2016ii; VERSE II; Wilssens 2015; Woolf 2015i; Woolf 2015ii; Woolf 2015iii; Wu 2013; Xie 2002). In addition we identified 18 ongoing studies (TNT ‐ ACTRN12614000081617; ASK; Big CACTUS; CATChES; COMPARE; Nehra ‐ CTRI/2014/04/004554; FCET2EC; IMITATE; Kukkonen 2007; LIFT 2014; MIT USA; Kurland ‐ NCT02012374; ORLA‐Write; Osborne 2012; PMvSFA; RATS‐3; U‐Health; VERSE III); these are likely to be eligible for inclusion in the review at a later date. These studies are detailed in the Characteristics of ongoing studies table.
Included studies
We included a total of 57 trials involving 3002 participants in this review. Several trials contributed to more than one comparison and so numbers of participants contributing to each comparison should be considered separately (SLT versus no SLT N = 1620; SLT versus social support and stimulation N = 447; SLT A versus SLT B N = 1242) and cannot be summed across comparisons.
Ten trials randomised individuals across three or more groups (trial arms) but for the purposes of this review and the meta‐analyses we have presented and pooled the data within randomised paired comparisons indicated as i, ii or iii. For example, data from Yao 2005 are presented across three 'trials' of SLT versus no SLT (Yao 2005i), individual SLT versus no SLT (Yao 2005ii) and SLT versus individual SLT (Yao 2005iii). Other trials affected were B.A.Bar 2011i,B.A.Bar 2011ii,Katz 1997i,Katz 1997ii,Lincoln 1982i,Lincoln 1982ii,Lincoln 1982iii,MIT 2014i,MIT 2014ii,Shewan 1984i,Shewan 1984ii,Shewan 1984iii,Smith 1981i,Smith 1981ii,Smith 1981iii,Varley 2016i,Varley 2016ii,Wertz 1986i,Wertz 1986ii,Wertz 1986iii,Woolf 2015i,Woolf 2015ii,Woolf 2015iii,Zhang 2007i, and Zhang 2007ii. In other cases where a single research group published different trials within the same year; these are indicated as for example Lincoln 1984a, and Lincoln 1984b. Further details can be found in the Characteristics of included studies. In the 'duplicate' trials, there was a risk of including the same group of participants (usually the control group) twice in a single meta‐analysis, so we split the number of participants in the control group across the two 'trials' that shared that comparison group (Higgins 2011). In the case of continuous data, the mean and SD values remained the same. In the case of dichotomous data, we split both the number of events and total number of patients across the relevant number of arms. In keeping with previous reviews where this method has been used and for ease of reading, these paired randomised comparisons will be referred to as trials from this point onwards.
Thirteen trials employed a cross‐over design (B.A.Bar 2011i; B.A.Bar 2011ii; Crerar 1996; Elman 1999; Lincoln 1982i; Lincoln 1982ii; Lincoln 1982iii; Lincoln 1984b; Varley 2016i; Varley 2016ii; Wertz 1986i; Wertz 1986ii; Wertz 1986iii). We carefully considered the suitability of each cross‐over trial for inclusion within the review. We considered factors including the suitability of the design, the intervention(s) used, the timing of the intervention(s), the impact of any treatment carry‐over and finally whether data from relevant paired comparisons from the cross‐over data were available. For eight trials we extracted data up to the point of cross‐over (B.A.Bar 2011i; Crerar 1996; Elman 1999; Lincoln 1982iii; Lincoln 1984b; Varley 2016i; Wertz 1986i; Wertz 1986ii). In some cases though, the treatment that participants were allocated to receive following cross‐over was 'no SLT' or similar. In these cases, the 'no SLT' input after cross‐over could be used as a follow‐up period or deferred delivery of therapy (e.g. B.A.Bar 2011ii; Varley 2016ii).
In contrast, Lincoln 1982 was also a cross‐over trial in design, with participants randomly allocated to one of four groups with a sequence of interventions that included one active treatment or placebo, either preceded by or followed by conventional SLT. We were able to access the unpublished individual patient trial data for this review. This access to the data, the design, nature and manner of SLT delivery within the trial and the clinical relevance of the comparisons made it possible to include two paired comparisons of those groups within the review.
SLT + operant training versus SLT + social support (Lincoln 1982i).
Operant training + SLT versus social support + SLT (Lincoln 1982ii).
Taking the individual data at the point of measurement prior to the cross‐over, it was also possible to extract and compare the data from those that had received conventional SLT and compare it to those participants that received a social support and stimulation intervention (Lincoln 1982iii).
We present data from 73 randomised comparisons as they relate to the effectiveness of SLT for aphasia following stroke, which compare: SLT versus no SLT, SLT versus social support and stimulation, and SLT A versus SLT B. We have presented details of data within each comparison below with further details on each trial available in the Characteristics of included studies table. Details of participants (age, sex, time since stroke, and aphasia severity by trial (Table 6)), SLT interventions (Appendix 7), and assessment tools (Appendix 1) by randomised group are also available. A summary of the findings is available at the end of the Results section (Table 1; Table 2; Table 3; Table 4; Table 5).
1. Characteristics of participants in included studies.
| Study ID | No of participants | Male/female |
Age in years Mean (standard deviation) (range) |
Time post onset Mean (standard deviation) (range) |
Aphasia severity Mean (standard deviation) |
| ACTNoW 2011 | 153 | SLT: 40/36 Social support: 42/35 |
SLT: 71 (range 32‐97) Social support: 70 (range 40‐92) |
Admission to randomisation median 12 (IQR 9‐16) days | TOMs SLT: 1.9 (SD 1.2) (severe N = 47) Social support: 1.9 (SD 1.1) (severe N = 51) |
| B.A.Bar 2011i | 18 | Supervised intensive language self training: 7/2 Visual‐cognitive tasks: 7/2 |
Supervised intensive language self training: 50 (range 30‐72) Visual‐cognitive tasks: 48 (range 40‐61) |
Supervised intensive language self training: 25 (range 12‐43) months Visual‐cognitive tasks: 28 (range 9‐53) months |
Supervised intensive language self training: 7 moderate/2 severe Visual‐cognitive tasks: 8 moderate/1 severe |
| B.A.Bar 2011ii | 18 | B.A.Bar early + visual‐cognitive exercises: 7/2 Supervised home training with visual‐cognitive exercises followed by delayed intensive language self training: 7/2 |
B.A.Bar early + visual‐cognitive exercises: 50 (range 30‐72) Supervised home training with visual‐cognitive exercises followed by delayed intensive language self training: 48 (range 40‐61) |
B.A.Bar early + visual‐cognitive exercises: 25 (range 12‐43) months Supervised home training with visual‐cognitive exercises followed by delayed intensive language self training: 28 (range 9‐53) months |
B.A.Bar early + visual‐cognitive exercises: 7 moderate/2 severe Supervised home training with visual‐cognitive exercises followed by delayed intensive language self training: 8 moderate/1 severe |
| Bakheit 2007 | 97 | Intensive: 26/25 Conventional: 21/25 | Intensive: 71.2 (SD 14.9; range 26‐92) Conventional: 69.7 (SD 15; range 17‐91) | Intensive: 34.2 (SD 19.1) days Conventional: 28.1 (SD 14.9) days | WABAQ Intensive: 44.2 (SD 30.2) Conventional: 37.9 (SD 27.2) |
| CACTUS 2013 | 33 (of 34 randomised) | Computer‐mediated word finding therapy: 9/7 No SLT: 12/5 |
Computer‐mediated word finding therapy: 69.5 (SD 12.2) No SLT: 66.2 (SD 12.3) |
Computer‐mediated word finding therapy: 6.2 (range 1‐29) years No SLT: 6.6 (range 1.8‐12.0) years |
Computer‐mediated word finding therapy: mild 9 (56.3%); moderate 5 (31.3%); severe 2 (12.5%) No SLT: mild 11 (64.7%); moderate 4 (23.5%); severe 2 (11.8%) |
| Conklyn 2012 | 30 | Modified MIT: 7/9 No SLT: 9/5 |
Modified MIT: 56.8 (SD 17.11) No SLT: 66.9 (SD 11.77) |
Modified MIT: 32.2 (SD 93.42) days No SLT: 28.4 (SD 67.84) days |
Happy Birthday repeated (% words) Modified MIT: 11.9 (SD 4.46) No SLT: 10.6 (SD 4.41) |
| Crerar 1996 | 8 | Verb SLT: 2/1 Preposition SLT: 5/0 |
Verb SLT: 50.3 (SD 8.5; range 44‐60) Preposition SLT: 48.8 (SD 13.77; range 27‐64) |
Verb SLT: 87.33 (SD 40.61; range 60‐134) months Preposition SLT: 66.4 (SD 20.96; range 39‐86) |
WABAQ Verb SLT: 76.2 (SD 9.81) Preposition SLT: 69.3 (SD 16.58) |
| Crosson 2014 | 14 | Naming therapy with gesture: 2/5 Conventional: 6/1 |
Naming therapy with gesture: 72.1 (SD 10.5) Conventional: 63.0 (SD 9.2) |
Naming therapy with gesture: 37.4 (SD 33.5; range 12‐87) months Conventional: 38.1 (SD 37.4; range 10‐112) months |
WABAQ Naming therapy with gesture: 65.5 (SD 8.3) Conventional: 71.9 (SD 11.8) |
| David 1982 | 133 (of 155 randomised) | Conventional: 35/30 Social support: 42/26 | Conventional: 70 (SD 8.7) Social support: 65 (SD 10.6) | Conventional: median 4 (range 4‐266) weeks Social support: median 5 (range 4‐432) weeks | Baseline FCP scores for N = 98 retained until post‐therapy test Conventional: 42.4 (SD 20.8) Social support: 46.1 (SD 20.1) |
| Denes 1996 | 17 | Intensive: 5/3 Conventional: 3/6 | Intensive: 58.1 (SD 11.8) Conventional: 62.1 (SD 8.7) | Intensive: 3.2 (SD 1.8) months Conventional: 3 (SD 1.6) months | AAT Intensive: severe Conventional: severe |
| Di Carlo 1980 | 14 | Programmed instruction: 7/0 Non‐programmed instruction: 7/0 | Programmed instruction: 57.6 (SD 9.2; range 44‐69) Non‐programmed instruction: 55.3 (SD 13; range 32‐70) | Programmed instruction: 24.7 (SD 23.6; range 0‐66) months Non‐programmed instruction: 16.3 (SD 16.9; range 1‐38) months | Programmed instruction: severe Non‐programmed instruction: severe |
| Doesborgh 2004 | 18 (of 19 randomised) | Computer‐mediated: 4/4 No SLT: 5/5 | Computer‐mediated: 62 (SD 9.0) No SLT: 65 (SD 12.0) | Computer‐mediated: 13 (range 11‐16) months No SLT: 13 (range 11‐17) months | Computer‐mediated: ANELT‐ A 34 (SD 9); BNT 63 (SD 37) No SLT: ANELT‐A 29 (SD 12); BNT 74 (SD 35) |
| Drummond 1981 | 8 | Not reported | Gesture cue: 52.9 (SD 6.0) Conventional: 50.04 (SD 4.5) | Gesture cue: 15.3 (SD 4.1; range 10‐20) months Conventional: 17.8 (SD 7.1; range 9‐24) months | Not reported |
| Elman 1999 | 24 | Conventional: 7/5 Social support: 6/6 | Conventional: 58.3 (SD 11.4; range 38‐79) Social support: 60.7 (SD 10.6; range 47‐80) | Conventional: 32.5 (SD 28.7; range 7‐103) months Social support: 71.7 (SD 94.2; range 7‐336) months | Conventional: SPICA 7 mild to moderate, 7 moderate to severe Social support: SPICA 7 mild to moderate, 7 moderate to severe |
| FUATAC | 28 | CIAT: 15 Conventional:13 Sex data not reported |
Not reported | All participants had a "left hemisphere cerebrovascular accident less than 3 months prior" | Not reported |
| Hinckley 2001 | 12 | Functional SLT: 5/1 Conventional SLT: 6/0 | Functional: 51.6 (SD 15) Conventional: 50.3 (SD 13.6) | Functional: 26.8 (SD 20.1; range 6‐58) months Conventional: 26.8 (SD 37.6; range 4‐102) months | BDAE Severity Rating Functional: 2.5 (SD 0.8) Conventional: 1.83 (SD 0.9) |
| Katz 1997i | 42 (reported data on 36) | Computer‐mediated: not reported No SLT: not reported (Katz 1997: 44/11) | Computer‐mediated: 61.6 (SD 10) No SLT: 62.8 (SD 5.1) | Computer‐mediated: 6.2 (SD 5.2) years No SLT: 8.5 (SD 5.4) years | PICA overall percentile; WABAQ Computer‐mediated: 57.3 (SD 17.9); 68.9 (SD 24.3). No SLT: 59.5 (SD 16.2); 72.2 (SD 24.8) |
| Katz 1997ii | 40 (of 42 randomised) | Computer‐mediated: not reported Computer placebo: not reported (Katz 1997: 44/11) | Computer‐mediated: 61.6 (SD 10) Computer placebo: 66.4 (SD 6) | Computer‐mediated: 6.2 (SD 5.2) years Computer placebo: 5.4 (SD 4.6) years | PICA overall percentile; WABAQ Computer‐mediated: 57.3 (SD 17.9); 68.9 (SD 24.3) Computer‐placebo: 51.9 (SD 20.3); 61.9 (SD 29.5) |
| Laska 2011 | 123 | SLT: 33/29 No SLT: 23/38 |
SLT: 76 (range 38‐94) No SLT: 79 (range 39‐94) |
SLT: median 3 (IQR; 2‐4) days No SLT: median 3 (IQR; 2‐4) days |
ANELT‐A median (IQR) SLT: 1 (0.0‐1.4) No SLT: 1 (0.0‐1.4) |
| Leal 1993 | 94 | Conventional: 38/21 Volunteer‐facilitated: 22/13 |
Conventional: 56 (SD 17) Volunteer‐facilitated: 59 (SD 13) | Within first month after stroke | Conventional: moderate‐severe Volunteer‐facilitated: moderate‐severe |
| Lincoln 1982i | 12 | SLT/operant training: 3/3 SLT/Social support: 4/2 | SLT/operant training: 54.33 (SD 6.68; range 45‐63) SLT/social support: 51.33 (SD 7.97; range 39‐63) |
SLT/operant training: 3.17 (SD 1.60; range 1‐5) months SLT/social support: 5.17 (SD 3.43; range 1‐10) months | SLT/operant training: moderate SLT/social support: moderate |
| Lincoln 1982ii | 12 | Operant training/SLT: 5/1 Social support/SLT: 5/1 | Operant training/SLT: 57.67 (SD 5.72; range 51‐64) Social support/SLT: 42.33 (SD 16.91; range 28‐60) | Operant training/SLT: 2.33 (SD 1.55; range 1‐5) months Social support/SLT: 8.83 (SD 13.59; range 1‐36) months | Operant training/SLT: moderate Social support/SLT: moderate |
| Lincoln 1982iii | 18 | Conventional SLT: 7/5 Social support: 5/1 | Conventional SLT:52.83 (7.18; range 39‐63) Social support: 42.33 (16.91; range 28‐60) | Conventional SLT: 4.17 (SD 2.76; range 1‐10) months Social support: 8.83 (SD 13.59; range 1‐36) months | Conventional SLT: moderate Social support: moderate |
|
Lincoln 1984a (data for 58% of randomised participants) |
191 (of 327 randomised) | Conventional: not reported No SLT: not reported (Lincoln 1984a: 109/ 82) | Conventional: not reported No SLT: not reported Lincoln 1984a: 68.2 (SD 10.2; range 38‐92) | Conventional: 10 weeks No SLT: 10 weeks | Not reported |
| Lincoln 1984b | 12 | Operant training: 4/2 Placebo: 5/1 |
Operant training: 52.33 (SD 11.50; range 32‐64) Placebo: 52.5 (SD 14.9; range 26‐66) | Operant training: 5.5 (SD 4.89; range 1‐12) months Placebo: 2.83 (SD 2.32; range 1‐7) months | Operant training: severe Placebo: severe |
| Liu 2006a | 36 | SLT: 9/10 No SLT: 10/7 |
SLT: 7 = 40‐65 years; 12 = 65‐80 years No SLT: 8 = 40‐65 years; 9 = 65‐80 years |
SLT: 8 = 7‐20 days; 11 = 20‐45 days No SLT: 7 = 7‐20 days; 10 = 20‐45 days |
BDAE SLT: 60.48 (SD 11.83) No SLT: 58.22 (SD 5.06) |
| Lyon 1997 | 30 | Functional: not reported No SLT: not reported (Lyon 1997: person with aphasia: 8/2; caregiver: 4/6; communication partner: 1/9) | Functional: not reported No SLT: not reported (Lyon 1997: person with aphasia: 68.6 (SD 12.1; range 54‐86); caregiver 60.2 (SD 14.9; range 28‐84); communication partner: 44.9 (SD 17.5; range 25‐74)) | Functional: not reported No SLT: not reported (Lyon 1997: 43.5 (SD 32.2) months) | Functional: not reported No SLT: not reported (Lyon 1997: receptive = mild; expressive = moderate) |
| MacKay 1988 | 95 (of 96 randomised) | MacKay 1988: 46/49 | MacKay 1988: median 75 | MacKay 1988: mean 30 months | Not reported |
| Mattioli 2014 | 12 | Daily language rehabilitation: 4/2 No SLT: 3/3 |
Daily language rehabilitation: 65.5 (SD 15) No SLT: 62.6 (SD 11) |
Daily language rehabilitation: 2.1 (1SD .6) d No SLT: 2.3 (SD 1) d |
NIHSS Stroke Severity Daily language rehabilitation: 4.16 (SD 0.75) No SLT: 4.3 (SD 0.81) |
| Meikle 1979 | 31 | Volunteer‐facilitated: 12/3 Conventional: 10/6 | Volunteer‐facilitated: 67.2 (SD 8.6) Conventional: 64.8 (SD 7.9) | Volunteer‐facilitated: 30.9 (29.5; range 4‐115) weeks Conventional: 39.8 (69.4; range 4‐268) weeks | PICA percentile volunteer‐facilitated: 53.9 (SD 23.5) Conventional: 55.8 (SD 19.78) |
| Meinzer 2007 | 20 | Constraint‐induced: 7/3 Volunteer‐facilitated: 9/1 | Constraint‐induced: 50.2 (SD 10.13) Volunteer‐facilitated: 62 (SD 8.9) | Constraint‐induced: 30.7 (SD 18.9; range 6‐72) months Volunteer‐facilitated: 46.5 (SD 17.2; range 24‐79) months | AAT profile score Constraint‐induced: 5 mild, 3 moderate, 2 severe Volunteer‐facilitated: 3 mild, 6 moderate, 1 severe |
| MIT 2014i | 27 | MIT: 4/12 Control: 7/4 |
MIT: 53.1 (SD 12.0) Control: 52.0 (SD 6.6) |
MIT: 9.3 (SD 2.0) weeks Control: 11.9 (SD 5.9) weeks |
ANELT MIT: 13.0 (SD 5.1) Control: 12.7 (SD 5.9) |
| MIT 2014ii | 27 | MIT early + Control SLT: 4/12 Control SLT + delayed MIT: 7/4 |
MIT early + control SLT: 53.1 (SD 12.0) control SLT + delayed MIT: 52.0 (SD 6.6) |
MIT early + control SLT: 9.3 (SD 2.0) weeks Control SLT + delayed MIT: 11.9 (SD 5.9) weeks |
ANELT MIT early + control SLT: 13.0 (SD 5.1) Control SLT + delayed MIT: 12.7 (SD 5.9) |
| NARNIA 2013 | 14 | Narrative: 5/3 Conventional: 3/3 |
Narrative: 63 (SD 16; range: 42‐87) Conventional: 55 (SD 11; range 37‐66) |
Narrative: 21 (SD 17; range 2‐49) months Conventional: 48 (SD 66; range 3‐165) months |
WAB‐R Narrative: 8.17 (SD 1.12) Conventional: 7.75 (SD 1.33) |
| ORLA 2006 | 13 | Intensive: 6 Conventional: 7 | Intensive SLT: 61.4 (SD 9.72; range 48.44‐74.5) Conventional SLT: 53.1 (18.1; range 31.34‐77.98). | Intensive SLT: 36.2 (SD 28.2; range 8.6‐69.8) months Conventional SLT: 43.6 (SD 51.1; range 7.3‐154) months | WABAQ Intensive SLT: 51.1 (1SD 7.8; range 28.0‐69.4) Conventional SLT: 55.1 (SD 18; range 34.1‐77.1) |
| ORLA 2010 | 25 | Computer: 8/3 Therapist: 8/6 |
Computer: 56.6 (SD 9.2; range 41.7‐68) Therapist: 61.1 (SD 14.8; range 35.2‐81.7) |
Computer: 66.7 (SD 71.5; range 13.8‐253.2) months Therapist: 41.3 (SD 45.7; range 12.2‐166) months |
WABAQ Computer: 62.0 (SD 19.9) Therapist: 47.3 (SD 27.9) |
| Prins 1989 | 21 | STACDAP: 5/5 Conventional: 5/6 | STACDAP: 70.3 (range 58‐83) Conventional: 66 (range 45‐78) | STACDAP: 15.2 (range 3‐35) months Conventional: 15.2 (range 3‐36) months | STACDAP: FE scale 2.6 (0‐6), oral comprehension (BDAE and Token Test) 26.4 (0‐46) Conventional: FE scale 2.7 (0‐9), oral comprehension (BDAE and Token Test) 29.6 (2‐48) |
| Pulvermuller 2001 | 17 | Constraint‐induced: 6/4 Conventional: 6/1 | Constraint‐induced: 55.4 (SD 10.9) Conventional: 53.9 (SD 7.4) | Constraint‐induced: 98.2 (SD 74.2) months Conventional: 24 (SD 20.6) months | Constraint‐induced: 2 mild, 5 moderate, 3 severe Conventional: 2 mild, 4 moderate, 1 severe |
| RATS | 58 | Semantic: 18/11 Phonological: 15/14 | Semantic: 66 (SD 10) Phonological: 58 (SD 14) | Semantic: mean 4 (range 3‐5) months Phonological: mean 4 (range 3‐5) months | ANELT‐A score Semantic: 24.8 (SD 11) Phonological: 23.3 (SD 8) |
| RATS‐2 | 80 | Cognitive linguistic: 14/24 Communicative: 24/18 |
Cognitive linguistic: 68 (SD 13) Communicative: 67 (SD 15) |
Cognitive linguistic: 22 (range 11‐37) d Communicative: 23 (9‐49) d |
ANELT‐A score Cognitive linguistic: 21.4 (SD 11.0) Communicative: 21.0 (SD 11.1) |
| Rochon 2005 | 5 | Sentence mapping: 0/3 Social support: 0/2 | Sentence mapping: range 31‐74 Social support: range 32‐82 | Sentence mapping: range 2‐9 years Social support: range 2‐4 years | Sentence mapping: BDAE 1‐2, phrase length 2.5‐4.0 Social support: BDAE 1‐2, phrase length 4 |
| SEMaFORE | 23 | Data not available at present | Data not available at present | All participants ≥ 6 months post onset, single symptomatic stroke resulting in aphasia | All participants have naming 10%‐ 70% on a screening test |
| Shewan 1984i | 52 | Language‐orientated: 18/10 Conventional: 14/10 | Language‐orientated: 62.18 (range 29‐82) Conventional: 65.63 (range 48‐85) | Language‐orientated: range 2‐4 weeks Conventional: range 2‐4 weeks | Language‐orientated: 9 mild, 6 moderate, 13 severe Conventional: 8 mild, 3 moderate, 13 severe |
| Shewan 1984ii | 53 | Language‐orientated: 18/10 Social support: 14/11 | Language‐orientated: 62.18 (range 29‐82) Social support: 66.12 (range 39‐82) | Language‐orientated: range 2‐4 weeks Social support: range 2‐4 weeks | Language‐orientated: 9 mild, 6 moderate, 13 severe Social support: 7 mild, 5 moderate, 13 severe |
| Shewan 1984iii | 49 | Conventional: 14/10 Social support: 14/11 | Conventional: 65.63 (range 48‐85) Social support: 66.12 (range 39‐82) | Conventional: range 2‐4 weeks Social support: range 2‐4 weeks | Conventional: 8 mild, 3 moderate, 13 severe Social support: 7 mild, 5 moderate, 13 severe |
| Sickert 2014 | 100 | CIAT: 30/20 Conventional: 30/20 |
CIAT: 60.7 (range 41‐81) Conventional: 60.2 (range 34‐84) |
CIAT: 36.7 (range 28‐84) days Conventional: 32.9 (range 28‐112) days |
AAT Spontaneous Speech CIAT: 18.6 (SD 6.9) Conventional: 18.2 (SD 6.5) |
| Smania 2006 | 33 (of 41 randomised) | Conventional: 11/4 No SLT: 12/6 | Conventional: 65.73 (SD 8.78; range 48‐77) No SLT: 65.67 (SD 9.83; range 41‐77) | Conventional: 17.4 (SD 24.07; range 2‐36) months No SLT: 10.39 (SD 7.96; range 3‐32) months | Aphasia severity: not reported Neurological severity: Conventional: 6.07 (SD 4.3; range 0 to16) No SLT: 6.94 (SD 5.83; range 0‐15) |
| Smith 1981i | 33 | Intensive: 12/4 No SLT: 10/7 | Intensive: 62 No SLT: 65 | Not reported | MTDDA (mean error score percentage) Intensive: 39 No SLT: 26 |
| Smith 1981ii | 31 | Conventional: 10/4 No SLT: 10/7 | Conventional: 63 No SLT: 65 | Not reported | MTDDA (mean error score percentage) Conventional: 44 No SLT: 26 |
| Smith 1981iii | 30 | Intensive: 12/4 Conventional: 10/4 | Intensive: 62 Conventional: 63 | Not reported | MTDDA (mean error score percentage) Intensive: 39 Conventional: 44 |
| SP‐I‐RiT | 30 | High‐intensity: 10/5 Low‐intensity: 9/6 |
High‐intensity: 58.27 (SD 12.29; range 40‐77) Low‐intensity: 64.33 (SD 10.46; range 42‐79) |
High‐intensity: 7.67 (SD 2.97; range 3‐13) weeks Low‐intensity: 7.47 (SD 3.60; range 4‐15) weeks |
AQ: High‐intensity: 37.81 (SD 25.87) Low‐intensity: 41.72 (SD 23.95) |
| Szaflarski 2014 | 24 | CIAT: not reported No SLT: not reported |
CIAT: not reported No SLT: not reported |
CIAT: not reported No SLT: not reported |
CIAT: not reported No SLT: not reported |
| Van Steenbrugge 1981 | 10 | Task‐specific: 0/5 Conventional: 2/3 | Task‐specific: 61.8 (SD 17.05; range 40‐77) Conventional: 63.6 (SD 10.9; range 48‐77) | Task‐specific: 21 (SD 22.4; range 5‐60) months Conventional: 20.6 (SD 23.7; range 5‐60) months | FE scale and M‐S Comprehension Test Task‐specific: 4 (SD 1.9) Conventional: 6 (SD 2.9) |
| Varley 2016i | 50 | Self administered computer programme therapy ('speech‐first'): 17/5 Visuo‐spatial sham computer programme ("sham‐first"): 12/13 |
Self administered computer programme therapy ('speech‐first'): 63 (SD 17.2; range 28‐91) Visuo‐spatial sham computer programme ('sham‐first'): 68 (SD 13.4; range 36‐86) |
Self administered ('speech‐first'): 18 (SD 14.17) months Visuo‐spatial sham ('sham‐first'): 25 (SD 24.72) months |
Aphasia severity: composite score on lexical and grammatical probes
(spoken picture naming, maximum 20; spoken reversible sentence‐to‐picture
matching, maximum 20) Self administered computer programme therapy ('speech‐first'): 8–40; M=27 (SD 10.66) Visuo‐spatial sham computer programme ('sham‐first'): 6–40; M=27 (SD 10.91) |
| VERSE I | 59 | Intensive SLT: 14/18 Conventional SLT: 15/12 |
Intensive SLT: 70.3 (SD 12.8) Conventional SLT: 67.7 (SD 15.4) |
Intensive SLT:3.2 (SD 2.2) days Conventional SLT: 3.4 (SD 2.2) days |
WABAQ median (IQR) Intensive SLT: 31.0 (47) Conventional SLT: 9.0 (34.1) |
| VERSE II | 20 | CIAT: 9/3 Conventional: 3/5 |
CIAT: 69.4 (SD 15.0) Conventional: 72.6 (SD 14.1) |
CIAT: 4.8 (SD 2.3) days Conventional: 5.6 (SD 2.3) days |
WABAQ mean (SD) CIAT: 42.5 (SD 27.2) Conventional: 45.1 (SD 28.5) |
| Wertz 1981 | 67 | Not reported | (15 weeks after stroke) Group SLT: 60.24 (range 40‐79) Conventional: 57.07 (range 41‐79) | Group SLT: 4 weeks Conventional: 4 weeks | (15 weeks after stroke) PICA overall percentile Group SLT: 45.21 (range 15‐74) Conventional: 45.62 (range 16‐74) |
| Wertz 1986i | 78 | Conventional: not reported No SLT: not reported | Conventional: 59.2 (SD 6.7) No SLT: 57.2 (SD 6.8) | Conventional: 6.6 (SD 4.8) weeks No SLT: 7.8 (SD 6.6) weeks | PICA overall percentile Conventional: 46.59 (SD 16.05) No SLT: 49.18 (SD 19.46) |
| Wertz 1986ii | 83 | Volunteer‐facilitated: 37/6 No SLT: not reported | Volunteer‐facilitated: 60.2 (SD 6.7) No SLT: 57.2 (SD 6.8) | Volunteer‐facilitated: 7.1 (SD 5.8) weeks No SLT: 7.8 (SD 6.6) weeks | PICA overall percentile Volunteer‐facilitated: 49.97 (SD 22.77) No SLT: 49.18 (SD 19.46) |
| Wertz 1986iii | 81 | Volunteer‐facilitated: 37/6 Conventional: not reported | Volunteer‐facilitated:60.2 (SD 6.7) Conventional: 59.2 (SD 6.7) | Volunteer‐facilitated: 7.1 (SD 5.8) weeks Conventional: 6.6 (SD 4.8) weeks | PICA overall percentile Volunteer‐facilitated: 49.97 (SD 22.77) Conventional: 46.59 (SD 16.05) |
| Wilssens 2015 | 9 | CIAT: 2/3 BOX: 4/0 |
CIAT: 63 (SD 8) BOX: 71 (SD 9) |
CIAT: duration of aphasia: 61 (SD 48) months BOX: duration of aphasia: 52 (SD 25) months |
Participants in both groups reported as moderate |
| Woolf 2015i | 10 | Remote telerehabilitation SLT: 4/1 Conventional: 3/2 |
Remote telerehabilitation SLT: 58.6 (SD 14.38) Conventional: 57.8 (SD 15.14) |
Remote telerehabilitation SLT: 31.8 (1SD 4.11) months Conventional: 35.2 (SD 33.16) months |
CATs semantic score: Remote telerehabilitation SLT: 9.8 (SD 0.45) Conventional: 8.4 (SD 0.89) Naming score: Remote telerehabilitation SLT: 27.4 (SD 5.94) Conventional: 20.2 (SD 8.84) |
| Woolf 2015ii | 10 | Teleconf supported SLT: 4/1 Teleconf supported conversation: 3/2 |
Teleconf supported SLT: 58.6 (SD 14.38) Teleconf supported conversation: 57.8 (SD 15.14) |
Teleconf supported SLT: 31.8 (SD 14.11) months Teleconf supported conversation: 35.2 (SD 33.16) months |
CATs semantic score: Teleconf supported SLT: 9.8 (SD 0.45) Teleconf supported conversation: 8.4 (SD 0.89) |
| Woolf 2015iii | 10 | Conventional SLT: 3/2 Teleconf supported conversation: 4/1 |
Conventional SLT: 57.8 (SD 15.14) Teleconf supported conversation: 58.6 (SD 14.38) |
Conventional SLT: 35.2 (SD 33.16) months Teleconf supported conversation: 31.8 (SD 14.11) months |
CATs semantic score: Conventional SLT: 8.4(SD 0.89) Teleconf supported conversation: 8.4 (SD 0.89) |
| Wu 2004 | 236 | Conventional: not reported No SLT: not reported (Wu 2004: 159/ 77) | Conventional: (range 39‐81) No SLT: (range 40‐78) | Not reported | Not reported |
| Wu 2013 | 5 | Conventional: not reported No SLT: not reported | Conventional: not reported No SLT: not reported |
Conventional: range 1‐3 months No SLT: not reported |
Conventional: not reported No SLT: not reported |
| Xie 2002 | 34 | Language training: not reported No SLT: not reported |
Language training: not reported No SLT: not reported |
Language training: not reported No SLT: not reported |
Language training: not reported No SLT: not reported |
| Yao 2005i | 60 | Group SLT: not reported No SLT: not reported (Yao 2005: 50/34) | Group SLT: not reported No SLT: not reported (Yao 2005: < 40 years = 3; 40s = 23; 50s = 23; 60s = 25; 70s = 8; > 80 years = 2) | Not reported | Not reported |
| Yao 2005ii | 54 | Group SLT: not reported No SLT: not reported (Yao 2005: 50/34) | Group SLT: not reported No SLT: not reported (Yao 2005: < 40 years = 3; 40s = 23; 50s = 23; 60s = 25; 70s = 8; > 80 years = 2) | Not reported | Not reported |
| Yao 2005iii | 54 | Group SLT: not reported No SLT: not reported (Yao 2005: 50/34) | Group SLT: not reported No SLT: not reported (Yao 2005: < 40 years = 3; 40s = 23; 50s = 23; 60s = 25; 70s = 8; > 80 years = 2) | Not reported | Not reported |
| Zhang 2007i | 36 | SLT: 10/9 No SLT: 11/6 |
SLT: 63.40 (SD 7.82) No SLT: 59.36 (SD 7.69) |
SLT: 29.45 (SD 10.63) days No SLT: 27.80 (SD 9.79) days |
ABC AQ SLT: 48.70 (SD 33.49) No SLT: 49.87 (SD 26.83) |
| Zhang 2007ii | 37 | SLT: 11/9 No SLT: 11/6 |
SLT: 60.80 (SD 8.13) No SLT: 59.36 (SD 7.69) |
SLT: 28.10 (SD 9.15) days No SLT: 27.80 (SD 9.79) days |
ABC AQ SLT: 48.43 (SD 29.18) No SLT: 49.87 (SD 26.83) |
| Zhao 2000 | 138 | Not reported | Not reported | Not reported | Not reported |
AAT: Aachen Aphasia Test; ABC: Aphasia Battery of Chinese; ANELT: Amsterdam‐Nijmegen Everyday Language Test;AQ: Aphasia Quotient; BDAE: Boston Diagnostic Aphasia Examination; BNT: Boston Naming Test; CAT: Comprehensive Aphasia Test; CIAT: Constraint Induced Aphasia Therapy;FCP: Functional Communication Profile; FE scale: Functional‐Expression scale;IQR: interquartile range; MIT: Melodic Intonation Therapy; M‐S Comprehension Test: Morpho‐Syntactic Comprehension Test; MTDDA: Minnesota Test for the Differential Diagnosis of Aphasia; NIHSS: National Institutes of Health Stroke Scale; PICA: Porch Index of Communicative Abilities; SD: standard deviation; SLT: Speech and Language therapy/therapist; SPICA: Shortened Porch Index of Communicative Abilities; STACDAP: Systematic Therapy for Auditory Comprehension Disorders in Aphasic Patients; TOMs: Therapy Outcome Measures; WAB: Western Aphasia Battery; WABAQ: Western Aphasia Battery Aphasia Quotient.
1. SLT versus no SLT
We included 27 randomised comparisons involving 1620 randomised participants in this section (B.A.Bar 2011i; CACTUS 2013; Conklyn 2012; Doesborgh 2004; Katz 1997i; Katz 1997ii; Laska 2011; Lincoln 1984a; Liu 2006a; Lyon 1997; MacKay 1988; Mattioli 2014; Smania 2006; Smith 1981i; Smith 1981ii; Szaflarski 2014; Varley 2016i; Wertz 1986i; Wertz 1986ii; Wu 2004; Wu 2013; Xie 2002; Yao 2005i; Yao 2005ii; Zhang 2007i; Zhang 2007ii; Zhao 2000). The SLT intervention was typically delivered by a speech and language therapist. In three trials, a therapist‐trained volunteer facilitated therapy (CACTUS 2013; MacKay 1988; Wertz 1986ii), but some trials were based on independent practice with SLT support (B.A.Bar 2011i; Szaflarski 2014; Varley 2016i). Alternative models of intervention delivery included administration by a doctor or nurse (Wu 2004; Xie 2002; Yao 2005i; Yao 2005ii; Zhao 2000), a music therapist (Conklyn 2012), or other therapists in the rehabilitation setting (Zhang 2007i; Zhang 2007ii). In two trials, it was unclear who facilitated the SLT intervention (Liu 2006a; Wu 2013). Two additional trials compared groups that did and did not receive SLT, but the participants were not randomly assigned to these 'no SLT' groups, so we excluded them from this review (Prins 1989; Shewan 1984).
The trials in this section employed a range of SLT interventions that might be broadly grouped as conventional SLT (Lincoln 1984a; Liu 2006a; Mattioli 2014; Smania 2006; Smith 1981ii; Wertz 1986i; Wu 2004; Wu 2013; Xie 2002; Yao 2005ii; Zhang 2007i; Zhang 2007ii), constraint‐induced aphasia therapy (Szaflarski 2014), melodic intonation therapy (Conklyn 2012), intensive SLT (B.A.Bar 2011i; Laska 2011; Szaflarski 2014; Smith 1981i; Xie 2002), group SLT (Yao 2005i), volunteer‐facilitated (MacKay 1988; Wertz 1986ii), computer‐mediated SLT (B.A.Bar 2011i; CACTUS 2013; Doesborgh 2004; Katz 1997i; Katz 1997ii; Varley 2016i), and functionally‐based SLT involving a communicative partner (Lyon 1997). An acupuncture co‐intervention was delivered alongside the SLT intervention in three comparisons (Liu 2006a; Zhao 2000; Zhang 2007ii).
Most participants randomised to the 'no SLT' groups received no alternative treatment or support (Doesborgh 2004; Katz 1997i; Laska 2011; Lincoln 1984a; Liu 2006a; Lyon 1997; MacKay 1988; Wertz 1986i; Wertz 1986ii; Wu 2004; Yao 2005i; Yao 2005ii). Only seven trials described an intervention within these 'no SLT' groups. In CACTUS 2013, we considered the control interventions to be similar to standard poststroke care in the local region at that time; in Smith 1981i and Smith 1981ii, a health visitor went to participants' homes; in Smania 2006, participants received limb apraxia therapy; and in Zhang 2007i, Zhang 2007ii, and Zhao 2000, they received medication. The control groups in Katz 1997ii received computer‐based cognitive tasks ('arcade‐style games') and in B.A.Bar 2011i and Varley 2016i, they received visual‐cognitive computer games, all interventions designed not to target language rehabilitation.
The timing of SLT interventions after the onset of aphasia varied widely and is difficult to summarise because of a lack of detailed reporting. Some trialists recruited participants within two to four days after the onset of stroke (Laska 2011; Mattioli 2014), while others recruited participants up to 45 days (Liu 2006a), 10 weeks (Lincoln 1984a), three months (Conklyn 2012; Wu 2013; Zhang 2007i; Zhang 2007ii) or six months (Wertz 1986i; Wertz 1986ii) after the stroke. Other trials recruited participants longer after stroke, for example between two months and three years after stroke (Smania 2006), or for up to four years (B.A.Bar 2011i). Other participants were recruited one year or more after their stroke ‐ up to 17 months in Doesborgh 2004, two years in MacKay 1988, eight years in Varley 2016i, 10 years in Lyon 1997, 19 years in Katz 1997i, 22 years in Katz 1997ii, and 29 years in CACTUS 2013 (see Table 6 for details). Eight trials failed to report the timing of the SLT intervention in relation to the onset of participants' aphasia (Smith 1981i; Smith 1981ii; Szaflarski 2014; Wu 2004; Xie 2002; Yao 2005i; Yao 2005ii; Zhao 2000).
The frequency of SLT was reported as the number of times daily or as hours per day or per week. Participants received daily SLT (duration unclear) in two trials (Yao 2005i; Yao 2005ii), weekly SLT for up to an hour (CACTUS 2013; Conklyn 2012), two hours (Doesborgh 2004; Lincoln 1984a; Smith 1981ii), three hours (Katz 1997i; Katz 1997ii; Smania 2006; Wu 2013), four hours (Laska 2011; Smith 1981i), five hours (Mattioli 2014; Varley 2016i), six hours (MacKay 1988; Xie 2002), eight hours (Lyon 1997), nine hours (B.A.Bar 2011i), or 10 hours (Wertz 1986i; Wertz 1986ii). An additional six comparisons did not report the frequency of the SLT intervention (Liu 2006a; Szaflarski 2014; Wu 2004; Zhang 2007i; Zhang 2007ii; Zhao 2000). Where specified, the duration of the SLT intervention varied from one session (Conklyn 2012), two weeks (Mattioli 2014), three weeks (Laska 2011), four weeks (B.A.Bar 2011i), six weeks (Varley 2016i), two months (Zhao 2000), up to three months (Doesborgh 2004; Smania 2006; Wertz 1986i; Wertz 1986ii; Yao 2005i; Yao 2005ii); between five and six months (CACTUS 2013; Katz 1997i; Katz 1997ii; Lincoln 1984a; Lyon 1997; Wu 2004), or for up to one year (MacKay 1988; Smith 1981i; Smith 1981ii; Xie 2002).
The 19 randomised comparisons in this section used a wide range of outcome measures including functional communication, receptive language, expressive language, severity of impairment, psychosocial impact and economic outcomes. One of the 14 trials did not report any outcome measures (Wu 2004). Eleven trials carried out follow‐up assessments after SLT at 2 months (Smania 2006), 3 months (B.A.Bar 2011i; Szaflarski 2014; Wertz 1986i; Wertz 1986ii; Yao 2005i; Yao 2005ii), 5 months (CACTUS 2013), 6 months (Laska 2011; MacKay 1988; Mattioli 2014), 8 months (CACTUS 2013), and 12 months (MacKay 1988).
2. SLT versus social support and stimulation
We included nine trials with 447 randomised participants in this section (ACTNoW 2011; David 1982; Elman 1999; Lincoln 1982iii; Rochon 2005; Shewan 1984ii; Shewan 1984iii; Woolf 2015ii; Woolf 2015iii). They reported a range of SLT approaches, including conventional SLT (ACTNoW 2011; David 1982; Lincoln 1982iii; Shewan 1984iii; Woolf 2015iii), group SLT (Elman 1999), telerehabilitation SLT (Woolf 2015ii), language‐oriented SLT (Shewan 1984ii), and sentence mapping SLT (Rochon 2005). The social support and stimulation interventions were provided by paid visitors not previously known to the participants with aphasia (ACTNoW 2011; David 1982), nursing staff (Shewan 1984ii; Shewan 1984iii), speech and language therapists or speech and language therapy students (Lincoln 1982iii; Woolf 2015ii; Woolf 2015iii), a trained research assistant (Rochon 2005), or through other social group activities including movement classes, creative arts groups, church activities or support groups (Elman 1999). All visitors providing the ACTNoW 2011 social support received training and a manual of non‐therapeutic activities, suitable conversation topics, and access to equipment. David 1982 provided its volunteers with detailed information on their patients' communication problems, and they received instructions to "encourage their patient to communicate as well as possible". Similarly, the nursing staff volunteers received some information about aphasia and instructions to "stimulate communication to the best of their ability" (Shewan 1984ii; Shewan 1984iii). The volunteers did not receive guidance or instruction in SLT techniques in any of the four trials. Speech and language therapy students received a training session in supported conversation approaches (e.g. initiation and adaptation of communication) and a handbook (Woolf 2015ii; Woolf 2015iii).
The duration of participants' aphasia varied between trials and was reported as: an average of 12 days (ACTNoW 2011), an average of between 3 and 5 years (Woolf 2015ii; Woolf 2015iii), up to 4 weeks (Shewan 1984ii; Shewan 1984iii), up to 3 years (David 1982; Lincoln 1982iii), 7 months to 28 years (Elman 1999), or between 2 and 9 years (Rochon 2005). Interventions were provided weekly for up to two hours (David 1982; Lincoln 1982iii; Woolf 2015ii; Woolf 2015iii), three hours (ACTNoW 2011; Shewan 1984ii; Shewan 1984iii), or five hours (Elman 1999); or over the course 1 month (Lincoln 1982iii; Woolf 2015ii; Woolf 2015iii), 4 months (ACTNoW 2011; Elman 1999), 5 months (David 1982), or 12 months (Shewan 1984ii; Shewan 1984iii).
Outcome measures used in this comparison included measures of functional communication, receptive language, expressive language and levels of severity of impairment. Five trials carried out follow‐up measures at four weeks (Rochon 2005), three months (David 1982; Woolf 2015ii; Woolf 2015iii), and six months (David 1982).
3. SLT A versus SLT B
We included 38 trials involving 1242 randomised participants in this section (B.A.Bar 2011ii; Bakheit 2007; Crerar 1996; Crosson 2014; Denes 1996; Di Carlo 1980; Drummond 1981; FUATAC; Hinckley 2001; Leal 1993; Lincoln 1982i; Lincoln 1982ii; Lincoln 1984b; Meikle 1979; Meinzer 2007; MIT 2014i; MIT 2014ii; NARNIA 2013; ORLA 2006; ORLA 2010; Prins 1989; Pulvermuller 2001; RATS; RATS‐2; SEMaFORE; Shewan 1984i; Sickert 2014; Smith 1981iii; SP‐I‐RiT; Van Steenbrugge 1981; Varley 2016ii; VERSE I; VERSE II; Wertz 1981; Wertz 1986iii; Wilssens 2015; Woolf 2015i; Yao 2005iii). Four trials also reported additional groups, but these participants were not adequately randomised to the groups, so we excluded them from this review (Bakheit 2007; ORLA 2006; Prins 1989; Shewan 1984).
Studies reported a wide range of SLT interventions, including variations in therapy regimen such as therapy intensity (Bakheit 2007; Denes 1996; FUATAC; ORLA 2006; Smith 1981iii; SP‐I‐RiT; VERSE I), duration of therapy (Di Carlo 1980; Meikle 1979; ORLA 2010; Pulvermuller 2001; SP‐I‐RiT), or delayed delivery (B.A.Bar 2011ii; MIT 2014i; Lyon 1997; Varley 2016ii). Other comparisons included variation in the delivery approach, such as volunteer‐facilitated SLT (Meikle 1979; Meinzer 2007; Leal 1993; Wertz 1986iii), computer‐facilitated SLT (ORLA 2010), and group SLT (FUATAC; Pulvermuller 2001; Wertz 1981; Yao 2005iii). Variations in the theoretical approach included constraint‐induced aphasia therapy (FUATAC; Pulvermuller 2001; Sickert 2014; VERSE II; Wilssens 2015), semantic therapy (RATS; RATS‐2; SEMaFORE; Wilssens 2015), phonological approaches (Wilssens 2015) or melodic intonation therapy (MIT 2014i; MIT 2014ii). Other trials compared verb versus preposition therapies (Crerar 1996), filmed programmed instructions versus non‐programmed activity (Di Carlo 1980), or programmed instruction versus a placebo (Lincoln 1984b).
The average time since onset of participants' aphasia varied from less than a week (VERSE I; VERSE II), up to 1 month (Bakheit 2007, Leal 1993; RATS‐2; Shewan 1984i; Sickert 2014; Wertz 1981), 2 months (SP‐I‐RiT; Varley 2016ii; Wertz 1986iii), 3 months (Denes 1996; MIT 2014i; MIT 2014ii), 4 months (RATS), 5 months (Lincoln 1982i), 6 months (Lincoln 1984b), 9 months (Lincoln 1982ii, Meikle 1979), 10 months to one year (Prins 1989), two years (Di Carlo 1980, Drummond 1981; Hinckley 2001; Van Steenbrugge 1981), three years (B.A.Bar 2011ii; Crosson 2014; Meinzer 2007; Woolf 2015i), four years (NARNIA 2013; ORLA 2006), five years (Wilssens 2015), six years (ORLA 2010), seven years (Crerar 1996), or eight years (Pulvermuller 2001). The duration of participants' aphasia was unavailable for other trials (FUATAC; SEMaFORE; Smith 1981iii; Yao 2005iii).
Participants received therapy daily for an unclear time period (Yao 2005iii), for up to two hours (Crerar 1996; SP‐I‐RiT), or for three hours (Meinzer 2007; Pulvermuller 2001). Participants receiving SLT weekly had cumulative sessions for up to 30 minutes (Drummond 1981), 45 minutes (FUATAC), 1 hour (Lincoln 1984b), 1.5 hours (Lincoln 1982i; Smith 1981iii), 2 hours (Prins 1989; SEMaFORE; Van Steenbrugge 1981; Woolf 2015i), 3 hours (Di Carlo 1980; FUATAC; RATS; Leal 1993; Shewan 1984i), 4 hours (Meikle 1979; NARNIA 2013; Smith 1981iii), 5 hours (Bakheit 2007; Denes 1996; MIT 2014i; MIT 2014ii; RATS‐2; SP‐I‐RiT; VERSE II), 6 hours (Varley 2016ii), 7 hours (VERSE I), 8 hours (Wertz 1981), 9 hours (B.A.Bar 2011ii), 10 hours (Crosson 2014; ORLA 2006; Wertz 1986iii), 15 hours (Wilssens 2015), or 20 hours (Hinckley 2001). The duration of therapy ranged from 2 weeks (Drummond 1981; Meinzer 2007; Wilssens 2015), 3 weeks (Crerar 1996; Crosson 2014; SP‐I‐RiT), 4 weeks (Lincoln 1984b; VERSE I; Woolf 2015i; Yao 2005iii), 5 weeks (Hinckley 2001; NARNIA 2013; Pulvermuller 2001; VERSE II), 6 weeks (FUATAC; MIT 2014i; ORLA 2006; SEMaFORE; Varley 2016ii), 8 weeks (B.A.Bar 2011ii; Lincoln 1982i; Lincoln 1982ii), 9 weeks (Van Steenbrugge 1981), 10 weeks (SP‐I‐RiT), 12 weeks (Bakheit 2007; MIT 2014ii; Wertz 1986iii), 30 weeks (Di Carlo 1980), 5 months (Prins 1989), up to 6 months (Denes 1996; Leal 1993; RATS‐2), 9 months (RATS), 10 months (Wertz 1981), one year (Shewan 1984i; Smith 1981iii), or two years (Meikle 1979). The self directed therapy intervention varied across participants in ORLA 2010, with each participant receiving 24 hours of therapy over a mean treatment duration of 12.62 weeks (range 6 to 22 weeks), and in Varley 2016ii (means reported above).
There was a wide range of outcome measures used in this comparison, including measures of functional communication, receptive language, expressive language, severity of impairment, and psychosocial impact. Investigators carried out post‐treatment follow‐up assessments at five weeks (NARNIA 2013), six weeks (Wertz 1986iii), eight weeks (Sickert 2014; Varley 2016ii), nine weeks (Van Steenbrugge 1981), three months (B.A.Bar 2011ii; Bakheit 2007; Crosson 2014; SP‐I‐RiT; VERSE II; Wertz 1986iii; Woolf 2015i; Yao 2005iii), six months (VERSE I, VERSE II), and 12 months (Sickert 2014) .
Excluded studies
We excluded 65 studies. Reasons for exclusion were primarily due to inadequate randomisation and the unavailability of aphasia‐specific data (see details in the Characteristics of excluded studies table).
Risk of bias in included studies
Two review authors independently reviewed the methodological quality of the included studies and resolved disagreements through discussion. We present details in the 'Risk of bias' tables for each of the trials in the Characteristics of included studies table.
The number of randomised participants in included studies ranged from five participants in Rochon 2005 and Wu 2013 to 327 participants in Lincoln 1984a. Nine comparisons randomised 10 participants or fewer (Crerar 1996; Drummond 1981; Rochon 2005; Van Steenbrugge 1981; Wilssens 2015; Woolf 2015i; Woolf 2015ii; Woolf 2015iii; Wu 2013), 17 randomised between 11 and 20 participants (B.A.Bar 2011i; B.A.Bar 2011ii; Crosson 2014; Denes 1996; Di Carlo 1980; Doesborgh 2004; Hinckley 2001; Lincoln 1982i; Lincoln 1982ii; Lincoln 1982iii; Lincoln 1984b; Mattioli 2014; Meinzer 2007; NARNIA 2013; ORLA 2006; Pulvermuller 2001; VERSE II), 26 trials randomised up to 50 participants (CACTUS 2013; Conklyn 2012; Elman 1999; FUATAC; Katz 1997i; Katz 1997ii; Liu 2006a; Lyon 1997; Meikle 1979; MIT 2014i; MIT 2014ii; ORLA 2010; Prins 1989; SEMaFORE; Shewan 1984iii; Smania 2006; Smith 1981i; Smith 1981ii; Smith 1981iii; SP‐I‐RiT; Szaflarski 2014; Varley 2016i; Varley 2016ii; Xie 2002; Zhang 2007i; Zhang 2007ii), 16 trials randomised between 51 and 100 participants (Bakheit 2007; Leal 1993; MacKay 1988; RATS; RATS‐2; Shewan 1984i; Shewan 1984ii; Sickert 2014; VERSE I; Wertz 1981; Wertz 1986i; Wertz 1986ii; Wertz 1986iii; Yao 2005i; Yao 2005ii; Yao 2005iii), 2 trials randomised between 101 and 150 (Laska 2011; Zhao 2000), and 4 randomised more than 150 participants (ACTNoW 2011; David 1982; Lincoln 1984a; Wu 2004) (see Table 6).
Of the 74 randomised comparisons, only 44 listed both inclusion and exclusion criteria. Details of exclusion criteria were unavailable for an additional 28 trials (B.A.Bar 2011i; B.A.Bar 2011ii; Crerar 1996; Denes 1996; Di Carlo 1980; Hinckley 2001; Lincoln 1984b; Lyon 1997; MacKay 1988; Meikle 1979; Meinzer 2007; ORLA 2006; Prins 1989; Rochon 2005; Szaflarski 2014; Van Steenbrugge 1981; Wertz 1981; Wertz 1986i; Wertz 1986ii; Wertz 1986iii; Wu 2013; Xie 2002; Yao 2005i; Yao 2005ii; Yao 2005iii; Zhang 2007i; Zhang 2007ii; Zhao 2000). Inclusion and exclusion criteria were unavailable for two trials (Drummond 1981; Wu 2004) (see Characteristics of included studies table).
Suitable statistical data for communication outcomes were only available for 55 of the 74 trials. Appropriate statistical data for communication outcomes were not provided or could not be extracted in the remaining 18 randomised comparisons (Conklyn 2012; Drummond 1981; Elman 1999; FUATAC; Leal 1993; Lyon 1997; MacKay 1988; MIT 2014ii; SEMaFORE; Shewan 1984i; Shewan 1984ii; Shewan 1984iii; Smith 1981i; Smith 1981ii; Smith 1981iii; Szaflarski 2014; Wu 2004; Wu 2013). Nine of these trials contributed data on the trial dropouts or withdrawals (Elman 1999; Leal 1993; MacKay 1988; Shewan 1984i; Shewan 1984ii; Shewan 1984iii; Smith 1981i; Smith 1981ii; Smith 1981iii).The nine remaining trials did not contribute any data to the review meta‐analyses (Conklyn 2012; Drummond 1981; FUATAC; Lyon 1997; MIT 2014ii; SEMaFORE; Szaflarski 2014; Wu 2004; Wu 2013). Psychosocial data were available for three trials (ACTNoW 2011; Lincoln 1984a; SP‐I‐RiT).
There was a wide range of variation in the descriptions of the SLT interventions. Most reported the use of a conventional SLT approach or described an intervention, which reflects clinical practice where the therapist was responsible for design and content of the treatment delivered. Other trials evaluated more prescriptive SLT interventions (including volunteer‐facilitated therapy, intensive therapy, constraint‐induced asphasia therapy for example); we will describe these in later sections. We systematically extracted intervention details according to the Template for Intervention Description and Replication (TIDieR) checklist (Hoffmann 2014), communicating directly with the trialists to supplement published information where possible. We present these intervention detail in the Characteristics of included studies table.
Forty‐nine randomised comparisons reported similar groups at baseline. Comparison between the groups at baseline was unclear in 10 randomised comparisons (FUATAC; Lincoln 1984b; Lyon 1997; MacKay 1988; SEMaFORE; Wu 2004; Wu 2013; Yao 2005i; Yao 2005ii; Yao 2005iii). For 15 randomised comparisons, the groups differed despite randomisation in relation to their time post onset (Pulvermuller 2001), the severity or type of their stroke (VERSE I; VERSE II), severity of their aphasia (Smith 1981i; Smith 1981ii), sex (Crerar 1996; MIT 2014i; MIT 2014ii; RATS‐2; Varley 2016ii), and age (David 1982; RATS; Meinzer 2007; Prins 1989); in Meikle 1979 the participants that were allocated to SLT received more weeks of the intervention than the volunteer‐facilitated group (P = 0.01).
Allocation
Details of the method of generating the randomisation sequence were only available for 32 of the 74 trials (see Figure 2; Figure 3). Twelve used random numbers tables (Bakheit 2007; Conklyn 2012; David 1982; Katz 1997i; Katz 1997ii; Laska 2011; Lincoln 1982i; Lincoln 1982ii; Lincoln 1982iii; Lincoln 1984a; Lincoln 1984b; Smania 2006), 20 used computer‐generated or web‐based sequence generation (ACTNoW 2011; CACTUS 2013; Doesborgh 2004; Mattioli 2014; MIT 2014i; MIT 2014ii; NARNIA 2013; Varley 2016i; Varley 2016ii; Pulvermuller 2001; RATS; RATS‐2; SP‐I‐RiT; Sickert 2014; VERSE I; VERSE II; Wilssens 2015; Woolf 2015i; Woolf 2015ii; Woolf 2015iii), and one drew lots (Crerar 1996). The remaining 42 trials stated that participants were randomly allocated but did not report any further details. Eight trials described stratifying participants by type or severity of aphasia (ACTNoW 2011; CACTUS 2013; Crosson 2014; Leal 1993; Shewan 1984i; Shewan 1984ii; Shewan 1984iii; SP‐I‐RiT), and two stratified by recruitment site (ACTNoW 2011; RATS‐2).
2.
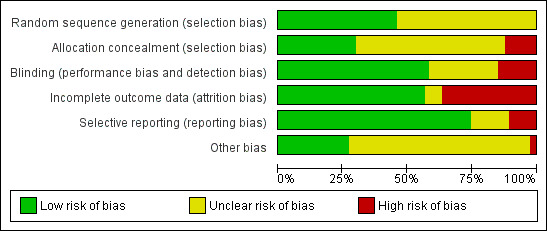
'Risk of bias' graph: review authors' judgements about each 'Risk of bias' item presented as percentages across all included studies.
3.
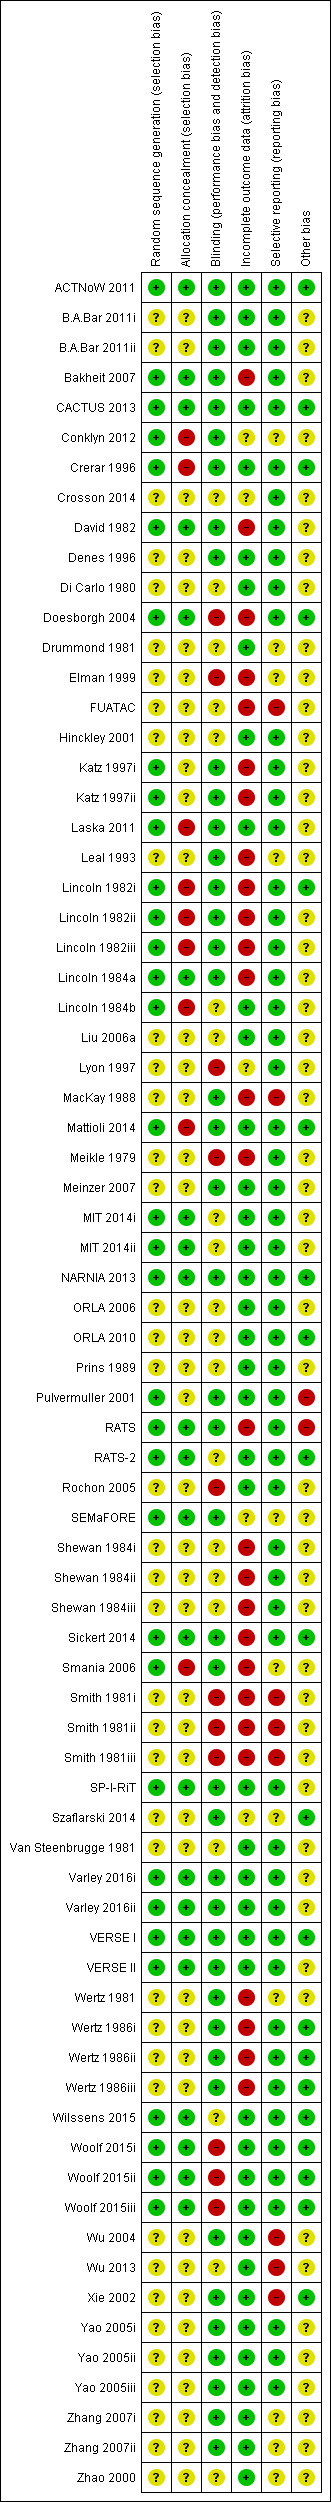
'Risk of bias' summary: review authors' judgements about each 'Risk of bias' item for each included study.
Details of the allocation concealment were available for 31 of the 74 trials (see Figure 2 and Figure 3). Nineteen used sequentially numbered sealed envelopes or similar methods of allocation and were considered to be adequately concealed (Bakheit 2007; CACTUS 2013; Conklyn 2012; David 1982; Doesborgh 2004; Lincoln 1984a; MIT 2014i; MIT 2014ii; NARNIA 2013; RATS; SP‐I‐RiT; Sickert 2014; Varley 2016i; Varley 2016ii; VERSE II; Wilssens 2015; Woolf 2015i; Woolf 2015ii; Woolf 2015iii). Five described using an allocation service that was external to the trial team (ACTNoW 2011; Laska 2011; RATS‐2; SEMaFORE; VERSE I). Seven described a trialist‐led allocation method that inadequately concealed allocation to the groups (Crerar 1996; Lincoln 1982i; Lincoln 1982ii; Lincoln 1982iii; Lincoln 1984b; Mattioli 2014; Smania 2006).
Blinding
Due to the nature of SLT, it is difficult to blind either the patient or the person carrying out the intervention. However, blinding of the outcome assessor is possible and should be in place to avert detection bias. More than half of the included trials (43/74) reported blinding of outcome assessors (see Figure 2 and Figure 3). In other cases, blinding was partially in place. The method of assessment ensured blinding in some of the outcome measures for three trials (Crerar 1996; Lincoln 1984b; RATS‐2), while six additional trials ensured blinding of a second assessor who checked a proportion of measurements scores (Katz 1997i; Katz 1997ii; Rochon 2005; Woolf 2015i; Woolf 2015ii; Woolf 2015iii). Four trial reports acknowledged the possibility that measures may have been confounded to some extent by indications from the participants being assessed as to which group they were attending (ACTNoW 2011; David 1982; MIT 2014i; MIT 2014ii). This is likely to have occurred but went unreported in several other trials as well.
Blinding was unclear for 20 trials (Crosson 2014; Di Carlo 1980; Drummond 1981; FUATAC; Hinckley 2001; Lincoln 1984b; Liu 2006a; MIT 2014i; MIT 2014ii; ORLA 2006; ORLA 2010; Prins 1989; RATS‐2; Shewan 1984i; Shewan 1984ii; Shewan 1984iii; Van Steenbrugge 1981; Wilssens 2015; Wu 2013; Zhao 2000), and we considered it inadequate in 11 trials (Doesborgh 2004; Elman 1999; Lyon 1997; Meikle 1979; Rochon 2005; Smith 1981i; Smith 1981ii; Smith 1981iii; Woolf 2015i; Woolf 2015ii; Woolf 2015iii).
Incomplete outcome data
Overall, 25% of the 3002 participants randomised across the 74 comparisons included in this review withdrew from the intervention (N = 518 participants) or were lost to follow‐up (N = 254 participants). By specific comparisons, of the 1620 participants in the SLT versus no SLT comparison, 235 (15%) withdrew from the treatment phase of the studies: 116 from the SLT interventions and 117 from the 'no SLT' allocation. In addition, 46 participants were lost during the follow‐up assessment phase (21 withdrawing from the SLT groups and 25 from the 'no SLT' groups). The trials that compared SLT with social support and stimulation randomised a total of 447 participants, but 105 participants (23%) were lost during the treatment phase (40 from the SLT group and 65 from the social support groups). Twenty‐five additional participants were not included in the follow‐up (David 1982; Elman 1999). The final comparison of SLT A versus SLT B involved 1242 randomised participants. A total of 224 participants (18%) withdrew from these trials during the treatment phase, with an additional 90 withdrawing from the follow‐up phase. Across the review, studies reported an additional five participants withdrawing from a trial, but it was unclear to which group(s) those participants were allocated (Smith 1981i; Smith 1981ii; Smith 1981iii). Participants in Meikle 1979 remained in the trial until two successful estimations on an outcome measure showed no appreciable improvement, until participants requested withdrawal, or until the end of the trial; however, authors gave no further details. Where available, we present details of dropouts in Table 7.
2. Details of dropouts.
| Study ID | Dropouts by intervention | Reasons | Follow‐up | Reasons |
| ACTNoW 2011 | Conventional: 8 Social support: 20 |
Conventional: 4 died, 3 declined, 1 post randomisation exclusion, 2 non‐study SLT Social support: 7 died, 12 declined, 1 post randomisation exclusion, 18 non‐study SLT |
No follow‐up | NA |
| Bakheit 2007 | Intensive: 16 Conventional: 8 | Intensive: 2 died, 14 withdrew Conventional: 8 withdrew (Across trial: 13 withdrew, 4 died, 4 illness, 3 not tolerating therapy, 2 relocation, 1 further stroke, 1 diagnosis revised) | Intensive: 4 Conventional: 3 | Not reported |
| CACTUS 2013 | Computer SLT: 2 No SLT: 4 |
Across trial including follow‐up: Computer SLT: 3 illness and changed circumstances, 1 further stroke. No SLT: 3 illness, 3 declined | Computer SLT: 2 No SLT: 2 |
Across trial including follow‐up: Computer SLT: 3 illness and changed circumstances, 1 further stroke. No SLT: 3 illness, 3 declined |
| Conklyn 2012 | MIT: unclear No SLT: unclear |
Not reported | No follow‐up | NA |
| David 1982 | Conventional: 23 Social support: 36 | Conventional: 4 died, 5 new stroke, 2 self discharge, 5 illness, 3 moved, 4 other Social support: 6 died, 5 new stroke, 5 transport, 6 self discharge, 3 illness, 4 volunteer issues, 2 relocated, 5 other undescribed | Conventional: 11 Social support: 12 | Not reported |
| Doesborgh 2004 | Computer‐mediated: 1 No SLT: 0 | Computer‐mediated: 1 illness No SLT: 0 | No follow‐up | NA |
| Elman 1999 | Conventional: 2 Social support: 3 | Conventional: 1 transport, 1 time constraints Social support: 2 time constraints, 1 medical complications | Conventional: 0 Social support: 0 | NA |
| Katz 1997i | Computer‐mediated: 0 No SLT: 6 | Prolonged illness, new stroke, death | Computer‐mediated: 0 No SLT: 0 | NA |
| Katz 1997ii | Computer‐mediated: 0 No SLT (computer placebo): 2 | Prolonged illness, new stroke, death | Computer‐mediated: 0 No SLT (computer placebo): 0 | NA |
| Laska 2011 | SLT: 3 No SLT: 6 |
SLT: 1 death, 2 illness No SLT: 3 declined, 3 illness |
At 6 months SLT: 9 No SLT: 6 |
SLT: 4 death, 2 declined, 3 illness No SLT: 6 death |
| Leal 1993 | Conventional: 21 Volunteer‐facilitated: 13 | Conventional: 2 death, 3 new stroke, 3 transport, 4 declined, 2 moved, 5 illness, 2 transfer Volunteer‐facilitated: 1 death, 1 new stroke, 3 transport, 4 declined, 2 moved, 0 illness, 2 transfer | Conventional: 0 Volunteer‐facilitated: 0 | NA |
| Lincoln 1982i | Social support: ? Operant training: ? (13: groups not reported) | Homesickness, illness | No follow‐up | NA |
| Lincoln 1982ii | Social support: ? Operant training: ? (13: groups not reported) | Homesickness, illness | No follow‐up | NA |
| Lincoln 1982iii | Social support: ? Operant training: ? (13: groups not reported) | Homesickness, illness | No follow‐up | NA |
| Lincoln 1984a | Conventional: 78 No SLT: 79 | Death, refused, illness, recovered, unsuitable, relocated | No follow‐up | NA |
| MacKay 1988 | Volunteer‐facilitated: 0 No SLT: 1 | Not reported | No follow‐up | NA |
| Mattioli 2014 | SLT:0 No SLT:0 |
None | SLT:0 No SLT:1 |
1 died |
| Meikle 1979 | Conventional: 0 Volunteer‐facilitated: 2 | Conventional: 0 Volunteer‐facilitated: 1 declined, 1 moved | No follow‐up | NA |
| MIT 2014i | MIT: 5 Control: 0 |
MIT: 3 did not complete MIT; 2 did not complete post‐therapy assessment | NA (see MIT 2014ii) |
NA |
| MIT 2014ii | MIT early + SLT: 3 SLT + delayed MIT: 2 |
MIT early + SLT: 3 did not complete MIT early SLT + delayed MIT: 1 did not complete delayed MIT; 1 did not complete assessment |
No follow‐up | NA |
| RATS | Semantic: 6 Phonological: 6 | Semantic: 4 received < 40 h treatment, 2 severe neurological illness Phonological: 2 received < 40 h treatment, 1 severe neurological illness, 3 ANELT score missing (2 declined, 1 missing) | No follow‐up | NA |
| RATS‐2 | Cognitive linguistic: 4 Communicative: 6 |
Cognitive linguistic: 3 illness, 1 refusal by therapist Communicative: 1 illness, 5 declined |
No follow‐up | NA |
| Shewan 1984i | Language orientated: 6 Conventional: 1 | Language orientated: 1 death, 2 relocation, 3 withdrew Conventional: 1 death | No follow‐up | NA |
| Shewan 1984ii | Language orientated: 6 Social support: 6 | Language orientated: 1 death, 2 relocation, 3 withdrew Social support: 1 death, 2 illness, 1 relocation, 2 withdrew | No follow‐up | NA |
| Shewan 1984iii | Conventional: 1 Social support: 6 | Conventional: 1 death Social support: 1 death, 2 illness, 1 relocation, 2 withdrew | No follow‐up | NA |
| Sickert 2014 | CIAT: unclear Conventional: unclear |
Across the trial 54 withdrew as they were satisfied with the results. Unclear from which group. | CIAT: 35 Conventional: 39 |
Not reported |
| Smania 2006 | Conventional: 5 No SLT: 3 | Conventional: 3 uncooperative, 2 illness No SLT: 1 uncooperative, 2 illness | Conventional: 7 No SLT: 9 | Conventional: 3 illness, 4 refused No SLT: 1 death, 2 illness, 4 refused, 2 relocations |
| Smith 1981i | Intensive: 6 No SLT: not reported | Reasons not detailed Additional 5 withdrawn but not advised of groupings | Intensive: 4 No SLT: not reported | Not reported |
| Smith 1981ii | Conventional: 2 No SLT: not reported | Reasons not detailed Additional 5 withdrawn but not advised of groupings | Conventional: 4 No SLT: not reported | Not reported |
| Smith 1981iii | Intensive: 6 Conventional: 2 | Reasons not detailed Additional 5 withdrawn but not advised of groupings | Intensive: 4 Conventional: 4 | Not reported |
| SP‐I‐RiT | CIAT: 6 Conventional: 6 |
CIAT: 4 missed evaluation, 1 transferred, 1 died Conventional: 2 illness, 1 severe depression, 2 transfers, 1 died. |
CIAT: 3 Conventional: 1 |
CIAT: 3 declined Conventional: 1 missed evaluation |
| Szaflarski 2014 | CIAT: not reported No SLT:not reported |
Not reported | CIAT: not reported No SLT:not reported |
Not reported |
| Varley 2016i | Computer SLT:2 No SLT:0 |
Computer SLT: 1 withdrew; 1 researcher safety risk. No SLT: 0 |
Cross‐over. No follow‐up | NA |
| Varley 2016ii | Early computer SLT:3 Late computer SLT: 0 |
Early computer therapy: 1 withdrew; 1 researcher safety risk, 1 died Late computer therapy: 0 |
Early computer therapy: 2 Late computer therapy: 1 |
Early computer therapy: 2 withdrew Late computer therapy: 1 withdrew |
| VERSE I | Intensive: 7 Conventional: 1 |
Intensive: 4 declined, 2 discharged early, 1 died. Conventional: 1 declined |
Intensive: 4 Conventional: 2 |
Intensive: 4 refused Conventional: 1 refused, 1 death |
| VERSE II | CIAT: 3 Conventional: 0 |
CIAT: 3 Conventional: 0 |
Across 12 and 26 week follow‐ups CIAT: 6 Conventional: 3 |
CIAT: 12 weeks; 1 declined; 26 weeks (1 declined, 2 moved, 2 self reported language problems resolved) Conventional: 12 weeks: 1 moved; 26 weeks: 2 moved; 1 self reported language problems resolved) |
| Wertz 1981 | Group: 17 Conventional: 16 | 22 self discharged (return home or declined to travel), 4 illness, 2 stroke, 3 died, 2 returned to work | No follow‐up | NA |
| Wertz 1986i | Conventional: 7 No SLT: 5 | Illness, new stroke | Conventional: 2 No SLT: 6 | Illness, new stroke |
| Wertz 1986ii | Volunteer‐facilitated: 6 No SLT: 5 | Illness, new stroke | Volunteer‐facilitated: 1 No SLT: 6 | Illness, new stroke |
| Wertz 1986iii | Conventional: 7 Volunteer‐facilitated: 6 | Illness, new stroke | Conventional: 2 Volunteer‐facilitated: 1 | Illness, new stroke |
ANELT: Amsterdam‐Nijmegen Everyday Language Test; SLT: speech and language therapy.
Selective reporting
Recruitment and retention of stroke rehabilitation trial participants is known to be a challenge, and the trials in this review were no exception. However, seven trials only reported data (including demographic data) from participants that remained in the trial at the end of treatment or at follow‐up. David 1982 reported data from 133 of 155 randomised participants, Doesborgh 2004 reported 18 of 19 randomised participants, Katz 1997i reported 36 of 42 randomised participants, Katz 1997ii reported 40 of 42 randomised participants, Lincoln 1984a reported 191 of 327 randomised participants, MacKay 1988 reported 95 of 96 randomised participants, and Smania 2006 reported 33 of 41 randomised participants.
We considered most included studies (54/74) to be at low risk of reporting bias (see Figure 2 and Figure 3). We judged 11 studies as having an unclear risk of reporting bias (Conklyn 2012; Drummond 1981; Elman 1999; Leal 1993; SEMaFORE; Smania 2006; Szaflarski 2014; Wertz 1981; Zhang 2007i; Zhang 2007ii; Zhao 2000), and we considered eight trials to be at high risk of reporting bias (FUATAC; MacKay 1988; Smith 1981i; Smith 1981ii; Smith 1981iii; Wu 2004; Wu 2013; Xie 2002). We provide details of the reporting bias in the Characteristics of included studies.
Twelve trials reported using ITT analysis (ACTNoW 2011; Bakheit 2007; CACTUS 2013; Laska 2011; MIT 2014i; MIT 2014ii; RATS; RATS‐2; SP‐I‐RiT; Varley 2016i; Varley 2016ii, VERSE I). Not all participants appeared to be included in the final analyses within two trials (Bakheit 2007; RATS). In addition, 28 trials that reported participants that had dropped out did not report using ITT analysis (David 1982; Doesborgh 2004; Elman 1999; Katz 1997i; Katz 1997ii; Leal 1993; Lincoln 1982i; Lincoln 1982ii; Lincoln 1982iii; Lincoln 1984a; MacKay 1988; Mattioli 2014; Meikle 1979; Pulvermuller 2001; SEMaFORE; Shewan 1984i; Shewan 1984ii; Shewan 1984iii; Sickert 2014; Smania 2006; Smith 1981i; Smith 1981ii; Smith 1981iii; VERSE II; Wertz 1981; Wertz 1986i; Wertz 1986ii; Wertz 1986iii). We were unable to clarify the number of drop‐outs in three trials (Conklyn 2012; FUATAC; Szaflarski 2014). All randomised participants were included in the final analyses for the remaining 31 trials.
Other potential sources of bias
Some trials that compared the effects of SLT with no SLT also reported co‐interventions. Two groups that received SLT also received acupuncture (Liu 2006a; Zhang 2007ii). Some participants in Doesborgh 2004 received additional psychosocial group therapy, and some (or all) of the participants reported in Smith 1981i may have benefited from other intensive treatment as part of the larger multidisciplinary stroke trial. In both cases, the number and allocation of the participants and specific details of the co‐intervention were unavailable. In other cases, not all participants received the planned number of treatment sessions (Laska 2011; Lincoln 1984a; Smith 1981i; Smith 1981ii).
Similarly, 11 trials that compared two different approaches with SLT provision reported that not all participants received the planned number of treatment sessions (Bakheit 2007; Lincoln 1982i; Lincoln 1982ii; Meikle 1979;MIT 2014i; MIT 2014ii; RATS‐2; Smith 1981iii; SP‐I‐RiT; VERSE I; VERSE II). Meikle 1979 reported that 5 of the 16 participants receiving conventional SLT missed up to half of their possible treatment. Six trials comparing a high‐intensity SLT with a low‐intensity SLT also reported difficulties providing intensive SLT interventions as planned. For example, Bakheit 2007 reported that only 13 of the 51 participants received 80% or more of the planned intensive intervention. Smith 1981iii reported that participants allocated to intensive therapy only received an average of 21 hours of therapy compared to the planned minimum of 50 hours during the first three months. Such difficulties in maintaining a clear distinction between the two treatment groups has significant implications when evaluating the results and considering the clinical implications of such treatment regimens. Similarly, VERSE I found that six individuals did not reach the intensive SLT intervention target of 2.5 hours, but they also reported that resource limitations in the conventional acute care service meant that 23 individuals in the usual care group failed to receive the maximum once weekly therapy as allocated. ORLA 2010 reported difficulty maintaining a consistent intensity of treatment across two treatment arms, with some participants choosing to have more of the allocated 24 treatment sessions per week than others.
Though all the speech and language therapists in Hinckley 2001 received training in the characteristics of the two treatment approaches being compared, treatment review processes were in place to minimise any possible risk of overlap in therapy approach. ACTNoW 2011, Woolf 2015i, Woolf 2015ii, and Woolf 2015iii employed a similar monitoring approach to ensure fidelity to the planned interventions. The computer‐based intervention used in Varley 2016i and Varley 2016ii recorded the self directed computer treatment activity and duration. Data from three randomised comparisons were subgroups of participants with aphasia extracted from within a larger trial examining models of stroke care (Smith 1981i; Smith 1981ii; Smith 1981iii). Being part of a larger stroke trial may have affected their levels of fatigue and ability to participate fully in the SLT intervention. The main trial described the inclusion of 20 participants with mild dementia, but it is unclear whether any of these individuals were included in the aphasia‐specific data.
Effects of interventions
See: Table 1; Table 2; Table 3; Table 4; Table 5
The results of this review are presented below within the three comparisons: SLT versus no SLT, SLT versus social support and stimulation, and SLT A versus SLT B. Where data availability permitted, we also report results from meta‐analyses. As described in the Measures of treatment effect section, we extracted the final value scores for inclusion within this review whenever possible. Change‐from‐baseline data were also available for three trials, but we do not present them in the review (Denes 1996; Hinckley 2001; RATS).
Comparison 1: SLT versus no SLT
A total of 1620 participants were randomised across 27 comparisons that assessed SLT versus no SLT (B.A.Bar 2011i; CACTUS 2013; Conklyn 2012; Doesborgh 2004; Katz 1997i; Katz 1997ii; Laska 2011; Lincoln 1984a; Liu 2006a; Lyon 1997; MacKay 1988; Mattioli 2014; Smania 2006; Smith 1981i; Smith 1981ii; Szaflarski 2014; Varley 2016i; Wertz 1986i; Wertz 1986ii; Wu 2004; Wu 2013; Xie 2002; Yao 2005i; Yao 2005ii; Zhang 2007i; Zhang 2007ii; Zhao 2000). Reporting of age and other participant characteristics varied between trials, making it difficult to give an overview of the participants involved in this comparison. Eight trials reported age ranges, spanning 28 to 94 years of age (CACTUS 2013; Laska 2011; Lincoln 1984a; Lyon 1997; Mattioli 2014; Smania 2006; Varley 2016i; Wu 2004), while others reported participants' mean age or age bands (Table 6). Nineteen trials reported the length of time since onset of aphasia: spanning from two days in Mattioli 2014 to 29 years in CACTUS 2013. The shortest mean length of time since the onset of participants' aphasia was 2.2 (SD 1.3) days (Mattioli 2014). Fourteen trials reported severity of aphasia (B.A.Bar 2011i; CACTUS 2013; Doesborgh 2004; Katz 1997i; Katz 1997ii; Laska 2011; Liu 2006a; Mattioli 2014; Smith 1981i; Smith 1981ii; Wertz 1986i; Wertz 1986ii; Zhang 2007i; Zhang 2007ii), although three additional trials provided some indication of severity of impairment (Conklyn 2012; Lyon 1997; Smania 2006) (Table 6).
Among the SLT interventions compared to a 'no SLT' group were interventions considered to be conventional SLT (Liu 2006a; Mattioli 2014; Smania 2006; Smith 1981ii; Wertz 1986i; Wu 2004; Wu 2013; Xie 2002; Yao 2005ii; Zhang 2007i; Zhang 2007ii; Zhao 2000), computer‐mediated SLT (B.A.Bar 2011i; CACTUS 2013; Doesborgh 2004; Katz 1997i; Katz 1997ii; Varley 2016i), group SLT (Yao 2005i), functional SLT (Lyon 1997), intensive SLT (Laska 2011; Smith 1981i; Szaflarski 2014), language enrichment therapy (Laska 2011), constraint‐induced aphasia therapy (Szaflarski 2014), melodic intonation therapy (Conklyn 2012), SLT plus operant training (Lincoln 1984a), independent training (B.A.Bar 2011i; Varley 2016i), and volunteer‐facilitated SLT (CACTUS 2013; MacKay 1988; Wertz 1986ii). We planned to conduct a sensitivity analysis on trials that involved the provision of SLT by non‐speech and language therapists (Conklyn 2012; Liu 2006a; MacKay 1988; Wertz 1986ii; Xie 2002; Yao 2005i; Yao 2005ii; Zhang 2007i; Zhang 2007ii; Zhao 2000), but because of the present availability of data within each outcome, it was not useful to undertake this analysis.
Appropriate summary data for communication outcomes (allowing inclusion in the meta‐analyses) were available for 17 of the 27 trials (B.A.Bar 2011i; CACTUS 2013; Doesborgh 2004; Katz 1997i; Katz 1997ii; Liu 2006a; Lincoln 1984a; Mattioli 2014; Smania 2006; Varley 2016i; Wertz 1986i; Wertz 1986ii; Yao 2005i; Yao 2005ii; Zhang 2007i; Zhang 2007ii; Zhao 2000). In addition, Lincoln 1984a also reported statistical data for psychosocial outcomes. Suitable communication outcome summary data were not reported (or available on request) for the remaining nine trials (Conklyn 2012, Lyon 1997; MacKay 1988;Szaflarski 2014; Smith 1981i; Smith 1981ii; Wu 2004; Wu 2013; Xie 2002). However, Xie 2002 presented some summary data in a table that indicated language function at end of the trial intervention on a scale (no effect, progress, obvious effect, recovery), and using this data, we constructed means and standard deviation data by assigning numerical values (0 to 3) to each scale point. However, we noted that the presentation of the table did not match the description of results in the text; in fact, the table reported an adverse intervention effect and deterioration over time, which we believe was an error that was rectified by inverting the scale reported. Where data for this comparison were available, we present them below in relation to: functional communication, receptive language, expressive language, severity of impairment, psychosocial impact, number of dropouts, adherence to allocated intervention, and economic outcomes.
1. Functional communication
Thirteen trials compared participants that received SLT with those that did not, by measuring functional communication outcomes (B.A.Bar 2011i; Doesborgh 2004; Katz 1997i; Katz 1997ii; Mattioli 2014; Laska 2011; Lincoln 1984a; Lyon 1997; MacKay 1988; Wertz 1986i; Wertz 1986ii; Zhang 2007i; Zhang 2007ii). Tools used included the spontaneous speech subtest of the Western Aphasia Battery (WAB) (Katz 1997i; Katz 1997ii), the Amsterdam‐Nijmegen Everyday Language Test (ANELT) (B.A.Bar 2011i; Doesborgh 2004; Laska 2011), the AAT (spontaneous speech) (Mattioli 2014) the Communication Activities of Daily Living (CADL) (Wertz 1986i; Wertz 1986ii), the Functional Communication Profile (FCP) (Lincoln 1984a; Wertz 1986i; Wertz 1986ii), the Aachen‐Sprach‐Analysis (B.A.Bar 2011i), and the Chinese Functional Communication Profile (Zhang 2007i; Zhang 2007ii). Ten trials provided suitable statistical data permitting inclusion within the meta‐analyses (B.A.Bar 2011i; Doesborgh 2004; Katz 1997i; Katz 1997ii; Laska 2011; Mattioli 2014; Wertz 1986i; Wertz 1986ii; Zhang 2007i; Zhang 2007ii).
Spontaneous speech
Six trials evaluated the impact of SLT by contrasting the spontaneous speech of participants. Intervention groups received computer‐mediated SLT in four trials (B.A.Bar 2011i; Doesborgh 2004; Katz 1997i; Katz 1997ii), and they received language enrichment therapy in two (Laska 2011; Mattioli 2014). Control groups received no intervention in Doesborgh 2004, Katz 1997i, Laska 2011, and Mattioli 2014, and they received computer‐mediated non‐linguistic tasks in B.A.Bar 2011i and Katz 1997ii). Investigators carried out comparisons using a subtest of the WAB (Katz 1997i; Katz 1997ii), the ANELT (B.A.Bar 2011i; Doesborgh 2004; Laska 2011), or the AAT (Mattioli 2014).
Communication Activities of Daily Living (CADL)
Four trials used the CADL to compare the functional communication skills of participants that received conventional SLT (Wertz 1986i), volunteer‐facilitated SLT (MacKay 1988; Wertz 1986ii), and functional SLT (Lyon 1997), versus those that received no SLT intervention. Two trials provided statistical data that allowed inclusion within a meta‐analysis (Wertz 1986i; Wertz 1986ii).
Functional Communication Profile (FCP)
Three trials compared the pragmatic provision of SLT (approach tailored to individual participants' needs) to a deferred SLT intervention using the FCP (Lincoln 1984a; Wertz 1986i; Wertz 1986ii). Appropriate summary data for Lincoln 1984a on this outcome measure were not available.
Chinese Functional Communication Profile (CFCP)
Zhang 2007i and Zhang 2007ii used the CFCP to compare groups that received SLT and no SLT. One SLT group also received an acupuncture co‐intervention and scored higher on the CFCP than those that had received no SLT (Zhang 2007ii).
We pooled the results of functional communication measures reported across the trials within a meta‐analysis. We only included one set of functional communication measures from Wertz 1986i and Wertz 1986ii at a time. Participants that received SLT performed better on measures of functional communication than those that did not receive SLT (when including the CADL data: P = 0.03, SMD 0.23, 95% CI 0.02 to 0.44 or when including FCP data: P = 0.01, SMD 0.28, 95% CI 0.06 to 0.49). We have chosen to present the data from the FCP within the forest plot (Analysis 1.1).
1.1. Analysis.
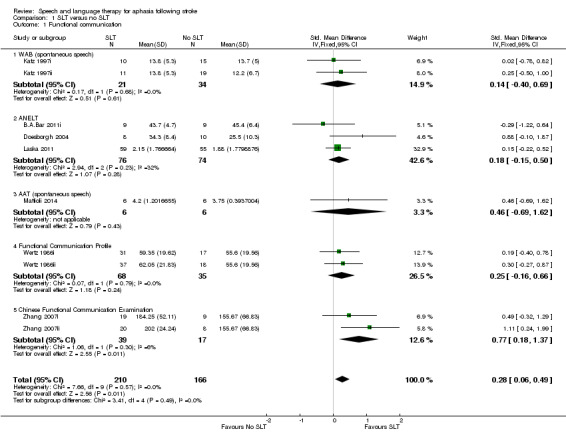
Comparison 1 SLT versus no SLT, Outcome 1 Functional communication.
2. Receptive language
Twelve of the 27 trials measured participants' receptive language skills (CACTUS 2013, Katz 1997i; Katz 1997ii; Laska 2011; Mattioli 2014; Smania 2006; Varley 2016i; Wertz 1986i; Wertz 1986ii; Xie 2002; Zhang 2007i; Zhang 2007ii), and all but two reported statistical data that permitted inclusion in the meta‐analyses (Varley 2016i; Xie 2002). We calculated suitable summary data from Xie 2002's published table of results (as described above). Investigators assessed auditory comprehension using the Token Test and subtests of the WAB, the Norsk Grunntest for Afasi (NGA), the Aphasia Battery of Chinese (ABC), the Comprehensive Aphasia Test (CAT), and the PICA. Reading comprehension was measured using the Reading Comprehension Battery for Aphasia (RCBA) and the reading subtests of the PICA, the CAT, and the ABC. Gesture comprehension was measured using an unnamed assessment.
Auditory comprehension
Five trials used the Token Test to measure changes in participants' auditory comprehension (CACTUS 2013, Mattioli 2014; Smania 2006; Wertz 1986i; Wertz 1986ii). Two trials used the ABC auditory comprehension subtest (Zhang 2007i; Zhang 2007ii). Laska 2011 reported using the NGA, CACTUS 2013 the CAT spoken word and spoken sentence subtests, and Mattioli 2014 the AAT subtest. Two trials used both the WAB and PICA subtests to measure participants' auditory comprehension (Katz 1997i; Katz 1997ii). We could not include both sets of data from Katz 1997i; Katz 1997ii, CACTUS 2013 and Mattioli 2014 in the same meta‐analysis. On pooling the data within two separate meta‐analyses, there was no evidence of a significant difference between the groups. We have chosen to present the PICA (Katz 1997i; Katz 1997ii), the CAT (spoken sentence comprehension subtest), and Token Test data (Mattioli 2014) within the forest plot (Analysis 1.2). For pooled analyses using the Mattioli 2014 AAT data and the Katz 1997i and Katz 1997ii WAB data, there was no evidence of a difference between the groups (P = 0.57, SMD 0.06, 95% CI −0.15 to 0.26).
1.2. Analysis.
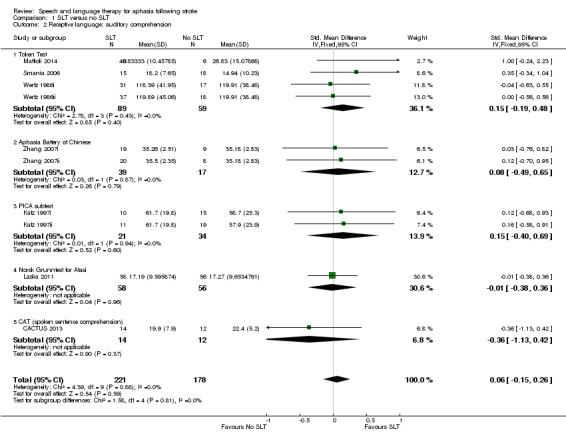
Comparison 1 SLT versus no SLT, Outcome 2 Receptive language: auditory comprehension.
Reading comprehension
Nine trials assessed reading comprehension, comparing participants that received SLT and those that did not (CACTUS 2013, Katz 1997i; Katz 1997ii; Meikle 1979; Varley 2016i; Wertz 1986i; Wertz 1986ii; Zhang 2007i; Zhang 2007ii). Two trials used the RCBA to compare participants that received volunteer‐facilitated SLT with those that received no SLT (Wertz 1986i; Wertz 1986ii). Similarly, two trials used the PICA reading subtest to compare participants that received computer‐mediated SLT to those that received no treatment or computer‐mediated non‐linguistic tasks (Katz 1997i; Katz 1997ii). Another three trials compared the performance of participants that received SLT with those that did not using the reading subtest of the ABC (Zhang 2007i; Zhang 2007ii), subtests from the CAT (written word or sentence comprehension; CACTUS 2013), or the AAT reading comprehension subtest (Mattioli 2014). Varley 2016i did not report data suitable for inclusion in the meta‐analysis. The participants that received SLT in Zhang 2007ii also received an acupuncture co‐intervention. On pooling of the available data with the CAT data on written word comprehension, the participants that received SLT performed better on tests of reading comprehension than those that did not receive SLT (P = 0.03, SMD 0.29, 95% CI 0.03 to 0.55; CACTUS 2013; Analysis 1.3). If pooling data from CACTUS 2013 CAT subtest of written sentence comprehension, there was no longer evidence of a difference between the groups (P = 0.05; SMD 0.03, 95% CI 0.00 to 0.52). Plotting these outcome measures against the estimated standard errors within a funnel plot, we found that the result from one of the trials based on the ABC fell outside the 95% CI (Figure 4). We will consider this issue further in the Discussion section.
1.3. Analysis.
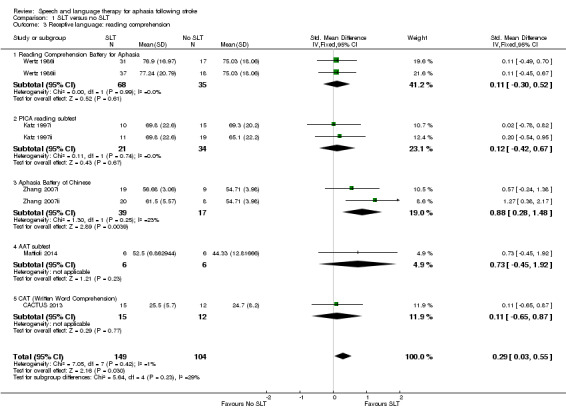
Comparison 1 SLT versus no SLT, Outcome 3 Receptive language: reading comprehension.
4.
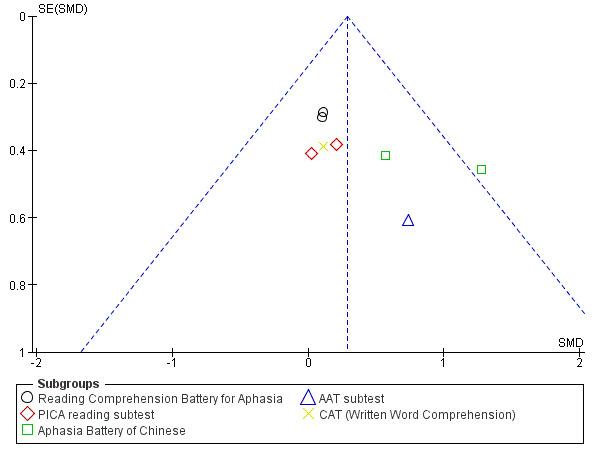
Funnel plot of comparison: 1 SLT versus no SLT, outcome: 1.3 Receptive language: reading comprehension.
Other comprehension
Four trials used the PICA gestural subtest, which measures gestural abilities alongside auditory and written comprehension skills (Katz 1997i; Katz 1997ii; Wertz 1986i; Wertz 1986ii). Xie 2002 employed the Chinese Language Impairment Examination. Following pooling, participants that received SLT had achieved higher scores on measures of gesture use than the groups that received no SLT (P = 0.03, SMD 1.23, 95% CI 0.11 to 2.36). However, we also observed significant heterogeneity (P < 0.00001; I2 = 91%) which was no longer observed when the Xie 2002 data was removed from the meta‐analysis, al though this did not impact on the findings (P = 0.04, SMD 0.34, 95% CI 0.01 to 0.67) (Analysis 1.4).
1.4. Analysis.
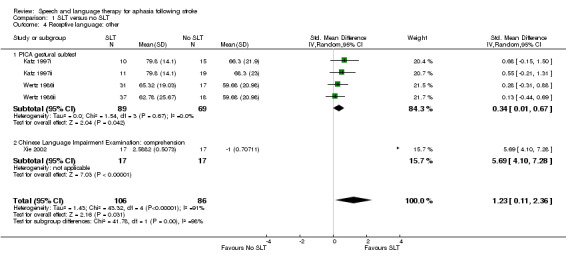
Comparison 1 SLT versus no SLT, Outcome 4 Receptive language: other.
3. Expressive language
Twelve trials formally evaluated participants' expressive language skills using single word picture naming (Boston Naming Test (BNT), the WAB and NGA naming subtests, the AAT, the Object and Action Naming Battery or other naming tests), repetition (WAB and NGA repetition subtests), and other verbal expression (PICA and ABC sub tests) skills (CACTUS 2013; Doesborgh 2004; Katz 1997i; Katz 1997ii; Laska 2011; Mattioli 2014; Szaflarski 2014; Varley 2016i; Wertz 1986i; Wertz 1986ii; Zhang 2007i; Zhang 2007ii). Written language expressive skills were measured using the PICA copying and writing subtests and the ABC writing subtest, while the ability to communicate using gesture was measured using the PICA gesture subtest.
Expressive language: naming
Eight trials measured participants' naming abilities (CACTUS 2013; Doesborgh 2004; Katz 1997i; Katz 1997ii; Laska 2011Mattioli 2014; Szaflarski 2014; Varley 2016i). Three trials used the BNT or naming accuracy (treated, matched and control items) to compare a group receiving computer‐mediated SLT or constraint‐induced aphasia therapy versus a group that did not receive SLT (Doesborgh 2004; Szaflarski 2014; Varley 2016i). Data from Szaflarski 2014 were not available at the time of this review. Katz 1997i and Katz 1997ii employed the WAB naming subtest, while Laska 2011 used the NGA naming subtest, Mattioli 2014 used the AAT subtest, and CACTUS 2013 used items from the Object and Action Naming Battery. On pooling, there was no evidence of a difference between the groups regardless of whether the treated, matched or control items from Varley 2016i were included in the analysis. We present the meta‐analysis that includes the matched items from Varley 2016i (P = 0.26, SMD 0.14, 95% CI −0.10 to 0.38; Analysis 1.5).
1.5. Analysis.
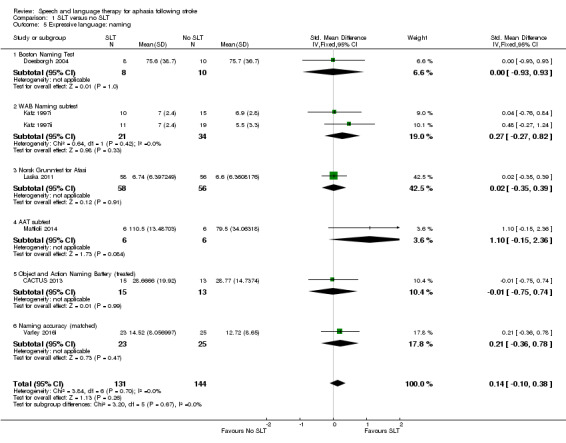
Comparison 1 SLT versus no SLT, Outcome 5 Expressive language: naming.
Expressive language: general
Five trials used the PICA verbal subtest to compare the spoken language skills of patient groups that received SLT and those that did not (Katz 1997i; Katz 1997ii; Wertz 1986i; Wertz 1986ii; Xie 2002). Two additional trials captured participants' expressive language skills using a subtest of the ABC (Zhang 2007i; Zhang 2007ii). On pooling the data using SMDs, there was evidence of significant statistical heterogeneity between the groups (P < 0.00001; I2 = 89%), so we used a random‐effects model to pool the data. Participants that had received SLT scored significantly better on general measures of expressive language skills (P = 0.005, SMD 1.28, 95% CI 0.38 to 2.19) (Analysis 1.6). Conducting a sensitivity analysis, we found that when we removed Xie 2002, Zhang 2007i, and Zhang 2007ii from the analysis, the heterogeneity disappeared (I2 = 0%), and the pooled results no longer demonstrated a significant difference between the groups. We will consider this issue further in the Discussion section.
1.6. Analysis.
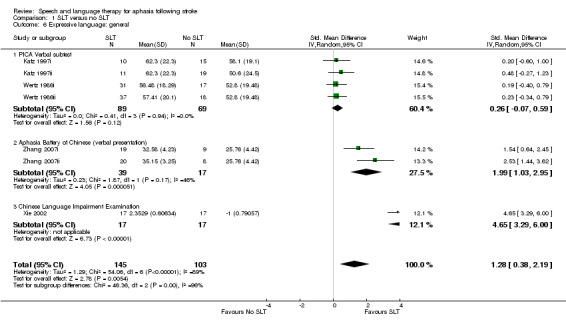
Comparison 1 SLT versus no SLT, Outcome 6 Expressive language: general.
Expressive language: written
Eight trials reported comparing a group receiving SLT with a group receiving no SLT using writing subtests of the PICA (Katz 1997i; Katz 1997ii), the ABC (Zhang 2007i; Zhang 2007ii), the AAT (Mattioli 2014), the CAT (CACTUS 2013), and the PICA graphic subtest (Wertz 1986i; Wertz 1986ii). Following pooling, participants that had received SLT performed better on the writing subtests than those that had not received SLT (P = 0.003, SMD 0.41, 95% CI 0.14 to 0.67) (Analysis 1.7). Plotting these outcome measures against the estimated standard errors within a funnel plot, we found that the result from one of the trials based on the ABC fell outside the 95% CI (Figure 5). We will consider this issue further in the Discussion section.
1.7. Analysis.
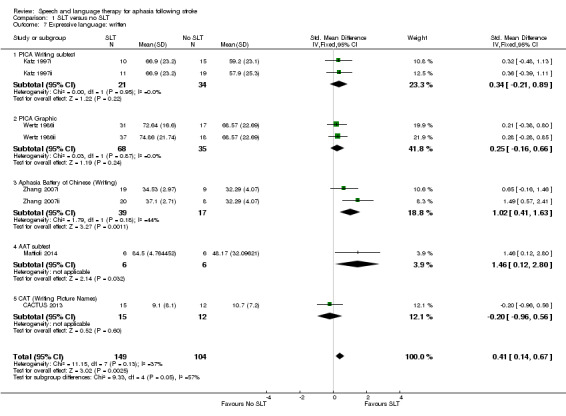
Comparison 1 SLT versus no SLT, Outcome 7 Expressive language: written.
5.
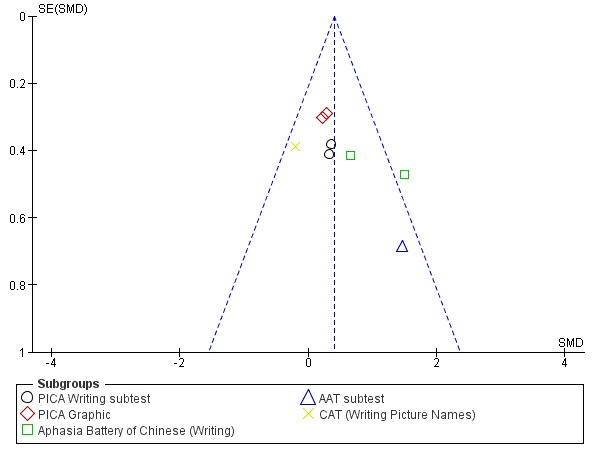
Funnel plot of comparison: 1 SLT versus no SLT, outcome: 1.7 Expressive language: written.
Expressive language: copying text
Two trials compared a group receiving computer‐mediated SLT with a group receiving no SLT or a group receiving computer‐mediated non‐linguistic tasks using the PICA copying subtest (Katz 1997i; Katz 1997ii). There was no evidence of a difference between the groups' copying skills (Analysis 1.8).
1.8. Analysis.
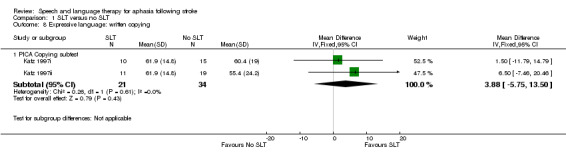
Comparison 1 SLT versus no SLT, Outcome 8 Expressive language: written copying.
Expressive language: repetition
Four trials compared participants that received SLT and those that did not by measuring their repetition skills on the WAB subtest (Katz 1997i; Katz 1997ii), the NGA subtest (Laska 2011), and a repetition accuracy test (Varley 2016i). Following pooling of the available data (using the matched items from Varley 2016i), there was no evidence of a difference in the participants' repetition skills (Analysis 1.9). This did not alter if the treated or control items were used from Varley 2016i.
1.9. Analysis.
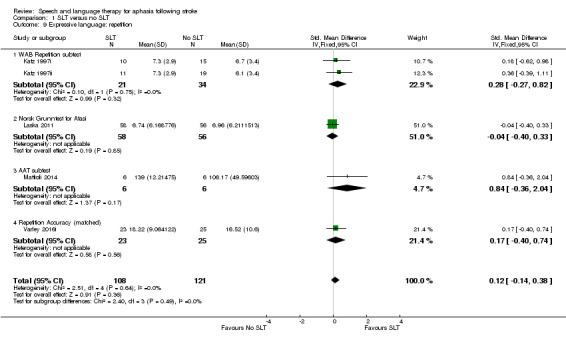
Comparison 1 SLT versus no SLT, Outcome 9 Expressive language: repetition.
Expressive language: fluency
B.A.Bar 2011i measured changes in word fluency using the Regensburg Word Fluency Test (food and animals). Szaflarski 2014 used the Semantic Fluency Test, but there were no data available. There was no evidence of a difference between the groups (Analysis 1.10).
1.10. Analysis.
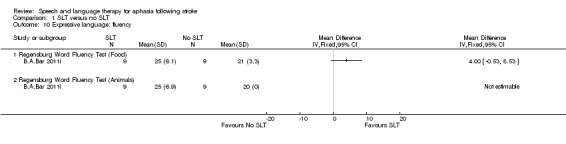
Comparison 1 SLT versus no SLT, Outcome 10 Expressive language: fluency.
4. Severity of impairment
Seventeen trials compared a group that received SLT with one that did not receive any SLT by measuring the severity of the participants' aphasia impairment. Language assessment batteries included the PICA (Katz 1997i; Katz 1997ii; Lincoln 1984a; Wertz 1986i; Wertz 1986ii), the Boston Diagnostic Aphasia Examination (BDAE) (Liu 2006a; Lyon 1997, Wu 2013), the Chinese Aphasia Measurement (Zhao 2000), the WAB (Katz 1997i; Katz 1997ii; Wu 2013), the Minnesota Test for Differential Diagnosis of Aphasia (MTDDA) (Smith 1981i; Smith 1981ii), the NGA (Laska 2011), the Chinese Rehabilitation Research Centre Aphasia Examination (CRRCAE) (Wu 2013; Yao 2005i; Yao 2005ii), the Aphasia Battery of Chinese (ABC) (Zhang 2007i; Zhang 2007ii), and the Chinese Language Impairment Examination (Xie 2002). Included trials compared the severity of participants' aphasia between groups that received group SLT (Yao 2005i), computer‐mediated SLT (Katz 1997i; Katz 1997ii), conventional SLT (Liu 2006a; Wertz 1986i; Wu 2013, Yao 2005ii; Zhang 2007i; Zhang 2007ii; Zhao 2000), language training (Xie 2002), and volunteer‐facilitated SLT (Wertz 1986ii), versus groups that received no SLT or a computer‐mediated non‐SLT intervention (Katz 1997ii). We were able to obtain statistical summary data suitable for inclusion within a meta‐analysis from all but six trials (Lincoln 1984a; Lyon 1997; Smith 1981i; Smith 1981ii; Xie 2002; Wu 2013).
Pooling the available data (selectively including the PICA data from Katz 1997i and Katz 1997ii) using SMDs, we observed significant heterogeneity (I2 = 93%, P < 0.00001). Thus, we pooled the data using a random‐effects model. The heterogeneity remained. There was no evidence of a significant difference between the groups that received SLT and those that did not (Analysis 1.11). On conducting a sensitivity analysis to identify the source of the heterogeneity, we observed that removing the Zhao 2000 data from the meta‐analysis eliminated the heterogeneity (I2 = 0%). The pooled data also demonstrated no significant difference between the aphasia severity ratings between the groups regardless of whether the PICA data from Katz 1997i and Katz 1997ii were included (P = 0.08, SMD 0.17, 95% CI −0.02 to 0.36). Conducting the same analysis but including the WAB data from Katz 1997i and Katz 1997ii resulted in no evidence of a significant difference between the groups (P = 0.09, SMD 0.15, 95% CI −0.04 to 0.34). We have chosen to present the PICA data (Analysis 1.11). The funnel plot of Analysis 1.11 (Figure 6) showed that the outcome based on the Chinese Aphasia Measurement fell outside the 95% CI. We will return to this issue within the Discussion section.
1.11. Analysis.
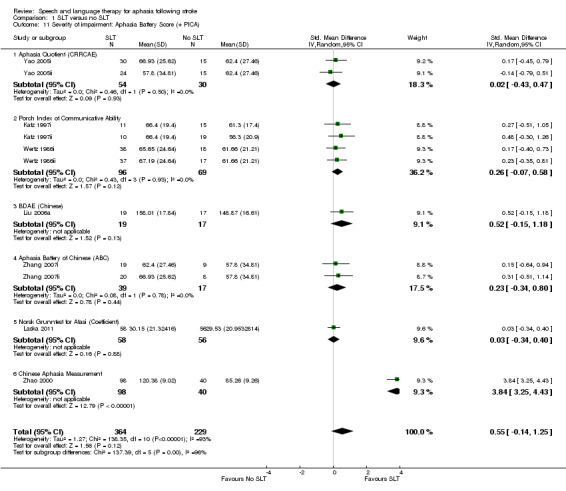
Comparison 1 SLT versus no SLT, Outcome 11 Severity of impairment: Aphasia Battery Score (+ PICA).
6.
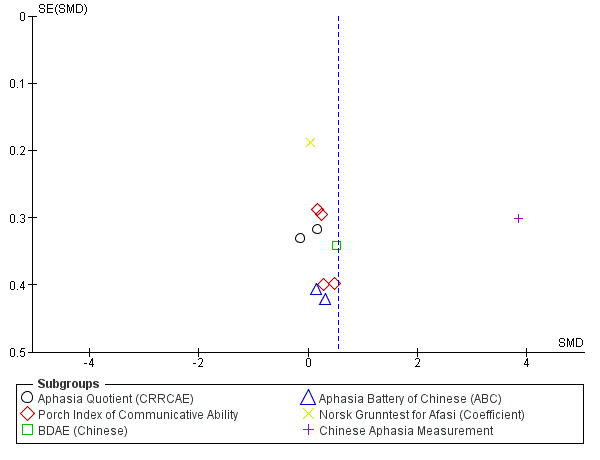
Funnel plot of comparison: 1 SLT versus no SLT, outcome: 1.11 Severity of impairment: Aphasia Battery Score (+ PICA).
5. Mood
Five trials compared the benefits of an SLT intervention to no SLT by employing psychosocial measures including the Multiple Affect Adjective Checklist (MAACL), the General Health Questionnaire (GHQ), the Affect Balance Scale (ABS), the Psychological Wellbeing Index, the EuroQoL, and the Nottingham Health Profile (NHP) (Laska 2011; Lincoln 1984a; Lyon 1997; Smith 1981i; Smith 1981ii).
Lyon 1997 used the ABS and Psychological Wellbeing Index to compare a group of triads (person with aphasia, caregiver and communication partner) that received functional SLT aiming to establish and maximise effective means of communication between communication partners and a group that received no SLT. Smith 1981i and Smith 1981ii used the GHQ to compare groups that received either intensive SLT or conventional SLT with a group that received no treatment, while Laska 2001 reported capturing data using the EuroQol and the NHP. No suitable data were available from these trials. In contrast, Lincoln 1984a used the anxiety, depression and hostility scales of the MAACL to compare the psychosocial well‐being of a group that received SLT (determined by the therapist) with a group that received no SLT. Comparison of the groups failed to show any evidence of a difference in the participants' anxiety, depression or hostility as measured on these scales (Analysis 1.12).
1.12. Analysis.
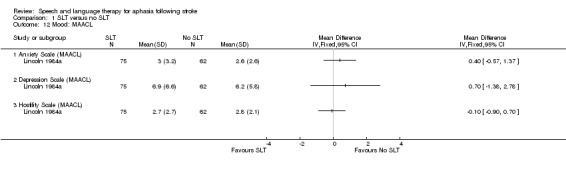
Comparison 1 SLT versus no SLT, Outcome 12 Mood: MAACL.
6. Number of dropouts
Information relating to the numbers of participant dropouts (where they occurred) was available for all but two trials in this comparison (Conklyn 2012, Szaflarski 2014). A total of 235 individuals withdrew during the treatment phase. Thirteen trials reported no withdrawals (B.A.Bar 2011i; CACTUS 2013; Liu 2006a; Lyon 1997; Mattioli 2014; Wu 2004; Wu 2013, Xie 2002, Yao 2005i; Yao 2005ii; Zhang 2007i; Zhang 2007ii; Zhao 2000). An additional five participants withdrew from Smith 1981i and Smith 1981ii (group allocation is unclear, but these withdrawals are included in the number above), and they failed to report the number of withdrawals from the 'no SLT' group. There was a range of reasons for the attrition of participants from the trials (see Table 7 for details). On pooling of the available data relating to dropouts, there was no evidence of a difference between the groups (Analysis 1.14).
1.14. Analysis.
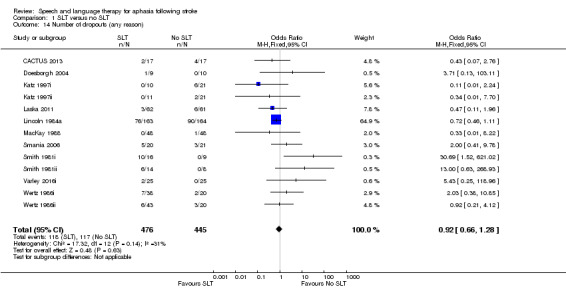
Comparison 1 SLT versus no SLT, Outcome 14 Number of dropouts (any reason).
7. Adherence to allocated intervention
Only 5 of the 15 trials reporting participant dropouts described the reasons for the 26 participants' withdrawal (CACTUS 2013; Doesborgh 2004; Laska 2011; Smania 2006; Varley 2016i). Of these, a total of 21 participants were described as withdrawing because they were uncooperative or they refused the allocated treatment with nine withdrawing from the conventional SLT group and 12 withdrawing from the 'no SLT' group. Four participants in Laska 2011 refused testing (one from the SLT group; three from the no SLT group). Details can be found in Table 7. On pooling there was no indication of a difference in adherence rates between the groups.
8. Economic outcomes
Two of the 19 randomised comparisons described the measurement of economic outcomes: MacKay 1988 using structured questionnaires and CACTUS 2013 the EQ‐5D (and the patient visual analogue scale (VAS)) and resource use (diary based). Only data from CACTUS 2013 were available for this review, and there was no evidence of a difference between the groups (Analysis 1.13).
1.13. Analysis.
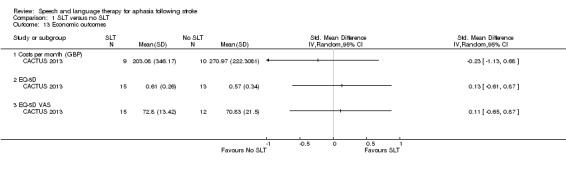
Comparison 1 SLT versus no SLT, Outcome 13 Economic outcomes.
9. Follow‐up data (comparison 1: SLT versus no SLT)
Eight trials comparing SLT versus no SLT also gathered data at a follow‐up point after the formal intervention period. Of these trials, B.A.Bar 2011ii and Szaflarski 2014 did not report data suitable for inclusion in the review, while data from the remaining six trials are presented below in relation to: functional communication, receptive language, expressive language, severity of impairment, number of dropouts, and adherence to allocated intervention (CACTUS 2013; Laska 2011, Mattioli 2014; Smania 2006; Yao 2005i; Yao 2005ii).
1. Functional communication
Both Laska 2011 and Mattioli 2014 measured functional communication at six months using the ANELT and the AAT and compared performance of people who received SLT and those that did not. There was no evidence of a difference between the groups (Analysis 2.1).
2.1. Analysis.
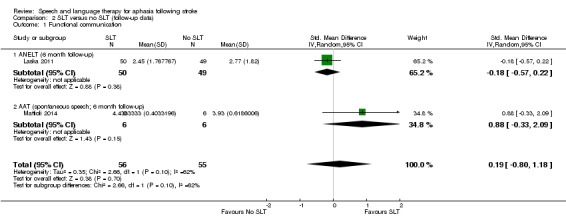
Comparison 2 SLT versus no SLT (follow‐up data), Outcome 1 Functional communication.
2. Receptive language
Auditory comprehension
Participants' auditory comprehension six months following intervention was compared using the AAT subtest (Mattioli 2014), the Token Test (Mattioli 2014), and the NGA (Laska 2011). To avoid double‐counting the Mattioli 2014 trial data, we presented the pooled data using the AAT auditory comprehension subtest data (Analysis 2.2). There was no evidence of a difference between the groups. We obtained similar findings in the meta‐analysis using the Token Test (P = 0.45; 1.24 CI 95% −1.94 to 4.41).
2.2. Analysis.
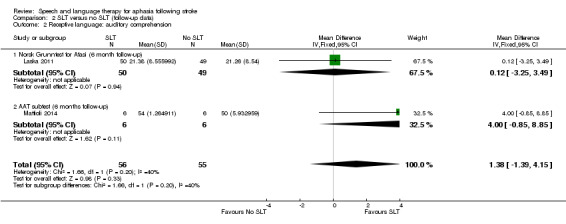
Comparison 2 SLT versus no SLT (follow‐up data), Outcome 2 Receptive language: auditory comprehension.
Reading
Mattioli 2014 also assessed reading in participants receiving SLT versus no SLT using the AAT subtest; there was no evidence of a different between the groups (Analysis 2.3).
2.3. Analysis.
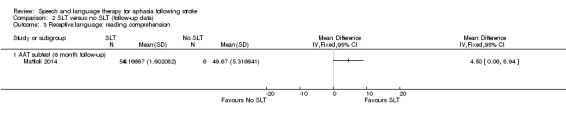
Comparison 2 SLT versus no SLT (follow‐up data), Outcome 3 Receptive language: reading comprehension.
4. Expressive language
Naming
CACTUS 2013 evaluated the naming abilities of participants who had received SLT versus those that had not at three months follow‐up using items from the Object and Action Naming Battery, while at six months, Laska 2011 used the NGA, and Mattioli 2014 the AAT naming subtest (Analysis 2.4).
2.4. Analysis.
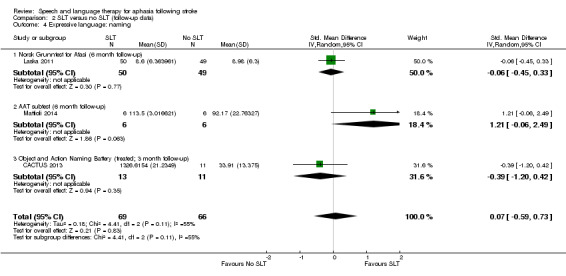
Comparison 2 SLT versus no SLT (follow‐up data), Outcome 4 Expressive language: naming.
Writing
Similarly, Mattioli 2014 used the AAT written subtest to evaluate writing abilities (Analysis 2.5).
2.5. Analysis.
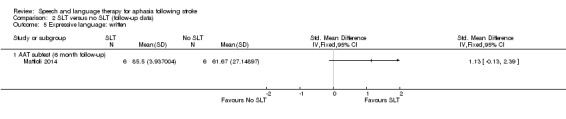
Comparison 2 SLT versus no SLT (follow‐up data), Outcome 5 Expressive language: written.
Repetition
Mattioli 2014 and Laska 2011 also assessed repetition abilities using the AAT repetition subtest and the NGA, respectively, at six months after intervention (Analysis 2.6). There was no evidence of a difference between the groups on any of these measures of expressive language ability at three or six months' follow‐up.
2.6. Analysis.
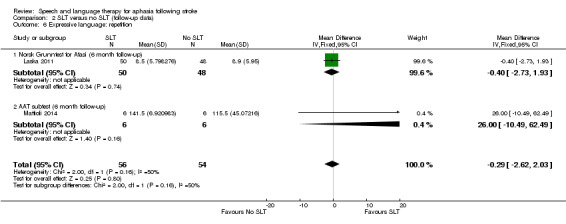
Comparison 2 SLT versus no SLT (follow‐up data), Outcome 6 Expressive language: repetition.
5. Severity of impairment
At six months follow‐up, Laska 2011 compared the severity of participants' aphasia using the NGA, and Yao 2005i and Yao 2005ii used the CRRCAE Aphasia Quotient. On pooling the data, there was no evidence of a difference between the groups (Analysis 2.7).
2.7. Analysis.
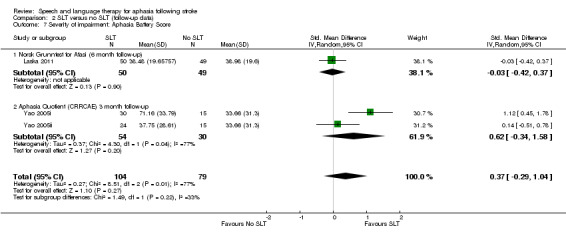
Comparison 2 SLT versus no SLT (follow‐up data), Outcome 7 Severity of impairment: Aphasia Battery Score.
6. Economic outcomes
The CACTUS 2013 trial captured EQ‐5D and Patient VAS data at three‐month follow‐up after the end of treatment and found no evidence of a difference between the groups (Analysis 2.8).
2.8. Analysis.
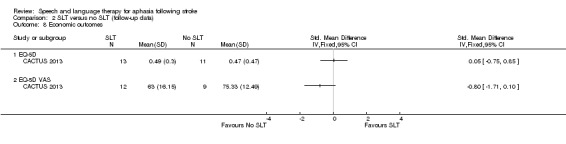
Comparison 2 SLT versus no SLT (follow‐up data), Outcome 8 Economic outcomes.
7. Number of dropouts
Six trials also reported attrition from the follow‐up data collection point (CACTUS 2013; Laska 2011, Smania 2006, Mattioli 2014; Wertz 1986i, Wertz 1986ii). Of 181 participants receiving SLT, 21 were reported as lost to follow‐up, while 25 of the 136 people who did not receive SLT were not followed up. There was no evidence of a difference between the groups (Analysis 2.9).
2.9. Analysis.
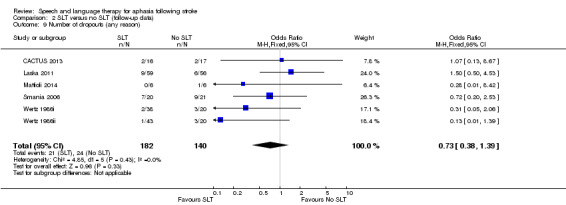
Comparison 2 SLT versus no SLT (follow‐up data), Outcome 9 Number of dropouts (any reason).
Comparison 2: SLT versus social support and stimulation
Nine trials compared the provision of SLT to the provision of informal social support and stimulation in a total of 447 participants (ACTNoW 2011; David 1982; Elman 1999; Lincoln 1982iii; Rochon 2005; Shewan 1984ii; Shewan 1984iii, Woolf 2015ii; Woolf 2015iii). Descriptions of participant groups within trials were variable, so it is difficult to give a precise overview of the participants included in this comparison. Most trials described the participants' age range, which spanned from 18 to 97 years (ACTNoW 2011; Elman 1999; Lincoln 1982iii; Rochon 2005; Shewan 1984ii; Shewan 1984iii). David 1982 reported that participants in the SLT and social support and stimulation groups had a mean age of 70 (SD 8.7) years and 65 (SD 10.6) years, respectively, indicating a significant difference between the groups (P = 0.003). Details can be found in Table 6. All nine trials detailed the length of time since aphasia onset. ACTNoW 2011 randomised participants with the most acute aphasia (interquartile range (IQR) 9 to 16 days duration). Similarly, Shewan 1984ii and Shewan 1984iii recruited people at two to four weeks post onset of aphasia. In contrast, Lincoln 1982iii recruited participants at 1 to 36 months' poststroke, while Woolf 2015ii and Woolf 2015iii recruited at a mean of 31.8 (14.11) and 35.2 (33.16) months post onset, respectively. Other trials recruited participants much later after stroke, ranging from 2 to 9 years in Rochon 2005 to 7 months to 28 years in Elman 1999. All nine trials reported on severity of aphasia to varying degrees of detail. Lincoln 1982iii recruited participants with moderate degrees of aphasia. Six trials described the recruitment of participants with a range of mild to severe aphasia (ACTNoW 2011; David 1982; Elman 1999; Rochon 2005; Shewan 1984ii; Shewan 1984iii), and two trials reported scores on a naming measure (Woolf 2015ii; Woolf 2015iii) (Table 6).
There were a number of approaches to the provision of SLT interventions in the trials: five provided conventional SLT (ACTNoW 2011; David 1982; Lincoln 1982iii; Shewan 1984iii; Woolf 2015iii), and the others provided group SLT (Elman 1999), sentence‐mapping SLT (Rochon 2005), language‐orientated SLT (Shewan 1984ii), or telerehabilitation SLT (Woolf 2015ii). These SLT interventions were then compared with the provision of social support and stimulation, which also took a variety of formats. Unstructured support and communicative stimulation were provided by nurses (Shewan 1984ii; Shewan 1984iii), a trained research assistant (Rochon 2005), a clinical psychologist (Lincoln 1982iii), speech and language therapy students (Woolf 2015ii ; Woolf 2015iii), paid visitors (ACTNoW 2011; David 1982), or through attendance at an externally organised support group or class, for example dance classes or church groups (Elman 1999). Most were face‐to‐face social support. Two used an Internet‐supported videoconferencing tool. Some volunteers had been given detailed information about their own participant's particular presentation of aphasia (David 1982), but they were not given any training in SLT techniques (ACTNoW 2011; David 1982; Lincoln 1982iii; Shewan 1984ii; Shewan 1984iii). Two trials had a specific, non‐therapeutic intervention protocol for the people providing the social support and stimulation intervention, which detailed the role and suitable non‐communication therapy activities (ACTNoW 2011; Lincoln 1982iii). Other providers of social support received a handbook and training in supported conversation (Woolf 2015ii; Woolf 2015iii). Six trials described intervention fidelity monitoring (ACTNoW 2011; Shewan 1984ii; Shewan 1984iii; David 1982; Woolf 2015ii; Woolf 2015iii), together with monitoring of a percentage of the overall sessions in three of these (David 1982; Woolf 2015ii; Woolf 2015iii). The participants in these groups received social support for up to one hour (ACTNoW 2011; Rochon 2005), two hours (David 1982; Lincoln 1982iii; Woolf 2015ii; Woolf 2015iii), or three hours (Elman 1999; Shewan 1984ii; Shewan 1984iii), each week over a period of up to 1 month (Lincoln 1982iii; Woolf 2015ii; Woolf 2015iii), 2.5 months (Rochon 2005), 4 months (ACTNoW 2011; Elman 1999), 5 months (David 1982), or one year (Shewan 1984ii; Shewan 1984iii). Statistical data for communication outcomes were available for six of the included trials (ACTNoW 2011; David 1982; Lincoln 1982iii; Rochon 2005; Woolf 2015ii; Woolf 2015iii). Suitable data allowing inclusion within the meta‐analyses were unavailable for the remaining three trials (Elman 1999; Shewan 1984ii; Shewan 1984iii). We report the comparisons made (with meta‐analysis where possible) below as they relate to measures of: functional communication, receptive language, expressive language, severity of impairment, psychosocial impact, number of dropouts, adherence to allocated intervention, and economic outcomes.
1. Functional communication
Five trials measured functional communication using the FCP, the CADL, the CETI, Therapy Outcome Measures (TOMs), and discourse analysis approaches (ACTNoW 2011; David 1982; Elman 1999; Woolf 2015ii; Woolf 2015iii).
Functional Communication Profile (FCP)
David 1982 used the FCP to compare a group who received conventional SLT with a group that received communication treatment by volunteers. There was no evidence of a difference between the groups (Analysis 3.1).
3.1. Analysis.
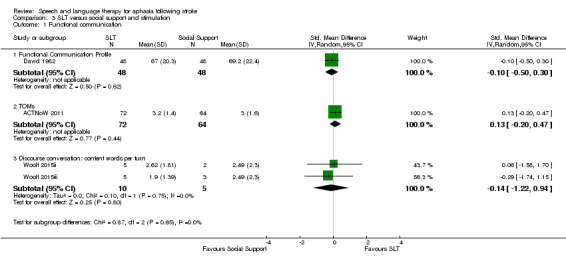
Comparison 3 SLT versus social support and stimulation, Outcome 1 Functional communication.
Communication Abilities of Daily Living (CADL) and the Communicative Effectiveness Index (CETI)
Elman 1999 used the CADL, the CETI and measures of connected speech to compare the functional communication skills of participants that received conventional SLT and those that attended social groups and activities instead. The trial did not provide suitable summary data, so we could not include the results in the meta‐analysis.
Therapy Outcome Measures (TOMs)
ACTNoW 2011 used the TOMs to compare blinded ratings of video‐recorded samples of functional communication skills in participants that had received conventional SLT and those that had received social support and stimulation from a volunteer.
Discourse analyses approaches
Two trials used discourse analysis approaches to examine the use of substantive turns, content words per turn and the number of nouns per turn used by participants in a conversational interaction (Woolf 2015ii; Woolf 2015iii). The groups had received either SLT or an Internet‐based conference conversational intervention.
The measure of content words per turn was pooled with the other data in Analysis 3.1, and there was no evidence of a significant difference between the groups that had received SLT and those that had received informal social support. Pooling using the other discourse measures made no difference to this finding.
2. Receptive language
Four of the nine trials that compared participants that received SLT or a social support and stimulation intervention did so by comparing the groups' receptive language skills (Lincoln 1982iii; Rochon 2005; Shewan 1984ii; Shewan 1984iii). Measures used included the Philadelphia Comprehension Battery (PCB), the Auditory Comprehension Test for Sentences (ACTS), the Token Test and the PICA gestural subtest.
Philadelphia Comprehension Battery (PCB)
Rochon 2005 measured participants' receptive language skills on the PCB, which includes subtests for sentence comprehension and picture comprehension. There was no evidence of a difference between the receptive language skills of the participants that received sentence‐mapping SLT and those that received unstructured social support and stimulation (Analysis 3.2).
3.2. Analysis.
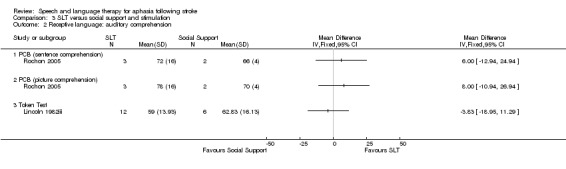
Comparison 3 SLT versus social support and stimulation, Outcome 2 Receptive language: auditory comprehension.
Auditory Comprehension Test for Sentences (ACTS)
Two additional trials measured receptive language skills by measuring auditory comprehension of sentences in participants that received either language‐oriented therapy or conventional SLT versus an intervention that provided unstructured social support (Shewan 1984ii; Shewan 1984iii). Both trials used the ACTS to make this comparison, but the manner in which they reported data prevented inclusion within the meta‐analysis.
Token Test
Lincoln 1982iii measured participants' receptive language skills using the Token Test. There was no evidence of a difference between the groups (Analysis 3.2).
Receptive language: other comprehension
Lincoln 1982iii assessed participants' auditory and written comprehension skills using the PICA gestural subtest; those that had access to social support and stimulation performed significantly better on these measures than those that had access to SLT (P = 0.04, MD −0.87, 95% CI −1.70 to −0.04) (Analysis 3.3).
3.3. Analysis.
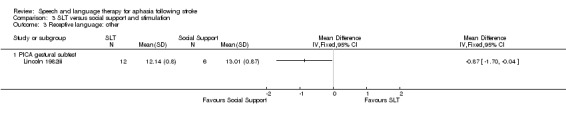
Comparison 3 SLT versus social support and stimulation, Outcome 3 Receptive language: other.
3. Expressive language
Five of the nine trials that compared participants that received SLT or a social support and stimulation intervention did so by comparing the groups' expressive language skills (Elman 1999; Lincoln 1982iii; Rochon 2005; Woolf 2015ii; Woolf 2015iii). Measures used included the Object Naming Test (ONT), Caplan and Hanna Sentence Production Test (CHSPT), the Picture Description with Structured Modeling (PDSM), the PICA and the Spoken Picture Naming Test.
Expressive language: single words
Lincoln 1982iii measured participants' naming skills on the ONT, while Woolf 2015ii and Woolf 2015iii used the Spoken Picture Naming test. On pooling the data, there was no evidence of a difference between the groups that received social support and stimulation and those that had received SLT, but there was significant heterogeneity (P = 0.0002; I2 = 84%) (Analysis 3.4).
3.4. Analysis.
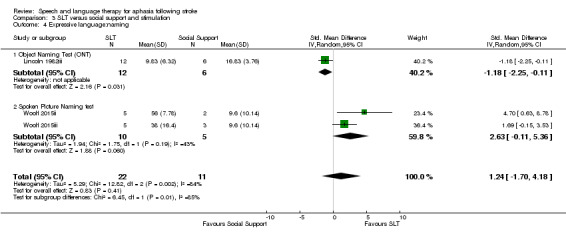
Comparison 3 SLT versus social support and stimulation, Outcome 4 Expressive language:naming.
Expressive language: sentences
Rochon 2005 compared the participants who receivedsentence‐mapping SLT and a group receiving unstructured social support and stimulation. Comparison of the two groups showed no evidence of a difference between the groups' performance on the CHSPT scores. Those that had received SLT did perform significantly better on treated items from the test (P = 0.01, MD 3.00, 95% CI 0.63 to 5.37) than the participants who received social support, but there was no evidence of a difference between the groups on the untreated items (Analysis 3.5).
3.5. Analysis.
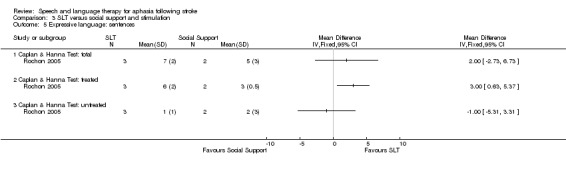
Comparison 3 SLT versus social support and stimulation, Outcome 5 Expressive language: sentences.
Expressive language: picture description
Two trials elicited samples of participants' connected speech using picture description tasks (Lincoln 1982iii; Rochon 2005). There was no evidence of a difference between the two groups. Rochon 2005 also reported the two groups' scores on the treated and untreated items, but there was no evidence of a between‐group difference on the treated or untreated items (Analysis 3.6).
3.6. Analysis.
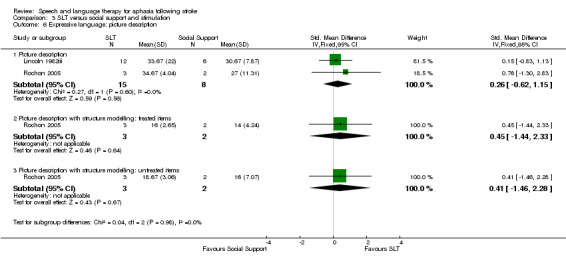
Comparison 3 SLT versus social support and stimulation, Outcome 6 Expressive language: picture description.
Expressive language: general
Lincoln 1982iii and Elman 1999 compared the groups' performances on the PICA verbal subtest. Suitable statistical data were unavailable from Elman 1999, so we could not include the results in the meta‐analysis. Participants who had received social support and stimulation scored significantly better than those who received SLT (P = 0.0007, MD −1.56, 95% CI −2.46 to −0.66) (Analysis 3.7).
3.7. Analysis.
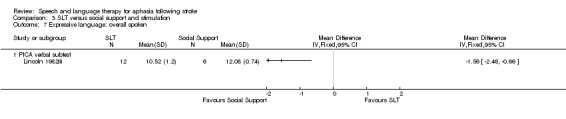
Comparison 3 SLT versus social support and stimulation, Outcome 7 Expressive language: overall spoken.
Expressive language: written
Similarly, Lincoln 1982iii compared the groups' performances on the PICA graphic subtests and found participants that received social support performed significantly better than those that had received SLT (P = 0.01, MD −1.39, 95% CI −2.49 to −0.29) (Analysis 3.8).
3.8. Analysis.
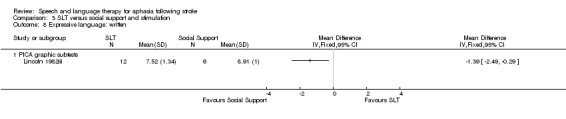
Comparison 3 SLT versus social support and stimulation, Outcome 8 Expressive language: written.
Expressive language: word fluency
Participants that received social support performed significantly better on measures of word fluency than those that had received SLT (Lincoln 1982iii; Analysis 3.9)
3.9. Analysis.
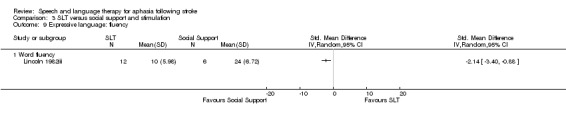
Comparison 3 SLT versus social support and stimulation, Outcome 9 Expressive language: fluency.
4. Severity of impairment
Elman 1999, Lincoln 1982iii, Shewan 1984ii and Shewan 1984iii compared groups that had access to SLT and those that received social support and stimulation by measuring participants' aphasia severity. The assessments used included the PICA and the Western Aphasia Battery‐Aphasia Quotient (WABAQ).
PICA
Two trials used the Shortened PICA to compare participants who had received group SLT and those who had attended other social activities or groups that provided social support and stimulation (Elman 1999; Lincoln 1982iii). Suitable statistical data were unavailable from Elman 1999, so we could not include them in the meta‐analysis. Lincoln 1982iii found that participants provided with social support and stimulation were less impaired as a result of aphasia (as measured on the PICA) than those who received SLT (P = 0.005, MD −1.13, 95% CI −1.91 to −0.35). Suitable summary data were not available from Elman 1999 to allow inclusion within the meta‐analysis (Analysis 3.10).
3.10. Analysis.
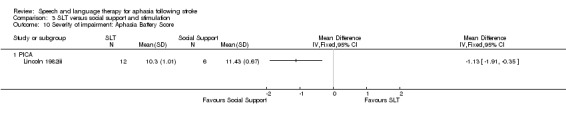
Comparison 3 SLT versus social support and stimulation, Outcome 10 Severity of impairment: Aphasia Battery Score.
WAB
Two additional trials assessed the severity of participants' aphasia using the WAB, comparing participants who received language‐oriented SLT or conventional SLT versus psychological support and unstructured communication provided by trained nurses (Shewan 1984ii; Shewan 1984iii). Suitable summary data were unavailable, so we could not include them in the meta‐analysis.
5. Psychosocial impact
ACTNoW 2011 and Elman 1999 evaluated psychosocial impact in participants who had received SLT versus social support and stimulation using the ABS and the Communication Outcomes After STroke (COAST) scale from both the patients' and caregivers' perspectives.
Affect Balance Scale
Elman 1999 compared participants that had received SLT and those that had received social support using the ABS, but appropriate summary values were unavailable, so we could not include them in the meta‐analysis.
COAST
Participants and caregivers completed separate versions of the COAST scale to indicate the impact of the participant's aphasia on their functional communication and quality of life (ACTNoW 2011). Measures were then used to compare the participants that had received SLT and those that had received social support. There was no evidence of a difference between the groups on this measure as reported by the participants or by the caregivers (Analysis 3.11).
3.11. Analysis.
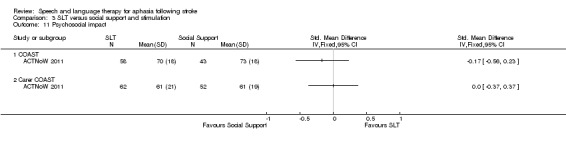
Comparison 3 SLT versus social support and stimulation, Outcome 11 Psychosocial impact.
6. Number of dropouts
Six of the nine trials in this section reported dropouts from the original randomised participants (ACTNoW 2011; David 1982; Elman 1999; Lincoln 1982iii; Shewan 1984ii; Shewan 1984iii). The main Lincoln 1982 trial (from which the randomised comparison Lincoln 1982iii has been extracted) excluded 13 participants for failing to complete the full treatment intervention. It is unclear which intervention arms these participants were randomised to, so we could not include these dropouts in meta‐analysis. The remaining trials lost a total of 40 participants from the groups allocated to SLT while 65 were lost to the social support and stimulation interventions. Fewer participants allocated to SLT were lost to the trial than those that were allocated to social support and stimulation (P = 0.005, OR 0.51 95% CI 0.32 to 0.81) (Analysis 3.12).
3.12. Analysis.
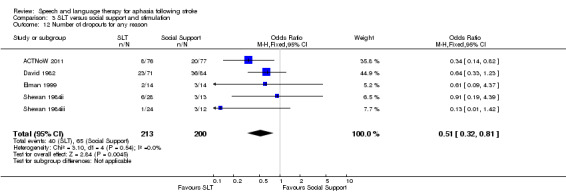
Comparison 3 SLT versus social support and stimulation, Outcome 12 Number of dropouts for any reason.
7. Adherence to allocated intervention
Five trials with dropouts also described the reasons for the dropouts to allow identification of those who had voluntarily withdrawn from the allocated intervention. A total of 11 participants in the SLT groups and 45 participants in the social support and stimulation intervention groups did not adhere to the allocated intervention (ACTNoW 2011; David 1982; Elman 1999; Shewan 1984ii; Shewan 1984iii) (P < 0.00001, OR 0.18, 95% CI 0.09 to 0.37; Analysis 3.13). In addition, David 1982 also described the withdrawal of four more participants from the social support group because of 'volunteer problems' (details can be found in Table 7).
3.13. Analysis.
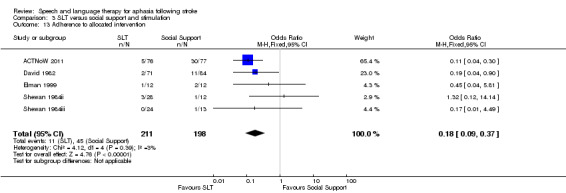
Comparison 3 SLT versus social support and stimulation, Outcome 13 Adherence to allocated intervention.
8. Economic outcomes
Only one of the nine trials measured economic outcomes (ACTNoW 2011). The cost favoured the provision of SLT (P < 0.00001, MD −3035.00, 95% CI −4342.44 to −1727.56), while the utility data favoured the social support intervention (P = 0.02, MD 0.06, 95% CI 0.01 to 0.11; Analysis 3.14).
3.14. Analysis.
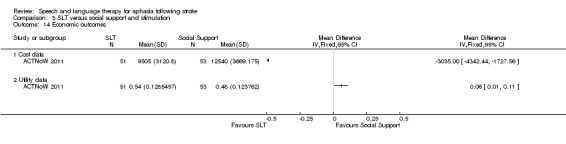
Comparison 3 SLT versus social support and stimulation, Outcome 14 Economic outcomes.
9. Follow‐up data
Three trials comparing SLT versus social support and stimulation also gathered follow‐up data: at six weeks in Woolf 2015ii and Woolf 2015iii) and at three and six months in David 1982. Of these trials, we present data relating to functional communication and expressive language below.
1. Functional communication
David 1982 used the FCP to compare a group who received conventional SLT with a group that received communication treatment by volunteers. There was no evidence of a difference between the groups at three and six months' follow‐up. Similarly, Woolf 2015ii and Woolf 2015iii measured functional communication using discourse measures and found no evidence of a difference between the groups six weeks after the intervention based on measures of substantive turns, content words, or nouns per turn during an unstructured conversation. On pooling FCP data at three months from David 1982 with data on content words per turn in Woolf 2015ii and Woolf 2015iii, there was no evidence of a difference between the groups. This did not change when we substituted other discourse data described above in the analysis (Woolf 2015ii; Woolf 2015iii; see Analysis 5.1).
5.1. Analysis.
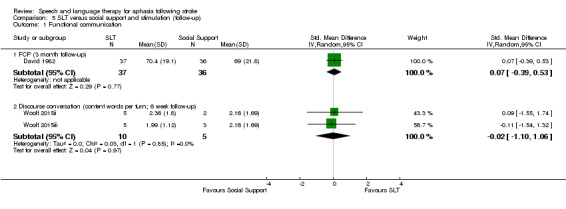
Comparison 5 SLT versus social support and stimulation (follow‐up), Outcome 1 Functional communication.
2. Expressive language
Six weeks after the intervention, two trials measured participants' naming abilities using the Spoken Picture Naming Test (Woolf 2015ii; Woolf 2015iii). Pooling this data, the individuals that received SLT were able to name more words than those that received social support (P = 0.03; SMD 2.25, 95% CI 0.18 to 4.32; Analysis 5.2).
5.2. Analysis.
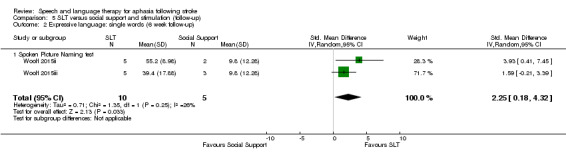
Comparison 5 SLT versus social support and stimulation (follow‐up), Outcome 2 Expressive language: single words (6 week follow‐up).
Comparisons: SLT A versus SLT B
A total of 1242 participants were included in 38 randomised comparisons of one SLT intervention (SLT A) with another SLT intervention (SLT B) (B.A.Bar 2011ii; Bakheit 2007; Crerar 1996; Crosson 2014; Denes 1996; Di Carlo 1980; Drummond 1981; FUATAC; Hinckley 2001; Leal 1993; Lincoln 1982i; Lincoln 1982ii; Lincoln 1984b; Meikle 1979; Meinzer 2007; MIT 2014i; MIT 2014ii; NARNIA 2013; ORLA 2006; ORLA 2010; Prins 1989; Pulvermuller 2001; RATS; RATS‐2; SEMaFORE; Sickert 2014; Shewan 1984i; Smith 1981iii; SP‐I‐RiT; Varley 2016ii; Van Steenbrugge 1981; VERSE I; VERSE II ; Yao 2005iii; Wertz 1981; Wertz 1986iii; Wilssens 2015; Woolf 2015i). As within other sections of this review, descriptions of the participants' age and other characteristics across trials varied (Table 6).
Participants' age ranges, spanning 17 to 92 years, were available for 15 trials, while 22 trials reported mean ages (B.A.Bar 2011ii ; Crosson 2014; Denes 1996; Drummond 1981; Hinckley 2001; Leal 1993; MIT 2014i; MIT 2014ii ; NARNIA 2013; RATS; RATS‐2; SEMaFORE; Smith 1981iii; Sickert 2014; SP‐I‐RiT; Varley 2016i; Varley 2016ii; VERSE I; VERSE II; Wertz 1986iii; Wilssens 2015; Woolf 2015i), and one reported the number of participants within age bands (Yao 2005iii) (Table 6).
All but four trials reported the length of time since their participants had experienced the onset of aphasia (FUATAC; SEMaFORE; Smith 1981iii; Yao 2005iii). Mean time since onset varied from less than a week after stroke (VERSE I; VERSE II), to within the first month (Bakheit 2007; Leal 1993; Shewan 1984i; Wertz 1981), two months (Sickert 2014; SP‐I‐RiT), three months (MIT 2014i; MIT 2014ii), or even up to one year or more after stroke (B.A.Bar 2011ii ; Crosson 2014; Drummond 1981; Hinckley 2001; Meinzer 2007; NARNIA 2013; ORLA 2006; ORLA 2010; Pulvermuller 2001; Prins 1989; Van Steenbrugge 1981; Varley 2016i; Varley 2016ii; Wilssens 2015; Woolf 2015i) (Table 6). Similarly, almost all trials reported the severity of aphasia, with only four failing to report how severe participants' aphasia was (Drummond 1981; FUATAC; SEMaFORE; Yao 2005iii). In most cases, trials reported the range of participants' aphasia severity using a suitable assessment tool, but in some cases this aspect was reported in more general terms (Table 6). Some trials focused specifically on participants with moderate (Wilssens 2015), severe (Denes 1996; Di Carlo 1980; Lincoln 1984b), or moderate to severe presentations of aphasia (B.A.Bar 2011ii; Lincoln 1982i; Leal 1993).
Trials in this section compared one SLT approach to an alternative approach to SLT intervention, where the interventions differed in relation to the therapy regimen (intensity, dose, duration), delivery model (one‐to‐one or group therapy, volunteer or computer facilitated therapy), or theoretical underpinnings of the therapy delivered.
High‐intensity versus low‐intensity SLT
As prespecified, we looked at the data from eight trials which compared a high‐intensity SLT intervention with a low‐intensity SLT intervention (Bakheit 2007; Denes 1996; FUATAC; ORLA 2006; Pulvermuller 2001; Smith 1981iii; SP‐I‐RiT; VERSE I). For participants in the high‐intensity groups, the number of hours weekly ranged from 4 hours (Smith 1981iii), 5 hours (Bakheit 2007; Denes 1996), 7.5 hours (VERSE I), 10 hours (ORLA 2006; Pulvermuller 2001; SP‐I‐RiT), or 15 hours (FUATAC). In contrast the low‐intensity SLT groups received 1.5 hours (Smith 1981iii; VERSE I), 2 hours (Bakheit 2007; SP‐I‐RiT), 3 hours (Denes 1996), 4 hours (FUATAC ; ORLA 2006), or 5 hours (Pulvermuller 2001) weekly. The participants' time since stroke ranged from recruitment at an average of three days after stroke (VERSE I), approximately a month (Bakheit 2007), two months (Denes 1996, SP‐I‐RiT), up to three months (FUATAC, unreported but estimated in Smith 1981iii), and two years (Pulvermuller 2001 low intensity group), three to four years (ORLA 2006), and eight years (Pulvermuller 2001 high‐intensity SLT group).
Statistical data for communication outcomes were only available for six trials (Bakheit 2007; Denes 1996; ORLA 2006; Pulvermuller 2001; SP‐I‐RiT; VERSE I), and we made comparisons by measuring participants' functional communication, receptive language, expressive language, severity of impairment, psychosocial impact, number of dropouts, and adherence to allocated intervention. The trials did not report on economic outcome measures.
1. Functional communication
VERSE I and SP‐I‐RiT compared high versus low intensity interventions (both within a couple of months after stroke onset), measuring participants' functional communication using the FCP. VERSE I also used Discourse Analysis (DA) scores (informativeness and efficiency (Nicholas 1995)). On pooling the FCP data, the groups that received high‐intensity SLT had better functional communication than those that received low intensity SLT (P = 0.003; MD 11.75 95% CI 4.09 to 19.40; Analysis 4.1). When the VERSE I DA data were pooled with the SP‐I‐RiT FCP data, there was a similar finding (P = 0.002, SMD 0.69 95% CI 0.25 to 1.13).
4.1. Analysis.
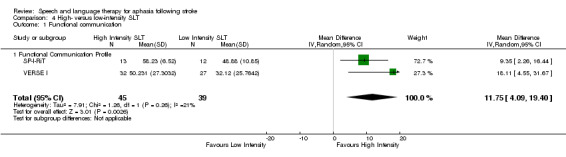
Comparison 4 High‐ versus low‐intensity SLT, Outcome 1 Functional communication.
2. Receptive language
Auditory comprehension
Measures of participants' receptive language skills were available for Denes 1996, SP‐I‐RiT and Pulvermuller 2001. These trials measured participants' auditory comprehension using the Token Test, the Aachen Aphasia Test (AAT) and Lisbon Aphasia Assessment Batter comprehension subtests. On pooling the final value scores reported by Pulvermuller 2001 and SP‐I‐RiT from the Token Test, we observed significant heterogeneity (P = 0.03; I2 = 79%) that could represent substantial heterogeneity (Higgins 2011). However, there was no indication of a significant difference between comprehension skills in participants that had received high‐intensity SLT versus those that had received low‐intensity SLT (Analysis 4.2). Denes 1996 only reported change‐from‐baseline scores, and thus they are not presented here.
4.2. Analysis.
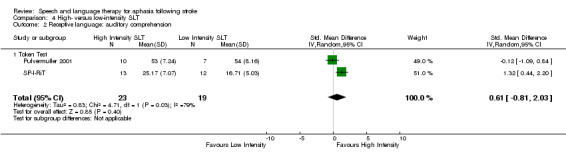
Comparison 4 High‐ versus low‐intensity SLT, Outcome 2 Receptive language: auditory comprehension.
Reading
SP‐I‐RiT measured participants' reading abilities using the Portuguese version of the AAT and found no evidence of a difference between participants that received high‐intensity SLT and those that received low‐intensity SLT (Analysis 4.3).
4.3. Analysis.
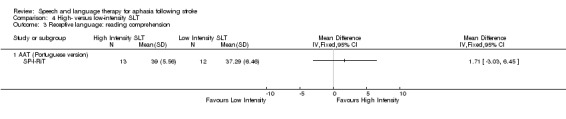
Comparison 4 High‐ versus low‐intensity SLT, Outcome 3 Receptive language: reading comprehension.
3. Expressive language
Three trials compared the expressive language skills of participants that received a high‐intensity SLT with those that received a low‐intensity SLT intervention on naming, repetition, and writing tests (Denes 1996; Pulvermuller 2001; SP‐I‐RiT). Denes 1996 measured expressive language skills using the AAT nNaming, repetition and written subtests, but only the groups' change‐from‐baseline scores were available, so we do not present them here.
Expressive language: naming
Pulvermuller 2001 and SP‐I‐RiT measured participants' naming skills using the AAT naming subtest and the Lisbon Aphasia Assessment Battery. There was no indication of a difference between the groups (Analysis 4.4).
4.4. Analysis.
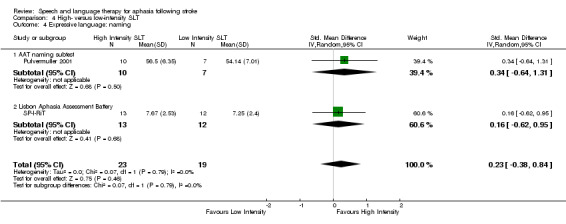
Comparison 4 High‐ versus low‐intensity SLT, Outcome 4 Expressive language: naming.
Expressive language: written
Trialists compared the writing skills of participants that had received high‐ and low‐intensity SLT using the AAT (Denes 1996; SP‐I‐RiT). Only change‐from‐baseline data were available from Denes 1996, so we do not present them here (Analysis 4.5).
4.5. Analysis.
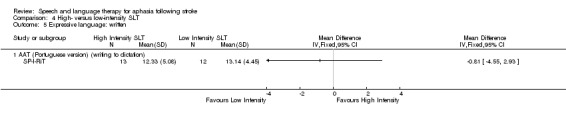
Comparison 4 High‐ versus low‐intensity SLT, Outcome 5 Expressive language: written.
Expressive language: repetition
On pooling data from the repetition subtests of the AAT and the Lisbon Aphasia Assessment Battery (Pulvermuller 2001; SP‐I‐RiT), there was no evidence of a difference between the groups (Analysis 4.6).
4.6. Analysis.
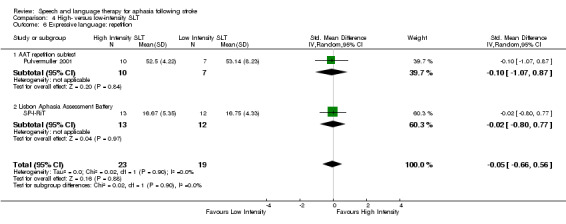
Comparison 4 High‐ versus low‐intensity SLT, Outcome 6 Expressive language: repetition.
Expressive language: repetition
SP‐I‐RiT also captured the participants' fluency and found no evidence of a difference between the groups (Analysis 4.7).
4.7. Analysis.
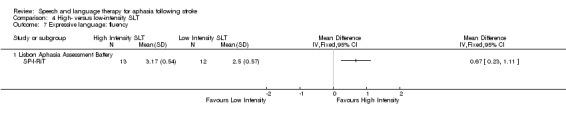
Comparison 4 High‐ versus low‐intensity SLT, Outcome 7 Expressive language: fluency.
4. Severity of impairment
Seven trials compared participants' overall level of aphasia severity following interventions that varied in intensity by using the WAB (Bakheit 2007; ORLA 2006; VERSE I), the AAT (Pulvermuller 2001), the BDAE (SP‐I‐RiT), the Lisbon Aphasia Assessment Battery (SP‐I‐RiT), and the MTDDA (Smith 1981iii). Suitable statistical data allowing inclusion in the meta‐analysis were unavailable from Smith 1981iii, and only change‐from‐baseline scores were available for the AAT, preventing inclusion in the meta‐analysis. On pooling the available final scores summary data (using the BDAE data from the SP‐I‐RiT trial), the groups that received high‐intensity SLT performed significantly better on measures of aphasia severity than those that received a low‐intensity SLT intervention (P = 0.02, SMD 0.38, 95% CI 0.07 to 0.69; Analysis 4.8). We did observe some non‐significant heterogeneity (P = 0.37; I2 = 7%). We obtained a similar result when pooling the data for the Lisbon Aphasia Assessment Battery (SP‐I‐RiT) (P = 0.02; SMD 0.40 95% CI 0.07 to 0.74).
4.8. Analysis.
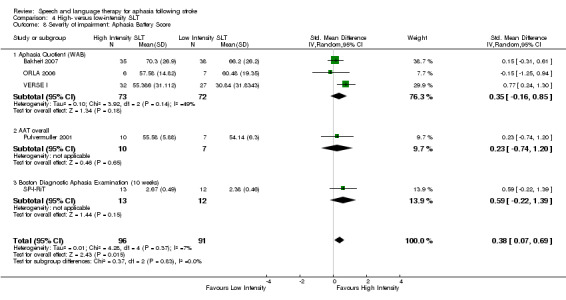
Comparison 4 High‐ versus low‐intensity SLT, Outcome 8 Severity of impairment: Aphasia Battery Score.
Following Cochrane editorial review comments, we conducted a post hoc subgroup analysis that considered the trials' recruitment time point since aphasia onset. Data from trials delivering interventions to participants up to three months poststroke (a clinically relevant timeframe) continued to demonstrate benefit from intensive intervention (N = 157; P = 0.03; SMD 0.47 95% CI 0.05 to 0.88) in the presence of some non‐significant heterogeneity (P = 0.21; I2 = 36%; Bakheit 2007; SP‐I‐RiT; VERSE I). Conversely, when we conducted the post hoc analyses on data from the subgroup of trials recruiting participants several years after stroke (ORLA 2006; Pulvermuller 2001), there was no longer evidence of a difference between the small numbers of participants that received high‐intensity SLT (N = 16) versus low‐intensity SLT (N = 14). We will revisit this issue within the Discussion.
5. Mood
Smith 1981iii used the GHQ while SP‐I‐RiT used the Stroke Aphasia Depression Questionnaire to compare groups receiving high‐intensity and low‐intensity SLT. Appropriate summary data from Smith 1981iii were unavailable. Presenting data from SP‐I‐RiT, there was no evidence of a difference between the participants' experience of depression (Analysis 4.9).
4.9. Analysis.
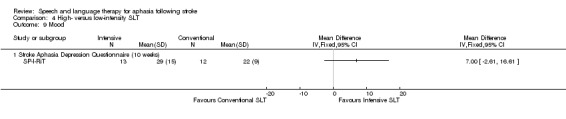
Comparison 4 High‐ versus low‐intensity SLT, Outcome 9 Mood.
6. Number of dropouts
Data on participants that dropped out of trials included in this comparison were available for Bakheit 2007, Denes 1996, ORLA 2006, Pulvermuller 2001, SP‐I‐RiT and VERSE I and were partially available for Smith 1981iii. Smith 1981iii excluded five additional participants from the final analysis (three were found not to have aphasia and two died), but their group allocation was unclear. These five individuals were not included in this meta‐analysis. It was unclear whether any were lost in FUATAC. No participants appear to have been lost from the treatment or follow‐up time points in the Denes 1996, ORLA 2006, or Pulvermuller 2001 studies. Both ORLA 2006 and Pulvermuller 2001 recruited between an average of two and eight years after stroke.
Across the trials, significantly more participants (N = 35) were lost to the high‐intensity SLT intervention groups compared with those lost to low‐intensity SLT interventions (N = 17) (P = 0.01, OR 2.35, 95% CI 1.20 to 4.60) (Analysis 4.10).
4.10. Analysis.
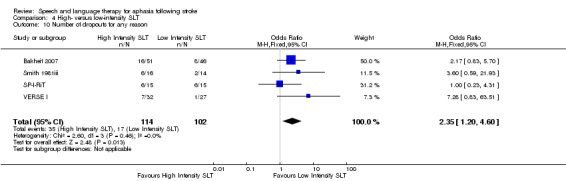
Comparison 4 High‐ versus low‐intensity SLT, Outcome 10 Number of dropouts for any reason.
7. Adherence to allocated intervention
Bakheit 2007 (in part), SP‐I‐RiT, and VERSE I reported the reasons for loss of participants from within the study. Of these, seven voluntarily withdrew from the high‐intensity SLT group during the treatment phase, while one withdrew from the low‐intensity group. There was no significant difference between the groups on this measure.
8. Follow‐up data (high‐intensity versus low‐intensity SLT)
Three trials comparing participants who received high‐intensity SLT versus low intensity SLT included a follow‐up data collection point after the intervention period in relation to: functional communication, receptive language, expressive language, severity of impairment, and number of dropouts (Bakheit 2007; SP‐I‐RiT; VERSE I).
Functional communication
We collected follow‐up data on functional communication as measured by the FCP in SP‐I‐RiT and VERSE I by discourse analysis in VERSE I at 40 weeks (SP‐I‐RiT), six months (VERSE I), and 12 months postintervention (SP‐I‐RiT) (Analysis 6.1). On pooling the FCP data, participants who had received high‐intensity SLT continued to perform significantly better on measures of functional communication than those who had received low‐intensity SLT (P = 0.02; SMD 0.53; 95% CI 0.07 to 0.99). Other measures did not demonstrate a significant difference between the groups.
6.1. Analysis.
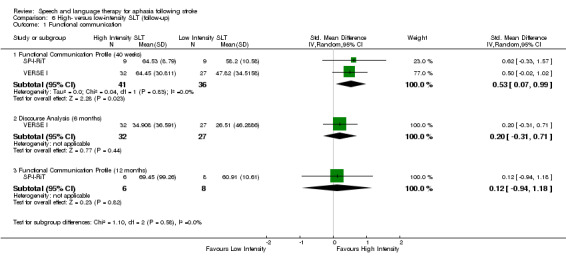
Comparison 6 High‐ versus low‐intensity SLT (follow‐up), Outcome 1 Functional communication.
Receptive language
The SP‐I‐RiT trial captured auditory comprehension (LAAB and the Token Test) and reading comprehension (AAT subtest) at 40 weeks and 12 months postintervention. There was evidence of significantly better performance on measures of auditory comprehension by participants that had received the high‐intensity SLT compared with those that had received the low‐intensity SLT. These and other data are presented in Analysis 6.2.
6.2. Analysis.
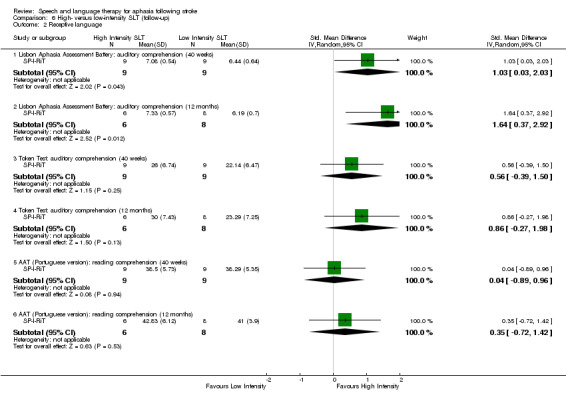
Comparison 6 High‐ versus low‐intensity SLT (follow‐up), Outcome 2 Receptive language.
Expressive language
Similarly, data on participants' expressive language skills were collected in the SP‐I‐RiT trial relating to their naming, writing to dictation, repetition, and fluency at 40 weeks and 12 months. There was evidence of a difference between participants' performance (Analysis 6.3).
6.3. Analysis.
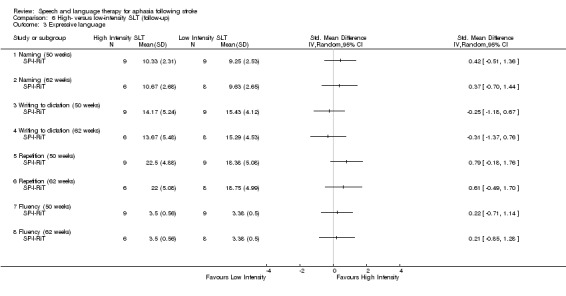
Comparison 6 High‐ versus low‐intensity SLT (follow‐up), Outcome 3 Expressive language.
Severity of impairment
Three trials followed up participants at three months (Bakheit 2007), six months (VERSE I), and 40 weeks and 12 months (SP‐I‐RiT) to compare participants who had received high‐intensity SLT versus low‐intensity SLT on measures of aphasia severity including the WABAQ (Bakheit 2007; VERSE I), the BDAE (SP‐I‐RiT), and the LAAB–AQ (SP‐I‐RiT). On pooling the data (using the BDAE SP‐I‐RiT data only), there was no evidence of a difference between the groups (P = 0.07; SMD 0.37 95% CI −0.03 to 0.77) (Analysis 6.4).
6.4. Analysis.
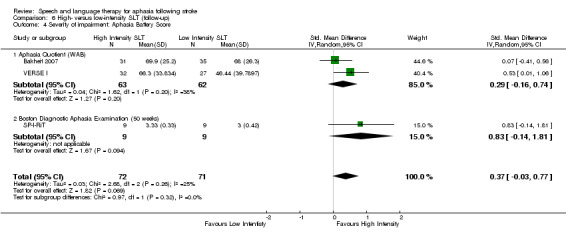
Comparison 6 High‐ versus low‐intensity SLT (follow‐up), Outcome 4 Severity of impairment: Aphasia Battery Score.
Mood
SP‐I‐RiT used the Stroke Aphasia Depression Questionnaire to compare those that received high‐ and low‐intensity SLT. There was no evidence of a difference between the groups at 40 weeks or 12 months follow‐up (Analysis 6.5).
6.5. Analysis.
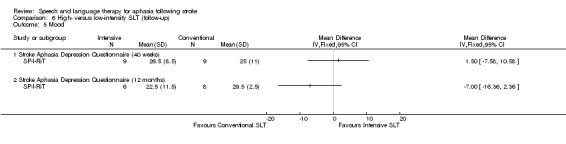
Comparison 6 High‐ versus low‐intensity SLT (follow‐up), Outcome 5 Mood.
Number of dropouts
Three trials reported the number of participants lost to follow‐up (Bakheit 2007; Smith 1981iii; SP‐I‐RiT; VERSE I) from the high‐intensity groups (N = 15) and the low‐intensity groups (N = 10). There was no evidence of a difference between the groups (Analysis 6.6)
6.6. Analysis.
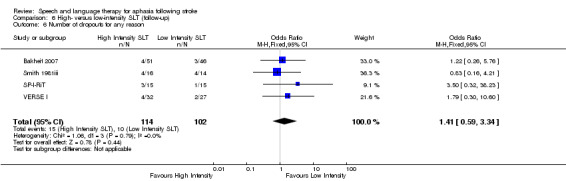
Comparison 6 High‐ versus low‐intensity SLT (follow‐up), Outcome 6 Number of dropouts for any reason.
High versus low dose SLT
As planned, we considered six trials that compared a high dose with a low dose SLT intervention as measured in hours of therapy provision. The number of therapy hours in the high dose SLT intervention varied from a total of 27 hours (VERSE I), 60 hours (Bakheit 2007; ORLA 2006), 90 hours (FUATAC), 97 to 129 hours (Denes 1996), and up to 208 hours (ORLA 2006). Participants receiving a low dose SLT intervention received 5 hours (VERSE I), 23 hours (FUATAC; Smith 1981iii), 24 hours (Bakheit 2007; ORLA 2006), 69 hours (Smith 1981iii), or 78 hours (Denes 1996). These high and low dose SLT groups were compared on measures of functional communication, receptive language, expressive language, severity of impairment, number of dropouts, and adherence to allocated intervention.
1. Functional communication
VERSE I measured participants' functional communication using the FCP and Discourse Analysis (DA) scores (informativeness and efficiency; Nicholas 1995). The participants that had received a high dose of SLT (up to 27 hours) had significantly better functional communication scores on both measures than those that received low dose (five hours) SLT (Analysis 7.1).
7.1. Analysis.
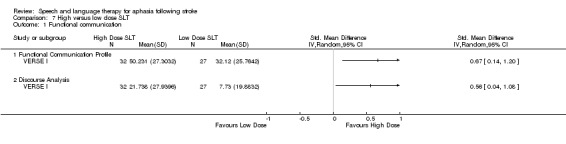
Comparison 7 High versus low dose SLT, Outcome 1 Functional communication.
2. Receptive language
Denes 1996 measured and compared participants' receptive language on the AAT Comprehension subtest and the Token Test. Only change‐from‐baseline data were available, which we present here (Analysis 7.2). There was no evidence of a difference between the high and low dose SLT groups.
7.2. Analysis.
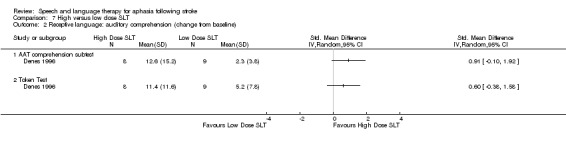
Comparison 7 High versus low dose SLT, Outcome 2 Receptive language: auditory comprehension (change from baseline).
3. Expressive language
Similarly, Denes 1996 measured participants' expressive language on the AAT naming and repetition subtests. Only change‐from‐baseline data were available (Analysis 7.3). There was no evidence of a difference between the high and low dose SLT groups. However, on measures of written language, the participants that received high dose of SLT performed significantly better than those that received a low dose of SLT (Analysis 7.4).
7.3. Analysis.
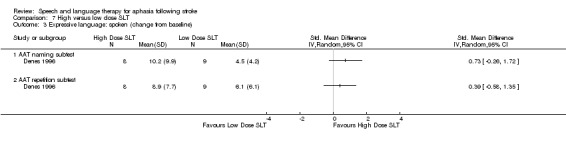
Comparison 7 High versus low dose SLT, Outcome 3 Expressive language: spoken (change from baseline).
7.4. Analysis.
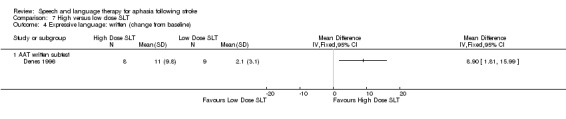
Comparison 7 High versus low dose SLT, Outcome 4 Expressive language: written (change from baseline).
4. Severity of impairment
Five trials compared participants' overall level of aphasia severity following a high and low dose of SLT using the WAB (Bakheit 2007; ORLA 2006; VERSE I), the AAT (Denes 1996), and the MTDDA (Smith 1981iii). Suitable statistical data allowing inclusion in the meta‐analysis were unavailable from Smith 1981iii, and Denes 1996 only reported change‐from‐baseline data, which are not included in this meta‐analysis of final value scores. On pooling the data, there was no evidence of a difference in the participants that received a high or low dose of SLT on measures of aphasia severity (Analysis 7.5), although we did observe some non‐significant heterogeneity (P = 0.14; I2 = 49%).
7.5. Analysis.
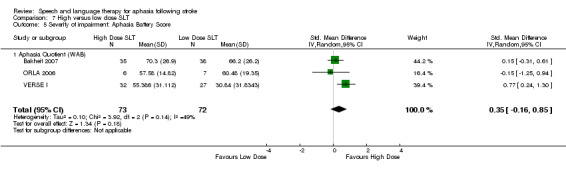
Comparison 7 High versus low dose SLT, Outcome 5 Severity of impairment: Aphasia Battery Score.
5. Number of dropouts
The numbers of participants that dropped out of trials in this comparison were available for Bakheit 2007, Denes 1996, ORLA 2006 and VERSE I and were partially available for Smith 1981iii. No participants appear to have been lost from the treatment or follow‐up time points in Denes 1996 or ORLA 2006. It was unclear whether any were lost from FUATAC. Smith 1981iii excluded five additional participants (not included in this meta‐analysis) from the final analysis (three were found not to have aphasia and two died), but their group allocation was unclear. On pooling the data, significantly more participants (N = 99) were lost to the high dose SLT intervention groups versus the low dose SLT interventions (N = 87) (P = 0.03; OR 2.01 95% CI 1.07 to 3.79). There was no indication of heterogeneity. Of these participants, some were lost at follow‐up (eight from high dose and five from the low dose SLT groups) (Bakheit 2007; VERSE I; Analysis 7.6).
7.6. Analysis.
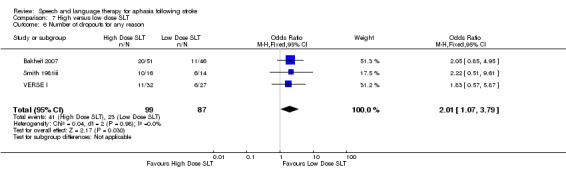
Comparison 7 High versus low dose SLT, Outcome 6 Number of dropouts for any reason.
6. Adherence to allocated intervention
Two of the five trials reporting dropouts described the reasons for loss of participants from within the study. Six participants voluntarily withdrew from the high dose SLT groups during the treatment phase, while one withdrew from the low dose group. There was no evidence of a significant difference between the groups (Analysis 7.7).
7.7. Analysis.
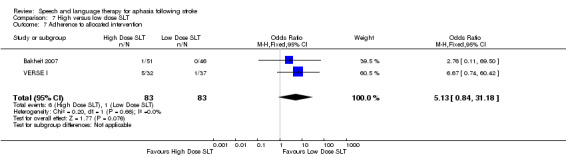
Comparison 7 High versus low dose SLT, Outcome 7 Adherence to allocated intervention.
7. Follow‐up data (high dose versus low dose SLT)
Both Bakheit 2007 and VERSE I compared participants who received a high dose of SLT with those who received a low dose of SLT at follow‐up data collection points in relation to functional communication, severity of impairment, and number of dropouts.
Functional communication
VERSE I compared participants' functional language skills using the FCP and Discourse Analysis methods but found no evidence of a significant difference between the groups at follow‐up (Analysis 8.1).
8.1. Analysis.
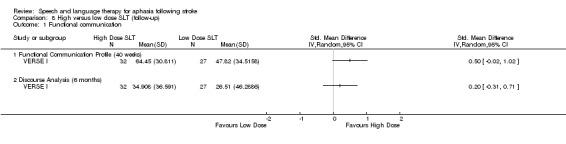
Comparison 8 High versus low dose SLT (follow‐up), Outcome 1 Functional communication.
Severity of impairment
Similarly, using the WAB as a measure of aphasia severity, there was no evidence of a difference between the groups at follow‐up when pooling data from Bakheit 2007 and VERSE I (Analysis 8.2).
8.2. Analysis.
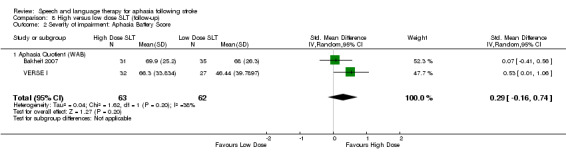
Comparison 8 High versus low dose SLT (follow‐up), Outcome 2 Severity of impairment: Aphasia Battery Score.
Number of dropouts
On pooling the follow‐up data across the three trials that reported dropouts (Bakheit 2007; Smith 1981iii; VERSE I), there was no evidence of a difference between the groups that received a high dose of SLT and those that received a low dose (Analysis 8.3).
8.3. Analysis.
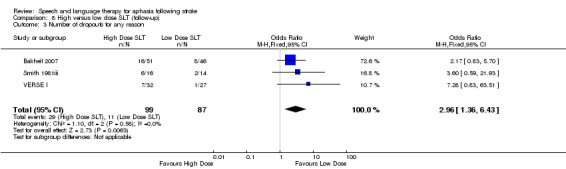
Comparison 8 High versus low dose SLT (follow‐up), Outcome 3 Number of dropouts for any reason.
Early versus delayed SLT
Four trials delivered an early SLT intervention and delayed the SLT intervention for the other group (B.A.Bar 2011ii; MIT 2014ii, Lyon 1997; Varley 2016ii). While Lyon 1997 incorporated a delayed intervention, we could not include the data in this comparison; the data collection point was prior to the delayed intervention, and thus the trial data contributes to the SLT versus no SLT comparison. The remaining trials compared groups on measures of functional communication, receptive language, expressive language, severity of impairment, number of dropouts, and adherence to allocated intervention.
1. Functional communication
Both B.A.Bar 2011ii and MIT 2014i measured participants' functional communication using the ANELT. The data for MIT 2014i, however, were unavailable at the time of updating this review and could not be included here. Data from B.A.Bar 2011ii demonstrate no evidence of a difference between the group that received early SLT versus SLT later after aphasia onset. Findings were similar on follow‐up of the participants four weeks later (Analysis 9.1).
9.1. Analysis.
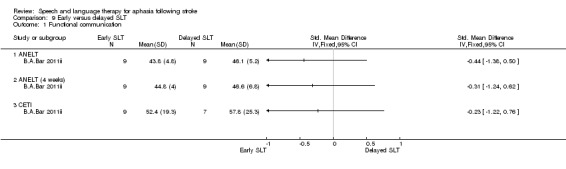
Comparison 9 Early versus delayed SLT, Outcome 1 Functional communication.
2. Receptive language
B.A.Bar 2011ii compared participants' auditory comprehension skills using the Token Test but found no evidence of a difference between the groups that received early SLT versus delayed SLT (Analysis 9.2).
9.2. Analysis.
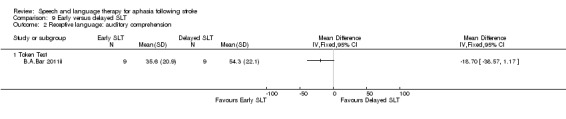
Comparison 9 Early versus delayed SLT, Outcome 2 Receptive language: auditory comprehension.
3. Expressive language
Similarly, participants' expressive language skills were captured using measures of naming (B.A.Bar 2011ii; Varley 2016ii), writing (B.A.Bar 2011ii), repetition (B.A.Bar 2011ii; Varley 2016ii) and word fluency (food and animal words) (B.A.Bar 2011ii). Investigators measured outcomes immediately after the intervention and one month later in B.A.Bar 2011ii or two months later in Varley 2016ii. There was no evidence of a difference between the groups on any of these measures or at these time points. We only present the naming (matched) and repetition (matched) data in these meta‐analyses (Analysis 9.3 to Analysis 9.6). Pooling using the treated or control items from Varley 2016ii data did not alter this finding. We do not present these data here.
9.3. Analysis.
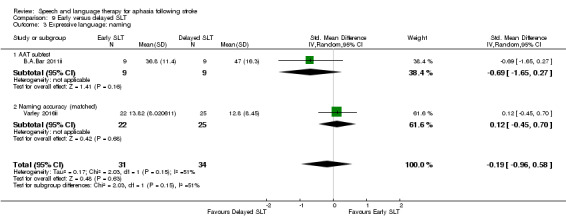
Comparison 9 Early versus delayed SLT, Outcome 3 Expressive language: naming.
9.6. Analysis.
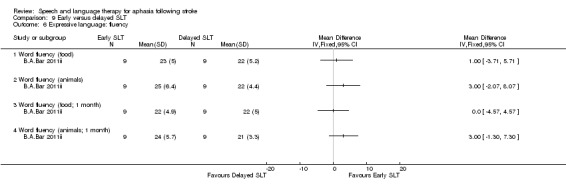
Comparison 9 Early versus delayed SLT, Outcome 6 Expressive language: fluency.
4. Severity of impairment
The participants' performance on the AAT overall demonstrated no evidence of a difference between the severity of their aphasia (Analysis 9.7).
9.7. Analysis.
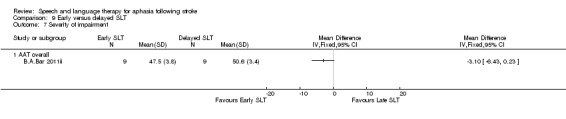
Comparison 9 Early versus delayed SLT, Outcome 7 Severity of impairment.
5. Number of dropouts
MIT 2014i and Varley 2016ii reported dropouts, with six participants leaving the early SLT group and two leaving the delayed SLT group. There was no evidence of a difference between the groups (Analysis 9.8). B.A.Bar 2011ii did not report any dropouts.
9.8. Analysis.
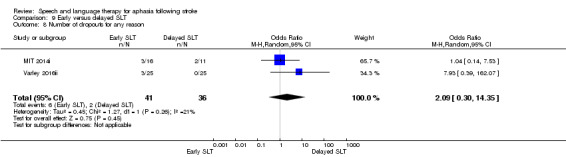
Comparison 9 Early versus delayed SLT, Outcome 8 Number of dropouts for any reason.
6. Follow‐up data (8 weeks)
Varley 2016ii followed up participants eight weeks after the delayed treatment and measured expressive language (naming and repetition) across treated, matched and control items. There was no evidence of a difference between the groups (Analysis 10.1; Analysis 10.2). Similarly there was no evidence of a difference in the number of participants dropping out form the early SLT intervention versus the delayed SLT group (Analysis 10.3).
10.1. Analysis.
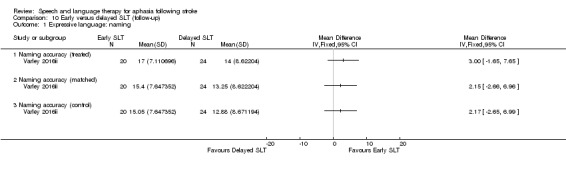
Comparison 10 Early versus delayed SLT (follow‐up), Outcome 1 Expressive language: naming.
10.2. Analysis.

Comparison 10 Early versus delayed SLT (follow‐up), Outcome 2 Expressive language: repetition.
10.3. Analysis.
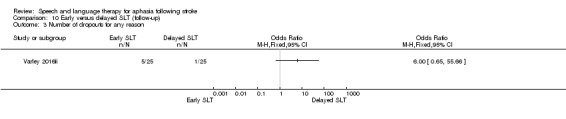
Comparison 10 Early versus delayed SLT (follow‐up), Outcome 3 Number of dropouts for any reason.
SLT: short versus long duration
Five trials compared therapy of a long and short duration as measured by the weeks or months over which the SLT intervention was delivered. Examples of short SLT interventions lasted 2 weeks (Pulvermuller 2001), 10 weeks (SP‐I‐RiT), or they had a mean duration of 11.4 weeks (ORLA 2010), 20.8 weeks (Meikle 1979), or they lasted between 6 and 9 months (Di Carlo 1980). These were compared with therapy delivered over a longer period of time, ranging from 3 to 5 weeks (Pulvermuller 2001), a mean of 13.31 weeks (ORLA 2010), 37.13 weeks (Meikle 1979), 50 weeks (SP‐I‐RiT), or between 5 and 22 months (Di Carlo 1980). Groups were compared on measures of functional communication, receptive language, expressive language, mood, severity of impairment, and number of dropouts and adherence to allocated intervention (Analysis 11.1 to Analysis 11.16).
11.1. Analysis.
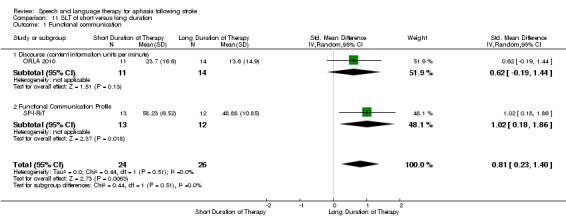
Comparison 11 SLT of short versus long duration, Outcome 1 Functional communication.
11.16. Analysis.
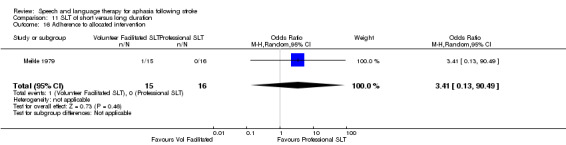
Comparison 11 SLT of short versus long duration, Outcome 16 Adherence to allocated intervention.
1. Functional communication
Two trials compared participants' functional communication using measures of discourse or the Functional Communication Profile (ORLA 2010; SP‐I‐RiT). Pooling the data demonstrated that those individuals that had received SLT over a longer period of time performed significantly better on measures of functional communication than those who had received therapy over a short period of time (P = 0.002, SMD 0.81, CI 95% 0.23 to 1.40; (Analysis 11.1). This finding was no longer evident at 50 weeks and one year follow‐up during the SP‐I‐RiT trial (Analysis 11.2).
11.2. Analysis.
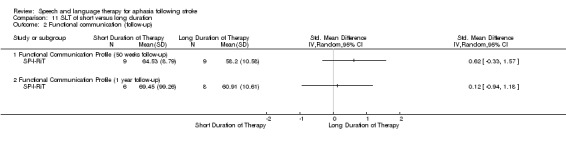
Comparison 11 SLT of short versus long duration, Outcome 2 Functional communication (follow‐up).
2. Receptive language
Two trials measured participants' auditory comprehension (Pulvermuller 2001; SP‐I‐RiT), and three assessed written language comprehension (Di Carlo 1980; ORLA 2010; SP‐I‐RiT). Trials evaluating auditory comprehension used the AAT comprehension subtest (Pulvermuller 2001), the Token Test (Pulvermuller 2001), and the Lisbon Aphasia Assessment Battery (SP‐I‐RiT). On pooling the AAT data with the LAAB data, there was a significant difference between the groups: participants who received therapy over a long period of time scored significantly higher on auditory comprehension tests than those who received SLT over a short period of time (P = 0.01, SMD 0.81, CI 95% 0.17 to 1.45 and low heterogeneity: I2 = 0%). However, on pooling the Token Test data with the LAAB data, we observed significant heterogeneity (I2 = 69%) and no evidence of a difference between the groups' auditory comprehension (SMD 0.49 CI 95% −0.67 to 1.65). We present the AAT data in Analysis 11.3. There was no evidence of this extending to follow‐up data collected at 50 or 62 weeks (Analysis 11.4; Analysis 11.5).
11.3. Analysis.
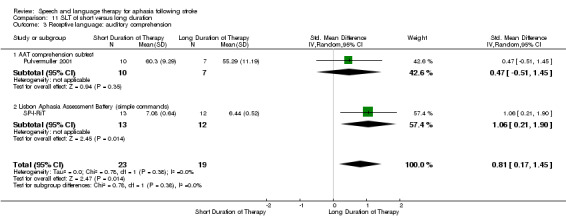
Comparison 11 SLT of short versus long duration, Outcome 3 Receptive language: auditory comprehension.
11.4. Analysis.
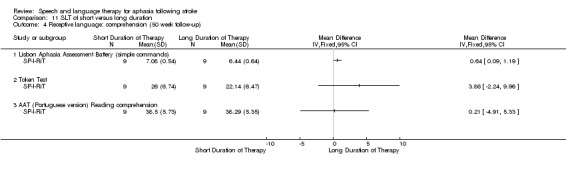
Comparison 11 SLT of short versus long duration, Outcome 4 Receptive language: comprehension (50 week follow‐up).
11.5. Analysis.

Comparison 11 SLT of short versus long duration, Outcome 5 Receptive language: comprehension (62 week follow‐up).
After pooling data from across three trials, participants' ability to read did not differ between groups (ORLA 2010, SP‐I‐RiT, Di Carlo 1980; Analysis 11.6).
11.6. Analysis.

Comparison 11 SLT of short versus long duration, Outcome 6 Receptive language: reading comprehension.
3. Expressive language
Three trials found no evidence of a difference between the groups' naming abilities when using the AAT naming subtest (Pulvermuller 2001), the Lisbon Aphasia Assessment Battery (SP‐I‐RiT), or the Thorndike Lorge Word List by Thorndike 1944 (Di Carlo 1980) (Analysis 11.7). Similarly, there was no evidence of a difference between groups in writing abilities (Analysis 11.8) or repetition (Analysis 11.9). One small trial found that the group that received an SLT intervention for a longer period performed significantly better on measures of word fluency (SP‐I‐RiT; Analysis 11.10). Based on data from the same trial, there was no evidence of a difference between the groups at 50 or 62 weeks' follow‐up (Analysis 11.11).
11.7. Analysis.
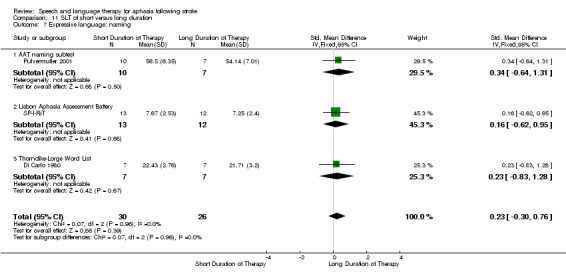
Comparison 11 SLT of short versus long duration, Outcome 7 Expressive language: naming.
11.8. Analysis.
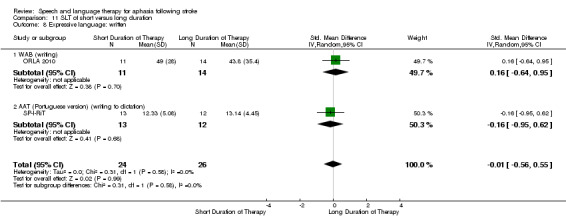
Comparison 11 SLT of short versus long duration, Outcome 8 Expressive language: written.
11.9. Analysis.
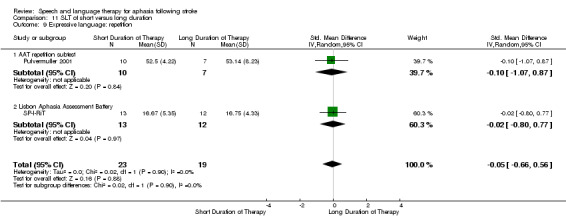
Comparison 11 SLT of short versus long duration, Outcome 9 Expressive language: repetition.
11.10. Analysis.
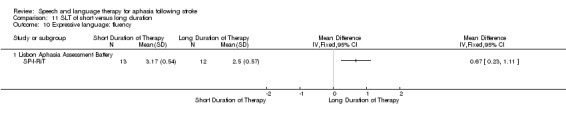
Comparison 11 SLT of short versus long duration, Outcome 10 Expressive language: fluency.
11.11. Analysis.
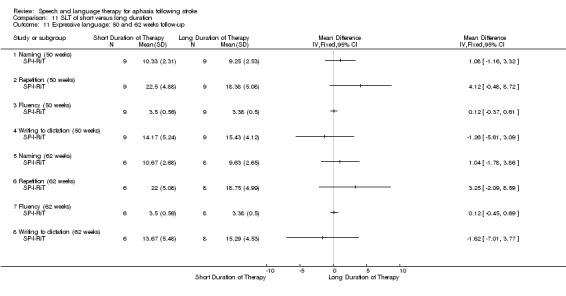
Comparison 11 SLT of short versus long duration, Outcome 11 Expressive language: 50 and 62 weeks follow‐up.
4. Mood
SP‐I‐RiT also compared participants using the Stroke Aphasia Depression Questoinnaire following SLT of a long or short duration immediately after treatment and at 50 and 62 weeks' follow‐up. There was no evidence of a difference between the groups (Analysis 11.12).
11.12. Analysis.
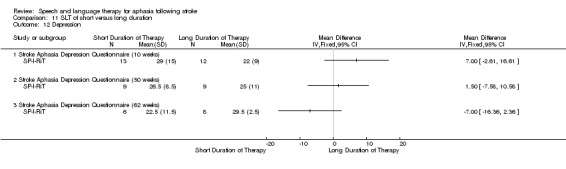
Comparison 11 SLT of short versus long duration, Outcome 12 Depression.
5. Severity of impairment
Four trials measured aphasia severity and compared participants who had received SLT over a long and short period of time. After pooling data from the WABAQ (ORLA 2010), the PICA (Meikle 1979), the AAT (Pulvermuller 2001), and the BDAE (SP‐I‐RiT), there was no evidence of a difference between the groups (Analysis 11.13). SP‐I‐RiT also gathered data on severity using the LIsbon Aphasia Assessment Battery Aphasia Quotient, but pooling this data instead of the BDAE did not alter the finding. At follow‐up, there was little indication of a difference between the groups ‐ no differences were observed on measures using the LAAB, while at one year the group that received a long period of SLT performed significantly better on the BDAE than those who had received SLT over a short period of time (Analysis 11.14).
11.13. Analysis.
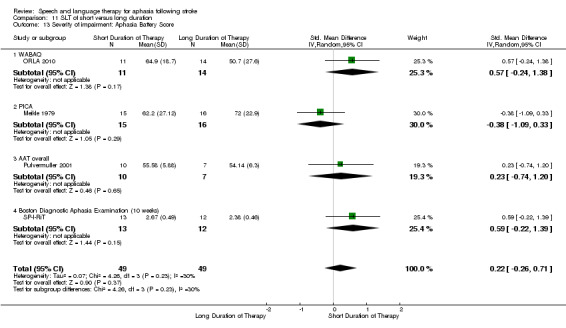
Comparison 11 SLT of short versus long duration, Outcome 13 Severity of impairment: Aphasia Battery Score.
11.14. Analysis.
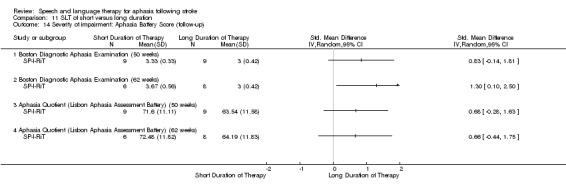
Comparison 11 SLT of short versus long duration, Outcome 14 Severity of impairment: Aphasia Battery Score (follow‐up).
6. Number of dropouts and adherence to allocated intervention
Only Meikle 1979 reported any dropouts in this comparison, and there was no evidence of a difference between the groups (Analysis 11.15) or in relation to adherence to the allocated intervention (Analysis 11.16).
11.15. Analysis.
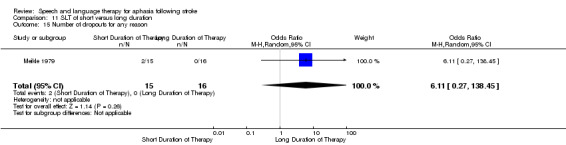
Comparison 11 SLT of short versus long duration, Outcome 15 Number of dropouts for any reason.
Group versus one‐to‐one SLT
Six trials compared a group‐based SLT intervention with conventional one‐to‐one SLT (FUATAC; Pulvermuller 2001; VERSE II; Wertz 1981; Wilssens 2015; Yao 2005iii). Within the group SLT interventions, participants received SLT in groups of 2 to 3 (FUATAC), 3 (Pulvermuller 2001), 2 to 4 (VERSE II), 5 (Wilssens 2015), between 3 to 7 (Wertz 1981), and 10 (Yao 2005iii). Several group SLT interventions used a constraint‐induced aphasia therapy approach (FUATAC; Pulvermuller 2001; VERSE II; Wilssens 2015) (only verbal responses were allowed). In contrast, other group interventions encouraged group discussion and recreational activities with a therapist (Wertz 1981), or they focused on 'collective language strengthening training' (Yao 2005iii).
Participants receiving the one‐to‐one SLT intervention received a semantic therapy in Visch‐Brink 2001 and Wilssens 2015 or conventional SLT in FUATAC, Pulvermuller 2001, VERSE II, Wertz 1981 and Yao 2005iii. Investigators made between‐intervention comparisons on a variety of measures: functional communication, receptive language, expressive language, quality of life, severity of impairment, number of dropouts, and adherence to allocated intervention. Studies did not measure psychosocial impact or economic measures.
1. Functional communication
Two trials measured change in functional communication using the CAL (Pulvermuller 2001), the Conversational Rating Scale (CRS) (Wertz 1981), and the Informants Rating of Functional Language (adapted form of the FCP) (Wertz 1981). However, suitable statistical data were unavailable from these measures, and so we could not include them within the review. A later study took a subset of data from the Wertz 1981 trial and evaluated functional communication using the Pragmatic Protocol. In addition, we pooled data from Wilssens 2015 based on the ANELT with data from VERSE II on the percentage of content information units per minute in a sample of discourse. There was no evidence of a difference between the groups' performance on measures of functional communication (Analysis 12.1).
12.1. Analysis.
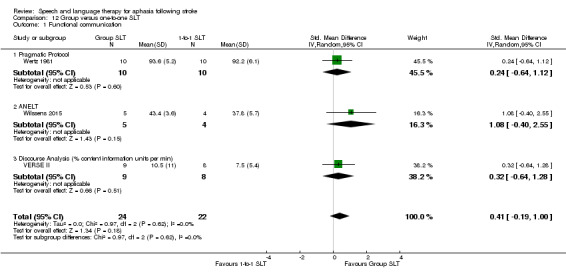
Comparison 12 Group versus one‐to‐one SLT, Outcome 1 Functional communication.
2. Receptive language
Receptive language: auditory comprehension
Three trials measured participants' receptive language skills using the Token Test (Pulvermuller 2001; Wertz 1981; Wilssens 2015), and two used the language comprehension subtest of the AAT (Pulvermuller 2001; Wilssens 2015). Wertz 1981 reported mean values, but the SD values were unavailable. To facilitate inclusion of these data within the review, we imputed the SD value (13.93) from the Lincoln 1982 Token Test summary data. The reason for choosing this value was that both Wertz 1981 and Lincoln 1982 used the same form of the Token Test and used it to measure the language skills of similar participant groups. On pooling these data, there was no evidence of a difference between the groups' auditory comprehension skills as measured by either comprehension subtest (Pulvermuller 2001; see Analysis 12.2).
12.2. Analysis.
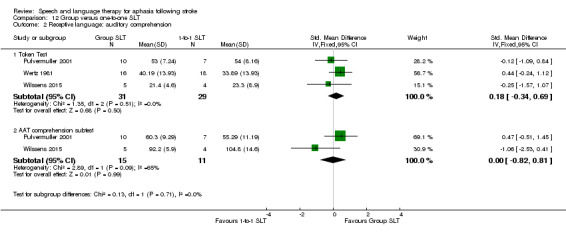
Comparison 12 Group versus one‐to‐one SLT, Outcome 2 Receptive language: auditory comprehension.
Receptive language: other
Wertz 1981 used the PICA Gestural subtest to compare participants that had received group SLT and those that had received one‐to‐one SLT. Though the mean values were available to the review, the SD values were unavailable. We identified and imputed an SD value of 25.67 from Wertz 1986, where the highest of three possible values in this trial from relevant clinical groups was chosen to facilitate inclusion of the study within the review. There was no evidence of a difference between the groups (Analysis 12.3).
12.3. Analysis.
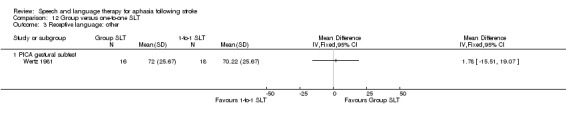
Comparison 12 Group versus one‐to‐one SLT, Outcome 3 Receptive language: other.
3. Expressive language
Expressive language: spoken
Participants' expressive language skills were compared using the naming subtest of the AAT (Pulvermuller 2001; Wilssens 2015), the Boston Naming Test (Wilssens 2015), measures of word fluency, repetition, and the PICA verbal subtest. On pooling the AAT naming data, there was no evidence of a difference between the groups' expressive language skills (Analysis 12.4). This did not change when using the BNT data from Wilssens 2015) in the meta‐analysis in place of the AAT subtest data from the same trial (P = 0.58; SMD 0.22 95% CI −0.56 to 1.00).
12.4. Analysis.
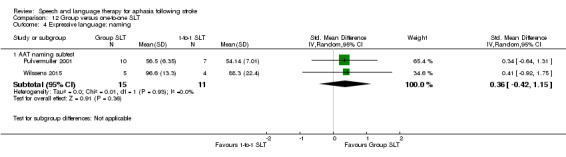
Comparison 12 Group versus one‐to‐one SLT, Outcome 4 Expressive language: naming.
Expressive language: general
Wertz 1981 used the verbal subtest of the PICA to measure participants' language expression. The mean scores of participants who received group SLT and those that received one‐to‐one SLT were available, but SD data were not. We identified and imputed an SD value (20.01) from Wertz 1986, choosing the highest of three possible values in this trial from relevant clinical groups to facilitate inclusion of the study within the review. There was no evidence of a difference between the groups (Analysis 12.5).
12.5. Analysis.
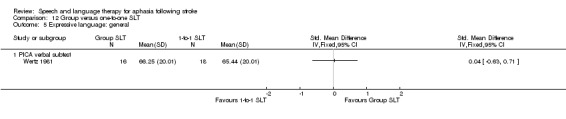
Comparison 12 Group versus one‐to‐one SLT, Outcome 5 Expressive language: general.
Expressive language: word fluency
Wertz 1981 used measures of word fluency to compare participants' word‐finding skills. Authors reported mean values for the participants receiving group SLT and those receiving one‐to‐one SLT, but not the SDs, so we could not include these results in the review.
Expressive language: repetition
Both Pulvermuller 2001 and Wilssens 2015 measured participants' repetition abilities using the AAT repetition subtest. They found no evidence of a difference between the participants who had received group SLT and those that received one‐to‐one SLT (Analysis 12.6).
12.6. Analysis.
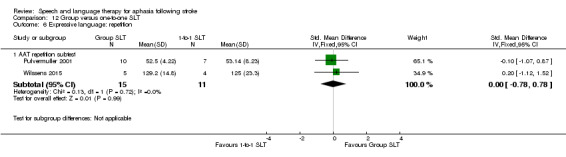
Comparison 12 Group versus one‐to‐one SLT, Outcome 6 Expressive language: repetition.
Expressive language: written
Wertz 1981 captured participants' written language skills using the graphic subtest of the PICA, and Wilssens 2015 used the AAT subtest. Authors reported mean values for participants who received group SLT and those who received one‐to‐one SLT, but SDs were unavailable. As with the other PICA data from Wertz 1981, we identified and imputed an SD value (21.74) from Wertz 1986, choosing the highest of three possible values in this trial from relevant clinical groups to facilitate inclusion of the study within the review. There was no evidence of a difference between participants' written language skills (Analysis 12.7).
12.7. Analysis.
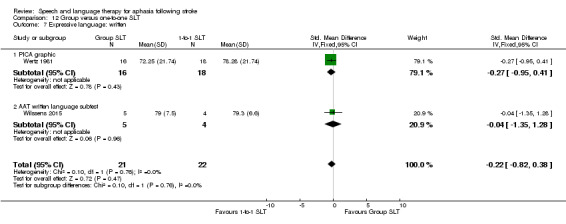
Comparison 12 Group versus one‐to‐one SLT, Outcome 7 Expressive language: written.
4. Quality of life
Of the trials in this section, only VERSE II measured participants' quality of life. Using the Stroke and Aphasia Quality of Life scale (SAQoL), the authors found no evidence of a difference between those that received group therapy and those that received one‐to‐one SLT (Analysis 12.8).
12.8. Analysis.
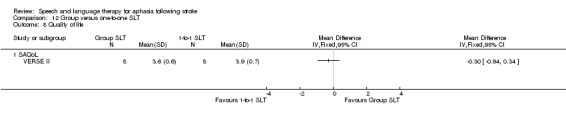
Comparison 12 Group versus one‐to‐one SLT, Outcome 8 Quality of life.
5. Severity of impairment
Four trials measured the severity of participants' aphasia following one‐to‐one versus group SLT interventions using the CRRCAE AQ (Yao 2005iii), the PICA (Wertz 1981), the AAT (Pulvermuller 2001), and the WABAQ (VERSE II). Although the mean values for Wertz 1981 trial were available, the SD data were missing. We imputed an SD value (24.64) from Wertz 1986 to facilitate inclusion of the data within the review. On pooling the data from all four trials, there was no evidence of a difference between the scores of participants that received group SLT and those that received one‐to‐one SLT on this measure (Analysis 12.9).
12.9. Analysis.
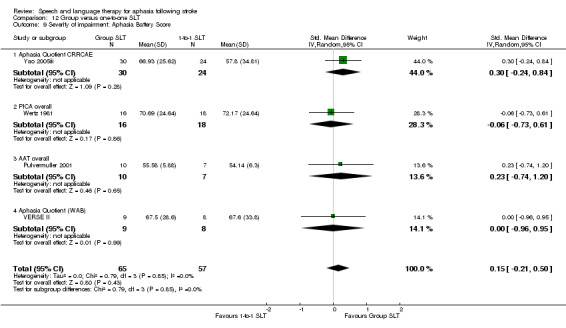
Comparison 12 Group versus one‐to‐one SLT, Outcome 9 Severity of impairment: Aphasia Battery Score.
6. Number of dropouts
Information on the number of participants leaving during the trials were available for most trials (Pulvermuller 2001; VERSE II; Wertz 1981; Wilssens 2015; Yao 2005iii). Numbers of participants remaining in the trial were unclear for FUATAC. Three trials had no dropouts (Pulvermuller 2001; Wilssens 2015; Yao 2005iii). In contrast, almost half of those randomised in Wertz 1981 failed to remain in the study (33 dropouts); when we pooled these results with the data from VERSE II, there was no evidence of a difference in the numbers lost, with 25 leaving the group interventions and 20 leaving the one‐to‐one interventions (Analysis 12.10).
12.10. Analysis.
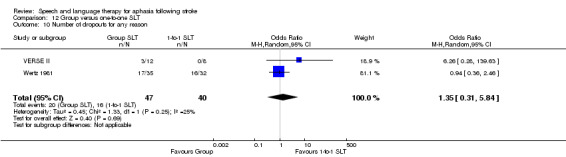
Comparison 12 Group versus one‐to‐one SLT, Outcome 10 Number of dropouts for any reason.
7. Adherence to allocated intervention
Wertz 1981 reported that 22 participants returned home or declined to travel to receive the allocated treatment intervention (see Table 7), but further details on the exact number of participants declining the interventions or how these numbers were split across intervention groups were unavailable. Similarly, while we know that three participants dropped out of the VERSE II trial, the reasons are unclear.
8. Follow‐up data (group versus one‐to‐one SLT)
Two trials continued to follow up participants who had received SLT in group or one‐to‐one sessions (VERSE II; Yao 2005iii), measuring functional communication, severity of aphasia, quality of life, and number of dropouts during the follow‐up period.
Functional communication
VERSE II assessed functional communication, measuring the percentage of content units per minute in the discourse analysis samples at 12 weeks' and 26 weeks' follow‐up. There was no evidence of a difference between the groups (Analysis 13.1).
13.1. Analysis.
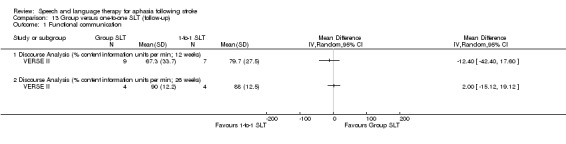
Comparison 13 Group versus one‐to‐one SLT (follow‐up), Outcome 1 Functional communication.
Severity of aphasia
VERSE II used the WABAQ to evaluate the severity of participants' aphasia, while Yao 2005iii used the CRRCAE AQ. On pooling the three‐month follow‐up data, there was no evidence of a difference between the groups (VERSE II; Yao 2005iii; and is presented in Analysis 13.2). Pooling the WABAQ 26‐week data with the CRRCAE AQ data, showed that the participants that had received group therapy performed significantly better on measures of aphasia severity than those who had received one‐to‐one therapy (P = 0.03, SMD 0.82, 95% CI 0.06 to 1.58).
13.2. Analysis.
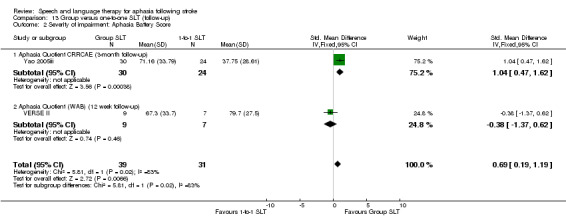
Comparison 13 Group versus one‐to‐one SLT (follow‐up), Outcome 2 Severity of impairment: Aphasia Battery Score.
Quality of life
Similarly, VERSE II measured quality of life using the SAQoL at 12 and 26 weeks and found no evidence of a difference between the groups at either time point (Analysis 13.3).
13.3. Analysis.
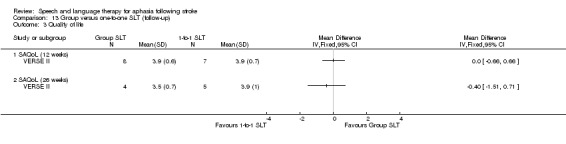
Comparison 13 Group versus one‐to‐one SLT (follow‐up), Outcome 3 Quality of life.
Number of dropouts
Only VERSE II reported the number of dropouts at follow‐up points. There was no evidence of a difference between the groups (Analysis 13.4).
13.4. Analysis.
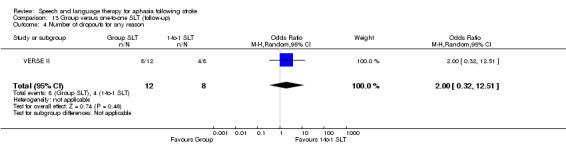
Comparison 13 Group versus one‐to‐one SLT (follow‐up), Outcome 4 Number of dropouts for any reason.
Volunteer‐facilitated SLT versus professionally facilitated SLT
Four trials compared participants who received volunteer‐facilitated SLT versus SLT provided directly by a professional therapist (Leal 1993; Meikle 1979; Meinzer 2007; Wertz 1986iii). In most cases a speech and language therapist delivered the professional SLT (Leal 1993; Meikle 1979; Wertz 1986iii), although a specialist psychologist delivered the constraint‐induced SLT intervention in Meinzer 2007. We believed that this trial was suitable for inclusion in this comparison, as it compared interventions delivered by a professional clinician with delivery facilitated by a trained volunteer.
Most volunteers were family members (Leal 1993; Meinzer 2007; Wertz 1986iii), although some trialists also engaged friends or recruited volunteers unknown to the participants (Meikle 1979; Wertz 1986iii). Volunteer groups across the trials all received SLT training, information on their patient's communication impairment, access to working materials or equipment, and ongoing support or supervision. Most studies indicated that the professional therapist was accountable for, or informed the design and content of, the volunteer‐facilitated SLT (Meikle 1979; Meinzer 2007; Wertz 1986iii).
The professional therapists intervened in a formal or clinical setting (Leal 1993; Meikle 1979; Meinzer 2007; Wertz 1986iii). The duration of the professional SLT interventions varied from three hours daily for 10 consecutive days in Meinzer 2007, up to three hours weekly for six months in Leal 1993, four hours weekly for an average of nine months (SD 22 weeks) in Meikle 1979, or 10 hours weekly for approximately three months in Wertz 1986iii). The duration of volunteer‐facilitated SLT and professionally delivered SLT was the same for two trials (Meinzer 2007; Wertz 1986iii). The volunteers in Meikle 1979 visited participants four times weekly over a shorter period of time (average of five months, SD 13.5 weeks), while the duration of the volunteer‐facilitated SLT in Leal 1993 is unclear. The four trials used a range of measures to compare volunteer‐facilitated SLT with professional SLT delivery including functional communication, receptive language, expressive language, severity of impairment, number of dropouts, and adherence to allocation.The studies did not compare psychosocial or economic measures.
1. Functional communication
Only Wertz 1986iii formally measured the functional communication skills of the participants that received volunteer‐facilitated SLT or professional SLT using the CADL and the FCP. There was no evidence of a difference between the groups (Analysis 14.1).
14.1. Analysis.
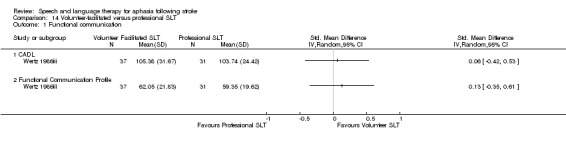
Comparison 14 Volunteer‐facilitated versus professional SLT, Outcome 1 Functional communication.
2. Receptive language
Receptive language: auditory comprehension
Three trials evaluated participants' language comprehension abilities using the Token Test (Leal 1993; Meinzer 2007; Wertz 1986iii), but suitable statistical data were unavailable for Leal 1993. Meinzer 2007 and Wertz 1986iii used the Token Test to measure differences in the auditory comprehension of participants that received volunteer‐facilitated SLT and those that received professional therapy input. There was no significant difference between the two groups' auditory comprehension (Analysis 14.2). The comprehension subtest of the AAT measures both auditory and reading comprehension and was used by Meinzer 2007 to compare a group receiving volunteer‐facilitated SLT or SLT delivered by experienced professionals. There was no evidence of a difference between the groups' comprehension on these measures (Analysis 14.2).
14.2. Analysis.
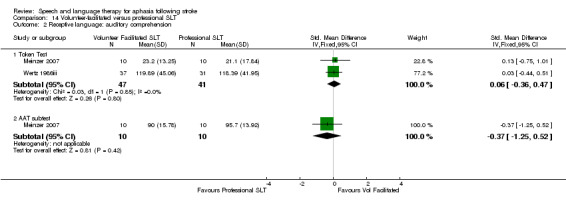
Comparison 14 Volunteer‐facilitated versus professional SLT, Outcome 2 Receptive language: auditory comprehension.
Receptive language: reading comprehension
Wertz 1986iii measured participants' reading comprehension using the RCBA. There was no evidence of a difference between the groups. Data from the AAT that Meinzer 2007 used to measure both auditory and reading comprehension are also presented (but not pooled) in this section (Analysis 14.3).
14.3. Analysis.
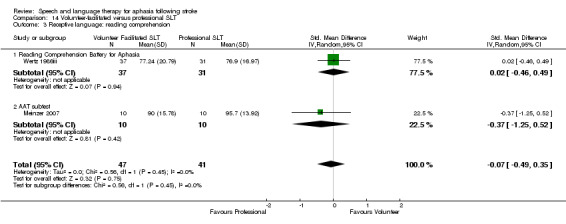
Comparison 14 Volunteer‐facilitated versus professional SLT, Outcome 3 Receptive language: reading comprehension.
Receptive language: other
Wertz 1986iii compared participants' receptive language skills using the PICA gestural subtest. There was no evidence of a difference between the groups (Analysis 14.4).
14.4. Analysis.
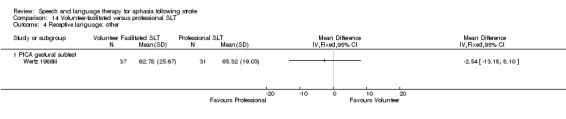
Comparison 14 Volunteer‐facilitated versus professional SLT, Outcome 4 Receptive language: other.
3. Expressive language
Expressive language: spoken
Meinzer 2007 measured expressive language skills using the naming subtest of the AAT, while Wertz 1986iii used the PICA verbal subtest to compare participants that received volunteer‐facilitated SLT and those that received professional SLT. There was no evidence of a difference between the groups (Analysis 14.5).
14.5. Analysis.
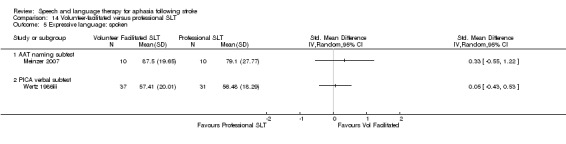
Comparison 14 Volunteer‐facilitated versus professional SLT, Outcome 5 Expressive language: spoken.
Expressive language: repetition
The group that received the volunteer‐facilitated SLT intervention in Meinzer 2007 scored significantly higher on the repetition subtest (AAT) than those that received SLT from a professional therapist (P = 0.05, MD 13.50, 95% CI 0.19 to 26.81) (Analysis 14.6).
14.6. Analysis.
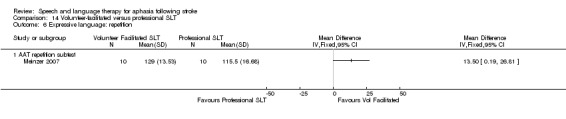
Comparison 14 Volunteer‐facilitated versus professional SLT, Outcome 6 Expressive language: repetition.
Expressive language: written
The written language subtest of the AAT measures reading aloud and writing to dictation. Meinzer 2007 compared the groups that received volunteer‐facilitated SLT versus professionally delivered SLT using this measure. Similarly, Wertz 1986iii used the PICA graphic subtest to compare the groups. They found no evidence of a difference (Analysis 14.7).
14.7. Analysis.
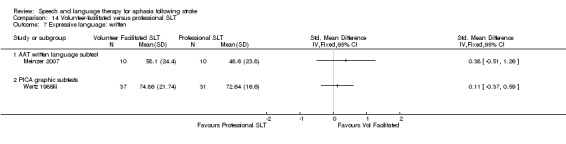
Comparison 14 Volunteer‐facilitated versus professional SLT, Outcome 7 Expressive language: written.
4. Severity of impairment
Four trials compared the two groups using measures of overall severity of aphasia following either volunteer‐facilitated SLT or professional SLT using the PICA (Meikle 1979; Wertz 1986iii), an AQ (Leal 1993), and the AAT profile (Meinzer 2007). Summary data from the groups' performance was unavailable for Leal 1993, preventing inclusion within the review. There was no evidence of a difference between the two groups following pooling of data from the PICA and AAT profile (Analysis 14.8).
14.8. Analysis.
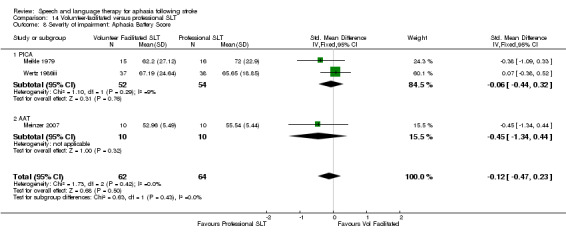
Comparison 14 Volunteer‐facilitated versus professional SLT, Outcome 8 Severity of impairment: Aphasia Battery Score.
5. Number of dropouts
All four trials reported the number of participants that were lost to the trial following randomisation. Three trials lost a total of 30 participants from the groups receiving volunteer‐facilitated SLT, while 22 participants dropped out of the groups that received professional SLT interventions (Leal 1993; Meikle 1979; Wertz 1986iii). Meinzer 2007 had no participant withdrawals. An additional participant that had received volunteer‐facilitated SLT and two participants that had received professional SLT were lost at follow‐up (Wertz 1986iii). No participants were reported lost at follow‐up from Leal 1993. Overall, there was no evidence of a difference in the numbers of dropouts between the groups that received volunteer‐facilitated SLT and those that had professionally delivered SLT (Analysis 14.9).
14.9. Analysis.
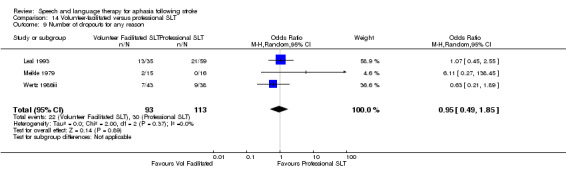
Comparison 14 Volunteer‐facilitated versus professional SLT, Outcome 9 Number of dropouts for any reason.
6. Adherence to allocated intervention
Only two of the three trials provided details for participant withdrawals (Leal 1993; Meikle 1979). Overall there was no difference between the groups. Five participants declined to continue participating in the volunteer‐facilitated SLT groups, while four declined in the professional SLT groups (Analysis 14.10).
14.10. Analysis.
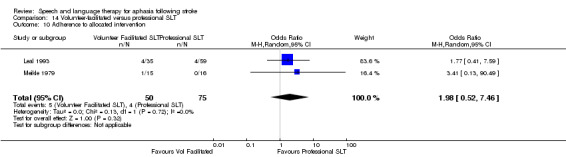
Comparison 14 Volunteer‐facilitated versus professional SLT, Outcome 10 Adherence to allocated intervention.
Computer‐facilitated versus professionally facilitated SLT
Three trials compared an SLT intervention that was facilitated by a computer versus SLT that relied only on professional therapist support (ORLA 2010, Woolf 2015i, Wertz 1981). In ORLA 2010 all 25 participants received 24 one‐hour sessions of an Oral Reading for Language in Aphasia (ORLA) treatment. The rate of delivery of therapy ranged from one to four sessions per week per participant, with a mean overall treatment duration of 12.26 weeks (range 6 to 22 weeks). The dosage of therapy was similar across the comparison groups randomised within Wertz 1981 (352 hours) and Woolf 2015i (8 hours). Similarly, the groups within the trials did not differ in the number of weeks of treatment received. The trial compared computer‐facilitated SLT with professional SLT delivery across a range of measures, including functional communication, receptive language, expressive language, severity of impairment, number of dropouts, and follow‐up data. Studies did not evaluate psychosocial or economic measures.
1. Functional communication
ORLA 2010 reported two measures of discourse efficiency based on a picture description and narrative discourse samples (words per minute and content information units per minute; Nicholas 1995). Woolf 2015i also captured discourse measures (substantive turns, content words per turn and nouns per turn) based on an unstructured conversational sample. On pooling the content information data from both Woolf 2015i and ORLA 2010 with the Wertz 1981 Pragmatic Protocol data, there was no indication of a difference between the two groups' functional communication (Analysis 15.1), nor did this finding alter on pooling the Wertz 1981 data with the other discourse summary data.
15.1. Analysis.
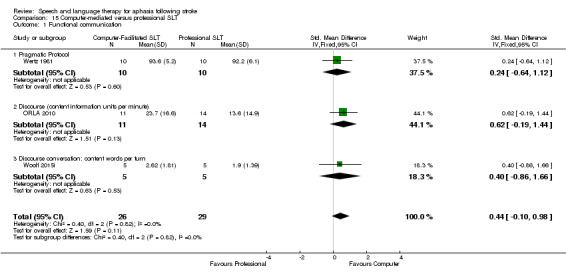
Comparison 15 Computer‐mediated versus professional SLT, Outcome 1 Functional communication.
2. Receptive language
Investigators compared participants' auditory and reading comprehension using the Token Test (Wertz 1981), the PICA gestural subtest (Wertz 1981), and the WAB reading comprehension subtest (ORLA 2010). There was no indication of a difference between the groups that received SLT facilitated by computer and those that received SLT via a professional therapist on these receptive language measures (Analysis 15.2).
15.2. Analysis.
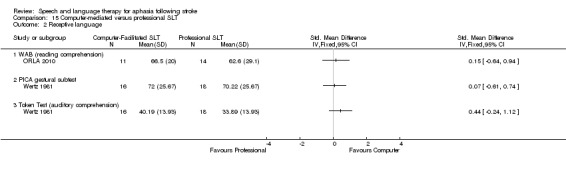
Comparison 15 Computer‐mediated versus professional SLT, Outcome 2 Receptive language.
3. Expressive language
Both Wertz 1981 (PICA verbal subtest) and Woolf 2015i (picture naming test with score for treated, untreated and total) used measures of expressive language to compare trial groups. Participants who used a computer during therapy performed better on measures of untreated words than the participants who worked directly with a professional therapist. There was no other evidence of a difference between the groups (Analysis 15.3). ORLA 2010 assessed participants' writing skills using the WAB writing subtest, and Wertz 1981 used the PICA graphic subtest. There was no evidence of a difference between the two groups' writing skills (Analysis 15.4).
15.3. Analysis.
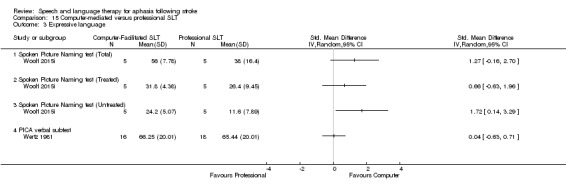
Comparison 15 Computer‐mediated versus professional SLT, Outcome 3 Expressive language.
15.4. Analysis.
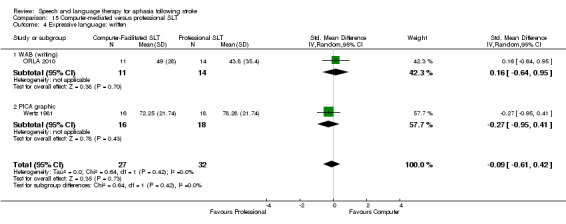
Comparison 15 Computer‐mediated versus professional SLT, Outcome 4 Expressive language: written.
4. Severity of impairment
On pooling the data from ORLA 2010 (WABAQ) and the PICA overall (Wertz 1981), there was no evidence of a significant difference between the participants that accessed SLT via a computer interface and those that had accessed it via a professional therapist (Analysis 15.5).
15.5. Analysis.

Comparison 15 Computer‐mediated versus professional SLT, Outcome 5 Severity of impairment.
5. Number of dropouts
None of the participants in ORLA 2010 were lost during the study. While Wertz 1981 lost participants in both the group with access to a computer during therapy (N=15) and the group that had a professional therapist to support their therapy (N=16), there was no evidence of a difference between the number of dropouts between these groups (Analysis 15.6).
15.6. Analysis.
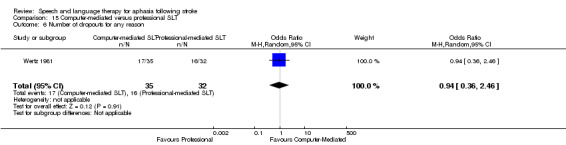
Comparison 15 Computer‐mediated versus professional SLT, Outcome 6 Number of dropouts for any reason.
6. Follow‐up data
Functional communication
Woolf 2015i followed participants up at six weeks and found no evidence of a difference between the groups accessing therapy via computer and those via a professional therapist as measured by the substantive turns, content words per turn, or the number of nouns per turn in an unstructured conversational sample (Analysis 16.1).
16.1. Analysis.
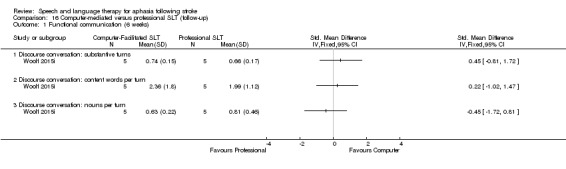
Comparison 16 Computer‐mediated versus professional SLT (follow‐up), Outcome 1 Functional communication (6 weeks).
Expressive language
Similarly, Woolf 2015i measured participants' expressive language skills at six weeks' follow‐up looking at treated and untreated Spoken Picture Naming items. They found no evidence of a difference in total Spoken Picture Naming treated items from the test. The participants who had access to computer‐facilitated SLT named more of the untreated items than the participants who had the support of a professional therapist face‐to‐face (Analysis 16.2).
16.2. Analysis.
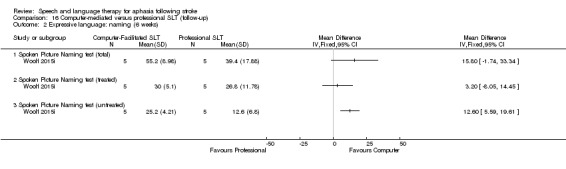
Comparison 16 Computer‐mediated versus professional SLT (follow‐up), Outcome 2 Expressive language: naming (6 weeks).
Semantic SLT versus other approaches to SLT
Four trials compared participants that received SLT interventions based on a semantic therapeutic approach with those that received phonologically based SLT (RATS), communicative SLT (RATS‐2), a repetition in the presence of a picture approach SLT (SEMaFORE), or CIAT approach to SLT (Wilssens 2015). In the RATS‐2 semantic SLT intervention, participants in this arm could also have received a phonologically based SLT in conjunction with or instead of the semantic approach depending on the individual participant's needs. Therapy regimen was similar across both groups, with the semantic intervention being delivered over 9 to 10 days (Wilssens 2015), six weeks (SEMaFORE), up to six months (RATS‐2), or 40 weeks (RATS). Regardless of whether they were randomised to receive a semantically based SLT approach or another type of SLT, participants received 13.5 hours (SEMaFORE), an average of 19 hours (Wilssens 2015), 40 to 60 hours (RATS), or 52 hours of SLT (RATS‐2). Studies compared groups across a range of measures, including functional communication, receptive language, expressive language, number of dropouts, and adherence to allocated intervention. The trials did not assess psychosocial or economic measures. The SEMaFORE trial, although complete, was not yet fully published, so no suitable data were available for inclusion in the meta‐analyses in this section.
1. Functional communication
Three trials measured functional communication using the ANELT (RATS; RATS‐2; Wilssens 2015), and one used the CETI (Wilssens 2015). On pooling the ANELT data, there was no evidence of a difference between the functional communication of groups that received a semantic SLT approach compared with those that received another SLT approach (Analysis 17.1). There was no change in this finding upon pooling the Wilssens 2015 CETI data with the ANELT data from RATS and RATS‐2.
17.1. Analysis.
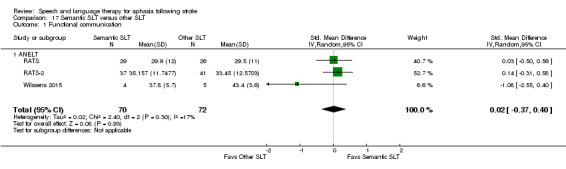
Comparison 17 Semantic SLT versus other SLT, Outcome 1 Functional communication.
2. Receptive language
Receptive language: auditory comprehension
Both RATS‐2 and Wilssens 2015 measured participants' auditory comprehension using the Token Test, and on pooling the data, there was no evidence of a difference between the groups (Analysis 17.2). Wilssens 2015 also used the AAT comprehension test but found no difference between the groups' comprehension skills (Analysis 17.2).
17.2. Analysis.
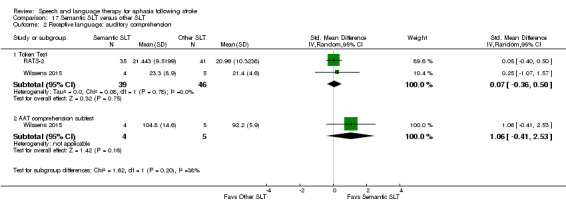
Comparison 17 Semantic SLT versus other SLT, Outcome 2 Receptive language: auditory comprehension.
Receptive language: other
Three trials compared participants' language skills using the Semantic Association Test (RATS; RATS‐2; Wilssens 2015). On pooling the data there was no evidence of a difference between the groups that received semantic‐based SLT and those that received another SLT approach. Similarly, on the PALPA measures of Semantic Association (RATS‐2; Wilssens 2015), the Auditory Lexical Decision (RATS; RATS‐2; Wilssens 2015), or the Auditory Synonym Judgement test (Wilssens 2015), there was no evidence of a difference between the groups' performance (Analysis 17.3).
17.3. Analysis.
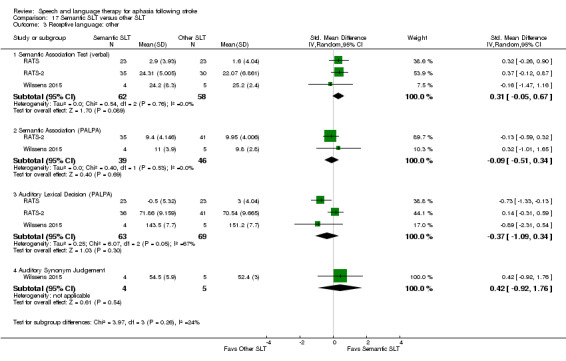
Comparison 17 Semantic SLT versus other SLT, Outcome 3 Receptive language: other.
3. Expressive language
Expressing language: naming
Wilssens 2015 compared participants' naming abilities using the AAT naming subtest and the BNT (Analysis 17.4). There was no evidence of a difference between the groups.
17.4. Analysis.
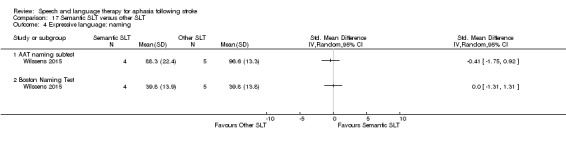
Comparison 17 Semantic SLT versus other SLT, Outcome 4 Expressive language: naming.
Expressing language: writing
Similarly, Wilssens 2015 used the AAT writing subtest to compare participants' writing skills and found no evidence of a difference between the groups (Analysis 17.5).
17.5. Analysis.
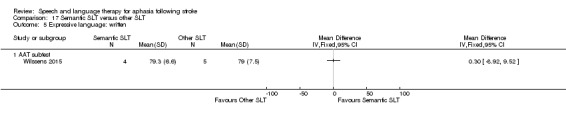
Comparison 17 Semantic SLT versus other SLT, Outcome 5 Expressive language: written.
Expressing language: repetition
Two trials compared participants' repetition skills using the PALPA non‐word repetition test (RATS‐2; Wilssens 2015), and one used the AAT repetition subtest (Wilssens 2015). There was no indication of a difference between the groups (Analysis 17.6).
17.6. Analysis.
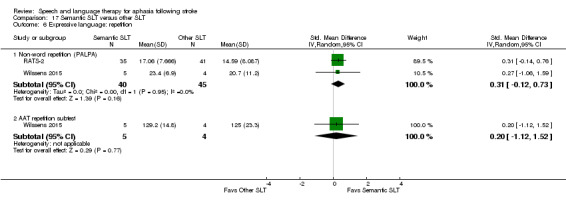
Comparison 17 Semantic SLT versus other SLT, Outcome 6 Expressive language: repetition.
Expressing language: fluency
RATS‐2 measured participants' word fluency using letters and semantic subtests but found no evidence of a difference between the groups (Analysis 17.7).
17.7. Analysis.
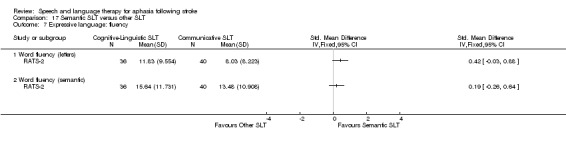
Comparison 17 Semantic SLT versus other SLT, Outcome 7 Expressive language: fluency.
4. Number of dropouts
Wilssens 2015 had no dropouts during the course of the trial. In contrast, between RATS and RATS‐2, 10 participants were lost from the semantic SLT interventions compared with 12 from the other SLT interventions (Analysis 17.8).
17.8. Analysis.
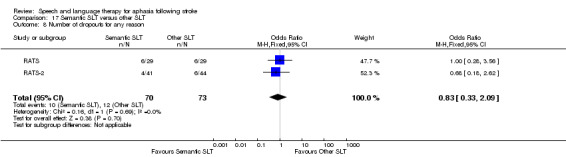
Comparison 17 Semantic SLT versus other SLT, Outcome 8 Number of dropouts for any reason.
5. Adherence to allocated intervention
Of the trials that reported dropouts, eight participants were unable to comply with the allocated semantic SLT intervention compared with eight from the phonological SLT and communicative SLT groups (RATS; RATS‐2; see Analysis 17.9).
17.9. Analysis.
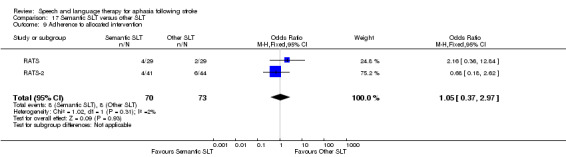
Comparison 17 Semantic SLT versus other SLT, Outcome 9 Adherence to allocated intervention.
Constraint‐induced aphasia therapy versus other SLT
Five trials have recently emerged comparing a CIAT SLT approach with either conventional one‐to‐one SLT (FUATAC; Pulvermuller 2001; VERSE II), another group therapy (Sickert 2014), or a semantic SLT approach (Wilssens 2015). The CIAT was delivered over 10 days (Pulvermuller 2001; Wilssens 2015), 15 days (Sickert 2014), five weeks (VERSE II), and six weeks (FUATAC). The comparator SLT approach was delivered over 15 to 20 hours (VERSE II), 19 hours (Wilssens 2015), 22.5 hours (FUATAC), 30 hours (Sickert 2014), or an average of 34 hours (Pulvermuller 2001). The duration of the contrasting therapy provision ranged from 9 to 10 days (Wilssens 2015), 15 days (Sickert 2014), three to five weeks (Pulvermuller 2001), five weeks (VERSE II), and six weeks (FUATAC). Three trials controlled the duration and dose of therapy across both groups (Sickert 2014; VERSE II; Wilssens 2015).
1. Functional communication
Three trials compared participants that received CIAT to those that received another SLT approach on measures of functional communication, including the ANELT (Wilssens 2015), Discourse Analysis (correct information numbers per minute during samples of picture description and procedural discourse) (VERSE II), the spontaneous speech AAT subtest (Sickert 2014), and the CETI (Wilssens 2015). On pooling the ANELT, Discourse Analaysis scores, and the AAT subtest data, there was no evidence of a difference between the groups (Analysis 18.1). This finding did not change when the CETI data were included in the meta‐analysis instead of the ANELT data.
18.1. Analysis.
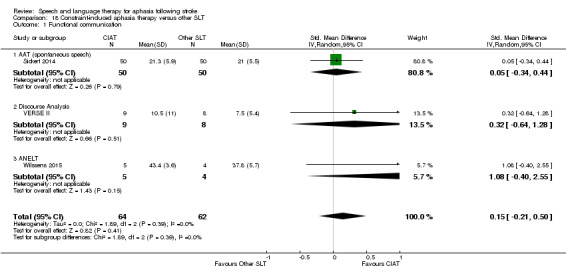
Comparison 18 Constraint‐induced aphasia therapy versus other SLT, Outcome 1 Functional communication.
2. Receptive language
Receptive language: auditory comprehension
Three trials used both the Token Test and the AAT auditory comprehension subtest to compare participants' auditory language skills (Pulvermuller 2001; Sickert 2014; Wilssens 2015). Despite pooling the data from across these trials on each of these measures, there was no evidence of a difference between the groups (Analysis 18.2).
18.2. Analysis.
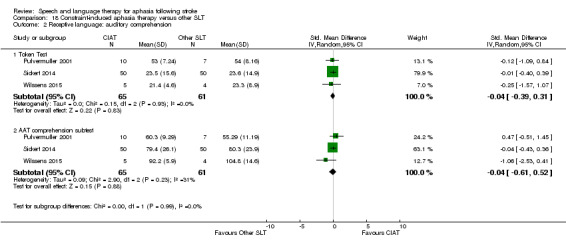
Comparison 18 Constraint‐induced aphasia therapy versus other SLT, Outcome 2 Receptive language: auditory comprehension.
Receptive language: other
Wilssens 2015 also compared the groups receiving CIAT versus a semantic SLT approach on the Semantic Association Test, the PALPA Semantic Association, the Auditory Lexical Decision test, and Auditory Synonym Judgement. There was no indication of a difference between the groups (Analysis 18.3).
18.3. Analysis.
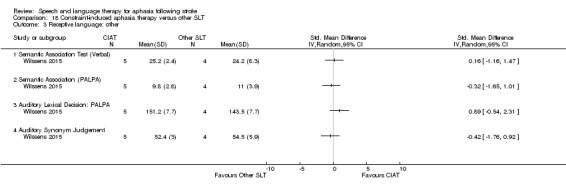
Comparison 18 Constraint‐induced aphasia therapy versus other SLT, Outcome 3 Receptive language: other.
3. Expressive language
Expressive language: naming
Investigators compared participants' naming abilities using the AAT naming subtest in three trials (Pulvermuller 2001; Sickert 2014; Wilssens 2015), while one trial used the Boston Naming Test (Wilssens 2015). On pooling the AAT naming subtest data, there was no evidence of a difference between the groups nor was there any indication of a difference on the BNT (Analysis 18.4).
18.4. Analysis.
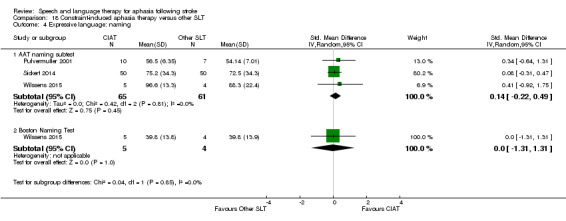
Comparison 18 Constraint‐induced aphasia therapy versus other SLT, Outcome 4 Expressive language: naming.
Expressive language: repetition
There was no evidence of a difference between the groups' performance on measuring repetition using the AAT subtest in Pulvermuller 2001, Sickert 2014, and Wilssens 2015 nor when using the PALPA non‐words repetition subtest in Wilssens 2015 (Analysis 18.5).
18.5. Analysis.
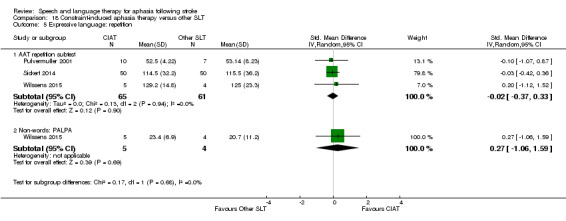
Comparison 18 Constraint‐induced aphasia therapy versus other SLT, Outcome 5 Expressive language: repetition.
Expressive language: writing
Both Sickert 2014 and Wilssens 2015 measured participants' writing skills on the AAT writing subtests, but on pooling the data there was no evidence of a difference between the groups (Analysis 18.6).
18.6. Analysis.
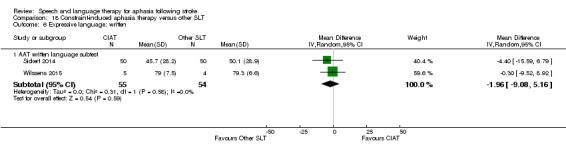
Comparison 18 Constraint‐induced aphasia therapy versus other SLT, Outcome 6 Expressive language: written.
4. Quality of Life
VERSE II measured participants' quality of life using the SAQoL and found no evidence of a difference between those that received CIAT SLT and those that received a conventional SLT approach (Analysis 18.7).
18.7. Analysis.
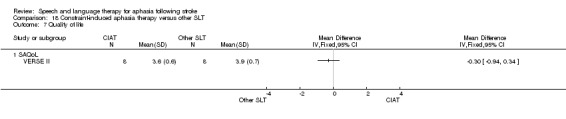
Comparison 18 Constraint‐induced aphasia therapy versus other SLT, Outcome 7 Quality of life.
5. Severity of impairment
Only two trials measured the severity of participants' aphasia: Pulvermuller 2001 used the AAT overall score, and VERSE II used the WABAQ. On pooling the data, there was no evidence of a difference between the groups (Analysis 18.8).
18.8. Analysis.
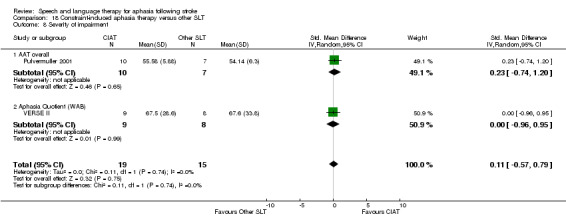
Comparison 18 Constraint‐induced aphasia therapy versus other SLT, Outcome 8 Severity of impairment.
6. Follow‐up data
VERSE II measured participants' functional communication using a Discourse Analysis score, quality of life using the SAQoL, and the severity of aphasia using the WABAQ at 12 and 26 weeks follow‐up. There was no evidence of a difference between the groups that had received CIAT versus conventional SLT at these time points (Analysis 19.1; Analysis 19.2; Analysis 19.3).
19.1. Analysis.
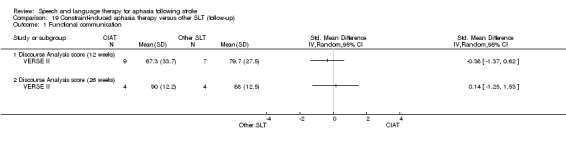
Comparison 19 Constraint‐induced aphasia therapy versus other SLT (follow‐up), Outcome 1 Functional communication.
19.2. Analysis.
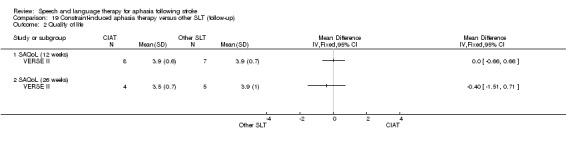
Comparison 19 Constraint‐induced aphasia therapy versus other SLT (follow‐up), Outcome 2 Quality of life.
19.3. Analysis.
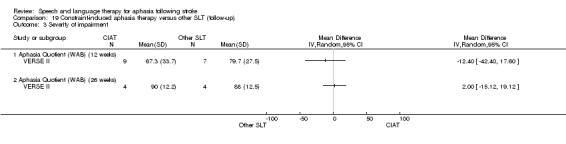
Comparison 19 Constraint‐induced aphasia therapy versus other SLT (follow‐up), Outcome 3 Severity of impairment.
Experimental SLT versus other SLT
Additional studies evaluated a range of other experimental approaches to SLT versus an alternative SLT approach.
SLT with a gestural adjunct during language production.
Melodic intonation therapy (MIT)
Functional SLT
Operant training
Verb comprehension
Discourse therapy
Task‐specific naming and sentence production
Language oriented therapy
Systematic Therapy for Auditory Comprehension Disorders in Aphasic Patients (STACDAP)
Filmed programmed instruction
In most cases, investigators broadly described the comparison treatment as 'conventional' SLT. In MIT 2014i the comparison was to therapy that focused on language comprehension and written language, while in Crerar 1996 the comparison was to preposition therapy. Additionally, many of these experimental interventions were evaluated in randomised controlled trials that were feasibility studies in nature and have so far occurred in isolation. Thus, pooled analysis was not possible. For completeness within this review, however, we have presented these interventions below.
SLT with gestural adjunct versus 'conventional' SLT (no gesture)
Two trials compared conventional therapy (with no gestural movement) versus an SLT intervention with a gestural adjunct: Crosson 2014 by encouraging the use of a gesture during naming activities, and Drummond 1981 by supporting cueing. The format of the summary data reported within Drummond 1981 prevented inclusion in the meta‐analyses. We present data from Crosson 2014 comparing functional communication, expressive language and severity of aphasia measures post‐therapy and at three‐month follow‐up in Analysis 20.1 to Analysis 20.6. There was no evidence of a significant difference between the groups.
20.1. Analysis.
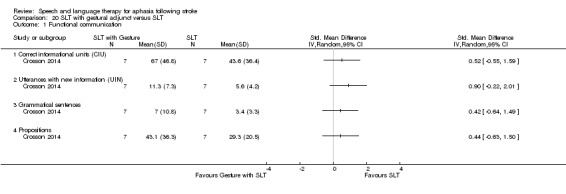
Comparison 20 SLT with gestural adjunct versus SLT, Outcome 1 Functional communication.
20.6. Analysis.
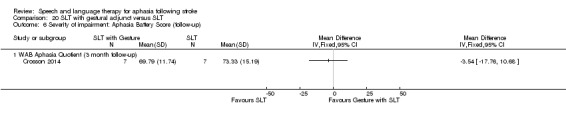
Comparison 20 SLT with gestural adjunct versus SLT, Outcome 6 Severity of impairment: Aphasia Battery Score (follow‐up).
MIT versus SLT (excluding targeted spoken verbal production)
One trial compared a melodic intonation therapy approach (MIT) to SLT, focusing on written language production, language comprehension, and non‐verbal communication strategies (i.e. non‐language production target) (MIT 2014i). The data for this trial relating to measures of functional communication, expressive language (naming and repetition), and number of dropouts can be seen in Analysis 21.1 to Analysis 21.4. Repetition of trained MIT items showed some evidence of effect, but otherwise there was no evidence of a difference between the groups. Data from MIT 2014ii are as yet unavailable.
21.1. Analysis.
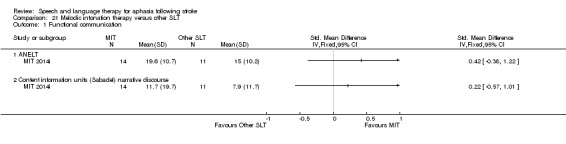
Comparison 21 Melodic intonation therapy versus other SLT, Outcome 1 Functional communication.
21.4. Analysis.
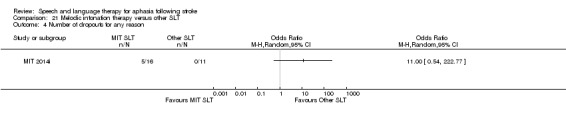
Comparison 21 Melodic intonation therapy versus other SLT, Outcome 4 Number of dropouts for any reason.
Functional versus conventional SLT
The randomised comparison of a functional SLT approach with a conventional SLT intervention is presented as measured by ratings on the CETI (Hinckley 2001). There was no evidence of a difference between the groups (Analysis 22.1). Other data were available but only as change from baseline summary data and thus we did not include them here.
22.1. Analysis.
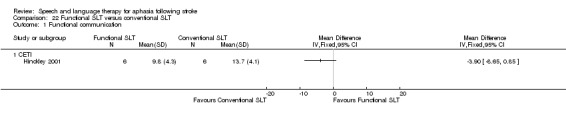
Comparison 22 Functional SLT versus conventional SLT, Outcome 1 Functional communication.
Operant training SLT versus conventional SLT
The randomised comparisons taken from the cross‐over trials compared an operant training SLT intervention with conventional SLT plus an attention control (Lincoln 1984b; Lincoln 1982i; Lincoln 1982ii). We present these results separately within the data and analysis tables for information purposes (Analysis 23.1 to Analysis 23.5). Lincoln 1982i and Lincoln 1982ii randomised participants across four groups that compared SLT plus an operant training adjunct versus SLT plus a social support and stimulation adjunct. In both of these trials, we extracted the means and SD from unpublished individual patient data, which are inclusive of the treatment cross‐over period. Given the complementary nature of the cross‐over intervention (SLT plus operant training or SLT plus social support) and the clinically relevant nature of the cross‐over treatments, we felt it was appropriate to include these data within the review. We present data relating to measures of receptive and expressive language and severity of aphasia in Analysis 23.1 to Analysis 23.5.
23.1. Analysis.
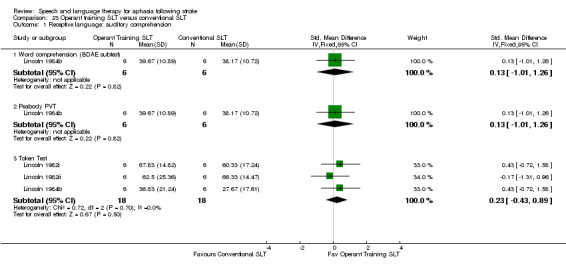
Comparison 23 Operant training SLT versus conventional SLT, Outcome 1 Receptive language: auditory comprehension.
23.5. Analysis.
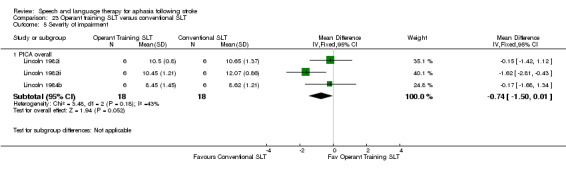
Comparison 23 Operant training SLT versus conventional SLT, Outcome 5 Severity of impairment.
Verb comprehension SLT versus preposition comprehension SLT
Crerar 1996 compared a computer‐mediated approach to verb comprehension therapy with a computer‐mediated preposition comprehension therapy. The trial had a cross‐over design, and we only included data collected prior to the point of cross‐over in the review. The participant group included people with acquired language impairment as a result of other neurological causes, and some participants in the main trial were not truly randomly allocated to an intervention, undergoing a quasi‐random allocation as a result of their language impairment profile, transport situation, or geographical location. We extracted and included in the review only the data from participants with aphasia as a result of stroke that underwent an adequate randomisation procedure. We present the data from the measures of receptive language, expressive language and severity of aphasia in Analysis 24.1 to Analysis 24.4 .
24.1. Analysis.
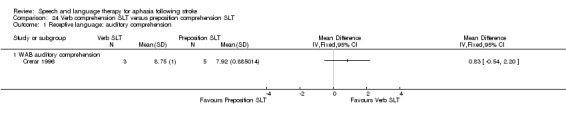
Comparison 24 Verb comprehension SLT versus preposition comprehension SLT, Outcome 1 Receptive language: auditory comprehension.
24.4. Analysis.
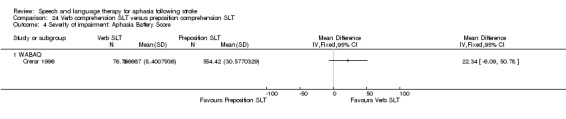
Comparison 24 Verb comprehension SLT versus preposition comprehension SLT, Outcome 4 Severity of impairment: Aphasia Battery Score.
Discourse therapy versus conventional SLT
One trial compared participants that received therapy aiming to support the development and production of discourse language with those that received conventional deficit‐focused SLT on measures of word, sentence and discourse performance across four discourse genre, measures of naming, sentence production, and comprehension (NARNIA 2013). There was no evidence of a difference between the groups (Analysis 25.1 to Analysis 25.3).
25.1. Analysis.
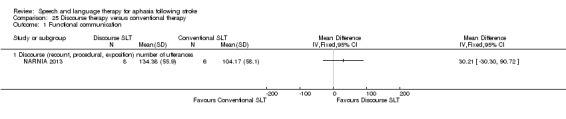
Comparison 25 Discourse therapy versus conventional therapy, Outcome 1 Functional communication.
25.3. Analysis.
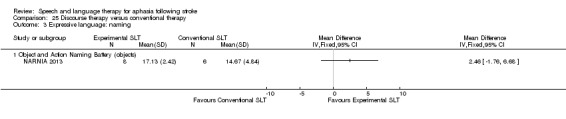
Comparison 25 Discourse therapy versus conventional therapy, Outcome 3 Expressive language: naming.
Task‐specific naming and sentence production SLT versus conventional SLT
Van Steenbrugge 1981 compared participants that received a 'task‐specific' approach to SLT focused on naming and sentence production versus a conventional 'general stimulation' approach to SLT using measures of the Functional Expression (FE) Scale, measures of naming, and sentence construction. There was no evidence of a difference between the groups (Analysis 26.1 to Analysis 26.6).
26.1. Analysis.
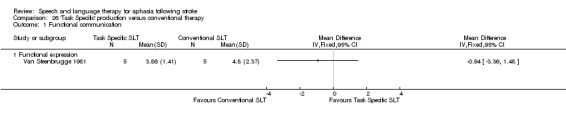
Comparison 26 'Task Specific' production versus conventional therapy, Outcome 1 Functional communication.
26.6. Analysis.
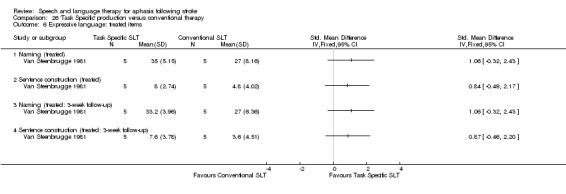
Comparison 26 'Task Specific' production versus conventional therapy, Outcome 6 Expressive language: treated items.
Language oriented therapy (LOT) versus conventional SLT
Based on psycholinguistic principles, Shewan 1984i compared LOT versus a conventional stimulation‐facilitation approach, using the WAB and the ACTS to measure outcomes but suitable summary data were unavailable and so these could not be included in the meta‐analyses. There was no evidence of a difference between the groups in relation to numbers of participants dropping out or adherence rates (Analysis 27.1; Analysis 27.2).
27.1. Analysis.
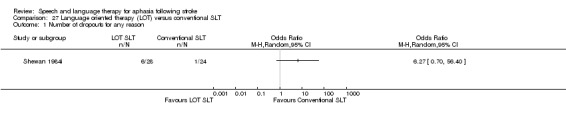
Comparison 27 Language oriented therapy (LOT) versus conventional SLT, Outcome 1 Number of dropouts for any reason.
27.2. Analysis.
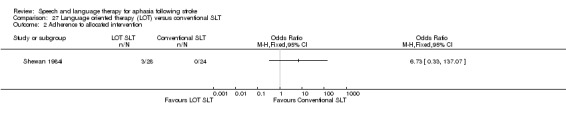
Comparison 27 Language oriented therapy (LOT) versus conventional SLT, Outcome 2 Adherence to allocated intervention.
Task‐specific SLT versus conventional SLT
Prins 1989 compared an SLT intervention focusing specifically on auditory comprehension problems (STACDAP) versus conventional stimulation therapy using functional communication indicators and receptive and expressive language outcome measures. There was no evidence of a difference between the groups (Analysis 28.1 to Analysis 28.7).
28.1. Analysis.
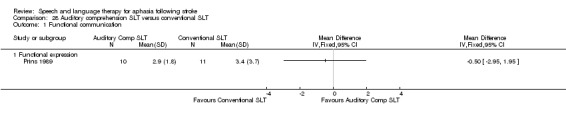
Comparison 28 Auditory comprehension SLT versus conventional SLT, Outcome 1 Functional communication.
28.7. Analysis.
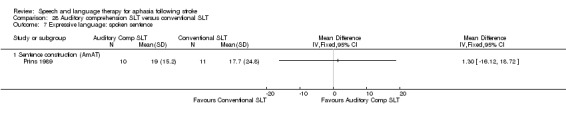
Comparison 28 Auditory comprehension SLT versus conventional SLT, Outcome 7 Expressive language: spoken sentence.
Filmed programme instruction plus SLT versus conventional SLT
Di Carlo 1980 compared the use of a filmed adjunct to SLT with conventional SLT approaches on measures of receptive language. There was no evidence of a difference between the groups (Analysis 29.1).
29.1. Analysis.
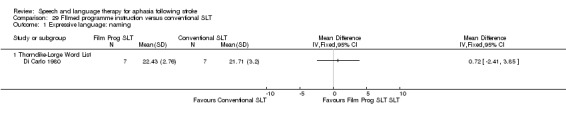
Comparison 29 FIlmed programme instruction versus conventional SLT, Outcome 1 Expressive language: naming.
Discussion
We updated this complex review of the effectiveness of SLT interventions for people with aphasia following stroke to reflect new evidence and developments in clinical practice. We assessed whether SLT is more effective than no SLT, whether SLT is more effective than social support and stimulation, and whether one SLT intervention is more effective than another. We identified, synthesised and presented data from 57 trials (and 3002 participants) in this review.
Summary of main results
Our review includes information on a total of 3002 participants randomised across 74 comparisons. We synthesise the data into three broad comparisons, and we consider these findings below as they relate to SLT versus no SLT, SLT versus social support, and one type of SLT versus a different SLT approach.
SLT versus no SLT
Based on 27 trials involving 1620 participants, we found significant differences between the scores of participants who received SLT and those that did not. Specifically, these differences were evidenced in measures of functional communication, receptive language (including reading), and expressive language (including writing), all of which favoured the provision of SLT (Table 1). However, significant differences were not evident across all measures. Sample sizes remain small, and there is some indication of one or two trials' highly significant findings impacting upon the meta‐analyses. We have profiled the available evidence relating to therapy follow‐up data from these trials which is (as yet) limited in the number of trials and contributing participants (Table 2).
We observed notable statistical heterogeneity among some of the SLT versus no SLT comparisons (e.g. expressive language: general, I2 = 76% and the severity of impairment comparison, I2 = 93%). In addition, we also noted measures based on either the Aphasia Battery of Chinese or the Chinese Aphasia Measurement tools fell outside of the 95% CIs of the associated funnel plots. While we might expect that a proportion (5%) of the results would be observed in this manner by chance, the frequency of the observation is above what we might expect to occur by chance alone. There are a number of possible explanations for these observations. The Cochrane Handbook for Systematic Reviews of Interventions suggests consideration of several possible sources of heterogeneity and asymmetry in funnel plots. Selection bias, poor methodological quality, true heterogeneity, artefact, or chance may have contributed (Higgins 2011). Zhang 2007i, Zhang 2007ii and Zhao 2000 took place in China, where doctors and nurses deliver SLT interventions rather than professional therapists, as may be the case for the other trials in this meta‐analysis. Other aspects of stroke care may also have differed. We also have limited information on the study populations included within these trials, particularly from the Zhao 2000 trial, which does not report time post onset, patient demographics or aphasia severity. Information on the methodological design is also very limited, particularly in relation to the randomisation, concealment of allocation, and blinding of outcome assessors.
Abstracts of these Chinese trials were published in English, thus the contribution of professional translators unfamiliar with some of the technical specifications or methodological terms used in health services research may have had an impact. Within these articles, authors report that the participants within the trials were randomised to the different interventions. Thus, they were eligible for inclusion within this review. Our attempts to access trial details similarly required translation of the trial reports, which may also have introduced some discrepancies between the original meaning of the trialists and our translations. The exact nature of the randomisation processes is unclear, and if we look at the sample sizes of the groups (within Zhao 2000 for example), there is considerable imbalance between the numbers that received SLT (98 participants) and those that did not (40 participants) raising further questions regarding the randomisation processes employed within some studies. Information about some of the tools (and subtests of these tools) used within these trials (such as the Aphasia Battery of Chinese or the Chinese Aphasia Measurement) were unavailable to us. Our pooling of data relating to 'verbal presentation' may not exactly capture the same aspects of verbal expression as other tools within our meta‐analysis. Similarly, issues relating to the tools' validity and reliability were unavailable. Despite our best efforts, we failed to communicate with the Zhang 2007i, Zhang 2007ii or Zhao 2000 trialists to confirm or obtain clarification on any of these issues. In the meantime, the reader should be mindful of the inconsistencies observed within our meta‐analyses when interpreting the findings from this section of the review. We look forward to the availability of the currently ongoing trials in the future, which will further inform this comparison.
SLT versus social support
A total of 447 people were randomised across nine trials to receive either SLT or a social support and stimulation intervention. While we observed some significant differences in the performance of the groups on various measures of language performance (favouring those that received social support), most findings were derived from one small trial of 18 participants (Lincoln 1982iii). The more recent, large, rigorously conducted ACTNoW 2011 trial found no evidence of a significant difference between the functional language skills of the two groups. Additional data are required to confirm whether social support and stimulation provides benefits to some aspects of participants' language skills and on measures of severity of aphasia impairment. In contrast, other significant differences observed (informed by five trials in this comparison) showed that significantly more participants allocated to social support and stimulation interventions dropped out or did not adhere to the intervention when compared with the participants allocated to SLT. While social support and stimulation may be beneficial to some aspects of participants' language performance, we need additional evidence to support this. Where social support and stimulation interventions are being delivered, practitioners should provide clear explanation of the nature and purpose of the support to individuals to reduce any dissatisfaction that might be experienced and which may have resulted in the significantly higher dropout rates observed.
SLT A versus SLT B
Thirty‐eight trials, involving 1242 participants, compared two different types of SLT. This section of the review has grown considerably since our 2012 review, and thus we were able to compare different therapy regimens (differing in intensity, dosage and duration), different therapy delivery models (group, one‐to‐one, volunteer, computer facilitated) and different theoretical approaches (e.g. constraint‐induced therapy, semantic therapy). In general, comparisons continue to be based on a small number of trials involving few participants (typically less than 20). Additional data are still required to further inform these comparisons. The effectiveness of popular SLT approaches such as functional SLT or constraint‐induced aphasia therapy were informed by a small number of trials and did not demonstrate evidence of the effectiveness of these approaches over conventional SLT approaches. Some of the data from these trials were unavailable to this review, so we could not include them in the meta‐analyses. While we hope that these data may become available in the future, we are also looking forward to the availability of data from ongoing trials, which will further inform these comparisons.
There was little evidence of any difference between group SLT and one‐to‐one SLT, computer‐facilitated, or volunteer‐facilitated SLT versus professional SLT, although these comparisons were based on limited numbers of trials involving small numbers of participants. The available evidence, however, indicates there is no evidence of a difference in the provision of SLT interventions facilitated by volunteers or computers (under the direction of professional therapists and with appropriate access to relevant therapy materials and therapeutic intervention plans) compared with direct therapy provision by a professional therapist.
We identified eight trials that compared high‐intensity to low‐intensity SLT. There was some indication of benefits to participants' functional language skills based on the synthesis of data from two trials. Based on pooled data from five different trials, we also observed improvements in severity of aphasia following high‐intensity SLT. However, the number of participants dropping out from the high‐intensity SLT groups was significantly higher than in the low‐intensity SLT groups, confounding the results and suggesting that high‐intensity approaches to therapy (4 to 15 hours per week) may not be suited to all patients. Following Cochrane editorial review, we considered the timing of participant recruitment to the contributing trials as a possible factor to the tolerance of high‐intensity interventions. The trials contributing to this analyses recruited with two weeks (two RCTs), one to three months (four RCTs), and between two to eight years (two RCTs) after onset of aphasia. Effects were no longer observed in a post hoc comparison of trials recruiting participants several years after stroke (nor did those trials report any dropouts). The beneficial effect remained for trials that recruited within three months of aphasia onset, although the significantly higher dropouts from the high‐intensity groups came only from those trials. Similarly, we observed some indication of a benefit of a high dose of therapy (between 60 and 208 hours of therapy) compared with a lower dose of SLT (ranging from 5 to 78 hours), but significant differences were based on findings from a single trial with small numbers of participants. However, where trial data overlapped, as in the number of trial dropouts reported by three trials, the participants who received the lower dose of therapy were less likely to drop out than those that received the higher dose.
It is possible that the timing of an intervention after stroke may be an important factor in both the effectiveness of and tolerance to specific intervention approaches. There are possible interactions between specific individual, aphasia and stroke profiles and the characteristics of complex SLT interventions that vary by intervention regimen, delivery model, and theoretical approach. Exploration of these issues is not suited to Cochrane review methodologies. Instead a large, international, multidisciplinary collaboration of aphasia researchers is aiming to examine such aspects through the RELEASE project.
Overall completeness and applicability of evidence
We identified a substantial number of trials of relevance to our review; most were eligible for inclusion. Across the included trials there was a lack of comprehensive data collection, a wide range of outcome tools employed, and disappointingly inadequate reporting of outcome measures. Many of the trialists generously shared unpublished data and supplementary information to enable accurate representation of their trial in this review. We are very grateful for their time and efforts to provide this information.
Within the review, just over half of the trials described measuring receptive (N = 45) and expressive language skills (N = 56), but not all reported suitable data in a published format that permitted inclusion within this review. We were able to include most trials that described measures of receptive language (67%; N = 30/45) and most expressive language measures (66%; N = 37/56). Forty‐seven trials evaluated the severity of participants' aphasia impairment, and we included suitable data from 29 trials. Similarly, while five trials reported measuring economic outcomes, only data from two were available. Many trials measured participants' functional and psychosocial outcomes, measures that are probably most closely aligned to the patients' sense of recovery and return to 'normal'. From the total of 74 randomised comparisons, more than half (N = 44) described measuring changes in functional communication and of these, most (N = 33/44) reported data that could be included within the meta‐analyses. Few trials measured psychosocial outcomes (N = 8) with five reporting (or providing) data suitable for inclusion within the review.
The degree to which the models of conventional SLT employed within the trials are reflective of therapists' current practice should be carefully considered across individual treatments in terms of the frequency, duration, and the extent of therapeutic intervention. To this end, we employed the TIDieR Checklist to support full data extraction of the SLT interventions within the trials (Hoffmann 2014). In this way, the reader has access to a more comprehensive overview of the interventions being compared in the Characteristics of included studies table. Participants came from across a wide age range and were experiencing a range of aphasia impairments. However, the length of time since participants' stroke raises questions of how clinically relevant some recruitment parameters were to an SLT clinical population.
Less than a fifth (N = 13; 18%) of the included trials recruited participants within the first month following their stroke (a participant group of high clinical relevance) and only four of these recruited participants within the first week after their stroke (Laska 2011; Mattioli 2014; VERSE I; VERSE II). Most recruited participants more than one month, and in some cases many years following their stroke (N = 49), or they did not report the time post onset (N = 12; FUATAC; SEMaFORE; Smith 1981i; Smith 1981ii; Smith 1981iii; Szaflarski 2014; Wu 2004; Xie 2002; Yao 2005i; Yao 2005ii; Yao 2005iii; Zhao 2000). Recruitment procedures involving participants up to 29 years after the onset of their aphasia are of limited application to either a clinical or treatment evaluation setting and raise the question of whether such inclusion criteria are apt to demonstrate effectiveness of an SLT intervention.
Quality of the evidence
Our 2016 update adds a significant amount of data and so, together with continually improving systematic review and reporting methodologies, we are in a better position to draw conclusions regarding the effectiveness of SLT for aphasia following stroke. This review included a total of 74 randomised comparisons involving data from 3002 individual patients.
Methods of random sequence generation and concealment of allocation were considered adequate in 35 and 25 trials, respectively (Figure 2; Figure 3). The randomisation methodology for the remaining trials had been inadequately described, so it was not possible to judge the quality. Similarly, only seven trials reported information on allocation concealment. The lack of description and detail does not necessarily mean inadequate procedures were in place but rather a lack of reporting of this detail (Soares 2004). The prevalence of good methodology in relation to blinding of outcome assessors supports this interpretation, as more than half of the trials within the review (N = 43) described adequate blinding procedures. We only considered 11 to have inadequately blinded assessors, while 20 provided too little detail to make a judgement.
Half of the trials in this review (N = 36, 49%) were published before the CONSORT statement (Consolidated Standards of Reporting Trials) (Altman 2001; Moher 2001). Disappointingly, of the 38 trials published from 2005 (and after the implementation of the CONSORT statement) only 25 (66%) reported adequate methods of generating the randomisation sequence, and only 19 (50%) reported adequate methods of concealing allocation. Of the 20 that failed to adhere to the CONSORT statement (B.A.Bar 2011i; B.A.Bar 2011ii; Conklyn 2012; Crosson 2014; FUATAC; Laska 2011; Liu 2006a; Mattioli 2014; Meinzer 2007; ORLA 2006; ORLA 2010; Rochon 2005; Smania 2006; Szaflarski 2014; Wu 2013; Yao 2005i; Yao 2005ii; Yao 2005iii; Zhang 2007i; Zhang 2007ii), seven were published in Chinese medicine or nursing journals, and three were based on an abstract or short report of a full trial (FUATAC; ORLA 2006; Szaflarski 2014). It is essential that future trial reports adhere to these internationally accepted standards of trial reporting.
Twelve trials reported an a priori power size calculation, which is reflected in the small numbers of randomised participants across the trials included in the review (ACTNoW 2011; B.A.Bar 2011i; Doesborgh 2004; Laska 2011; MIT 2014i; MIT 2014ii; NARNIA 2013; RATS; RATS‐2; SP‐I‐RiT; Varley 2016i; Varley 2016ii). Nine randomised 10 or fewer participants; 43 randomised up to 50 participants; 16 randomised between 51 and 100 participants; two randomised over 100 participants and only four involved 150 individuals or more. The randomisation of such relatively small numbers of participants reduces the power of the statistical analyses, raises questions of the reliability of findings and (given the complexity of various aphasia impairments) causes difficulties in ensuring the comparability of the groups at baseline. Fifteen of the included trials had groups that significantly differed at baseline, and group comparability was unclear in another 10 randomised comparisons.
Despite these reporting and methodological limitations, we have synthesised a large number of trials that address the effectiveness of SLT for aphasia following stroke across a number of outcome measures. Across these measures, there is evidence of the effectiveness of SLT for people with aphasia when compared with no therapy provision. While the consistency in the direction of results observed in the previous version of this review remains following the inclusion of additional trial data, many of the significant differences between pooled data from patients that received SLT and those that did not include data from a single three‐armed trial (Zhang 2007i; Zhang 2007ii). Caution is required in interpreting this trial evidence, as the randomisation procedure, concealment of allocation, blinding, and even details of the SLT intervention evaluated (contents, duration, frequency, intensity) are unclear.
With at least 18 additional trials of relevance to this review currently ongoing or about to report, the picture based on the current evidence for SLT for aphasia following stroke will develop further over time. We can be confident that with the availability of well‐conducted and reported trials, the evidence will continue to strengthen, providing more indications of the effectiveness of specific approaches to SLT.
Thirty‐one of the 74 trials in this review included all randomised participants in their final analyses. The remaining 43 trials lost participants during the treatment or follow‐up phases, but only eleven employed an ITT analysis. In some cases large proportions of participants withdrew from some interventions, and at times this appeared to be linked to the intervention itself, with significantly more participants withdrawing from both intensive SLT and social support interventions than from comparator SLT interventions. Similarly, there was evidence of significantly fewer people adhering to their allocated intervention when that intervention was a social support intervention and a trend towards this when the intervention was a high‐intensity SLT.
Potential biases in the review process
Within this review, we expanded the 2012 search strategy and conducted a comprehensive search for high quality trials that evaluated the effectiveness of SLT for aphasia following stroke. While we are confident we have identified most published trials of relevance to the review, it is still possible that despite our efforts, we may be unaware of additional unpublished work. Our search strategy and study selection criteria were agreed in advance and applied to all identified trials. Our data extraction processes were completed independently and then compared. Whenever possible, we extracted all relevant data and sought missing data directly from the trialists for inclusion within the review. We considered it appropriate to include cross‐over data within our review given the nature of the comparisons, the points at which the data were extracted and, in some cases, the availability of individual patient data.
This review has been informed by the availability of individual patient data (N = 323). In three trials the individual data were presented within the associated publications, while for the remaining 10 trials we are very grateful to the trialists for access to their unpublished data, facilitating inclusion of their trial data within the review. In addition, other trialists generously contributed the relevant summary values thus permitting the full inclusion of important trials from this field within the meta‐analyses (e.g. Wertz 1986i; Wertz 1986ii; Wertz 1986iii). However, there still remain a number of other relevant trials that could not be fully included.
Agreements and disagreements with other studies or reviews
One of the first reviews in this area was Robey 1994, which included 21 published studies (restricted to English language but not to RCTs). The reviewers identified at least 19 more studies that they were unable to include because of the manner in which the data had been reported. They concluded that the provision of SLT in the acute stages of aphasia following stroke was twice as effective as natural recovery patterns. Delayed therapy had a smaller, though still evident, impact. The authors called for better reporting of data and the use of large sample sizes. This team later updated their review, employing the same methodologies and including 55 studies that focused specifically on the amount and type of SLT intervention and its impact on the severity and type of aphasia (Robey 1998a). Again, they concluded that SLT was effective, particularly SLT in the acute stages following stroke and if two or more hours of therapy were provided each week. However, they again did not have access to all the relevant data, and they excluded some key trials, such as Wertz 1986.
Bhogal 2003 reviewed 10 English language publications of controlled trials from a MEDLINE search (1975 to 2002) and associated references. They found that intensive SLT delivered significant treatment effects (when at least nine hours per week were delivered) and that studies that failed to demonstrate a treatment effect had only provided about two hours of SLT per week. The total duration of SLT provision was also negatively correlated with language outcomes. Cherney 2008 also reviewed 10 English language publications (1990 to 2006; 15 electronic databases; not all RCTs) and found modest evidence for intensive SLT and benefits of constraint‐induced aphasia therapy.
In contrast, Moss 2006 reviewed 23 single patient reports involving the provision by a therapist on a one‐to‐one basis of SLT that targeted spoken output or auditory comprehension in 57 participants identified following a systematic search (1985 to 2003) of published or indexed work. They concluded that time since stroke (and aphasia onset) is not linked to the response to SLT though they indicate (based on their data) that response to SLT may decline eight years after stroke. However, the highly selective nature of participants in published single cases studies means that reviews based on such a population group are of questionable applicability to a general clinical population. Individuals (and their caregivers) within such reports are likely to be highly motivated, educated, dedicated, and reliable therapy participants (Moss 2006).
Authors' conclusions
Implications for practice.
Our review presents evidence of the benefits of SLT for people with aphasia following stroke as measured by their functional communication, reading, comprehension, expressive language, and writing. While there is an overall consistency in the findings across all trials included in these analyses, some of our significant findings were dependent on data from a single trial with limited information on the nature of the SLT intervention and the quality of the trial. Thus, we must exercise some caution in interpreting these results. It is also of note that the SLT provided in the included trials could be considered to be at a high level of intensity over variable periods of time.
Based on a smaller number of trials, we also observed some indication of the benefits of high‐intensity approaches to SLT in relation to functional communication and severity of impairment. The intensity of the interventions varied, as did the duration of therapy input, but such high‐intensity approaches to SLT may not have suited all participants. Significantly more participants in the intensive groups dropped out from these trials than from the non‐intensive groups.
Similarly, one small trial indicated that social support and stimulation may be beneficial to some aspects of patients' language skills, but the findings were confounded by a significantly higher participant dropout from social support interventions than from SLT interventions.
There was insufficient evidence within this review to establish the effectiveness of one SLT theoretical approach over another, with little indication of a difference between group SLT versus one‐to‐one SLT, and computer‐mediated SLT versus therapist‐delivered SLT. Similarly, there was little indication of a difference in the effectiveness of SLT facilitated by a trained volunteer versus SLT delivered by a therapist. This is unsurprising, as the volunteers in these trials received specialist training, had access to therapy materials and in many cases were delivering therapy interventions designed and overseen by a professional therapist. This model of SLT treatment delivery is often used in the UK.
Implications for research.
In the course of updating this review, we identified many ongoing trials and trials that are about to report findings. In this context of a rapidly developing evidence base, there will be a need to update the findings of this review once the results of these ongoing trials become available. As aphasia researchers, we need to continue to improve the quality of SLT trials conducted. It is in pursuit of this goal that the Collaboration of Aphasia Trialists has been established. Funded by the European COST Association, this international collaboration of multidisciplinary aphasia researchers seek to enhance the development, conduct, and reporting of aphasia research. Aphasia researchers, funders, reviewers, and editors should be encouraged to publish all findings from completed trials. Investigators should adhere to the recommendations of the CONSORT statement, thus ensuring that the quality of the trial is fully demonstrated in the published report (Altman 2001; Moher 2001). In addition, the recent TIDieR guidelines seek to support better reporting of complex interventions such as SLT for aphasia and to ensure the transparency and transferability of research approaches into clinical practice (Hoffmann 2014). These guidelines have also enhanced the description and profiling of included trial SLT interventions within our Characteristics of included studies table. Trialists should also provide full descriptions of the relevant statistical summary data (means and SDs of final value scores) thus allowing inclusion of their data within any subsequent relevant meta‐analyses. A priori sample size calculations should be employed, ensuring SLT trials are adequately powered to demonstrate differences. The challenge for SLT researchers and clinicians will be to design, develop, conduct, and support larger trials. It is essential for the success of these trials that the work is undertaken in a collaborative manner between patients, clinicians, and researchers. Standardised outcome measures should be employed to evaluate the impact of SLT on participants' functional communication, expressive and receptive language skills, and the severity of their aphasia. We welcome the work currently ongoing in the ROMA study to achieve international consensus on a minimum core data set for aphasia research.
Supported by UK NIHR funding, the RELEASE project is conducting a more detailed examination of the effectiveness of SLT and the interaction between specific individuals, aphasia and stroke profiles, therapy regimens, theoretical approaches, and delivery models. The internationally collaborative group of aphasia researchers is gathering individual patient data from across more than 50 pre‐existing aphasia research studies for the purposes of secondary data analyses, which will specifically examine many of the issues raised in this review. Additional expressions of interest in contribution of aphasia research data sets are welcome.
Our overall aim for future research should be to establish what is the optimum approach, frequency, duration of allocation, and format of SLT provision for specific patient groups.
What's new
| Date | Event | Description |
|---|---|---|
| 31 March 2016 | New search has been performed | These findings are based on a revised and updated search strategy (including more databases) to September 2015. We have also extracted more information on the interventions used in each of the trials using the TIDIER checklist and this additional information is profiled in the Characteristics of Included Studies. We have included 57 randomised controlled trials (74 comparisons) involving 3002 participants. New Summary of Finding Tables are also presented. |
| 31 March 2016 | New citation required and conclusions have changed | The conclusions of the 2016 review update have changed from the previous 2012 version of the review. |
History
Protocol first published: Issue 4, 1997 Review first published: Issue 4, 1999
| Date | Event | Description |
|---|---|---|
| 1 May 2013 | Amended | At the point of the publication of the most recent review update (2011) the updated review should have carried an indicator that the conclusions had changed from the 2009 version of the review. This new amendment corrects that omission. |
| 1 May 2013 | New citation required and conclusions have changed | The conclusions of the 2011 review have changed from the previous 2009 version of the review. This review was based on a new search strategy, amended objectives and refined inclusion criteria for studies, types of interventions and outcome measures of interest. Full details of the amendments are listed in the Background section of the review. We have included a total of 39 studies involving 2518 participants. The findings provide some evidence of the effectiveness of SLT for people with aphasia following stroke in relation to improvements in measures of functional communication, receptive and expressive language when compared to no SLT. The potential benefits of intensive SLT over conventional SLT were confounded by a significantly higher dropout from intensive SLT. More participants also withdrew from social support than SLT interventions. |
| 25 November 2011 | New citation required and conclusions have changed | New first author. New co‐author. |
| 25 November 2011 | New search has been performed | The review has been comprehensively updated. The literature searches have been updated to July 2011. We have included nine new trials, bringing the total number of included studies to 39 involving 2518 participants. |
| 15 December 2009 | New search has been performed | This is a major revision of the original review, which was first published in 1999, and involves the use of a new search strategy, amended objectives and refined inclusion criteria for studies, types of interventions and outcome measures of interest. Full details of the amendments are listed in the Background section of the review. We have included 20 new trials, bringing the total number of included studies to 30, involving 1840 participants. |
| 12 December 2008 | New citation required but conclusions have not changed | This update has been completed by a different team of authors. |
| 24 July 2008 | Amended | Converted to new review format. |
Acknowledgements
We acknowledge Jenny Greener and Renata Whurr, authors of the original review, and the significant contribution the original review made to the field.
We thank Hazel Fraser for her comments and suggestions for this review and for providing us with relevant trials from the Cochrane Stroke Group's Trials Register, and Brenda Thomas for her help with developing the search strategy.
We thank the Cochrane Stroke Group editors and all those who commented on the draft version of this review update, in particular Peter Langhorne, Tammy Hoffmann, Leora Cherney, Valentina Assi, and Tam Watson.
We are grateful to the Chinese Cochrane Centre, Christine Versluis, Audrey Morrison, Theresa Ikegwuonu, Floortje Klijn, Bart Lamers, Pei‐Ling Choo, and Ying Man Law for translations.
We thank all the trialists who patiently responded to our queries, provided translations, and generously contributed unpublished data and additional information to this review.
Appendices
Appendix 1. Assessments
| Name of assessment | Abbreviation | Reference |
| Aachen Aphasia Test | AAT | Huber 1984 |
| Affect Balance Scale | ABS | Bradburn 1969 |
| Aphasia Battery in Chinese | ABC | Reference unavailable |
| Amsterdam Aphasia Test | AmAT | Prins 1980; Vermeulen 1979 |
| Amsterdam‐Nijmegen Everyday Language Test | ANELT | Blomert 1994 |
| Amsterdam‐Nijmegen Everyday Language Test‐A (subscale) | ANELT‐A | Blomert 1994 |
| Auditory Comprehension Test for Sentences | ACTS | Shewan 1979 |
| Boston Diagnostic Aphasia Examination | BDAE | Goodglass 1972 and Goodglass 1983 |
| Boston Naming Test | BNT | Kaplan 1983 |
| Caplan and Hanna Sentence Production Test | CHSPT | Caplan 1998 |
| Chinese Functional Communication Profile | CFCP | Reference unavailable |
| Chinese Rehabilitation Research Centre Aphasia Examination | CRRCAE | Reference unavailable |
| Carer Communication Outcome After STroke scale | Carer COAST | Long 2009 |
| Communication Abilities of Daily Living | CADL | Holland 1980; Holland 1998 |
| Communicative Activity Log | CAL | Pulvermuller 2001 |
| Communicative Effectiveness Index | CETI | Lomas 1989 |
| Communication Outcome After STroke scale | COAST | Long 2008 |
| Communicative Readiness and Use Scale and Psychological Wellbeing Index | ‐ | Lyon 1997 |
| Conversational Rating Scale | CRS | Wertz 1981 |
| Curtin University Discourse Protocol | CUDP | Reference unavailable |
| Discourse Analysis (words per minute; content information units per minute) | DA | Nicholas 1995 |
| EQ‐5D | EQ‐5D | Brooks 1996 |
| Functional Communication Profile | FCP | Sarno 1969 |
| Functional‐Expression scale | FE Scale | Prins 1980 |
| General Health Questionnaire | GHQ | Goldberg 1972 |
| Leal 1993 Aphasia Quotient | AQ | Castro‐Caldas 1979 |
| Minnesota Test for Differential Diagnosis of Aphasia | MTDDA | Schuell 1965 |
| Multiple Adjective Affect Check‐List | MAACL | Zuckerman 1965 |
| National Institutes of Health Stroke Scale | NIHSS | Brott 1989 |
| Nottingham Health Profile | NHP | Ebrahim 1986 |
| Norsk Grunntest for Afasi | NGA | Reinvang 1985 |
| Object Naming Test | ONT | Oldfield 1965 |
| Philadelphia Comprehension Battery | PCB | Saffran 1988 |
| Picture Description with Structured Modeling | PDSM | Fink 1994 |
| Porch Index of Communicative Abilities | PICA | Porch 1967; Porch 1971; Porch 1981 |
| Psycholinguistic Assessments of Language Processing in Aphasia | PALPA | Kay 1992; Bastiaanse 1995 |
| Reading Comprehension Battery for Aphasia | RCBA | LaPointe 1979 |
| Semantic Association Test | SAT | Visch‐Brink 1996 |
| Stroke and Aphasia Quality of Life Scale | SAQoL | Hilari 2003 |
| Token Test (shortened and standard versions) | TT | DeRenzi 1962; Spreen 1969; Lincoln 1979 |
| Therapy Outcome Measures | TOMs | Enderby 2007 |
| Western Aphasia Battery | WAB | Kertesz 1982 |
| Western Aphasia Battery Aphasia Quotient | WABAQ | Kertesz 1982 |
| Word Fluency | ‐ | Borkowski 1967 |
Appendix 2. Cochrane Library Databases
Cochrane Library databases (CDSR, DARE, CENTRAL, HTA) from inception to 22 September 2015
#1 [mh aphasia]
#2 [mh ^"language disorders"] or [mh ^"speech disorders"] or [mh ^anomia]
#3 (aphasi* or dysphasi* or anomia or anomic):ti,ab
#4 ((speech or language* or linguistic or communicat*) near/5 (disorder* or impair* or problem* or dysfunction or difficult*)):ti,ab
#5 #1 or #2 or #3 or #4
#6 [mh aphasia/RH,TH] or [mh ^"language disorders"/RH,TH] or [mh ^"speech disorders"/RH,TH] or [mh ^anomia/RH,TH]
#7 [mh ^"speech‐language pathology"] or [mh "rehabilitation of speech and language disorders"]
#8 ((speech or language* or linguistic or aphasi* or dysphasi* or anomia or anomic) near/5 (therap* or train* or rehabilitat* or treat* or remediat* or intervention* or pathol*)):ti,ab
#9 (SLT or SLP):ti,ab
#10 (melodic next intonation next therap* or MIT):ti,ab
#11 #6 or #7 or #8 or #9 or #10
#12 #5 and #11
#13 (pediatric or paediatric or infant or infants or child or children* or childhood or neonat* or juvenile* or toddler*):ti
#14 ([mh ^child] or [mh ^"child, preschool"] or [mh ^"adult children"] or [mh ^adolescent] or [mh infant]) not [mh adult]
#15 #13 or #14
#16 #12 not #15
Appendix 3. MEDLINE search strategy
MEDLINE (Ovid) from 1946 to 22 September 2015
1. exp aphasia/
2. language disorders/ or speech disorders/ or anomia/
3. (aphasi$ or dysphasi$ or anomia or anomic).tw.
4. ((speech or language$ or linguistic or communicat$) adj5 (disorder$ or impair$ or problem$ or dysfunction or difficult$)).tw.
5. 1 or 2 or 3 or 4
6. exp aphasia/rh, th or language disorders/rh, th or speech disorders/rh, th or anomia/rh, th
7. speech‐language pathology/ or exp "rehabilitation of speech and language disorders"/
8. ((speech or language$ or linguistic or aphasi$ or dysphasi$ or anomia or anomic) adj5 (therap$ or train$ or rehabilitat$ or treat$ or remediat$ or intervention$ or pathol$)).tw.
9. (SLT or SLP).tw.
10. (melodic intonation therap$ or MIT).tw.
11. 6 or 7 or 8 or 9 or 10
12. Randomized Controlled Trials as Topic/
13. random allocation/
14. Controlled Clinical Trials as Topic/
15. control groups/
16. clinical trials as topic/ or clinical trials, phase i as topic/ or clinical trials, phase ii as topic/ or clinical trials, phase iii as topic/ or clinical trials, phase iv as topic/
17. double‐blind method/
18. single‐blind method/
19. Placebos/
20. placebo effect/
21. cross‐over studies/
22. randomized controlled trial.pt.
23. controlled clinical trial.pt.
24. (clinical trial or clinical trial phase i or clinical trial phase ii or clinical trial phase iii or clinical trial phase iv).pt.
25. (random$ or RCT or RCTs).tw.
26. (controlled adj5 (trial$ or stud$)).tw.
27. (clinical$ adj5 trial$).tw.
28. ((control or treatment or experiment$ or intervention) adj5 (group$ or subject$ or patient$)).tw.
29. (quasi‐random$ or quasi random$ or pseudo‐random$ or pseudo random$).tw.
30. ((control or experiment$ or conservative) adj5 (treatment or therapy or procedure or manage$)).tw.
31. ((singl$ or doubl$ or tripl$ or trebl$) adj5 (blind$ or mask$)).tw.
32. (cross‐over or cross over or crossover).tw.
33. (placebo$ or sham).tw.
34. trial.ti.
35. (assign$ or allocat$).tw.
36. controls.tw.
37. or/12‐36
38. 5 and 11 and 37
39. exp animals/ not humans.sh.
40. 38 not 39
41. (pediatric or paediatric or infant or infants or child or children$ or childhood or neonat$ or juvenile$ or toddler$).ti.
42. (child/ or child, preschool/ or adult children/ or adolescent/ or exp infant/) not exp adult/
43. 41 or 42
44. 40 not 43
Appendix 4. EMBASE search strategy
EMBASE (Ovid) from 1980 to 22 September 2015
1. exp aphasia/ or dysphasia/
2. language disability/ or speech disorder/
3. (aphasi$ or dysphasi$ or anomia or anomic).tw.
4. ((speech or language$ or linguistic or communicat$) adj5 (disorder$ or impair$ or problem$ or dysfunction or difficult$)).tw.
5. 1 or 2 or 3 or 4
6. exp aphasia/rh, th, dm or dysphasia/rh, th, dm or language disability/rh, th, dm or speech disorder/rh, th, dm
7. exp speech rehabilitation/
8. ((speech or language$ or linguistic or aphasi$ or dysphasi$ or anomia or anomic) adj5 (therap$ or train$ or rehabilitat$ or treat$ or remediat$ or intervention$ or pathol$)).tw.
9. (SLT or SLP).tw.
10. (melodic intonation therap$ or MIT).tw.
11. 6 or 7 or 8 or 9 or 10
12. Randomized Controlled Trial/ or "randomized controlled trial (topic)"/
13. Randomization/
14. Controlled clinical trial/ or "controlled clinical trial (topic)"/
15. control group/ or controlled study/
16. clinical trial/ or "clinical trial (topic)"/ or phase 1 clinical trial/ or phase 2 clinical trial/ or phase 3 clinical trial/ or phase 4 clinical trial/
17. Crossover Procedure/
18. Double Blind Procedure/
19. Single Blind Procedure/ or triple blind procedure/
20. placebo/ or placebo effect/
21. (random$ or RCT or RCTs).tw.
22. (controlled adj5 (trial$ or stud$)).tw.
23. (clinical$ adj5 trial$).tw.
24. ((control or treatment or experiment$ or intervention) adj5 (group$ or subject$ or patient$)).tw.
25. (quasi‐random$ or quasi random$ or pseudo‐random$ or pseudo random$).tw.
26. ((control or experiment$ or conservative) adj5 (treatment or therapy or procedure or manage$)).tw.
27. ((singl$ or doubl$ or tripl$ or trebl$) adj5 (blind$ or mask$)).tw.
28. (cross‐over or cross over or crossover).tw.
29. (placebo$ or sham).tw.
30. trial.ti.
31. (assign$ or allocat$).tw.
32. controls.tw.
33. or/12‐32
34. 5 and 11 and 33
35. (exp animals/ or exp invertebrate/ or animal experiment/ or animal model/ or animal tissue/ or animal cell/ or nonhuman/) not (human/ or normal human/ or human cell/)
36. 34 not 35
37. (paediatric or paediatric or infant or infants or child or children$ or childhood or neonate$ or juvenile$ or toddler$).it.
38. (child/ or juvenile/ or exp infant/ or preschool child/ or school child/ or toddler/) not (adult/ or aged/ or middle aged/ or young adult/)
39. 37 or 38
40. 36 not 39
Appendix 5. CINAHL search strategy
CINAHL (EBSCO) from 1982 to 22 September 2015
S1 .(MH "Aphasia+")
S2 .(MH "Speech Disorders") or (MH "Language Disorders") or (MH "Anomia")
S3 .TI ( aphasi* or dysphasi* or anomia or anomic ) OR AB ( aphasi* or dysphasi* or anomia or anomic )
S4 .TI ((speech or language* or linguistic or communicat*) N5 (disorder* or impair* or problem* or dysfunction or difficult*)) or AB ((speech or language* or linguistic or communicat*) N5 (disorder* or impair* or problem* or dysfunction or difficult*))
S5 .S1 OR S2 OR S3 OR S4
S6 .(MH "Aphasia+/RH/TH") or (MH "Speech Disorders/RH/TH ") or (MH "Language Disorders/RH/TH ") or (MH "Anomia/RH/TH ")
S7 ..(MH "Rehabilitation, Speech and Language") or (MH "Speech‐Language Pathologists") or (MH "Speech‐Language Pathology") or (MH "Speech Therapy+") or (MH "Language Therapy")
S8 .TI ((speech or language or linguistic or aphasi* or dysphasi* or anomia or anomic) N5 (therap* or train* or rehabilitat* or treat* or remediat* or intervention* or pathol*)) or AB ((speech or language or linguistic or aphasi* or dysphasi* or anomia or anomic) N5 (therap* or train* or rehabilitat* or treat* or remediat* or intervention* or pathol*))
S9 .TI (SLT or SLP) or AB (SLT or SLP)
S10 .TI (melodic intonation therap* or MIT) or AB (melodic intonation therap* or MIT)
S11 .S6 OR S7 OR S8 OR S9 OR S10
S12 .(MH "Randomized Controlled Trials") or (MH "Random Assignment") or (MH "Random Sample+")
S13 .(MH "Clinical Trials") or (MH "Intervention Trials") or (MH "Therapeutic Trials")
S14 .(MH "Double‐Blind Studies") or (MH "Single‐Blind Studies") or (MH "Triple‐Blind Studies")
S15 .(MH "Control (Research)") or (MH "Control Group") or (MH "Placebos") or (MH "Placebo Effect")
S16 .(MH "Crossover Design") OR (MH "Quasi‐Experimental Studies")
S17 .PT (clinical trial or randomized controlled trial)
S18 .TI (random* or RCT or RCTs) or AB (random* or RCT or RCTs)
S19 .TI (controlled N5 (trial* or stud*)) or AB (controlled N5 (trial* or stud*))
S20 .TI (clinical* N5 trial*) or AB (clinical* N5 trial*)
S21 .TI ((control or treatment or experiment* or intervention) N5 (group* or subject* or patient*)) or AB ((control or treatment or experiment* or intervention) N5 (group* or subject* or patient*))
S22 .TI ((control or experiment* or conservative) N5 (treatment or therapy or procedure or manage*)) or AB ((control or experiment* or conservative) N5 (treatment or therapy or procedure or manage*))
S23 .TI ((singl* or doubl* or tripl* or trebl*) N5 (blind* or mask*)) or AB ((singl* or doubl* or tripl* or trebl*) N5 (blind* or mask*))
S24 .TI (cross‐over or cross over or crossover) or AB (cross‐over or cross over or crossover)
S25 .TI (placebo* or sham) or AB (placebo* or sham)
S26 .TI trial
S27 .TI (assign* or allocat*) or AB (assign* or allocat*)
S28 .TI controls or AB controls
S29 .TI (quasi‐random* or quasi random* or pseudo‐random* or pseudo random*) or AB (quasi‐random* or quasi random* or pseudo‐random* or pseudo random*)
S30 .S12 OR S13 OR S14 OR S15 OR S16 OR S17 OR S18 OR S19 OR S20 OR S21 OR S22 OR S23 OR S24 OR S25 OR S26 OR S27 OR S28 OR S29
S31 .S5 AND S11 AND S30
S32 .TI (pediatric or paediatric or infant or infants or child or children* or childhood or neonat* or juvenile* or toddler*)
S33 .((MH "Adolescence+") or (MH "Child+") or (MH "Infant+")) not (MH "Adult")
S34 .S32 OR S33
S35 .S31 not S34
Appendix 6. AMED search strategy
AMED (Ovid) from 1985 to 22 September 2015
1. aphasia/
2. language disorders/ or speech disorders/
3. (aphasi$ or dysphasi$ or anomia or anomic).tw.
4. ((speech or language$ or linguistic or communicat$) adj5 (disorder$ or impair$ or problem$ or dysfunction or difficult$)).tw.
5. 1 or 2 or 3 or 4
6. speech language pathology/ or speech therapy/ or language therapy/
7. ((speech or language$ or linguistic or aphasi$ or dysphasi$ or anomia or anomic) adj5 (therap$ or train$ or rehabilitat$ or treat$ or remediat$ or intervention$ or pathol$)).tw.
8. (SLT or SLP).tw.
9. (melodic intonation therap$ or MIT).tw.
10. 6 or 7 or 8 or 9
11. clinical trials/ or randomized controlled trials/ or random allocation/
12. research design/ or comparative study/
13. double blind method/ or single blind method/
14. placebos/
15. (random$ or RCT or RCTs).tw.
16. (controlled adj5 (trial$ or stud$)).tw.
17. (clinical$ adj5 trial$).tw.
18. ((control or treatment or experiment$ or intervention) adj5 (group$ or subject$ or patient$)).tw.
19. (quasi‐random$ or quasi random$ or pseudo‐random$ or pseudo random$).tw.
20. ((control or experiment$ or conservative) adj5 (treatment or therapy or procedure or manage$)).tw.
21. ((singl$ or doubl$ or tripl$ or trebl$) adj5 (blind$ or mask$)).tw.
22. (cross‐over or cross over or crossover).tw.
23. (placebo$ or sham).tw.
24. trial.ti.
25. (assign$ or allocat$).tw.
26. controls.tw.
27. or/11‐26
28. 5 and 10 and 27
29. (pediatric or paediatric or infant or infants or child or children$ or childhood or neonat$ or juvenile$ or toddler$).ti.
30. (exp adolescent/ or exp child/ or exp infant/) not exp adult/
31. 29 or 30
32. 28 not 31
Appendix 7. Speech and language therapy approaches
| Type of SLT | Speech and language therapy | Study ID |
| Conventional | Any form of targeted practice tasks or methodologies that aim to maximise the understanding and production of language and communication abilities across spoken and written modalities. Generally conducted on a 1‐to‐1 patient‐therapist basis and using stimulation‐facilitation approaches | ACTNoW 2011; Bakheit 2007; Crosson 2014; David 1982; Denes 1996; Di Carlo 1980; Drummond 1981; Elman 1999; FUATAC; Hinckley 2001; Leal 1993; Lincoln 1982i; Lincoln 1984a; Lincoln 1984b; Mattioli 2014; Meikle 1979; NARNIA 2013; Prins 1989; Pulvermuller 2001; Shewan 1984i; Shewan 1984iii; Sickert 2014; Smania 2006; Smith 1981i; Smith 1981ii; Smith 1981iii; SP‐I‐RiT; Van Steenbrugge 1981; VERSE I; VERSE II; Wertz 1981; Wertz 1986i; Wertz 1986iii; Woolf 2015i; Woolf 2015ii; Woolf 2015iii; Wu 2004; Wu 2013; Xie 2002Yao 2005ii; Yao 2005iii |
| Computer‐mediated | Targeted practice tasks or methodologies that aim to improve a patient's language or communication abilities but that are accessed via a computer program | B.A.Bar 2011i; B.A.Bar 2011ii; CACTUS 2013; Crerar 1996; Doesborgh 2004; Katz 1997i; Katz 1997ii; ORLA 2006; ORLA 2010; Varley 2016i; Varley 2016ii |
| Cognitive‐linguistic | Employs lexical semantic treatment and phonological treatment programme components as required | RATS‐2 |
| Communicative | Verbal and non‐verbal strategies to communicate information. No focus on semantic, phonological or syntax components | RATS‐2 |
| Constraint‐induced | Participants required to use spoken communication alone Other communicative methods such as gesture are not encouraged or permitted. Also known as 'Forced Use Aphasia Therapy'. | FUATAC; Meinzer 2007; Pulvermuller 2001; Sickert 2014; Szaflarski 2014; VERSE II; Wilssens 2015; |
| Functional | Targets improvement in communication tasks considered to be useful in day‐to‐day functioning | Denes 1996; Elman 1999; Hinckley 2001; Lyon 1997 |
| Gestural cueing | Use of gesture as a cue to facilitate word‐finding or naming | Drummond 1981 (AMERIND); Crosson 2014 |
| Group | An SLT intervention involving 2 or more participants with aphasia | Elman 1999; Wertz 1981; Yao 2005i; Yao 2005iii |
| Intensive | 4 or more hours of therapeutic intervention each week | Bakheit 2007; Denes 1996; Elman 1999; Hinckley 2001; Laska 2011; Lyon 1997; MacKay 1988; ORLA 2006; RATS‐2 (some); Smith 1981i; Smith 1981iii; VERSE I (some); Wertz 1981; Wertz 1986i; Wertz 1986ii |
| Language‐orientated | Follows psycholinguistic principles | Shewan 1984i; Shewan 1984ii |
| Language Enrichment Therapy (LET) | Hierarchically organised programme of comprehension and naming activity Salonen 1980. Common Scandinavian SLT approach. | Laska 2011 |
| Narrative | Metalinguistic approach to provide marcostructure to sentences and discourse. | NARNIA 2013; |
| Meldonic intonation therapy | Employs rhythm and formulaic language to support recovery of language | Conklyn 2012; MIT 2014i; MIT 2014ii |
| Operant training | Not a widely practiced approach to SLT but it is a verbal conditioning procedure with the purpose (in the examples included in this review) of improving communication skills | Lincoln 1984a; Lincoln 1982i; Lincoln 1982ii |
| Oral Language Reading for Aphasia (ORLA) | "The person with aphasia systematically and repeatedly reads aloud sentences and paragraphs, first in unison with the clinicians and then independently" | ORLA 2006; ORLA 2010 |
| Phonological treatment | Focuses on improving the sound structure of language. Therapy is directed at the phonological input and output routes. | RATS; VERSE I |
| Semantic treatment | Focuses on interpretation of language with the aim of improving semantic processing | RATS; VERSE I; Wilssens 2015; SEMaFORE |
| Sentence mapping | Targets the mapping between the meaning and syntactic structure of sentences | Rochon 2005 |
| Task‐specific | Therapy focused on specific areas of communication impairment | Crerar 1996 (Verb and Preposition therapy); Drummond 1981 (word finding); Meinzer 2007; Prins 1989 (STACDAP); Pulvermuller 2001 (constraint‐induced therapy); Rochon 2005 (Sentence Mapping Therapy); Van Steenbrugge 1981 (naming and sentence construction); Repetition in the presence of a Picture (SEMaFORE) |
| Volunteer‐facilitated (trained) | Targeted practice tasks or methodologies that aim to improve a patient's language or communication abilities but delivered by a volunteer Training, material and intervention plans are usually provided to support the volunteer | Leal 1993; MacKay 1988; Meikle 1979; Meinzer 2007; Wertz 1986ii; Wertz 1986iii |
| Social support and stimulation | An intervention which provides social support or stimulation but does not include targeted interventions that aim to resolve participants' expressive/receptive speech and language impairments | ACTNoW 2011; Elman 1999; David 1982; Lincoln 1982iii; Rochon 2005; Shewan 1984ii; Shewan 1984iii; Woolf 2015ii; Woolf 2015iii |
| Programmed instruction | Behavioural intervention that employs a book or film to present materials for learning. Participants can progress through the tasks at their own pace, using queries to test their new learning. Progression to the next stage only occurs once they have been successful at an earlier stage | Di Carlo 1980 |
| Placebo | An intervention that mimics the experimental intervention in nature but does not have components that aim to resolve or improve participants' expressive/receptive speech and language skills | Di Carlo 1980 (non‐programmed activity); Katz 1997ii ('arcade‐style games': non‐language computer based); Lincoln 1982i (attention non‐specific); Lincoln 1984b (non‐specific placebo) |
Appendix 8. Search strategies used in previous versions of this review
For the original version of the review searches of MEDLINE (1966 to 1998) and CINAHL (1982 to 1998) were carried out using simple combinations of text words describing aphasia and SLT. We also searched major trials registers for ongoing trials including ClinicalTrials.gov (http://www.clinicaltrials.gov/), the Stroke Trials Registry (www.strokecenter.org/trials/) and Current Controlled Trials (www.controlled‐trials.com).
MEDLINE (Ovid) ‐ 2011 review
1. exp aphasia/ 2. language disorders/ or anomia/ 3. (aphasi$ or dysphasi$ or anomia or anomic).tw. 4. ((language or linguistic) adj5 (disorder$ or impair$ or problem$ or dysfunction)).tw. 5. 1 or 2 or 3 or 4 6. language therapy/ or speech therapy/ 7. Speech‐Language Pathology/ 8. ((speech or language or aphasia or dysphasia) adj5 (therap$ or train$ or rehabilitat$ or treat$ or remediat$ or pathol$)).tw. 9. remedial therap$.tw. 10. 6 or 7 or 8 or 9 11. 5 and 10 12. exp aphasia/rh, th or language disorders/rh, th or anomia/rh, th 13. 11 or 12 14. Randomized Controlled Trials/ 15. random allocation/ 16. Controlled Clinical Trials/ 17. control groups/ 18. clinical trials/ 19. double‐blind method/ 20. single‐blind method/ 21. Multicenter Studies/ 22. Therapies, Investigational/ 23. Research Design/ 24. Program Evaluation/ 25. evaluation studies/ 26. randomized controlled trial.pt. 27. controlled clinical trial.pt. 28. clinical trial.pt. 29. multicenter study.pt. 30. evaluation studies.pt. 31. random$.tw. 32. (controlled adj5 (trial$ or stud$)).tw. 33. (clinical$ adj5 trial$).tw. 34. ((control or treatment or experiment$ or intervention) adj5 (group$ or subject$ or patient$)).tw. 35. (quasi‐random$ or quasi random$ or pseudo‐random$ or pseudo random$).tw. 36. ((multicenter or multicentre or therapeutic) adj5 (trial$ or stud$)).tw. 37. ((control or experiment$ or conservative) adj5 (treatment or therapy or procedure or manage$)).tw. 38. ((singl$ or doubl$ or tripl$ or trebl$) adj5 (blind$ or mask$)).tw. 39. (coin adj5 (flip or flipped or toss$)).tw. 40. latin square.tw. 41. versus.tw. 42. (assign$ or alternate or allocat$ or counterbalance$ or multiple baseline).tw. 43. controls.tw. 44. or/14‐43 45. 13 and 44 46. child$.ti. 47. 45 not 46
EBSCO Search Strategy ‐ 2011 review
S44 S42 not S43 S43 TI child* S42 S18 and S41 S41 S19 or S20 or S21 or S22 or S23 or S24 or S25 or S26 or S27 or S28 or S29 or S32 or S33 or S36 or S37 or S40 S40 S38 and S39 S39 TI ( group* or subject* or patient* ) or AB ( group* or subject* or patient* ) S38 TI ( control or treatment or experiment* or intervention ) or AB ( control or treatment or experiment* or intervention ) S37 TI ( assign* or alternate or allocat* or counterbalance* or multiple baseline* or ABAB design* ) or AB ( assign* or alternate or allocat* or counterbalance* or multiple baseline* or ABAB design* ) S36 S34 and S35 S35 TI trial* or AB trial* S34 TI ( clin* or intervention* or compar* or experiment* or therapeutic ) or AB ( clin* or intervention* or compar* or experiment* or therapeutic ) S33 TI ( cross?over or control* or factorial or sham ) or AB ( cross?over or control* or factorial or sham ) S32 S30 and S31 S31 TI ( blind* or mask* ) or AB ( blind* or mask* ) S30 TI ( singl* or doubl* or tripl* or trebl* ) or AB ( singl* or doubl* or tripl* or trebl* ) S29 TI random* or AB random* S28 PT clinical trial S27 (MH "Clinical Research") OR (MH "Clinical Nursing Research") S26 (MH "Nonrandomized Trials") OR (MH "Study Design") OR (MH "Community Trials") OR (MH "One‐Shot Case Study") OR (MH "Experimental Studies") OR (MH "Pretest‐Posttest Design") OR (MH "Solomon Four‐Group Design") OR (MH "Static Group Comparison") S25 (MH "Quasi‐Experimental Studies") S24 (MH "Factorial Design") S23 (MH "Control (Research)") OR (MH "Control Group") S22 (MH "Comparative Studies") S21 (MH "Clinical Trials+") S20 (MH "Crossover Design") S19 (MH "Random Sample") OR (MH "Random Assignment") S18 S16 or S17 S17 (MH "Language Disorders/RH/TH") OR (MH "Aphasia/RH/TH") OR (MH "Aphasia, Broca/RH/TH") OR (MH "Aphasia, Wernicke/RH/TH") S16 S7 and S15 S15 S8 or S9 or S10 or S11 or S14 S14 S12 and S13 S13 TI ( therap* or train* or rehabilitat* or treat* or pathol* ) or AB ( therap* or train* or rehabilitat* or treat* or pathol* ) S12 TI ( speech or language or aphasia or dysphasia ) or AB ( speech or language or aphasia or dysphasia ) S11 (MH "Speech‐Language Pathologists") S10 (MH "Communication Skills Training") S9 (MH "Speech‐Language Pathology") S8 (MH "Rehabilitation, Speech and Language") OR (MH "Alternative and Augmentative Communication") OR (MH "Language Therapy") OR (MH "Speech, Alaryngeal+") OR (MH "Speech Therapy") S7 S1 or S2 or S3 or S6 S6 S4 and S5 S5 TI ( disorder* or impair* or problem* or dysfunction ) or AB ( disorder* or impair* or problem* or dysfunction ) S4 TI ( language or linguistic ) or AB ( language or linguistic ) S3 TI ( aphasi* or dysphasi* or anomia or anomic ) or AB ( aphasi* or dysphasi* or anomia or anomic ) S2 (MH "Language Disorders") S1 (MH "Aphasia") OR (MH "Aphasia, Broca") OR (MH "Aphasia, Wernicke")
Data and analyses
Comparison 1. SLT versus no SLT.
| Outcome or subgroup title | No. of studies | No. of participants | Statistical method | Effect size |
|---|---|---|---|---|
| 1 Functional communication | 10 | 376 | Std. Mean Difference (IV, Fixed, 95% CI) | 0.28 [0.06, 0.49] |
| 1.1 WAB (spontaneous speech) | 2 | 55 | Std. Mean Difference (IV, Fixed, 95% CI) | 0.14 [‐0.40, 0.69] |
| 1.2 ANELT | 3 | 150 | Std. Mean Difference (IV, Fixed, 95% CI) | 0.18 [‐0.15, 0.50] |
| 1.3 AAT (spontaneous speech) | 1 | 12 | Std. Mean Difference (IV, Fixed, 95% CI) | 0.46 [‐0.69, 1.62] |
| 1.4 Functional Communication Profile | 2 | 103 | Std. Mean Difference (IV, Fixed, 95% CI) | 0.25 [‐0.16, 0.66] |
| 1.5 Chinese Functional Communication Examination | 2 | 56 | Std. Mean Difference (IV, Fixed, 95% CI) | 0.77 [0.18, 1.37] |
| 2 Receptive language: auditory comprehension | 10 | 399 | Std. Mean Difference (IV, Fixed, 95% CI) | 0.06 [‐0.15, 0.26] |
| 2.1 Token Test | 4 | 148 | Std. Mean Difference (IV, Fixed, 95% CI) | 0.15 [‐0.19, 0.48] |
| 2.2 Aphasia Battery of Chinese | 2 | 56 | Std. Mean Difference (IV, Fixed, 95% CI) | 0.08 [‐0.49, 0.65] |
| 2.3 PICA subtest | 2 | 55 | Std. Mean Difference (IV, Fixed, 95% CI) | 0.15 [‐0.40, 0.69] |
| 2.4 Norsk Grunntest for Afasi | 1 | 114 | Std. Mean Difference (IV, Fixed, 95% CI) | ‐0.01 [‐0.38, 0.36] |
| 2.5 CAT (spoken sentence comprehension) | 1 | 26 | Std. Mean Difference (IV, Fixed, 95% CI) | ‐0.36 [‐1.13, 0.42] |
| 3 Receptive language: reading comprehension | 8 | 253 | Std. Mean Difference (IV, Fixed, 95% CI) | 0.29 [0.03, 0.55] |
| 3.1 Reading Comprehension Battery for Aphasia | 2 | 103 | Std. Mean Difference (IV, Fixed, 95% CI) | 0.11 [‐0.30, 0.52] |
| 3.2 PICA reading subtest | 2 | 55 | Std. Mean Difference (IV, Fixed, 95% CI) | 0.12 [‐0.42, 0.67] |
| 3.3 Aphasia Battery of Chinese | 2 | 56 | Std. Mean Difference (IV, Fixed, 95% CI) | 0.88 [0.28, 1.48] |
| 3.4 AAT subtest | 1 | 12 | Std. Mean Difference (IV, Fixed, 95% CI) | 0.73 [‐0.45, 1.92] |
| 3.5 CAT (Written Word Comprehension) | 1 | 27 | Std. Mean Difference (IV, Fixed, 95% CI) | 0.11 [‐0.65, 0.87] |
| 4 Receptive language: other | 5 | 192 | Std. Mean Difference (IV, Random, 95% CI) | 1.23 [0.11, 2.36] |
| 4.1 PICA gestural subtest | 4 | 158 | Std. Mean Difference (IV, Random, 95% CI) | 0.34 [0.01, 0.67] |
| 4.2 Chinese Language Impairment Examination: comprehension | 1 | 34 | Std. Mean Difference (IV, Random, 95% CI) | 5.69 [4.10, 7.28] |
| 5 Expressive language: naming | 7 | 275 | Std. Mean Difference (IV, Fixed, 95% CI) | 0.14 [‐0.10, 0.38] |
| 5.1 Boston Naming Test | 1 | 18 | Std. Mean Difference (IV, Fixed, 95% CI) | ‐0.00 [‐0.93, 0.93] |
| 5.2 WAB Naming subtest | 2 | 55 | Std. Mean Difference (IV, Fixed, 95% CI) | 0.27 [‐0.27, 0.82] |
| 5.3 Norsk Grunntest for Afasi | 1 | 114 | Std. Mean Difference (IV, Fixed, 95% CI) | 0.02 [‐0.35, 0.39] |
| 5.4 AAT subtest | 1 | 12 | Std. Mean Difference (IV, Fixed, 95% CI) | 1.10 [‐0.15, 2.36] |
| 5.5 Object and Action Naming Battery (treated) | 1 | 28 | Std. Mean Difference (IV, Fixed, 95% CI) | ‐0.01 [‐0.75, 0.74] |
| 5.6 Naming accuracy (matched) | 1 | 48 | Std. Mean Difference (IV, Fixed, 95% CI) | 0.21 [‐0.36, 0.78] |
| 6 Expressive language: general | 7 | 248 | Std. Mean Difference (IV, Random, 95% CI) | 1.28 [0.38, 2.19] |
| 6.1 PICA Verbal subtest | 4 | 158 | Std. Mean Difference (IV, Random, 95% CI) | 0.26 [‐0.07, 0.59] |
| 6.2 Aphasia Battery of Chinese (verbal presentation) | 2 | 56 | Std. Mean Difference (IV, Random, 95% CI) | 1.99 [1.03, 2.95] |
| 6.3 Chinese Language Impairment Examination | 1 | 34 | Std. Mean Difference (IV, Random, 95% CI) | 4.65 [3.29, 6.00] |
| 7 Expressive language: written | 8 | 253 | Std. Mean Difference (IV, Fixed, 95% CI) | 0.41 [0.14, 0.67] |
| 7.1 PICA Writing subtest | 2 | 55 | Std. Mean Difference (IV, Fixed, 95% CI) | 0.34 [‐0.21, 0.89] |
| 7.2 PICA Graphic | 2 | 103 | Std. Mean Difference (IV, Fixed, 95% CI) | 0.25 [‐0.16, 0.66] |
| 7.3 Aphasia Battery of Chinese (Writing) | 2 | 56 | Std. Mean Difference (IV, Fixed, 95% CI) | 1.02 [0.41, 1.63] |
| 7.4 AAT subtest | 1 | 12 | Std. Mean Difference (IV, Fixed, 95% CI) | 1.46 [0.12, 2.80] |
| 7.5 CAT (Writing Picture Names) | 1 | 27 | Std. Mean Difference (IV, Fixed, 95% CI) | ‐0.20 [‐0.96, 0.56] |
| 8 Expressive language: written copying | 2 | Mean Difference (IV, Fixed, 95% CI) | Subtotals only | |
| 8.1 PICA Copying subtest | 2 | 55 | Mean Difference (IV, Fixed, 95% CI) | 3.88 [‐5.75, 13.50] |
| 9 Expressive language: repetition | 5 | 229 | Std. Mean Difference (IV, Fixed, 95% CI) | 0.12 [‐0.14, 0.38] |
| 9.1 WAB Repetition subtest | 2 | 55 | Std. Mean Difference (IV, Fixed, 95% CI) | 0.28 [‐0.27, 0.82] |
| 9.2 Norsk Grunntest for Afasi | 1 | 114 | Std. Mean Difference (IV, Fixed, 95% CI) | ‐0.04 [‐0.40, 0.33] |
| 9.3 AAT subtest | 1 | 12 | Std. Mean Difference (IV, Fixed, 95% CI) | 0.84 [‐0.36, 2.04] |
| 9.4 Repetition Accuracy (matched) | 1 | 48 | Std. Mean Difference (IV, Fixed, 95% CI) | 0.17 [‐0.40, 0.74] |
| 10 Expressive language: fluency | 1 | Mean Difference (IV, Fixed, 95% CI) | Totals not selected | |
| 10.1 Regensburg Word Fluency Test (Food) | 1 | Mean Difference (IV, Fixed, 95% CI) | 0.0 [0.0, 0.0] | |
| 10.2 Regensburg Word Fluency Test (Animals) | 1 | Mean Difference (IV, Fixed, 95% CI) | 0.0 [0.0, 0.0] | |
| 11 Severity of impairment: Aphasia Battery Score (+ PICA) | 11 | 593 | Std. Mean Difference (IV, Random, 95% CI) | 0.55 [‐0.14, 1.25] |
| 11.1 Aphasia Quotient (CRRCAE) | 2 | 84 | Std. Mean Difference (IV, Random, 95% CI) | 0.02 [‐0.43, 0.47] |
| 11.2 Porch Index of Communicative Ability | 4 | 165 | Std. Mean Difference (IV, Random, 95% CI) | 0.26 [‐0.07, 0.58] |
| 11.3 BDAE (Chinese) | 1 | 36 | Std. Mean Difference (IV, Random, 95% CI) | 0.52 [‐0.15, 1.18] |
| 11.4 Aphasia Battery of Chinese (ABC) | 2 | 56 | Std. Mean Difference (IV, Random, 95% CI) | 0.23 [‐0.34, 0.80] |
| 11.5 Norsk Grunntest for Afasi (Coefficient) | 1 | 114 | Std. Mean Difference (IV, Random, 95% CI) | 0.03 [‐0.34, 0.40] |
| 11.6 Chinese Aphasia Measurement | 1 | 138 | Std. Mean Difference (IV, Random, 95% CI) | 3.84 [3.25, 4.43] |
| 12 Mood: MAACL | 1 | Mean Difference (IV, Fixed, 95% CI) | Totals not selected | |
| 12.1 Anxiety Scale (MAACL) | 1 | Mean Difference (IV, Fixed, 95% CI) | 0.0 [0.0, 0.0] | |
| 12.2 Depression Scale (MAACL) | 1 | Mean Difference (IV, Fixed, 95% CI) | 0.0 [0.0, 0.0] | |
| 12.3 Hostility Scale (MAACL) | 1 | Mean Difference (IV, Fixed, 95% CI) | 0.0 [0.0, 0.0] | |
| 13 Economic outcomes | 1 | Std. Mean Difference (IV, Random, 95% CI) | Totals not selected | |
| 13.1 Costs per month (GBP) | 1 | Std. Mean Difference (IV, Random, 95% CI) | 0.0 [0.0, 0.0] | |
| 13.2 EQ‐5D | 1 | Std. Mean Difference (IV, Random, 95% CI) | 0.0 [0.0, 0.0] | |
| 13.3 EQ‐5D VAS | 1 | Std. Mean Difference (IV, Random, 95% CI) | 0.0 [0.0, 0.0] | |
| 14 Number of dropouts (any reason) | 13 | 921 | Odds Ratio (M‐H, Fixed, 95% CI) | 0.92 [0.66, 1.28] |
| 15 Adherence to allocated intervention | 4 | 248 | Odds Ratio (M‐H, Fixed, 95% CI) | 0.75 [0.30, 1.85] |
1.15. Analysis.
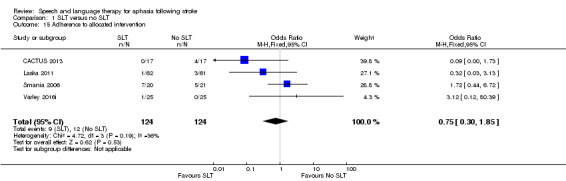
Comparison 1 SLT versus no SLT, Outcome 15 Adherence to allocated intervention.
Comparison 2. SLT versus no SLT (follow‐up data).
| Outcome or subgroup title | No. of studies | No. of participants | Statistical method | Effect size |
|---|---|---|---|---|
| 1 Functional communication | 2 | 111 | Std. Mean Difference (IV, Random, 95% CI) | 0.19 [‐0.80, 1.18] |
| 1.1 ANELT (6 month follow‐up) | 1 | 99 | Std. Mean Difference (IV, Random, 95% CI) | ‐0.18 [‐0.57, 0.22] |
| 1.2 AAT (spontaneous speech; 6 month follow‐up) | 1 | 12 | Std. Mean Difference (IV, Random, 95% CI) | 0.88 [‐0.33, 2.09] |
| 2 Receptive language: auditory comprehension | 2 | 111 | Mean Difference (IV, Fixed, 95% CI) | 1.38 [‐1.39, 4.15] |
| 2.1 Norsk Grunntest for Afasi (6 month follow‐up) | 1 | 99 | Mean Difference (IV, Fixed, 95% CI) | 0.12 [‐3.25, 3.49] |
| 2.2 AAT subtest (6 months follow‐up) | 1 | 12 | Mean Difference (IV, Fixed, 95% CI) | 4.0 [‐0.85, 8.85] |
| 3 Receptive language: reading comprehension | 1 | Mean Difference (IV, Fixed, 95% CI) | Totals not selected | |
| 3.1 AAT subtest (6 month follow‐up) | 1 | Mean Difference (IV, Fixed, 95% CI) | 0.0 [0.0, 0.0] | |
| 4 Expressive language: naming | 3 | 135 | Std. Mean Difference (IV, Random, 95% CI) | 0.07 [‐0.59, 0.73] |
| 4.1 Norsk Grunntest for Afasi (6 month follow‐up) | 1 | 99 | Std. Mean Difference (IV, Random, 95% CI) | ‐0.06 [‐0.45, 0.33] |
| 4.2 AAT subtest (6 month follow‐up) | 1 | 12 | Std. Mean Difference (IV, Random, 95% CI) | 1.21 [‐0.06, 2.49] |
| 4.3 Object and Action Naming Battery (treated; 3 month follow‐up) | 1 | 24 | Std. Mean Difference (IV, Random, 95% CI) | ‐0.39 [‐1.20, 0.42] |
| 5 Expressive language: written | 1 | Std. Mean Difference (IV, Fixed, 95% CI) | Totals not selected | |
| 5.1 AAT subtest (6 month follow‐up) | 1 | Std. Mean Difference (IV, Fixed, 95% CI) | 0.0 [0.0, 0.0] | |
| 6 Expressive language: repetition | 2 | 110 | Mean Difference (IV, Fixed, 95% CI) | ‐0.29 [‐2.62, 2.03] |
| 6.1 Norsk Grunntest for Afasi (6 month follow‐up) | 1 | 98 | Mean Difference (IV, Fixed, 95% CI) | ‐0.40 [‐2.73, 1.93] |
| 6.2 AAT subtest (6 month follow‐up) | 1 | 12 | Mean Difference (IV, Fixed, 95% CI) | 26.00 [‐10.49, 62.49] |
| 7 Severity of impairment: Aphasia Battery Score | 3 | 183 | Std. Mean Difference (IV, Random, 95% CI) | 0.37 [‐0.29, 1.04] |
| 7.1 Norsk Grunntest for Afasi (6 month follow‐up) | 1 | 99 | Std. Mean Difference (IV, Random, 95% CI) | ‐0.03 [‐0.42, 0.37] |
| 7.2 Aphasia Quotient (CRRCAE) 3 month follow‐up | 2 | 84 | Std. Mean Difference (IV, Random, 95% CI) | 0.62 [‐0.34, 1.58] |
| 8 Economic outcomes | 1 | Std. Mean Difference (IV, Fixed, 95% CI) | Totals not selected | |
| 8.1 EQ‐5D | 1 | Std. Mean Difference (IV, Fixed, 95% CI) | 0.0 [0.0, 0.0] | |
| 8.2 EQ‐5D VAS | 1 | Std. Mean Difference (IV, Fixed, 95% CI) | 0.0 [0.0, 0.0] | |
| 9 Number of dropouts (any reason) | 6 | 322 | Odds Ratio (M‐H, Fixed, 95% CI) | 0.73 [0.38, 1.39] |
Comparison 3. SLT versus social support and stimulation.
| Outcome or subgroup title | No. of studies | No. of participants | Statistical method | Effect size |
|---|---|---|---|---|
| 1 Functional communication | 4 | Std. Mean Difference (IV, Random, 95% CI) | Subtotals only | |
| 1.1 Functional Communication Profile | 1 | 96 | Std. Mean Difference (IV, Random, 95% CI) | ‐0.10 [‐0.50, 0.30] |
| 1.2 TOMs | 1 | 136 | Std. Mean Difference (IV, Random, 95% CI) | 0.13 [‐0.20, 0.47] |
| 1.3 Discourse conversation: content words per turn | 2 | 15 | Std. Mean Difference (IV, Random, 95% CI) | ‐0.14 [‐1.22, 0.94] |
| 2 Receptive language: auditory comprehension | 2 | Mean Difference (IV, Fixed, 95% CI) | Totals not selected | |
| 2.1 PCB (sentence comprehension) | 1 | Mean Difference (IV, Fixed, 95% CI) | 0.0 [0.0, 0.0] | |
| 2.2 PCB (picture comprehension) | 1 | Mean Difference (IV, Fixed, 95% CI) | 0.0 [0.0, 0.0] | |
| 2.3 Token Test | 1 | Mean Difference (IV, Fixed, 95% CI) | 0.0 [0.0, 0.0] | |
| 3 Receptive language: other | 1 | Mean Difference (IV, Fixed, 95% CI) | Totals not selected | |
| 3.1 PICA gestural subtest | 1 | Mean Difference (IV, Fixed, 95% CI) | 0.0 [0.0, 0.0] | |
| 4 Expressive language:naming | 3 | 33 | Std. Mean Difference (IV, Random, 95% CI) | 1.24 [‐1.70, 4.18] |
| 4.1 Object Naming Test (ONT) | 1 | 18 | Std. Mean Difference (IV, Random, 95% CI) | ‐1.18 [‐2.25, ‐0.11] |
| 4.2 Spoken Picture Naming test | 2 | 15 | Std. Mean Difference (IV, Random, 95% CI) | 2.63 [‐0.11, 5.36] |
| 5 Expressive language: sentences | 1 | Mean Difference (IV, Fixed, 95% CI) | Totals not selected | |
| 5.1 Caplan & Hanna Test: total | 1 | Mean Difference (IV, Fixed, 95% CI) | 0.0 [0.0, 0.0] | |
| 5.2 Caplan & Hanna Test: treated | 1 | Mean Difference (IV, Fixed, 95% CI) | 0.0 [0.0, 0.0] | |
| 5.3 Caplan & Hanna Test: untreated | 1 | Mean Difference (IV, Fixed, 95% CI) | 0.0 [0.0, 0.0] | |
| 6 Expressive language: picture description | 2 | Std. Mean Difference (IV, Fixed, 95% CI) | Subtotals only | |
| 6.1 Picture description | 2 | 23 | Std. Mean Difference (IV, Fixed, 95% CI) | 0.26 [‐0.62, 1.15] |
| 6.2 Picture description with structure modelling: treated items | 1 | 5 | Std. Mean Difference (IV, Fixed, 95% CI) | 0.45 [‐1.44, 2.33] |
| 6.3 Picture description with structure modelling: untreated items | 1 | 5 | Std. Mean Difference (IV, Fixed, 95% CI) | 0.41 [‐1.46, 2.28] |
| 7 Expressive language: overall spoken | 1 | Mean Difference (IV, Fixed, 95% CI) | Totals not selected | |
| 7.1 PICA verbal subtest | 1 | Mean Difference (IV, Fixed, 95% CI) | 0.0 [0.0, 0.0] | |
| 8 Expressive language: written | 1 | Mean Difference (IV, Fixed, 95% CI) | Totals not selected | |
| 8.1 PICA graphic subtests | 1 | Mean Difference (IV, Fixed, 95% CI) | 0.0 [0.0, 0.0] | |
| 9 Expressive language: fluency | 1 | Std. Mean Difference (IV, Random, 95% CI) | Totals not selected | |
| 9.1 Word fluency | 1 | Std. Mean Difference (IV, Random, 95% CI) | 0.0 [0.0, 0.0] | |
| 10 Severity of impairment: Aphasia Battery Score | 1 | Mean Difference (IV, Fixed, 95% CI) | Totals not selected | |
| 10.1 PICA | 1 | Mean Difference (IV, Fixed, 95% CI) | 0.0 [0.0, 0.0] | |
| 11 Psychosocial impact | 1 | Std. Mean Difference (IV, Fixed, 95% CI) | Totals not selected | |
| 11.1 COAST | 1 | Std. Mean Difference (IV, Fixed, 95% CI) | 0.0 [0.0, 0.0] | |
| 11.2 Carer COAST | 1 | Std. Mean Difference (IV, Fixed, 95% CI) | 0.0 [0.0, 0.0] | |
| 12 Number of dropouts for any reason | 5 | 413 | Odds Ratio (M‐H, Fixed, 95% CI) | 0.51 [0.32, 0.81] |
| 13 Adherence to allocated intervention | 5 | 409 | Odds Ratio (M‐H, Fixed, 95% CI) | 0.18 [0.09, 0.37] |
| 14 Economic outcomes | 1 | Mean Difference (IV, Fixed, 95% CI) | Totals not selected | |
| 14.1 Cost data | 1 | Mean Difference (IV, Fixed, 95% CI) | 0.0 [0.0, 0.0] | |
| 14.2 Utility data | 1 | Mean Difference (IV, Fixed, 95% CI) | 0.0 [0.0, 0.0] |
Comparison 4. High‐ versus low‐intensity SLT.
| Outcome or subgroup title | No. of studies | No. of participants | Statistical method | Effect size |
|---|---|---|---|---|
| 1 Functional communication | 2 | 84 | Mean Difference (IV, Random, 95% CI) | 11.75 [4.09, 19.40] |
| 1.1 Functional Communication Profile | 2 | 84 | Mean Difference (IV, Random, 95% CI) | 11.75 [4.09, 19.40] |
| 2 Receptive language: auditory comprehension | 2 | 42 | Std. Mean Difference (IV, Random, 95% CI) | 0.61 [‐0.81, 2.03] |
| 2.1 Token Test | 2 | 42 | Std. Mean Difference (IV, Random, 95% CI) | 0.61 [‐0.81, 2.03] |
| 3 Receptive language: reading comprehension | 1 | Mean Difference (IV, Fixed, 95% CI) | Totals not selected | |
| 3.1 AAT (Portuguese version) | 1 | Mean Difference (IV, Fixed, 95% CI) | 0.0 [0.0, 0.0] | |
| 4 Expressive language: naming | 2 | 42 | Std. Mean Difference (IV, Random, 95% CI) | 0.23 [‐0.38, 0.84] |
| 4.1 AAT naming subtest | 1 | 17 | Std. Mean Difference (IV, Random, 95% CI) | 0.34 [‐0.64, 1.31] |
| 4.2 Lisbon Aphasia Assessment Battery | 1 | 25 | Std. Mean Difference (IV, Random, 95% CI) | 0.16 [‐0.62, 0.95] |
| 5 Expressive language: written | 1 | Mean Difference (IV, Fixed, 95% CI) | Totals not selected | |
| 5.1 AAT (Portuguese version) (writing to dictation) | 1 | Mean Difference (IV, Fixed, 95% CI) | 0.0 [0.0, 0.0] | |
| 6 Expressive language: repetition | 2 | 42 | Std. Mean Difference (IV, Random, 95% CI) | ‐0.05 [‐0.66, 0.56] |
| 6.1 AAT repetition subtest | 1 | 17 | Std. Mean Difference (IV, Random, 95% CI) | ‐0.10 [‐1.07, 0.87] |
| 6.2 Lisbon Aphasia Assessment Battery | 1 | 25 | Std. Mean Difference (IV, Random, 95% CI) | ‐0.02 [‐0.80, 0.77] |
| 7 Expressive language: fluency | 1 | Mean Difference (IV, Fixed, 95% CI) | Totals not selected | |
| 7.1 Lisbon Aphasia Assessment Battery | 1 | Mean Difference (IV, Fixed, 95% CI) | 0.0 [0.0, 0.0] | |
| 8 Severity of impairment: Aphasia Battery Score | 5 | 187 | Std. Mean Difference (IV, Random, 95% CI) | 0.38 [0.07, 0.69] |
| 8.1 Aphasia Quotient (WAB) | 3 | 145 | Std. Mean Difference (IV, Random, 95% CI) | 0.35 [‐0.16, 0.85] |
| 8.2 AAT overall | 1 | 17 | Std. Mean Difference (IV, Random, 95% CI) | 0.23 [‐0.74, 1.20] |
| 8.3 Boston Diagnostic Aphasia Examination (10 weeks) | 1 | 25 | Std. Mean Difference (IV, Random, 95% CI) | 0.59 [‐0.22, 1.39] |
| 9 Mood | 1 | Mean Difference (IV, Fixed, 95% CI) | Totals not selected | |
| 9.1 Stroke Aphasia Depression Questionnaire (10 weeks) | 1 | Mean Difference (IV, Fixed, 95% CI) | 0.0 [0.0, 0.0] | |
| 10 Number of dropouts for any reason | 4 | 216 | Odds Ratio (M‐H, Fixed, 95% CI) | 2.35 [1.20, 4.60] |
| 11 Adherence to allocated intervention | 3 | 196 | Odds Ratio (M‐H, Fixed, 95% CI) | 4.63 [0.96, 22.40] |
4.11. Analysis.
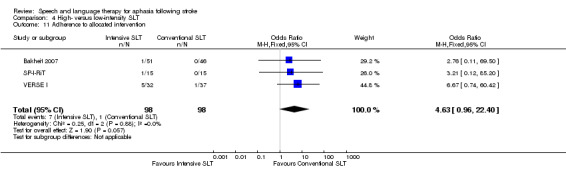
Comparison 4 High‐ versus low‐intensity SLT, Outcome 11 Adherence to allocated intervention.
Comparison 5. SLT versus social support and stimulation (follow‐up).
| Outcome or subgroup title | No. of studies | No. of participants | Statistical method | Effect size |
|---|---|---|---|---|
| 1 Functional communication | 3 | Std. Mean Difference (IV, Random, 95% CI) | Subtotals only | |
| 1.1 FCP (3 month follow‐up) | 1 | 73 | Std. Mean Difference (IV, Random, 95% CI) | 0.07 [‐0.39, 0.53] |
| 1.2 Discourse conversation (content words per turn; 6 week follow‐up) | 2 | 15 | Std. Mean Difference (IV, Random, 95% CI) | ‐0.02 [‐1.10, 1.06] |
| 2 Expressive language: single words (6 week follow‐up) | 2 | 15 | Std. Mean Difference (IV, Random, 95% CI) | 2.25 [0.18, 4.32] |
| 2.1 Spoken Picture Naming test | 2 | 15 | Std. Mean Difference (IV, Random, 95% CI) | 2.25 [0.18, 4.32] |
Comparison 6. High‐ versus low‐intensity SLT (follow‐up).
| Outcome or subgroup title | No. of studies | No. of participants | Statistical method | Effect size |
|---|---|---|---|---|
| 1 Functional communication | 2 | Std. Mean Difference (IV, Random, 95% CI) | Subtotals only | |
| 1.1 Functional Communication Profile (40 weeks) | 2 | 77 | Std. Mean Difference (IV, Random, 95% CI) | 0.53 [0.07, 0.99] |
| 1.2 Discourse Analysis (6 months) | 1 | 59 | Std. Mean Difference (IV, Random, 95% CI) | 0.20 [‐0.31, 0.71] |
| 1.3 Functional Communication Profile (12 months) | 1 | 14 | Std. Mean Difference (IV, Random, 95% CI) | 0.12 [‐0.94, 1.18] |
| 2 Receptive language | 1 | Std. Mean Difference (IV, Random, 95% CI) | Subtotals only | |
| 2.1 Lisbon Aphasia Assessment Battery: auditory comprehension (40 weeks) | 1 | 18 | Std. Mean Difference (IV, Random, 95% CI) | 1.03 [0.03, 2.03] |
| 2.2 Lisbon Aphasia Assessment Battery: auditory comprehension (12 months) | 1 | 14 | Std. Mean Difference (IV, Random, 95% CI) | 1.64 [0.37, 2.92] |
| 2.3 Token Test: auditory comprehension (40 weeks) | 1 | 18 | Std. Mean Difference (IV, Random, 95% CI) | 0.56 [‐0.39, 1.50] |
| 2.4 Token Test: auditory comprehension (12 months) | 1 | 14 | Std. Mean Difference (IV, Random, 95% CI) | 0.86 [‐0.27, 1.98] |
| 2.5 AAT (Portuguese version): reading comprehension (40 weeks) | 1 | 18 | Std. Mean Difference (IV, Random, 95% CI) | 0.04 [‐0.89, 0.96] |
| 2.6 AAT (Portuguese version): reading comprehension (12 months) | 1 | 14 | Std. Mean Difference (IV, Random, 95% CI) | 0.35 [‐0.72, 1.42] |
| 3 Expressive language | 1 | Std. Mean Difference (IV, Random, 95% CI) | Totals not selected | |
| 3.1 Naming (50 weeks) | 1 | Std. Mean Difference (IV, Random, 95% CI) | 0.0 [0.0, 0.0] | |
| 3.2 Naming (62 weeks) | 1 | Std. Mean Difference (IV, Random, 95% CI) | 0.0 [0.0, 0.0] | |
| 3.3 Writing to dictation (50 weeks) | 1 | Std. Mean Difference (IV, Random, 95% CI) | 0.0 [0.0, 0.0] | |
| 3.4 Writing to dictation (62 weeks) | 1 | Std. Mean Difference (IV, Random, 95% CI) | 0.0 [0.0, 0.0] | |
| 3.5 Repetition (50 weeks) | 1 | Std. Mean Difference (IV, Random, 95% CI) | 0.0 [0.0, 0.0] | |
| 3.6 Repetition (62 weeks) | 1 | Std. Mean Difference (IV, Random, 95% CI) | 0.0 [0.0, 0.0] | |
| 3.7 Fluency (50 weeks) | 1 | Std. Mean Difference (IV, Random, 95% CI) | 0.0 [0.0, 0.0] | |
| 3.8 Fluency (62 weeks) | 1 | Std. Mean Difference (IV, Random, 95% CI) | 0.0 [0.0, 0.0] | |
| 4 Severity of impairment: Aphasia Battery Score | 3 | 143 | Std. Mean Difference (IV, Random, 95% CI) | 0.37 [‐0.03, 0.77] |
| 4.1 Aphasia Quotient (WAB) | 2 | 125 | Std. Mean Difference (IV, Random, 95% CI) | 0.29 [‐0.16, 0.74] |
| 4.2 Boston Diagnostic Aphasia Examination (50 weeks) | 1 | 18 | Std. Mean Difference (IV, Random, 95% CI) | 0.83 [‐0.14, 1.81] |
| 5 Mood | 1 | Mean Difference (IV, Fixed, 95% CI) | Totals not selected | |
| 5.1 Stroke Aphasia Depression Questionnaire (40 weeks) | 1 | Mean Difference (IV, Fixed, 95% CI) | 0.0 [0.0, 0.0] | |
| 5.2 Stroke Aphasia Depression Questionnaire (12 months) | 1 | Mean Difference (IV, Fixed, 95% CI) | 0.0 [0.0, 0.0] | |
| 6 Number of dropouts for any reason | 4 | 216 | Odds Ratio (M‐H, Fixed, 95% CI) | 1.41 [0.59, 3.34] |
Comparison 7. High versus low dose SLT.
| Outcome or subgroup title | No. of studies | No. of participants | Statistical method | Effect size |
|---|---|---|---|---|
| 1 Functional communication | 1 | Std. Mean Difference (IV, Random, 95% CI) | Totals not selected | |
| 1.1 Functional Communication Profile | 1 | Std. Mean Difference (IV, Random, 95% CI) | 0.0 [0.0, 0.0] | |
| 1.2 Discourse Analysis | 1 | Std. Mean Difference (IV, Random, 95% CI) | 0.0 [0.0, 0.0] | |
| 2 Receptive language: auditory comprehension (change from baseline) | 1 | Std. Mean Difference (IV, Random, 95% CI) | Totals not selected | |
| 2.1 AAT comprehension subtest | 1 | Std. Mean Difference (IV, Random, 95% CI) | 0.0 [0.0, 0.0] | |
| 2.2 Token Test | 1 | Std. Mean Difference (IV, Random, 95% CI) | 0.0 [0.0, 0.0] | |
| 3 Expressive language: spoken (change from baseline) | 1 | Std. Mean Difference (IV, Random, 95% CI) | Totals not selected | |
| 3.1 AAT naming subtest | 1 | Std. Mean Difference (IV, Random, 95% CI) | 0.0 [0.0, 0.0] | |
| 3.2 AAT repetition subtest | 1 | Std. Mean Difference (IV, Random, 95% CI) | 0.0 [0.0, 0.0] | |
| 4 Expressive language: written (change from baseline) | 1 | Mean Difference (IV, Fixed, 95% CI) | Totals not selected | |
| 4.1 AAT written subtest | 1 | Mean Difference (IV, Fixed, 95% CI) | 0.0 [0.0, 0.0] | |
| 5 Severity of impairment: Aphasia Battery Score | 3 | 145 | Std. Mean Difference (IV, Random, 95% CI) | 0.35 [‐0.16, 0.85] |
| 5.1 Aphasia Quotient (WAB) | 3 | 145 | Std. Mean Difference (IV, Random, 95% CI) | 0.35 [‐0.16, 0.85] |
| 6 Number of dropouts for any reason | 3 | 186 | Odds Ratio (M‐H, Fixed, 95% CI) | 2.01 [1.07, 3.79] |
| 7 Adherence to allocated intervention | 2 | 166 | Odds Ratio (M‐H, Fixed, 95% CI) | 5.13 [0.84, 31.18] |
Comparison 8. High versus low dose SLT (follow‐up).
| Outcome or subgroup title | No. of studies | No. of participants | Statistical method | Effect size |
|---|---|---|---|---|
| 1 Functional communication | 1 | Std. Mean Difference (IV, Random, 95% CI) | Totals not selected | |
| 1.1 Functional Communication Profile (40 weeks) | 1 | Std. Mean Difference (IV, Random, 95% CI) | 0.0 [0.0, 0.0] | |
| 1.2 Discourse Analysis (6 months) | 1 | Std. Mean Difference (IV, Random, 95% CI) | 0.0 [0.0, 0.0] | |
| 2 Severity of impairment: Aphasia Battery Score | 2 | 125 | Std. Mean Difference (IV, Random, 95% CI) | 0.29 [‐0.16, 0.74] |
| 2.1 Aphasia Quotient (WAB) | 2 | 125 | Std. Mean Difference (IV, Random, 95% CI) | 0.29 [‐0.16, 0.74] |
| 3 Number of dropouts for any reason | 3 | 186 | Odds Ratio (M‐H, Fixed, 95% CI) | 2.96 [1.36, 6.43] |
Comparison 9. Early versus delayed SLT.
| Outcome or subgroup title | No. of studies | No. of participants | Statistical method | Effect size |
|---|---|---|---|---|
| 1 Functional communication | 1 | Std. Mean Difference (IV, Fixed, 95% CI) | Totals not selected | |
| 1.1 ANELT | 1 | Std. Mean Difference (IV, Fixed, 95% CI) | 0.0 [0.0, 0.0] | |
| 1.2 ANELT (4 weeks) | 1 | Std. Mean Difference (IV, Fixed, 95% CI) | 0.0 [0.0, 0.0] | |
| 1.3 CETI | 1 | Std. Mean Difference (IV, Fixed, 95% CI) | 0.0 [0.0, 0.0] | |
| 2 Receptive language: auditory comprehension | 1 | Mean Difference (IV, Fixed, 95% CI) | Totals not selected | |
| 2.1 Token Test | 1 | Mean Difference (IV, Fixed, 95% CI) | 0.0 [0.0, 0.0] | |
| 3 Expressive language: naming | 2 | 65 | Std. Mean Difference (IV, Random, 95% CI) | ‐0.19 [‐0.96, 0.58] |
| 3.1 AAT subtest | 1 | 18 | Std. Mean Difference (IV, Random, 95% CI) | ‐0.69 [‐1.65, 0.27] |
| 3.2 Naming accuracy (matched) | 1 | 47 | Std. Mean Difference (IV, Random, 95% CI) | 0.12 [‐0.45, 0.70] |
| 4 Expressive language: written | 1 | Mean Difference (IV, Fixed, 95% CI) | Totals not selected | |
| 4.1 AAT subtest | 1 | Mean Difference (IV, Fixed, 95% CI) | 0.0 [0.0, 0.0] | |
| 5 Expressive language: repetition | 2 | 65 | Std. Mean Difference (IV, Fixed, 95% CI) | ‐0.17 [‐0.65, 0.32] |
| 5.1 AAT subtest | 1 | 18 | Std. Mean Difference (IV, Fixed, 95% CI) | ‐0.49 [‐1.43, 0.45] |
| 5.2 Repetition accuracy (matched) | 1 | 47 | Std. Mean Difference (IV, Fixed, 95% CI) | ‐0.05 [‐0.62, 0.53] |
| 6 Expressive language: fluency | 1 | Mean Difference (IV, Fixed, 95% CI) | Totals not selected | |
| 6.1 Word fluency (food) | 1 | Mean Difference (IV, Fixed, 95% CI) | 0.0 [0.0, 0.0] | |
| 6.2 Word fluency (animals) | 1 | Mean Difference (IV, Fixed, 95% CI) | 0.0 [0.0, 0.0] | |
| 6.3 Word fluency (food; 1 month) | 1 | Mean Difference (IV, Fixed, 95% CI) | 0.0 [0.0, 0.0] | |
| 6.4 Word fluency (animals; 1 month) | 1 | Mean Difference (IV, Fixed, 95% CI) | 0.0 [0.0, 0.0] | |
| 7 Severity of impairment | 1 | Mean Difference (IV, Fixed, 95% CI) | Totals not selected | |
| 7.1 AAT overall | 1 | Mean Difference (IV, Fixed, 95% CI) | 0.0 [0.0, 0.0] | |
| 8 Number of dropouts for any reason | 2 | 77 | Odds Ratio (M‐H, Random, 95% CI) | 2.09 [0.30, 14.35] |
9.4. Analysis.
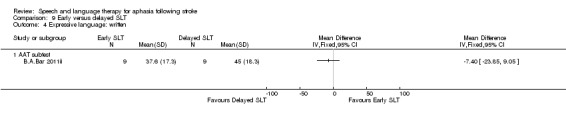
Comparison 9 Early versus delayed SLT, Outcome 4 Expressive language: written.
9.5. Analysis.
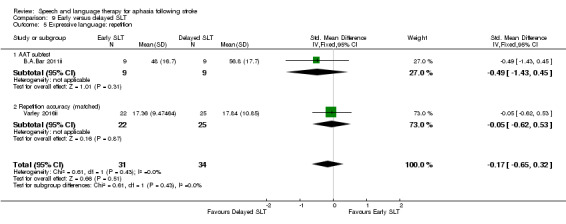
Comparison 9 Early versus delayed SLT, Outcome 5 Expressive language: repetition.
Comparison 10. Early versus delayed SLT (follow‐up).
| Outcome or subgroup title | No. of studies | No. of participants | Statistical method | Effect size |
|---|---|---|---|---|
| 1 Expressive language: naming | 1 | Mean Difference (IV, Fixed, 95% CI) | Totals not selected | |
| 1.1 Naming accuracy (treated) | 1 | Mean Difference (IV, Fixed, 95% CI) | 0.0 [0.0, 0.0] | |
| 1.2 Naming accuracy (matched) | 1 | Mean Difference (IV, Fixed, 95% CI) | 0.0 [0.0, 0.0] | |
| 1.3 Naming accuracy (control) | 1 | Mean Difference (IV, Fixed, 95% CI) | 0.0 [0.0, 0.0] | |
| 2 Expressive language: repetition | 1 | Mean Difference (IV, Fixed, 95% CI) | Totals not selected | |
| 2.1 Repetition accuracy (treated) | 1 | Mean Difference (IV, Fixed, 95% CI) | 0.0 [0.0, 0.0] | |
| 2.2 Repetition accuracy (matched) | 1 | Mean Difference (IV, Fixed, 95% CI) | 0.0 [0.0, 0.0] | |
| 2.3 Repetition accuracy (control) | 1 | Mean Difference (IV, Fixed, 95% CI) | 0.0 [0.0, 0.0] | |
| 3 Number of dropouts for any reason | 1 | Odds Ratio (M‐H, Fixed, 95% CI) | Totals not selected |
Comparison 11. SLT of short versus long duration.
| Outcome or subgroup title | No. of studies | No. of participants | Statistical method | Effect size |
|---|---|---|---|---|
| 1 Functional communication | 2 | 50 | Std. Mean Difference (IV, Random, 95% CI) | 0.81 [0.23, 1.40] |
| 1.1 Discourse (content information units per minute) | 1 | 25 | Std. Mean Difference (IV, Random, 95% CI) | 0.62 [‐0.19, 1.44] |
| 1.2 Functional Communication Profile | 1 | 25 | Std. Mean Difference (IV, Random, 95% CI) | 1.02 [0.18, 1.86] |
| 2 Functional communication (follow‐up) | 1 | Std. Mean Difference (IV, Random, 95% CI) | Totals not selected | |
| 2.1 Functional Communication Profile (50 weeks follow‐up) | 1 | Std. Mean Difference (IV, Random, 95% CI) | 0.0 [0.0, 0.0] | |
| 2.2 Functional Communication Profile (1 year follow‐up) | 1 | Std. Mean Difference (IV, Random, 95% CI) | 0.0 [0.0, 0.0] | |
| 3 Receptive language: auditory comprehension | 2 | 42 | Std. Mean Difference (IV, Random, 95% CI) | 0.81 [0.17, 1.45] |
| 3.1 AAT comprehension subtest | 1 | 17 | Std. Mean Difference (IV, Random, 95% CI) | 0.47 [‐0.51, 1.45] |
| 3.2 Lisbon Aphasia Assessment Battery (simple commands) | 1 | 25 | Std. Mean Difference (IV, Random, 95% CI) | 1.06 [0.21, 1.90] |
| 4 Receptive language: comprehension (50 week follow‐up) | 1 | Mean Difference (IV, Fixed, 95% CI) | Totals not selected | |
| 4.1 Lisbon Aphasia Assessment Battery (simple commands) | 1 | Mean Difference (IV, Fixed, 95% CI) | 0.0 [0.0, 0.0] | |
| 4.2 Token Test | 1 | Mean Difference (IV, Fixed, 95% CI) | 0.0 [0.0, 0.0] | |
| 4.3 AAT (Portuguese version) Reading comprehension | 1 | Mean Difference (IV, Fixed, 95% CI) | 0.0 [0.0, 0.0] | |
| 5 Receptive language: comprehension (62 week follow‐up) | 1 | Mean Difference (IV, Fixed, 95% CI) | Totals not selected | |
| 5.1 Lisbon Aphasia Assessment Battery (simple commands) | 1 | Mean Difference (IV, Fixed, 95% CI) | 0.0 [0.0, 0.0] | |
| 5.2 Token Test | 1 | Mean Difference (IV, Fixed, 95% CI) | 0.0 [0.0, 0.0] | |
| 5.3 AAT (Portuguese version): reading comprehension | 1 | Mean Difference (IV, Fixed, 95% CI) | 0.0 [0.0, 0.0] | |
| 6 Receptive language: reading comprehension | 3 | 64 | Std. Mean Difference (IV, Random, 95% CI) | 0.18 [‐0.32, 0.67] |
| 6.1 WAB (reading comprehension) | 1 | 25 | Std. Mean Difference (IV, Random, 95% CI) | 0.15 [‐0.64, 0.94] |
| 6.2 AAT (Portuguese version) | 1 | 25 | Std. Mean Difference (IV, Random, 95% CI) | 0.28 [‐0.51, 1.06] |
| 6.3 Unknown | 1 | 14 | Std. Mean Difference (IV, Random, 95% CI) | 0.06 [‐0.99, 1.10] |
| 7 Expressive language: naming | 3 | 56 | Std. Mean Difference (IV, Fixed, 95% CI) | 0.23 [‐0.30, 0.76] |
| 7.1 AAT naming subtest | 1 | 17 | Std. Mean Difference (IV, Fixed, 95% CI) | 0.34 [‐0.64, 1.31] |
| 7.2 Lisbon Aphasia Assessment Battery | 1 | 25 | Std. Mean Difference (IV, Fixed, 95% CI) | 0.16 [‐0.62, 0.95] |
| 7.3 Thorndike‐Lorge Word List | 1 | 14 | Std. Mean Difference (IV, Fixed, 95% CI) | 0.23 [‐0.83, 1.28] |
| 8 Expressive language: written | 2 | 50 | Std. Mean Difference (IV, Random, 95% CI) | ‐0.01 [‐0.56, 0.55] |
| 8.1 WAB (writing) | 1 | 25 | Std. Mean Difference (IV, Random, 95% CI) | 0.16 [‐0.64, 0.95] |
| 8.2 AAT (Portuguese version) (writing to dictation) | 1 | 25 | Std. Mean Difference (IV, Random, 95% CI) | ‐0.16 [‐0.95, 0.62] |
| 9 Expressive language: repetition | 2 | 42 | Std. Mean Difference (IV, Random, 95% CI) | ‐0.05 [‐0.66, 0.56] |
| 9.1 AAT repetition subtest | 1 | 17 | Std. Mean Difference (IV, Random, 95% CI) | ‐0.10 [‐1.07, 0.87] |
| 9.2 Lisbon Aphasia Assessment Battery | 1 | 25 | Std. Mean Difference (IV, Random, 95% CI) | ‐0.02 [‐0.80, 0.77] |
| 10 Expressive language: fluency | 1 | Mean Difference (IV, Fixed, 95% CI) | Totals not selected | |
| 10.1 Lisbon Aphasia Assessment Battery | 1 | Mean Difference (IV, Fixed, 95% CI) | 0.0 [0.0, 0.0] | |
| 11 Expressive language: 50 and 62 weeks follow‐up | 1 | Mean Difference (IV, Fixed, 95% CI) | Totals not selected | |
| 11.1 Naming (50 weeks) | 1 | Mean Difference (IV, Fixed, 95% CI) | 0.0 [0.0, 0.0] | |
| 11.2 Repetition (50 weeks) | 1 | Mean Difference (IV, Fixed, 95% CI) | 0.0 [0.0, 0.0] | |
| 11.3 Fluency (50 weeks) | 1 | Mean Difference (IV, Fixed, 95% CI) | 0.0 [0.0, 0.0] | |
| 11.4 Writing to dictation (50 weeks) | 1 | Mean Difference (IV, Fixed, 95% CI) | 0.0 [0.0, 0.0] | |
| 11.5 Naming (62 weeks) | 1 | Mean Difference (IV, Fixed, 95% CI) | 0.0 [0.0, 0.0] | |
| 11.6 Repetition (62 weeks) | 1 | Mean Difference (IV, Fixed, 95% CI) | 0.0 [0.0, 0.0] | |
| 11.7 Fluency (62 weeks) | 1 | Mean Difference (IV, Fixed, 95% CI) | 0.0 [0.0, 0.0] | |
| 11.8 Writing to dictation (62 weeks) | 1 | Mean Difference (IV, Fixed, 95% CI) | 0.0 [0.0, 0.0] | |
| 12 Depression | 1 | Mean Difference (IV, Fixed, 95% CI) | Totals not selected | |
| 12.1 Stroke Aphasia Depression Questionnaire (10 weeks) | 1 | Mean Difference (IV, Fixed, 95% CI) | 0.0 [0.0, 0.0] | |
| 12.2 Stroke Aphasia Depression Questionnaire (50 weeks) | 1 | Mean Difference (IV, Fixed, 95% CI) | 0.0 [0.0, 0.0] | |
| 12.3 Stroke Aphasia Depression Questionnaire (62 weeks) | 1 | Mean Difference (IV, Fixed, 95% CI) | 0.0 [0.0, 0.0] | |
| 13 Severity of impairment: Aphasia Battery Score | 4 | 98 | Std. Mean Difference (IV, Random, 95% CI) | 0.22 [‐0.26, 0.71] |
| 13.1 WABAQ | 1 | 25 | Std. Mean Difference (IV, Random, 95% CI) | 0.57 [‐0.24, 1.38] |
| 13.2 PICA | 1 | 31 | Std. Mean Difference (IV, Random, 95% CI) | ‐0.38 [‐1.09, 0.33] |
| 13.3 AAT overall | 1 | 17 | Std. Mean Difference (IV, Random, 95% CI) | 0.23 [‐0.74, 1.20] |
| 13.4 Boston Diagnostic Aphasia Examination (10 weeks) | 1 | 25 | Std. Mean Difference (IV, Random, 95% CI) | 0.59 [‐0.22, 1.39] |
| 14 Severity of impairment: Aphasia Battery Score (follow‐up) | 1 | Std. Mean Difference (IV, Random, 95% CI) | Totals not selected | |
| 14.1 Boston Diagnostic Aphasia Examination (50 weeks) | 1 | Std. Mean Difference (IV, Random, 95% CI) | 0.0 [0.0, 0.0] | |
| 14.2 Boston Diagnostic Aphasia Examination (62 weeks) | 1 | Std. Mean Difference (IV, Random, 95% CI) | 0.0 [0.0, 0.0] | |
| 14.3 Aphasia Quotient (Lisbon Aphasia Assessment Battery) (50 weeks) | 1 | Std. Mean Difference (IV, Random, 95% CI) | 0.0 [0.0, 0.0] | |
| 14.4 Aphasia Quotient (Lisbon Aphasia Assessment Battery) (62 weeks) | 1 | Std. Mean Difference (IV, Random, 95% CI) | 0.0 [0.0, 0.0] | |
| 15 Number of dropouts for any reason | 1 | 31 | Odds Ratio (M‐H, Random, 95% CI) | 6.11 [0.27, 138.45] |
| 16 Adherence to allocated intervention | 1 | 31 | Odds Ratio (M‐H, Random, 95% CI) | 3.41 [0.13, 90.49] |
Comparison 12. Group versus one‐to‐one SLT.
| Outcome or subgroup title | No. of studies | No. of participants | Statistical method | Effect size |
|---|---|---|---|---|
| 1 Functional communication | 3 | 46 | Std. Mean Difference (IV, Random, 95% CI) | 0.41 [‐0.19, 1.00] |
| 1.1 Pragmatic Protocol | 1 | 20 | Std. Mean Difference (IV, Random, 95% CI) | 0.24 [‐0.64, 1.12] |
| 1.2 ANELT | 1 | 9 | Std. Mean Difference (IV, Random, 95% CI) | 1.08 [‐0.40, 2.55] |
| 1.3 Discourse Analysis (% content information units per min) | 1 | 17 | Std. Mean Difference (IV, Random, 95% CI) | 0.32 [‐0.64, 1.28] |
| 2 Receptive language: auditory comprehension | 3 | Std. Mean Difference (IV, Fixed, 95% CI) | Subtotals only | |
| 2.1 Token Test | 3 | 60 | Std. Mean Difference (IV, Fixed, 95% CI) | 0.18 [‐0.34, 0.69] |
| 2.2 AAT comprehension subtest | 2 | 26 | Std. Mean Difference (IV, Fixed, 95% CI) | ‐0.00 [‐0.82, 0.81] |
| 3 Receptive language: other | 1 | Mean Difference (IV, Fixed, 95% CI) | Totals not selected | |
| 3.1 PICA gestural subtest | 1 | Mean Difference (IV, Fixed, 95% CI) | 0.0 [0.0, 0.0] | |
| 4 Expressive language: naming | 2 | Std. Mean Difference (IV, Random, 95% CI) | Subtotals only | |
| 4.1 AAT naming subtest | 2 | 26 | Std. Mean Difference (IV, Random, 95% CI) | 0.36 [‐0.42, 1.15] |
| 5 Expressive language: general | 1 | Std. Mean Difference (IV, Fixed, 95% CI) | Totals not selected | |
| 5.1 PICA verbal subtest | 1 | Std. Mean Difference (IV, Fixed, 95% CI) | 0.0 [0.0, 0.0] | |
| 6 Expressive language: repetition | 2 | Std. Mean Difference (IV, Fixed, 95% CI) | Subtotals only | |
| 6.1 AAT repetition subtest | 2 | 26 | Std. Mean Difference (IV, Fixed, 95% CI) | 0.00 [‐0.78, 0.78] |
| 7 Expressive language: written | 2 | 43 | Std. Mean Difference (IV, Fixed, 95% CI) | ‐0.22 [‐0.82, 0.38] |
| 7.1 PICA graphic | 1 | 34 | Std. Mean Difference (IV, Fixed, 95% CI) | ‐0.27 [‐0.95, 0.41] |
| 7.2 AAT written language subtest | 1 | 9 | Std. Mean Difference (IV, Fixed, 95% CI) | ‐0.04 [‐1.35, 1.28] |
| 8 Quality of life | 1 | Mean Difference (IV, Fixed, 95% CI) | Totals not selected | |
| 8.1 SAQoL | 1 | Mean Difference (IV, Fixed, 95% CI) | 0.0 [0.0, 0.0] | |
| 9 Severity of impairment: Aphasia Battery Score | 4 | 122 | Std. Mean Difference (IV, Random, 95% CI) | 0.15 [‐0.21, 0.50] |
| 9.1 Aphasia Quotient CRRCAE | 1 | 54 | Std. Mean Difference (IV, Random, 95% CI) | 0.30 [‐0.24, 0.84] |
| 9.2 PICA overall | 1 | 34 | Std. Mean Difference (IV, Random, 95% CI) | ‐0.06 [‐0.73, 0.61] |
| 9.3 AAT overall | 1 | 17 | Std. Mean Difference (IV, Random, 95% CI) | 0.23 [‐0.74, 1.20] |
| 9.4 Aphasia Quotient (WAB) | 1 | 17 | Std. Mean Difference (IV, Random, 95% CI) | ‐0.00 [‐0.96, 0.95] |
| 10 Number of dropouts for any reason | 2 | 87 | Odds Ratio (M‐H, Random, 95% CI) | 1.35 [0.31, 5.84] |
Comparison 13. Group versus one‐to‐one SLT (follow‐up).
| Outcome or subgroup title | No. of studies | No. of participants | Statistical method | Effect size |
|---|---|---|---|---|
| 1 Functional communication | 1 | Mean Difference (IV, Random, 95% CI) | Totals not selected | |
| 1.1 Discourse Analysis (% content information units per min; 12 weeks) | 1 | Mean Difference (IV, Random, 95% CI) | 0.0 [0.0, 0.0] | |
| 1.2 Discourse Analysis (% content information units per min; 26 weeks) | 1 | Mean Difference (IV, Random, 95% CI) | 0.0 [0.0, 0.0] | |
| 2 Severity of impairment: Aphasia Battery Score | 2 | 70 | Std. Mean Difference (IV, Fixed, 95% CI) | 0.69 [0.19, 1.19] |
| 2.1 Aphasia Quotient CRRCAE (3‐month follow‐up) | 1 | 54 | Std. Mean Difference (IV, Fixed, 95% CI) | 1.04 [0.47, 1.62] |
| 2.2 Aphasia Quotient (WAB) (12 week follow‐up) | 1 | 16 | Std. Mean Difference (IV, Fixed, 95% CI) | ‐0.38 [‐1.37, 0.62] |
| 3 Quality of life | 1 | Mean Difference (IV, Fixed, 95% CI) | Totals not selected | |
| 3.1 SAQoL (12 weeks) | 1 | Mean Difference (IV, Fixed, 95% CI) | 0.0 [0.0, 0.0] | |
| 3.2 SAQoL (26 weeks) | 1 | Mean Difference (IV, Fixed, 95% CI) | 0.0 [0.0, 0.0] | |
| 4 Number of dropouts for any reason | 1 | 20 | Odds Ratio (M‐H, Random, 95% CI) | 2.0 [0.32, 12.51] |
Comparison 14. Volunteer‐facilitated versus professional SLT.
| Outcome or subgroup title | No. of studies | No. of participants | Statistical method | Effect size |
|---|---|---|---|---|
| 1 Functional communication | 1 | Std. Mean Difference (IV, Random, 95% CI) | Totals not selected | |
| 1.1 CADL | 1 | Std. Mean Difference (IV, Random, 95% CI) | 0.0 [0.0, 0.0] | |
| 1.2 Functional Communication Profile | 1 | Std. Mean Difference (IV, Random, 95% CI) | 0.0 [0.0, 0.0] | |
| 2 Receptive language: auditory comprehension | 2 | Std. Mean Difference (IV, Fixed, 95% CI) | Subtotals only | |
| 2.1 Token Test | 2 | 88 | Std. Mean Difference (IV, Fixed, 95% CI) | 0.06 [‐0.36, 0.47] |
| 2.2 AAT subtest | 1 | 20 | Std. Mean Difference (IV, Fixed, 95% CI) | ‐0.37 [‐1.25, 0.52] |
| 3 Receptive language: reading comprehension | 2 | 88 | Std. Mean Difference (IV, Random, 95% CI) | ‐0.07 [‐0.49, 0.35] |
| 3.1 Reading Comprehension Battery for Aphasia | 1 | 68 | Std. Mean Difference (IV, Random, 95% CI) | 0.02 [‐0.46, 0.49] |
| 3.2 AAT subtest | 1 | 20 | Std. Mean Difference (IV, Random, 95% CI) | ‐0.37 [‐1.25, 0.52] |
| 4 Receptive language: other | 1 | Mean Difference (IV, Fixed, 95% CI) | Totals not selected | |
| 4.1 PICA gestural subtest | 1 | Mean Difference (IV, Fixed, 95% CI) | 0.0 [0.0, 0.0] | |
| 5 Expressive language: spoken | 2 | Std. Mean Difference (IV, Random, 95% CI) | Totals not selected | |
| 5.1 AAT naming subtest | 1 | Std. Mean Difference (IV, Random, 95% CI) | 0.0 [0.0, 0.0] | |
| 5.2 PICA verbal subtest | 1 | Std. Mean Difference (IV, Random, 95% CI) | 0.0 [0.0, 0.0] | |
| 6 Expressive language: repetition | 1 | Mean Difference (IV, Fixed, 95% CI) | Totals not selected | |
| 6.1 AAT repetition subtest | 1 | Mean Difference (IV, Fixed, 95% CI) | 0.0 [0.0, 0.0] | |
| 7 Expressive language: written | 2 | Std. Mean Difference (IV, Fixed, 95% CI) | Totals not selected | |
| 7.1 AAT written language subtest | 1 | Std. Mean Difference (IV, Fixed, 95% CI) | 0.0 [0.0, 0.0] | |
| 7.2 PICA graphic subtests | 1 | Std. Mean Difference (IV, Fixed, 95% CI) | 0.0 [0.0, 0.0] | |
| 8 Severity of impairment: Aphasia Battery Score | 3 | 126 | Std. Mean Difference (IV, Fixed, 95% CI) | ‐0.12 [‐0.47, 0.23] |
| 8.1 PICA | 2 | 106 | Std. Mean Difference (IV, Fixed, 95% CI) | ‐0.06 [‐0.44, 0.32] |
| 8.2 AAT | 1 | 20 | Std. Mean Difference (IV, Fixed, 95% CI) | ‐0.45 [‐1.34, 0.44] |
| 9 Number of dropouts for any reason | 3 | 206 | Odds Ratio (M‐H, Random, 95% CI) | 0.95 [0.49, 1.85] |
| 10 Adherence to allocated intervention | 2 | 125 | Odds Ratio (M‐H, Random, 95% CI) | 1.98 [0.52, 7.46] |
Comparison 15. Computer‐mediated versus professional SLT.
| Outcome or subgroup title | No. of studies | No. of participants | Statistical method | Effect size |
|---|---|---|---|---|
| 1 Functional communication | 3 | 55 | Std. Mean Difference (IV, Fixed, 95% CI) | 0.44 [‐0.10, 0.98] |
| 1.1 Pragmatic Protocol | 1 | 20 | Std. Mean Difference (IV, Fixed, 95% CI) | 0.24 [‐0.64, 1.12] |
| 1.2 Discourse (content information units per minute) | 1 | 25 | Std. Mean Difference (IV, Fixed, 95% CI) | 0.62 [‐0.19, 1.44] |
| 1.3 Discourse conversation: content words per turn | 1 | 10 | Std. Mean Difference (IV, Fixed, 95% CI) | 0.40 [‐0.86, 1.66] |
| 2 Receptive language | 2 | Std. Mean Difference (IV, Fixed, 95% CI) | Totals not selected | |
| 2.1 WAB (reading comprehension) | 1 | Std. Mean Difference (IV, Fixed, 95% CI) | 0.0 [0.0, 0.0] | |
| 2.2 PICA gestural subtest | 1 | Std. Mean Difference (IV, Fixed, 95% CI) | 0.0 [0.0, 0.0] | |
| 2.3 Token Test (auditory comprehension) | 1 | Std. Mean Difference (IV, Fixed, 95% CI) | 0.0 [0.0, 0.0] | |
| 3 Expressive language | 2 | Std. Mean Difference (IV, Random, 95% CI) | Totals not selected | |
| 3.1 Spoken Picture Naming test (Total) | 1 | Std. Mean Difference (IV, Random, 95% CI) | 0.0 [0.0, 0.0] | |
| 3.2 Spoken Picture Naming test (Treated) | 1 | Std. Mean Difference (IV, Random, 95% CI) | 0.0 [0.0, 0.0] | |
| 3.3 Spoken Picture Naming test (Untreated) | 1 | Std. Mean Difference (IV, Random, 95% CI) | 0.0 [0.0, 0.0] | |
| 3.4 PICA verbal subtest | 1 | Std. Mean Difference (IV, Random, 95% CI) | 0.0 [0.0, 0.0] | |
| 4 Expressive language: written | 2 | 59 | Std. Mean Difference (IV, Random, 95% CI) | ‐0.09 [‐0.61, 0.42] |
| 4.1 WAB (writing) | 1 | 25 | Std. Mean Difference (IV, Random, 95% CI) | 0.16 [‐0.64, 0.95] |
| 4.2 PICA graphic | 1 | 34 | Std. Mean Difference (IV, Random, 95% CI) | ‐0.27 [‐0.95, 0.41] |
| 5 Severity of impairment | 2 | 59 | Std. Mean Difference (IV, Random, 95% CI) | 0.21 [‐0.40, 0.82] |
| 5.1 WABAQ | 1 | 25 | Std. Mean Difference (IV, Random, 95% CI) | 0.57 [‐0.24, 1.38] |
| 5.2 PICA overall | 1 | 34 | Std. Mean Difference (IV, Random, 95% CI) | ‐0.06 [‐0.73, 0.61] |
| 6 Number of dropouts for any reason | 1 | 67 | Odds Ratio (M‐H, Random, 95% CI) | 0.94 [0.36, 2.46] |
Comparison 16. Computer‐mediated versus professional SLT (follow‐up).
| Outcome or subgroup title | No. of studies | No. of participants | Statistical method | Effect size |
|---|---|---|---|---|
| 1 Functional communication (6 weeks) | 1 | Std. Mean Difference (IV, Fixed, 95% CI) | Totals not selected | |
| 1.1 Discourse conversation: substantive turns | 1 | Std. Mean Difference (IV, Fixed, 95% CI) | 0.0 [0.0, 0.0] | |
| 1.2 Discourse conversation: content words per turn | 1 | Std. Mean Difference (IV, Fixed, 95% CI) | 0.0 [0.0, 0.0] | |
| 1.3 Discourse conversation: nouns per turn | 1 | Std. Mean Difference (IV, Fixed, 95% CI) | 0.0 [0.0, 0.0] | |
| 2 Expressive language: naming (6 weeks) | 1 | Mean Difference (IV, Fixed, 95% CI) | Totals not selected | |
| 2.1 Spoken Picture Naming test (total) | 1 | Mean Difference (IV, Fixed, 95% CI) | 0.0 [0.0, 0.0] | |
| 2.2 Spoken Picture Naming test (treated) | 1 | Mean Difference (IV, Fixed, 95% CI) | 0.0 [0.0, 0.0] | |
| 2.3 Spoken Picture Naming test (untreated) | 1 | Mean Difference (IV, Fixed, 95% CI) | 0.0 [0.0, 0.0] |
Comparison 17. Semantic SLT versus other SLT.
| Outcome or subgroup title | No. of studies | No. of participants | Statistical method | Effect size |
|---|---|---|---|---|
| 1 Functional communication | 3 | 142 | Std. Mean Difference (IV, Random, 95% CI) | 0.02 [‐0.37, 0.40] |
| 1.1 ANELT | 3 | 142 | Std. Mean Difference (IV, Random, 95% CI) | 0.02 [‐0.37, 0.40] |
| 2 Receptive language: auditory comprehension | 2 | Std. Mean Difference (IV, Random, 95% CI) | Subtotals only | |
| 2.1 Token Test | 2 | 85 | Std. Mean Difference (IV, Random, 95% CI) | 0.07 [‐0.36, 0.50] |
| 2.2 AAT comprehension subtest | 1 | 9 | Std. Mean Difference (IV, Random, 95% CI) | 1.06 [‐0.41, 2.53] |
| 3 Receptive language: other | 3 | Std. Mean Difference (IV, Random, 95% CI) | Subtotals only | |
| 3.1 Semantic Association Test (verbal) | 3 | 120 | Std. Mean Difference (IV, Random, 95% CI) | 0.31 [‐0.05, 0.67] |
| 3.2 Semantic Association (PALPA) | 2 | 85 | Std. Mean Difference (IV, Random, 95% CI) | ‐0.09 [‐0.51, 0.34] |
| 3.3 Auditory Lexical Decision (PALPA) | 3 | 132 | Std. Mean Difference (IV, Random, 95% CI) | ‐0.37 [‐1.09, 0.34] |
| 3.4 Auditory Synonym Judgement | 1 | 9 | Std. Mean Difference (IV, Random, 95% CI) | 0.42 [‐0.92, 1.76] |
| 4 Expressive language: naming | 1 | Std. Mean Difference (IV, Random, 95% CI) | Totals not selected | |
| 4.1 AAT naming subtest | 1 | Std. Mean Difference (IV, Random, 95% CI) | 0.0 [0.0, 0.0] | |
| 4.2 Boston Naming Test | 1 | Std. Mean Difference (IV, Random, 95% CI) | 0.0 [0.0, 0.0] | |
| 5 Expressive language: written | 1 | Mean Difference (IV, Fixed, 95% CI) | Totals not selected | |
| 5.1 AAT subtest | 1 | Mean Difference (IV, Fixed, 95% CI) | 0.0 [0.0, 0.0] | |
| 6 Expressive language: repetition | 2 | Std. Mean Difference (IV, Random, 95% CI) | Subtotals only | |
| 6.1 Non‐word repetition (PALPA) | 2 | 85 | Std. Mean Difference (IV, Random, 95% CI) | 0.31 [‐0.12, 0.73] |
| 6.2 AAT repetition subtest | 1 | 9 | Std. Mean Difference (IV, Random, 95% CI) | 0.20 [‐1.12, 1.52] |
| 7 Expressive language: fluency | 1 | Std. Mean Difference (IV, Fixed, 95% CI) | Totals not selected | |
| 7.1 Word fluency (letters) | 1 | Std. Mean Difference (IV, Fixed, 95% CI) | 0.0 [0.0, 0.0] | |
| 7.2 Word fluency (semantic) | 1 | Std. Mean Difference (IV, Fixed, 95% CI) | 0.0 [0.0, 0.0] | |
| 8 Number of dropouts for any reason | 2 | 143 | Odds Ratio (M‐H, Fixed, 95% CI) | 0.83 [0.33, 2.09] |
| 9 Adherence to allocated intervention | 2 | 143 | Odds Ratio (M‐H, Fixed, 95% CI) | 1.05 [0.37, 2.97] |
Comparison 18. Constraint‐induced aphasia therapy versus other SLT.
| Outcome or subgroup title | No. of studies | No. of participants | Statistical method | Effect size |
|---|---|---|---|---|
| 1 Functional communication | 3 | 126 | Std. Mean Difference (IV, Random, 95% CI) | 0.15 [‐0.21, 0.50] |
| 1.1 AAT (spontaneous speech) | 1 | 100 | Std. Mean Difference (IV, Random, 95% CI) | 0.05 [‐0.34, 0.44] |
| 1.2 Discourse Analysis | 1 | 17 | Std. Mean Difference (IV, Random, 95% CI) | 0.32 [‐0.64, 1.28] |
| 1.3 ANELT | 1 | 9 | Std. Mean Difference (IV, Random, 95% CI) | 1.08 [‐0.40, 2.55] |
| 2 Receptive language: auditory comprehension | 3 | Std. Mean Difference (IV, Random, 95% CI) | Subtotals only | |
| 2.1 Token Test | 3 | 126 | Std. Mean Difference (IV, Random, 95% CI) | ‐0.04 [‐0.39, 0.31] |
| 2.2 AAT comprehension subtest | 3 | 126 | Std. Mean Difference (IV, Random, 95% CI) | ‐0.04 [‐0.61, 0.52] |
| 3 Receptive language: other | 1 | Std. Mean Difference (IV, Random, 95% CI) | Totals not selected | |
| 3.1 Semantic Association Test (Verbal) | 1 | Std. Mean Difference (IV, Random, 95% CI) | 0.0 [0.0, 0.0] | |
| 3.2 Semantic Association (PALPA) | 1 | Std. Mean Difference (IV, Random, 95% CI) | 0.0 [0.0, 0.0] | |
| 3.3 Auditory Lexical Decision: PALPA | 1 | Std. Mean Difference (IV, Random, 95% CI) | 0.0 [0.0, 0.0] | |
| 3.4 Auditory Synonym Judgement | 1 | Std. Mean Difference (IV, Random, 95% CI) | 0.0 [0.0, 0.0] | |
| 4 Expressive language: naming | 3 | Std. Mean Difference (IV, Random, 95% CI) | Subtotals only | |
| 4.1 AAT naming subtest | 3 | 126 | Std. Mean Difference (IV, Random, 95% CI) | 0.14 [‐0.22, 0.49] |
| 4.2 Boston Naming Test | 1 | 9 | Std. Mean Difference (IV, Random, 95% CI) | 0.0 [‐1.31, 1.31] |
| 5 Expressive language: repetition | 3 | Std. Mean Difference (IV, Random, 95% CI) | Subtotals only | |
| 5.1 AAT repetition subtest | 3 | 126 | Std. Mean Difference (IV, Random, 95% CI) | ‐0.02 [‐0.37, 0.33] |
| 5.2 Non‐words: PALPA | 1 | 9 | Std. Mean Difference (IV, Random, 95% CI) | 0.27 [‐1.06, 1.59] |
| 6 Expressive language: written | 2 | Mean Difference (IV, Random, 95% CI) | Subtotals only | |
| 6.1 AAT written language subtest | 2 | 109 | Mean Difference (IV, Random, 95% CI) | ‐1.96 [‐9.08, 5.16] |
| 7 Quality of life | 1 | Mean Difference (IV, Fixed, 95% CI) | Totals not selected | |
| 7.1 SAQoL | 1 | Mean Difference (IV, Fixed, 95% CI) | 0.0 [0.0, 0.0] | |
| 8 Severity of impairment | 2 | 34 | Std. Mean Difference (IV, Random, 95% CI) | 0.11 [‐0.57, 0.79] |
| 8.1 AAT overall | 1 | 17 | Std. Mean Difference (IV, Random, 95% CI) | 0.23 [‐0.74, 1.20] |
| 8.2 Aphasia Quotient (WAB) | 1 | 17 | Std. Mean Difference (IV, Random, 95% CI) | ‐0.00 [‐0.96, 0.95] |
Comparison 19. Constraint‐induced aphasia therapy versus other SLT (follow‐up).
| Outcome or subgroup title | No. of studies | No. of participants | Statistical method | Effect size |
|---|---|---|---|---|
| 1 Functional communication | 1 | Std. Mean Difference (IV, Random, 95% CI) | Totals not selected | |
| 1.1 Discourse Analysis score (12 weeks) | 1 | Std. Mean Difference (IV, Random, 95% CI) | 0.0 [0.0, 0.0] | |
| 1.2 Discourse Analysis score (26 weeks) | 1 | Std. Mean Difference (IV, Random, 95% CI) | 0.0 [0.0, 0.0] | |
| 2 Quality of life | 1 | Mean Difference (IV, Fixed, 95% CI) | Totals not selected | |
| 2.1 SAQoL (12 weeks) | 1 | Mean Difference (IV, Fixed, 95% CI) | 0.0 [0.0, 0.0] | |
| 2.2 SAQoL (26 weeks) | 1 | Mean Difference (IV, Fixed, 95% CI) | 0.0 [0.0, 0.0] | |
| 3 Severity of impairment | 1 | Mean Difference (IV, Random, 95% CI) | Totals not selected | |
| 3.1 Aphasia Quotient (WAB) (12 weeks) | 1 | Mean Difference (IV, Random, 95% CI) | 0.0 [0.0, 0.0] | |
| 3.2 Aphasia Quotient (WAB) (26 weeks) | 1 | Mean Difference (IV, Random, 95% CI) | 0.0 [0.0, 0.0] |
Comparison 20. SLT with gestural adjunct versus SLT.
| Outcome or subgroup title | No. of studies | No. of participants | Statistical method | Effect size |
|---|---|---|---|---|
| 1 Functional communication | 1 | Std. Mean Difference (IV, Random, 95% CI) | Totals not selected | |
| 1.1 Correct informational units (CIU) | 1 | Std. Mean Difference (IV, Random, 95% CI) | 0.0 [0.0, 0.0] | |
| 1.2 Utterances with new information (UIN) | 1 | Std. Mean Difference (IV, Random, 95% CI) | 0.0 [0.0, 0.0] | |
| 1.3 Grammatical sentences | 1 | Std. Mean Difference (IV, Random, 95% CI) | 0.0 [0.0, 0.0] | |
| 1.4 Propositions | 1 | Std. Mean Difference (IV, Random, 95% CI) | 0.0 [0.0, 0.0] | |
| 2 Expressive language | 1 | Std. Mean Difference (IV, Random, 95% CI) | Totals not selected | |
| 2.1 Picture‐naming probes | 1 | Std. Mean Difference (IV, Random, 95% CI) | 0.0 [0.0, 0.0] | |
| 2.2 Boston Naming Test | 1 | Std. Mean Difference (IV, Random, 95% CI) | 0.0 [0.0, 0.0] | |
| 2.3 Category Generation Probes | 1 | Std. Mean Difference (IV, Random, 95% CI) | 0.0 [0.0, 0.0] | |
| 3 Severity of impairment: Aphasia Battery Score | 1 | Mean Difference (IV, Fixed, 95% CI) | Totals not selected | |
| 3.1 WAB Aphasia Quotient | 1 | Mean Difference (IV, Fixed, 95% CI) | 0.0 [0.0, 0.0] | |
| 4 Functional communication (follow‐up) | 1 | Std. Mean Difference (IV, Fixed, 95% CI) | Totals not selected | |
| 4.1 Correct informational units (CIU) | 1 | Std. Mean Difference (IV, Fixed, 95% CI) | 0.0 [0.0, 0.0] | |
| 4.2 Utterances with new information (UIN) | 1 | Std. Mean Difference (IV, Fixed, 95% CI) | 0.0 [0.0, 0.0] | |
| 4.3 Grammatical sentences | 1 | Std. Mean Difference (IV, Fixed, 95% CI) | 0.0 [0.0, 0.0] | |
| 4.4 Propositions | 1 | Std. Mean Difference (IV, Fixed, 95% CI) | 0.0 [0.0, 0.0] | |
| 5 Expressive language: (follow‐up) | 1 | Std. Mean Difference (IV, Fixed, 95% CI) | Totals not selected | |
| 5.1 Picture‐naming probes (3 month follow‐up) | 1 | Std. Mean Difference (IV, Fixed, 95% CI) | 0.0 [0.0, 0.0] | |
| 5.2 Boston Naming Test (3 month follow‐up) | 1 | Std. Mean Difference (IV, Fixed, 95% CI) | 0.0 [0.0, 0.0] | |
| 5.3 Category Generation Probes (3 month follow‐up) | 1 | Std. Mean Difference (IV, Fixed, 95% CI) | 0.0 [0.0, 0.0] | |
| 6 Severity of impairment: Aphasia Battery Score (follow‐up) | 1 | Mean Difference (IV, Fixed, 95% CI) | Totals not selected | |
| 6.1 WAB Aphasia Quotient (3 month follow‐up) | 1 | Mean Difference (IV, Fixed, 95% CI) | 0.0 [0.0, 0.0] |
20.2. Analysis.
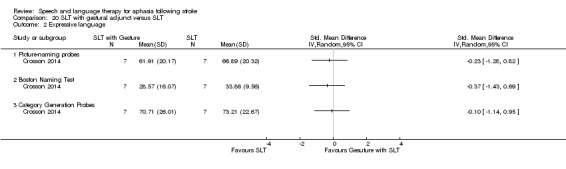
Comparison 20 SLT with gestural adjunct versus SLT, Outcome 2 Expressive language.
20.3. Analysis.
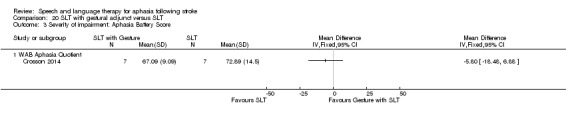
Comparison 20 SLT with gestural adjunct versus SLT, Outcome 3 Severity of impairment: Aphasia Battery Score.
20.4. Analysis.
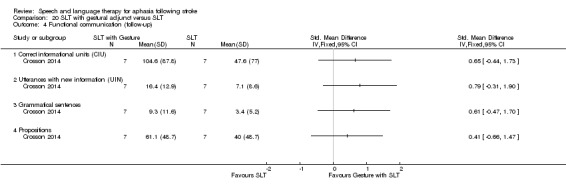
Comparison 20 SLT with gestural adjunct versus SLT, Outcome 4 Functional communication (follow‐up).
20.5. Analysis.
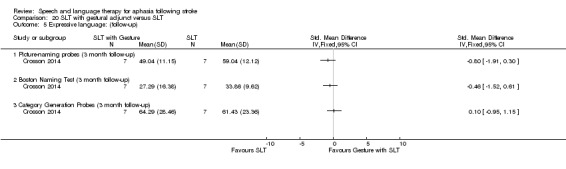
Comparison 20 SLT with gestural adjunct versus SLT, Outcome 5 Expressive language: (follow‐up).
Comparison 21. Melodic intonation therapy versus other SLT.
| Outcome or subgroup title | No. of studies | No. of participants | Statistical method | Effect size |
|---|---|---|---|---|
| 1 Functional communication | 1 | Std. Mean Difference (IV, Fixed, 95% CI) | Totals not selected | |
| 1.1 ANELT | 1 | Std. Mean Difference (IV, Fixed, 95% CI) | 0.0 [0.0, 0.0] | |
| 1.2 Content information units (Sabadel) narrative discourse | 1 | Std. Mean Difference (IV, Fixed, 95% CI) | 0.0 [0.0, 0.0] | |
| 2 Expressive language: naming | 1 | Mean Difference (IV, Fixed, 95% CI) | Totals not selected | |
| 2.1 AAT naming subtest | 1 | Mean Difference (IV, Fixed, 95% CI) | 0.0 [0.0, 0.0] | |
| 3 Expressive language: repetition | 1 | Std. Mean Difference (IV, Random, 95% CI) | Totals not selected | |
| 3.1 AAT repetition subtest | 1 | Std. Mean Difference (IV, Random, 95% CI) | 0.0 [0.0, 0.0] | |
| 3.2 MIT repetition (trained Items) | 1 | Std. Mean Difference (IV, Random, 95% CI) | 0.0 [0.0, 0.0] | |
| 3.3 MIT repetition (untrained items) | 1 | Std. Mean Difference (IV, Random, 95% CI) | 0.0 [0.0, 0.0] | |
| 4 Number of dropouts for any reason | 1 | Odds Ratio (M‐H, Random, 95% CI) | Totals not selected |
21.2. Analysis.
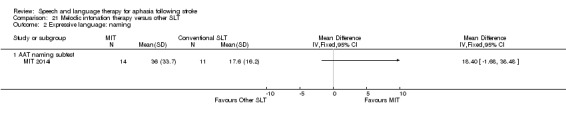
Comparison 21 Melodic intonation therapy versus other SLT, Outcome 2 Expressive language: naming.
21.3. Analysis.
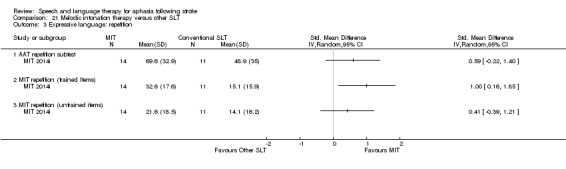
Comparison 21 Melodic intonation therapy versus other SLT, Outcome 3 Expressive language: repetition.
Comparison 22. Functional SLT versus conventional SLT.
| Outcome or subgroup title | No. of studies | No. of participants | Statistical method | Effect size |
|---|---|---|---|---|
| 1 Functional communication | 1 | Mean Difference (IV, Fixed, 95% CI) | Totals not selected | |
| 1.1 CETI | 1 | Mean Difference (IV, Fixed, 95% CI) | 0.0 [0.0, 0.0] |
Comparison 23. Operant training SLT versus conventional SLT.
| Outcome or subgroup title | No. of studies | No. of participants | Statistical method | Effect size |
|---|---|---|---|---|
| 1 Receptive language: auditory comprehension | 3 | Std. Mean Difference (IV, Fixed, 95% CI) | Subtotals only | |
| 1.1 Word comprehension (BDAE subtest) | 1 | 12 | Std. Mean Difference (IV, Fixed, 95% CI) | 0.13 [‐1.01, 1.26] |
| 1.2 Peabody PVT | 1 | 12 | Std. Mean Difference (IV, Fixed, 95% CI) | 0.13 [‐1.01, 1.26] |
| 1.3 Token Test | 3 | 36 | Std. Mean Difference (IV, Fixed, 95% CI) | 0.23 [‐0.43, 0.89] |
| 2 Receptive language: other | 3 | Mean Difference (IV, Fixed, 95% CI) | Subtotals only | |
| 2.1 PICA gestural subtest | 3 | 36 | Mean Difference (IV, Fixed, 95% CI) | ‐0.29 [‐0.97, 0.39] |
| 3 Expressive language: spoken | 3 | Std. Mean Difference (IV, Fixed, 95% CI) | Subtotals only | |
| 3.1 Naming | 3 | 36 | Std. Mean Difference (IV, Fixed, 95% CI) | ‐0.25 [‐0.92, 0.41] |
| 3.2 Word fluency | 2 | 24 | Std. Mean Difference (IV, Fixed, 95% CI) | ‐1.05 [‐1.93, ‐0.17] |
| 3.3 Picture description | 2 | 24 | Std. Mean Difference (IV, Fixed, 95% CI) | ‐0.20 [‐1.04, 0.64] |
| 3.4 PICA verbal subtest | 3 | 36 | Std. Mean Difference (IV, Fixed, 95% CI) | ‐0.31 [‐0.99, 0.37] |
| 4 Expressive language: written | 3 | Mean Difference (IV, Fixed, 95% CI) | Subtotals only | |
| 4.1 PICA graphic subtest | 3 | 36 | Mean Difference (IV, Fixed, 95% CI) | ‐0.85 [‐1.69, ‐0.01] |
| 5 Severity of impairment | 3 | Mean Difference (IV, Fixed, 95% CI) | Subtotals only | |
| 5.1 PICA overall | 3 | 36 | Mean Difference (IV, Fixed, 95% CI) | ‐0.74 [‐1.50, 0.01] |
23.2. Analysis.
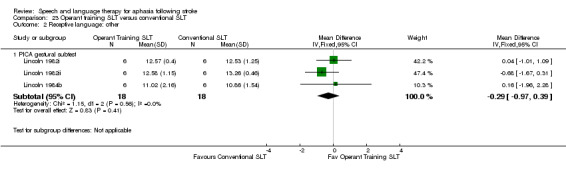
Comparison 23 Operant training SLT versus conventional SLT, Outcome 2 Receptive language: other.
23.3. Analysis.
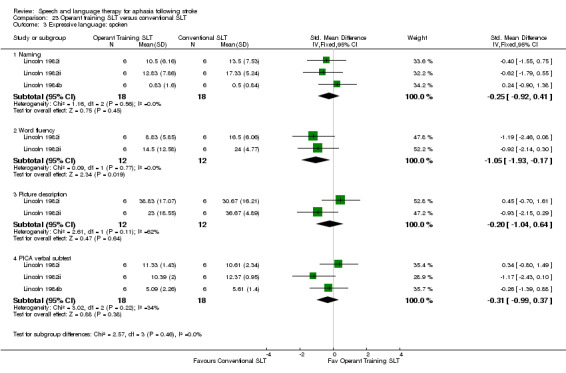
Comparison 23 Operant training SLT versus conventional SLT, Outcome 3 Expressive language: spoken.
23.4. Analysis.
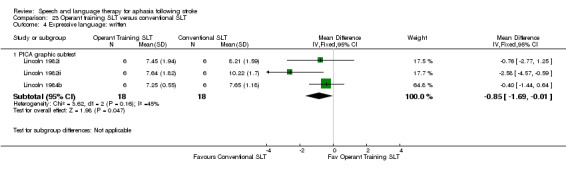
Comparison 23 Operant training SLT versus conventional SLT, Outcome 4 Expressive language: written.
Comparison 24. Verb comprehension SLT versus preposition comprehension SLT.
| Outcome or subgroup title | No. of studies | No. of participants | Statistical method | Effect size |
|---|---|---|---|---|
| 1 Receptive language: auditory comprehension | 1 | Mean Difference (IV, Fixed, 95% CI) | Totals not selected | |
| 1.1 WAB auditory comprehension | 1 | Mean Difference (IV, Fixed, 95% CI) | 0.0 [0.0, 0.0] | |
| 2 Receptive language: reading | 1 | Std. Mean Difference (IV, Fixed, 95% CI) | Totals not selected | |
| 2.1 Computer‐based verb Test (treated items) | 1 | Std. Mean Difference (IV, Fixed, 95% CI) | 0.0 [0.0, 0.0] | |
| 2.2 Computer‐based verb test (untreated items) | 1 | Std. Mean Difference (IV, Fixed, 95% CI) | 0.0 [0.0, 0.0] | |
| 2.3 Real World Verb Test (treated items) | 1 | Std. Mean Difference (IV, Fixed, 95% CI) | 0.0 [0.0, 0.0] | |
| 2.4 Real World Verb Test (untreated items) | 1 | Std. Mean Difference (IV, Fixed, 95% CI) | 0.0 [0.0, 0.0] | |
| 2.5 Computer‐based preposition test (treated items) | 1 | Std. Mean Difference (IV, Fixed, 95% CI) | 0.0 [0.0, 0.0] | |
| 2.6 Computer‐based preposition test (untreated items) | 1 | Std. Mean Difference (IV, Fixed, 95% CI) | 0.0 [0.0, 0.0] | |
| 2.7 Real World Preposition Test (treated items) | 1 | Std. Mean Difference (IV, Fixed, 95% CI) | 0.0 [0.0, 0.0] | |
| 2.8 Real World Preposition Test (untreated items) | 1 | Std. Mean Difference (IV, Fixed, 95% CI) | 0.0 [0.0, 0.0] | |
| 2.9 Morphology | 1 | Std. Mean Difference (IV, Fixed, 95% CI) | 0.0 [0.0, 0.0] | |
| 3 Expressive language | 1 | Std. Mean Difference (IV, Fixed, 95% CI) | Totals not selected | |
| 3.1 WAB naming subtest | 1 | Std. Mean Difference (IV, Fixed, 95% CI) | 0.0 [0.0, 0.0] | |
| 3.2 WAB fluency subtest | 1 | Std. Mean Difference (IV, Fixed, 95% CI) | 0.0 [0.0, 0.0] | |
| 3.3 WAB repetition subtest | 1 | Std. Mean Difference (IV, Fixed, 95% CI) | 0.0 [0.0, 0.0] | |
| 4 Severity of impairment: Aphasia Battery Score | 1 | Mean Difference (IV, Fixed, 95% CI) | Totals not selected | |
| 4.1 WABAQ | 1 | Mean Difference (IV, Fixed, 95% CI) | 0.0 [0.0, 0.0] |
24.2. Analysis.
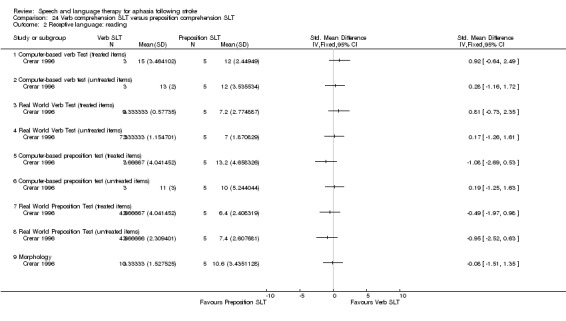
Comparison 24 Verb comprehension SLT versus preposition comprehension SLT, Outcome 2 Receptive language: reading.
24.3. Analysis.
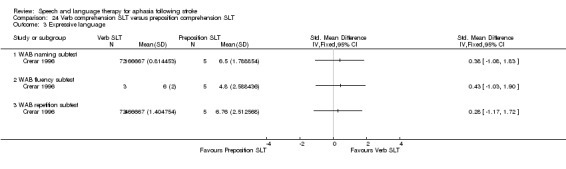
Comparison 24 Verb comprehension SLT versus preposition comprehension SLT, Outcome 3 Expressive language.
Comparison 25. Discourse therapy versus conventional therapy.
| Outcome or subgroup title | No. of studies | No. of participants | Statistical method | Effect size |
|---|---|---|---|---|
| 1 Functional communication | 1 | Mean Difference (IV, Fixed, 95% CI) | Totals not selected | |
| 1.1 Discourse (recount, procedural, exposition) number of utterances | 1 | Mean Difference (IV, Fixed, 95% CI) | 0.0 [0.0, 0.0] | |
| 2 Receptive language: word comprehension | 1 | Mean Difference (IV, Fixed, 95% CI) | Totals not selected | |
| 2.1 Northwestern Assessment of Verbs and Sentences | 1 | Mean Difference (IV, Fixed, 95% CI) | 0.0 [0.0, 0.0] | |
| 3 Expressive language: naming | 1 | Mean Difference (IV, Fixed, 95% CI) | Totals not selected | |
| 3.1 Object and Action Naming Battery (objects) | 1 | Mean Difference (IV, Fixed, 95% CI) | 0.0 [0.0, 0.0] |
25.2. Analysis.
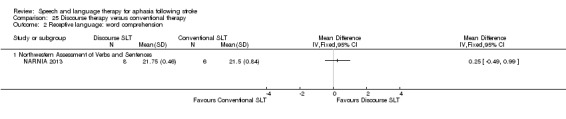
Comparison 25 Discourse therapy versus conventional therapy, Outcome 2 Receptive language: word comprehension.
Comparison 26. 'Task Specific' production versus conventional therapy.
| Outcome or subgroup title | No. of studies | No. of participants | Statistical method | Effect size |
|---|---|---|---|---|
| 1 Functional communication | 1 | Mean Difference (IV, Fixed, 95% CI) | Totals not selected | |
| 1.1 Functional expression | 1 | Mean Difference (IV, Fixed, 95% CI) | 0.0 [0.0, 0.0] | |
| 2 Expressive language: spoken sentence | 1 | Mean Difference (IV, Fixed, 95% CI) | Totals not selected | |
| 2.1 Sentence construction (AmAT) | 1 | Mean Difference (IV, Fixed, 95% CI) | 0.0 [0.0, 0.0] | |
| 2.2 Sentence construction (AmAT) 3‐week follow‐up | 1 | Mean Difference (IV, Fixed, 95% CI) | 0.0 [0.0, 0.0] | |
| 3 Expressive language: naming | 1 | Mean Difference (IV, Fixed, 95% CI) | Totals not selected | |
| 3.1 AmAT naming test | 1 | Mean Difference (IV, Fixed, 95% CI) | 0.0 [0.0, 0.0] | |
| 4 Expressive language: naming (follow‐up) | 1 | Mean Difference (IV, Fixed, 95% CI) | Totals not selected | |
| 4.1 AmAT Naming Test (3‐week follow‐up) | 1 | Mean Difference (IV, Fixed, 95% CI) | 0.0 [0.0, 0.0] | |
| 5 Expressive language: spoken sentence | 1 | Mean Difference (IV, Fixed, 95% CI) | Totals not selected | |
| 5.1 Sentence construction (AmAT) | 1 | Mean Difference (IV, Fixed, 95% CI) | 0.0 [0.0, 0.0] | |
| 5.2 Sentence construction (AmAT) 3‐week follow‐up | 1 | Mean Difference (IV, Fixed, 95% CI) | 0.0 [0.0, 0.0] | |
| 6 Expressive language: treated items | 1 | Std. Mean Difference (IV, Fixed, 95% CI) | Totals not selected | |
| 6.1 Naming (treated) | 1 | Std. Mean Difference (IV, Fixed, 95% CI) | 0.0 [0.0, 0.0] | |
| 6.2 Sentence construction (treated) | 1 | Std. Mean Difference (IV, Fixed, 95% CI) | 0.0 [0.0, 0.0] | |
| 6.3 Naming (treated: 3‐week follow‐up) | 1 | Std. Mean Difference (IV, Fixed, 95% CI) | 0.0 [0.0, 0.0] | |
| 6.4 Sentence construction (treated: 3‐week follow‐up) | 1 | Std. Mean Difference (IV, Fixed, 95% CI) | 0.0 [0.0, 0.0] |
26.2. Analysis.

Comparison 26 'Task Specific' production versus conventional therapy, Outcome 2 Expressive language: spoken sentence.
26.3. Analysis.
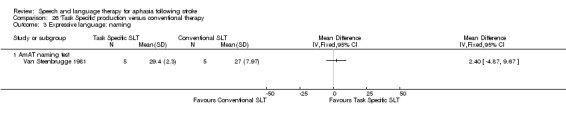
Comparison 26 'Task Specific' production versus conventional therapy, Outcome 3 Expressive language: naming.
26.4. Analysis.
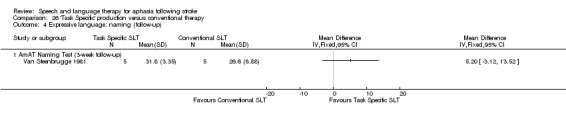
Comparison 26 'Task Specific' production versus conventional therapy, Outcome 4 Expressive language: naming (follow‐up).
26.5. Analysis.
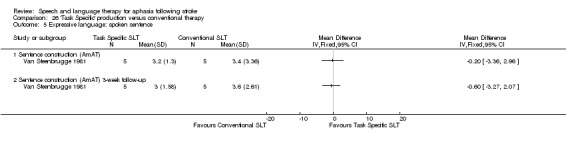
Comparison 26 'Task Specific' production versus conventional therapy, Outcome 5 Expressive language: spoken sentence.
Comparison 27. Language oriented therapy (LOT) versus conventional SLT.
| Outcome or subgroup title | No. of studies | No. of participants | Statistical method | Effect size |
|---|---|---|---|---|
| 1 Number of dropouts for any reason | 1 | Odds Ratio (M‐H, Random, 95% CI) | Totals not selected | |
| 2 Adherence to allocated intervention | 1 | Odds Ratio (M‐H, Fixed, 95% CI) | Totals not selected |
Comparison 28. Auditory comprehension SLT versus conventional SLT.
| Outcome or subgroup title | No. of studies | No. of participants | Statistical method | Effect size |
|---|---|---|---|---|
| 1 Functional communication | 1 | Mean Difference (IV, Fixed, 95% CI) | Totals not selected | |
| 1.1 Functional expression | 1 | Mean Difference (IV, Fixed, 95% CI) | 0.0 [0.0, 0.0] | |
| 2 Receptive language: word comprehension | 1 | Std. Mean Difference (IV, Fixed, 95% CI) | Totals not selected | |
| 2.1 Word comprehension (BDAE subtest) | 1 | Std. Mean Difference (IV, Fixed, 95% CI) | 0.0 [0.0, 0.0] | |
| 2.2 Identify body part (BDAE subtest) | 1 | Std. Mean Difference (IV, Fixed, 95% CI) | 0.0 [0.0, 0.0] | |
| 3 Receptive language: other auditory comprehension | 1 | Std. Mean Difference (IV, Fixed, 95% CI) | Totals not selected | |
| 3.1 Sentence comprehension | 1 | Std. Mean Difference (IV, Fixed, 95% CI) | 0.0 [0.0, 0.0] | |
| 3.2 Token Test | 1 | Std. Mean Difference (IV, Fixed, 95% CI) | 0.0 [0.0, 0.0] | |
| 4 Receptive language: auditory comprehension (treated items) | 1 | Std. Mean Difference (IV, Fixed, 95% CI) | Totals not selected | |
| 4.1 Word comprehension (phonology) | 1 | Std. Mean Difference (IV, Fixed, 95% CI) | 0.0 [0.0, 0.0] | |
| 4.2 Word comprehension (lexicon) | 1 | Std. Mean Difference (IV, Fixed, 95% CI) | 0.0 [0.0, 0.0] | |
| 4.3 Sentence comprehension (morphosyntax) | 1 | Std. Mean Difference (IV, Fixed, 95% CI) | 0.0 [0.0, 0.0] | |
| 5 Receptive language: reading comprehension | 1 | Mean Difference (IV, Random, 95% CI) | Totals not selected | |
| 5.1 Reading comprehension | 1 | Mean Difference (IV, Random, 95% CI) | 0.0 [0.0, 0.0] | |
| 6 Expressive language: naming | 1 | Mean Difference (IV, Fixed, 95% CI) | Totals not selected | |
| 6.1 AmAT naming test | 1 | Mean Difference (IV, Fixed, 95% CI) | 0.0 [0.0, 0.0] | |
| 7 Expressive language: spoken sentence | 1 | Mean Difference (IV, Fixed, 95% CI) | Totals not selected | |
| 7.1 Sentence construction (AmAT) | 1 | Mean Difference (IV, Fixed, 95% CI) | 0.0 [0.0, 0.0] |
28.2. Analysis.
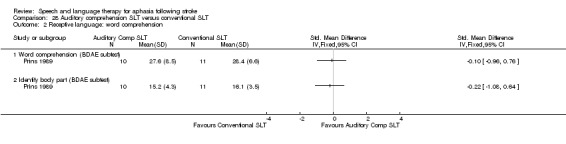
Comparison 28 Auditory comprehension SLT versus conventional SLT, Outcome 2 Receptive language: word comprehension.
28.3. Analysis.
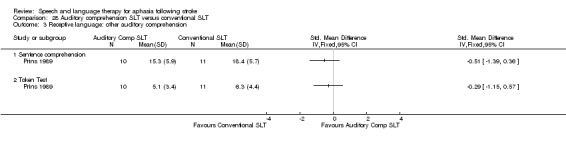
Comparison 28 Auditory comprehension SLT versus conventional SLT, Outcome 3 Receptive language: other auditory comprehension.
28.4. Analysis.
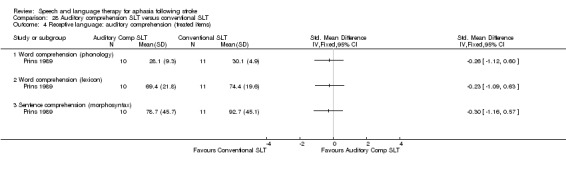
Comparison 28 Auditory comprehension SLT versus conventional SLT, Outcome 4 Receptive language: auditory comprehension (treated items).
28.5. Analysis.
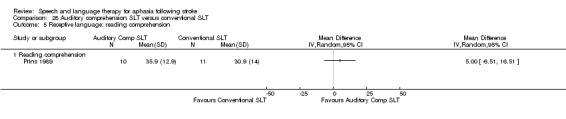
Comparison 28 Auditory comprehension SLT versus conventional SLT, Outcome 5 Receptive language: reading comprehension.
28.6. Analysis.
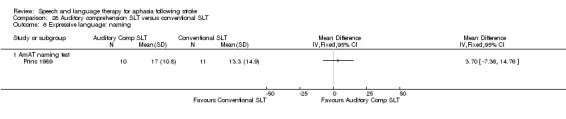
Comparison 28 Auditory comprehension SLT versus conventional SLT, Outcome 6 Expressive language: naming.
Comparison 29. FIlmed programme instruction versus conventional SLT.
| Outcome or subgroup title | No. of studies | No. of participants | Statistical method | Effect size |
|---|---|---|---|---|
| 1 Expressive language: naming | 1 | Mean Difference (IV, Fixed, 95% CI) | Totals not selected | |
| 1.1 Thorndike‐Lorge Word List | 1 | Mean Difference (IV, Fixed, 95% CI) | 0.0 [0.0, 0.0] | |
| 2 Receptive language: reading comprehension | 1 | Mean Difference (IV, Fixed, 95% CI) | Totals not selected | |
| 2.1 Reading comprehension | 1 | Mean Difference (IV, Fixed, 95% CI) | 0.0 [0.0, 0.0] |
29.2. Analysis.
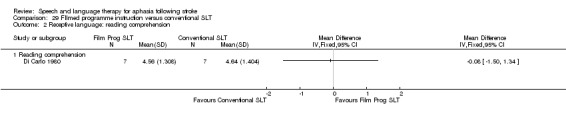
Comparison 29 FIlmed programme instruction versus conventional SLT, Outcome 2 Receptive language: reading comprehension.
Characteristics of studies
Characteristics of included studies [ordered by study ID]
ACTNoW 2011.
| Methods | Multicentre RCT stratified by severity of communication impairment and recruiting site, UK | |
| Participants | Inclusion criteria: communication impairment as a result of aphasia, therapist considers able to engage in therapy and likely to benefit, consent Exclusion criteria: subarachnoid haemorrhage, dementia, learning disabilities, non‐English speaker, serious comorbidity, unable to complete screening procedure within 3 attempts or 2 weeks, family or caregiver objection, therapist assessment required prior to trial screening Group 1: 76 participants Group 2: 77 participants Details of participants are shown in Table 6 |
|
| Interventions |
1. Conventional SLT Intervention: speech and language therapy. Materials: communication charts, personalised advice booklet, session record, patient life book, AAC devices. Procedures: manualised (assessment, information provision, provision of communication materials, caregiver contact, indirect contact (with MDT), direct contact). Direct remediation of speech and language: impairment (hypothesis‐driven approach to rehabilitation of language skills), activity (compensatory strategies and conversational skills training), and participation (specific exercises) approaches. Promotion of alternative means of communication, support adjustment to communication impairment, improving communication environment. Provided by: 4 therapists. Led by highly experienced speech and language therapists plus delivery by other therapists. Delivery: 1‐to‐1, face‐to‐face, clinic or home. Regimen: Per protocol. 3 sessions (varied length) weekly up to 16 weeks. Delivered average of 22 sessions (18 h) over 13 weeks. Tailoring: individualised. Modification: therapy amount. Adherence: monitored. 2. Social support and stimulation Intervention: 9 part‐time paid trained visitors. Attention control. Materials: approved board games and activities. Procedures: manualised. Participant‐led. Everyday activities building rapport including general conversation and activities (reading to the participant, watching television, playing board games (e.g. chess), creative activities, gardening) TV, music. Plus sessions to prepare participants for cessation of visits. Provided by: trained paid visitors. Delivery: 1‐to‐1, face‐to‐face, hospital and at home. Regimen: Per protocol up to 3 sessions (varied length up to 60 mins) weekly for 16 weeks. Delivered max 45 sessions (average 15 h; 1‐45 contacts, max 41 h) up to 16 weeks. Tailoring: yes. Individualised. Modification: amount of visits (above). Adherence: monitored |
|
| Outcomes | Primary outcomes: functional communication; expert blinded therapist rating of semi‐structured conversation using TOMs
Secondary outcomes: participant and caregivers' own perception of functional communication and quality of life, costs of communication therapy compared with that of attention control Data collection: baseline and 6 months postrandomisation |
|
| Notes | Additional participants with dysarthria (no aphasia) were also randomised to the 2 interventions, but data from these individuals have not been included within this review Dropouts are detailed in Table 7 Statistical data included within the review meta‐analyses |
|
| Risk of bias | ||
| Bias | Authors' judgement | Support for judgement |
| Random sequence generation (selection bias) | Low risk | External, independent, web‐based, stratified by severity of communication impairment (TOM) and recruiting site |
| Allocation concealment (selection bias) | Low risk | External, independent, web‐based |
| Blinding (performance bias and detection bias) All outcomes | Low risk | Primary outcome rated by expert therapists blinded to allocation Other measures collected by research staff where all attempts to maintain blinding were taken |
| Incomplete outcome data (attrition bias) All outcomes | Low risk | Dropouts accounted for ITT employed |
| Selective reporting (reporting bias) | Low risk | All prespecified outcomes reported |
| Other bias | Low risk | Groups comparable at baseline Sample size calculation reported |
B.A.Bar 2011i.
| Methods | Single‐centre cross‐over RCT, stratified by matched pairs, Germany | |
| Participants | Inclusion criteria: moderate to severe aphasia (score on the AAT naming subtest below a percentile rank of 50; and comprehension on the repetition and speech AAT sub‐tests exceeding percentile rank of 30); vascular aetiology; stable general health condition; duration of aphasia of at least 4 months, with severe‐to‐moderate word finding difficulties, irrespective of fluent or nonfluent language production. The criteria also required the participants to be able to understand and repeat simple word stimuli and the existence of no or only minimal motor speech disorder (dysarthria, apraxia of speech, or both). Passed exploratory B.A.Barr training of 60 min over 2 weeks Exclusion criteria: severe semantic disorder or comprehension problems (< 30% rank of the AAT speech comprehension test), severe motor speech disorder or apraxia Group 1: 9 participants Group 2: 9 participants Details of participants are shown in Table 6 |
|
| Interventions |
1. Supervised intensive language self training Intervention: computer SLT. Designed to facilitate dialogue skills in everyday life, use of adjacency pairs (Schegloff 2007). The turns are functionally related to each other (e.g. greeting–greeting: "Hello"–"Hi"; leave‐taking‒leave‐taking: "Goodbye"–"Bye!") or information acts (e.g. question–answer: "When is the doctor's office open?"–"From 2 until 5 p.m."). The guiding principle is "talk‐in‐interaction" (Schegloff 2004). Materials: B.A.Bar equipment. Simple electronic device makes use of barcodes that carry linguistic information suited to language learning. Speech of various levels of complexity (words, phrases, sentences, texts) can be recorded, stored, and replayed as often as needed during learning. When a barcode is scanned, the recorded language is replayed to facilitate reproduction. The learning material consisted of short dialogues composed of 3 adjacency pairs: a conventional beginning (e.g. greeting–greeting), a main information part (e.g. question–answer, offer–affirmation), and a conventional ending (e.g. leave‐taking‒leave‐taking). Each half‐day training of dialogues had to be complemented by corresponding vocabulary drill exercises that required auditory word comprehension (word–picture matching) and oral naming.The items were always related to the topics conveyed by the dialogues. The 2 tasks were again carried out by means of barcode scanning. Moreover, the drill exercises contained 6 to 8 items for oral naming and 6 items for comprehension. Procedures: weekly supervision of the home training. B.A.Bar dialogue training. Exercise sheets with dialogues were given to the participants so that learners with aphasia could placethemselves in the role of the responding partner. The home training material consisted of 48 dialogues that represented characteristic scenes from 2 different thematic fields of daily living. Half of the dialogues were related to shopping, food, and drinking, the other half to health and illness. For each thematic field, a separate booklet with practice material containing 24 dialogues was prepared. Booklets were separated into 4 chapters with 2 subchapters each. The participants were instructed to practice the 8 subchapters in sequence, 1 in the morning and 1 in the afternoon, 4 d a week. Thus, every half day, 3 dialogues had to be practiced. During the 4‐week training, the total material was practiced twice: the first thematic field during the 1st and 3rd week and the second thematic field during the 2nd and 4th week. Provided by: B.A.Bar Equipment, which reads barcodes provided to therapists in private practice for use with randomised patients. Each therapist received 1 h of training before participant began to use B.A.Barr. Delivery: computer‐facilitated, 1 participant using 1 computer at home plus 1 h in clinic with therapist (and no computer). Regimen: practice twice a day for 1 h per session, 4 d per week (for 4 weeks) plus 1 h private session with speech and language therapist. Tailoring: yes. Modification: SLT focused on items described as difficult by patient and selected dialogues practiced. Adherence: monitored through supervision once a week by speech and language therapist in private practice and supported through dialogue, roleplay, review of difficult items, planning of future sessions, self evaluation forms from therapists. 2. Visual‐cognitive tasks Intervention: no SLT. Attention control. Materials non‐linguistic cognitive training focused on basic functions of visual exploration and attention. It involved visual–cognitive exercises such as visual matching of a part to the whole, maze games, comparing 2 pictures to find differences, or searching for target objects in complex pictures. A separate booklet of worksheets was developed for each week of training, again—like the language training—separated into 4 chapters and 8 subchapters. During the 4‐week treatment, the total visual–cognitive material was also practiced twice, the first booklet during the 1st and 3rd week and the second booklet during the 2nd and 4th week. Similar to the language training, the participants recorded the practice time after each session on protocol sheets. Each individual training session was based on a subchapter of the booklet containing 15 exercises: 5 pictures with visual differences, 4 maze games, 3 matching exercises, and 3 searching exercises. The time required to complete 1 session of cognitive training was calculated to be equal to the time needed for 1 session of B.A.Bar language training (approximately 30 min each). It should be noted that the B.A.Bar technology was not used during cognitive training, and feedback on correct solutions was given only during supervision but not during the home training. Procedures: visual–cognitive exercises. Provided by: speech and language therapist supervision, professional. Delivery: 1‐to‐1 and self management; face‐to‐face and self management, at home plus 1 h in clinic. Regimen: practice twice a day for 1 h per session, 4 d per week (for 4 weeks) plus 1 h private clinic session with speech and language therapist. Total dose = 36 h. Tailoring: yes. Modification: cognitive problem‐solving strategies were checked, and alternative strategies were shown to the participants. Adherence: monitored through supervision once a week by speech and language therapist in private practice and supported through diaglogue, roleplay, review of difficult items, planning of future sessions, self evaluation forms from therapists. |
|
| Outcomes | Primary outcome: dialogue test for communicative success and linguistic accuracy
Secondary outcome: Regensburg Word Fluency Test (food and animals), spontaneous speech, gathered through a semi‐standardised interview, analysed by a computer‐assisted method with regard to basic linguistic parameters (Aachen‐Sprach‐Analysis). Verbal communicative ability was assessed by the ANELT, AAT and CETI. Other cognitive specific outcome measures were also recorded. Data collection: baseline, T1, T2, T3, follow‐up assessment at 12 weeks |
|
| Notes | Statistical data included within the review meta‐analyses | |
| Risk of bias | ||
| Bias | Authors' judgement | Support for judgement |
| Random sequence generation (selection bias) | Unclear risk | Members of each pair were randomly assigned to groups |
| Allocation concealment (selection bias) | Unclear risk | Not reported |
| Blinding (performance bias and detection bias) All outcomes | Low risk | Speech and language therapist blinded |
| Incomplete outcome data (attrition bias) All outcomes | Low risk | No dropouts |
| Selective reporting (reporting bias) | Low risk | All prespecified outcomes reported |
| Other bias | Unclear risk | Groups comparable at baseline for gender, age, duration of aphasia, and severity and type of aphasia according to performance on the AAT Power calculation confirmed (unpublished data). |
B.A.Bar 2011ii.
| Methods | Single‐centre cross‐over RCT, stratified by matched pairs, Germany | |
| Participants | Inclusion criteria: moderate to severe aphasia (score on the AAT naming subtest below a percentile rank of 50; and comprehension on the repetition and speech AAT sub‐tests exceeding percentile rank of 30); vascular aetiology; stable general health condition; duration of aphasia of at least 4 months, with severe‐to‐moderate word finding difficulties, irrespective of fluent or nonfluent language production. The criteria also required the participants to be able to understand and repeat simple word stimuli and the existence of no or only minimal motor speech disorder (dysarthria, apraxia of speech, or both). Passed exploratory B.A.Barr training of 60 min over 2 weeks Exclusion criteria: severe semantic disorder or comprehension problems (< 30% rank of the AAT speech comprehension test), severe motor speech disorder or apraxia Group 1: 9 participants Group 2: 9 participants Details of participants are shown in Table 6 |
|
| Interventions |
1. B.A.Bar Early + visual‐cognitive exercises Intervention: early SLT. Supervised intensive language self training followed by home training with visual‐cognitive exercises. Materials: described in B.A.Bar 2011i. Procedures: described in detail in B.A.Bar 2011i. Provided by: described in detail in B.A.Bar 2011i. Delivery: 1 to computer or workbook, B.A. Bar Equipment, which reads barcodes, computer‐facilitated and workbooks at home, followed by period of self management and face‐to‐face, at home plus 1 h in clinic followed by cognitive training at home. Regimen: practice twice a day for 1 h per session, 4 d per week (for 4 weeks) plus 1 h private clinic session with therapist. Total dose = 32 h. B.A. Bar + 4 h with speech and language therapist working on dialogue training in roleplays without B.A. Bar + 32 h of visual‐cog therapy + 4 h of speech and language therapist looking at cognitive training strategies. Tailoring: yes. Modification: speech and language therapist focused on items described as difficult by participant and selected dialogues practiced. Adherence: not reported 2. Supervised home training with visual‐cognitive exercises followed by delayed intensive language self training Intervention: delayed SLT. Materials: computer SLT and home training (described in B.A.Bar 2011i). Procedures: described in detail in B.A.Bar 2011i. Provided by: described in detail in B.A.Bar 2011i. Delivery: 1 to computer or workbook, B.A. Bar Equipment, which reads barcodes, computer‐facilitated and workbooks at home, followed by period of self management and face‐to‐face, at home plus 1 h in clinic followed by cognitive training at home.Regimen: practice twice a day for 1 h per session, 4 d per week (for 4 weeks) plus 1 h private clinic session with speech and language therapist. Total dose = 32 h B.A. Bar + 4 h with speech and language therapist working on dialogue training in roleplays without B.A. Bar plus 32 h of visual‐cognitive therapy + 4 h of speech and language therapist looking at cognitive training strategies. Tailoring: yes. Modification: speech and language therapist focused on items described as difficult by participant and selected dialogues practiced. Adherence: not reported. |
|
| Outcomes | Primary outcome: dialogue test for communicative success and linguistic accuracy
Secondary outcome: Regensburg Word Fluency Test (food and animals), spontaneous speech, gathered through a semi‐standardised interview, analysed by a computer‐assisted method with regard to basic linguistic parameters (Aachen‐Sprach‐Analysis). Verbal communicative ability was assessed by the ANELT, AAT and CETI. Other cognitive specific outcome measures were also recorded. Data collection: baseline, T1, T2, T3, follow‐up assessment at 12 weeks |
|
| Notes | Statistical data included within the review meta‐analyses | |
| Risk of bias | ||
| Bias | Authors' judgement | Support for judgement |
| Random sequence generation (selection bias) | Unclear risk | Members of each pair were randomly assigned to groups |
| Allocation concealment (selection bias) | Unclear risk | Not reported |
| Blinding (performance bias and detection bias) All outcomes | Low risk | Speech and language therapist blinded |
| Incomplete outcome data (attrition bias) All outcomes | Low risk | No dropouts |
| Selective reporting (reporting bias) | Low risk | All prespecified outcomes reported |
| Other bias | Unclear risk | Groups comparable at baseline for sex, age, duration of aphasia, and severity and type of aphasia according to performance on the AAT Power calculation not reported |
Bakheit 2007.
| Methods | RCT, UK | |
| Participants | Inclusion criteria: first stroke, below normal on WAB, native English speaker, medically stable, fit for participation
Exclusion criteria depression, Parkinson's disease, unlikely to survive, severe dysarthria, more than 15 miles from hospital
Group 1: 51 participants
Group 2: 46 participants Details of participants are shown in Table 6 |
|
| Interventions |
1. High‐intensity SLT Intervention: high‐intensity SLT. Neuroplasticity enhanced via intensive behavioural treatment. Materials: picture‐object selection, object naming, communication aids and equipment. Procedures: picture‐object selection, object naming, recognition and associations; expression of feelings and opinions; conversational skills; gestural and non‐verbal communication (including communication aids and equipment). Provided by: speech and language therapists. Delivery: 1‐to‐1, face‐to‐face; hospital rehabilitation unit, outpatient or home. Regimen: 1 h therapy, 5 sessions weekly for 12 weeks. Total dose = 60 h therapy. Tailoring: individualised. Modification: individualised. Adherence: yes. Method not reported. 2. Conventional SLT Intervention: SLT Materials: picture‐object selection, object naming, communication aids and equipment. Procedures: tasks included picture‐object selection, object naming, recognition and associations; expression of feelings and opinions; improving conversational skills; gestural and non‐verbal communication (including communication aids and equipment). Provided by: speech and language therapists. Delivery: 1‐to‐1, face‐to‐face; hospital rehabilitation unit, outpatient or home. Regimen: 1 h therapy, 2 sessions weekly for 12 weeks. Total dose = 24 h therapy. Tailoring: individualised. Modification: individualised. Adherence: yes. Method not reported. |
|
| Outcomes | Primary outcome: WAB Data collection: baseline and weeks 4, 8, 12 and 24 |
|
| Notes | A further 'NHS group' was not randomised (first 6 consecutive participants allocated to this group) and were therefore excluded from this review
Dropouts: 31 participants (intensive 20; conventional 11). Dropouts are detailed in Table 7 Statistical data included within the review meta‐analyses |
|
| Risk of bias | ||
| Bias | Authors' judgement | Support for judgement |
| Random sequence generation (selection bias) | Low risk | Random numbers table |
| Allocation concealment (selection bias) | Low risk | Sequentially numbered sealed envelopes |
| Blinding (performance bias and detection bias) All outcomes | Low risk | Outcome assessors blinded |
| Incomplete outcome data (attrition bias) All outcomes | High risk | Authors reported that ITT analysis employed but not all participants appeared to be included in the final analyses |
| Selective reporting (reporting bias) | Low risk | All prespecified outcomes reported |
| Other bias | Unclear risk | Sample size calculation not reported Groups comparable at baseline Only 13/51 participants in intensive SLT group received 80% or more of prescribed treatment Conventional group had 11 dropouts from the allocated intervention |
CACTUS 2013.
| Methods | Multicentre RCT stratified by severity of aphasia (mild/moderate/severe) and time poststroke (< 2 years/≥ 2 years), UK | |
| Participants | Inclusion criteria: diagnosis of stroke and aphasia with word‐finding difficulties as 1 of the predominant features as assessed by the Object and Action Naming Battery and the Comprehensive Aphasia Test (Druks 2000; Swinburn 2004, respectively). Participants were included only if they had the ability to repeat spoken words presented by the recruiting speech and language therapist. Eligible participants no longer received impairment‐focused speech and language therapy enabling the computer treatment to be better isolated and evaluated. Participants with motor deficits poststroke were not excluded from the study. Where upper limb impairments made physical manipulation of the computer hardware difficult, assistive devices such as tracker balls or touchscreen computers were offered to enable access to the computer treatment Exclusion criteria: 3 people with severe visual or cognitive difficulties reducing ability to use the computer programme were excluded from the study, tested by the ability to see and perform a simple, nonlanguage‐based computer game Group 1: 16 participants Group 2: 17 participants Details of participants are shown in Table 6 |
|
| Interventions |
1. Computer‐mediated word finding therapy Intervention: StepbyStep. Computer programmes developed for the treatment of aphasia provide exercises that can be carried out on a regular basis, targeting personal vocabulary and focusing on the patient's conversational needs. Such software has been reported to be useful in the provision of intensive independent language practice, giving rise to new opportunities to provide self management of continued aphasia treatment. There is growing evidence to suggest that the use of aphasia software can help to improve outcomes in language domains including reading, spelling, and expressive language. Materials: usual language activities (as described in no SLT arm). In addition, they received speech and language therapy intervention delivered through independent use of a computer therapy programme (StepbyStep) configured by a speech and language therapist and supported by a volunteer. A library of more than 13,000 language exercises. Photographic images can be added to enable practice of personally relevant words such as names of people and pets. The intervention group practiced Object and Action Naming battery words during the treatment (Druks 2000). In addition, participants in the intervention group practiced 48 words of personal relevance. Procedures: each exercise follows steps progressing from listening to target words, producing words with visual, semantic, phonemic, or written letter/word cues through to saying the words in sentences. Speech and language therapist also provided initial instruction to the participant and caregiver on how to use the computer exercises and progress through the therapy steps. Volunteers provided assistance in using the software and hardware, encouragement to practice, and activities to promote use of the new words in daily life. Provided by: speech and language therapist tailored the steps in the therapy process. Volunteers provided assistance in using the software and hardware, encouragement to practice, and activities to promote use of the new words in daily life. Volunteers contacted the participants once a week in the first month and at least once a month thereafter by telephone or home visit. Speech and language therapists trained. Volunteers included SLT students and existing volunteers from communication support groups. Volunteers were given a 3 h training session on how to use the StepbyStep programme and their role in supporting the intervention. Delivery: 1‐to‐1, computer facilitated. Speech and language therapist supported face‐to‐face, at home. Regimen: per protocol: 20 minutes 3 d a week for 5 months (approximately 1500 minutes of practice time in total). Volunteers contacted the participants once a week in the first month and at least once a month thereafter by telephone or home visit. Total dose = 25 h therapy. Tailoring: yes. Speech and language therapist tailored the steps in the therapy process as appropriate to the abilities and needs of the individual participant and provided initial instruction to the participant and caregiver on how to use the computer exercises and progress through the therapy steps.as appropriate to the abilities and needs of the individual. Modification: tailored choice of words and level of difficulty. Adherence: collected data via computer programme 2. No SLT Intervention: No formal SLT. Participation in everyday communication tasks and for some participants this may include attendance at communication support groups and conversation, reading, and writing activities that are part of everyday life.Materials: none. Procedures: none. Provided by: none (volunteers if attending local group) Delivery: not reported. Regimen: none. Tailoring: none. Modification: none. Adherence: not applicable |
|
| Outcomes | Primary outcomes: feasibility of carrying out the study design and using self managed computer treatment supported by volunteers as a long‐term intervention. Primary measures of feasibility were the recruitment rate, completion rates, and statistical variability. Outcomes indicating feasibility of the intervention included the percentage of the eligible population interested in receiving the intervention, the ability to offer the intervention per protocol (provision of computer software and volunteer support), and the ability of the participants to carry out the intervention per protocol (using the computer for at least 20 min 3 times a week for 5 months). Amount of practice time was stored by the StepbyStep computer software automatically and reviewed by a speech and language therapist at the end of treatment Secondary outcome: measures of clinical and cost‐effectiveness. Naming words that had been practiced in treatment at 5 and 8 months from baseline from the Object and Action Naming Battery (Druks 2000). Cost‐effectiveness was investigated by estimating total costs (including intervention costs and other healthcare resource use costs collected using patient and caregiver diaries) and total quality adjusted life‐years (QALYs) calculated using a pictorial version of the EQ5D26 questionnaire for an incremental cost‐effectiveness ratio to be calculated Data collection: baseline, at 1 month and 3 month. Follow‐up at 5 and 8 months following treatment | |
| Notes | Dropouts are detailed in Table 7 Statistical data included within the review meta‐analyses |
|
| Risk of bias | ||
| Bias | Authors' judgement | Support for judgement |
| Random sequence generation (selection bias) | Low risk | Web‐based randomisation system. Stratified randomisation based on severity of aphasia (mild/moderate/severe) and time poststroke (< 2 years/ > 2 years) |
| Allocation concealment (selection bias) | Low risk | Adequate |
| Blinding (performance bias and detection bias) All outcomes | Low risk | Baseline assessments were conducted before randomisation, and assessment of outcomes undertaken blind to baseline and treatment allocation by blinded speech and language therapists |
| Incomplete outcome data (attrition bias) All outcomes | Low risk | Dropouts accounted for; ITT analysis employed |
| Selective reporting (reporting bias) | Low risk | All prespecified outcomes reported |
| Other bias | Low risk | Groups were comparable at baseline in terms of severity, sex, age, time postonset Pilot study so not possible to perform power calculation in advance but used data to calculate future sample size No other obvious bias |
Conklyn 2012.
| Methods | RCT, USA | |
| Participants | Inclusion criteria: 18 years of age or older, diagnosis of mild‐severe aphasia (1 or 2/3 on NIHSS), damage to left MCA area, first infarct, any dysarthria had to be less severe than their aphasia (as per NIHSS), able to follow commands, ability to sing at least 25% of Happy Birthday, demonstrate awareness of speech problems, English as their first language
Exclusion criteria: receptive aphasia greater than expressive aphasia, aphasia other than expressive aphasia, Broca's type, use of tracheostomy or ventilator, severe comorbidity that precluded participation, severe cognitive deficits that precluded informed consent or participation in procedures. People with only apraxia or dysarthria were excluded
Group 1: 16 participants
Group 2: 14 participants Details of participants are shown in Table 6 |
|
| Interventions |
1. Modified Melodic Intonation Therapy (MMIT) Intervention: MMIT. MIT has received positive reports. Modifications to original MIT approach include therapist composition and use of novel melodic phrases that match prosody of spoken phrases in pitch and rhythm, use of full phrases during initial treatment to facilitate access to intact areas of brain, and early introduction poststroke. Materials: not reported. Procedures: session 1: 10‐15 minutes MMIT. 1 phrase training. Therapist modelled phrase multiple times then asked participant to sing. Participant assisted by therapist to tap rhythm of phrase with their left hand to provide added cue. Subsequent sessions could add more phrases. Provided by: board‐certified music therapist trained in MMIT. Delivery: 1‐to‐1, face‐to‐face, hospital. Regimen: protocol allowed for up to 5 sessions but not more than 3 delivered due to logistics and early discharge. Duration of individual sessions were 10‐15 mins (up to 45 min max). Tailoring: only in terms of progressive complexity/number of phrases. Modification: none. Adherence: no mention of any practice tasks. No mention of measures of adherence or fidelity. No report of all 5 sessions delivered as planned 2. No SLT Intervention: no SLT. Placebo control. Materials: none. Procedures: discussion on patient impairment, different forms of treatment, different outcomes, issues arising from aphasia. Provided by: board‐certified music therapist trained in MMIT. Delivery: 1‐to‐1, face‐to‐face, location not reported. Regimen: single discussion, duration 10‐15 min. Tailoring: not reported. Modification: not reported. Adherence: not reported |
|
| Outcomes | Primary outcomes: in‐trial developed assessment tool: repetition and responsiveness Secondary outcomes: Semantic Fluency Test, Controlled Oral Word Association Test, complex ideational subtest of the BDAE, Peabody Picture Vocabulary Test Data collection: baseline, 1 week prior to intervention, within 1 week of intervention. Follow‐up 3 months after intervention |
|
| Notes | Dropouts are detailed in Table 7 Suitable statistical data permitting inclusion within the review meta‐analyses unavailable |
|
| Risk of bias | ||
| Bias | Authors' judgement | Support for judgement |
| Random sequence generation (selection bias) | Low risk | Random numbers table |
| Allocation concealment (selection bias) | High risk | Adequate (allocated by music therapist after enrolment by nursing manager who had no prior knowledge of order of participants) |
| Blinding (performance bias and detection bias) All outcomes | Low risk | Yes, 2 nurse managers |
| Incomplete outcome data (attrition bias) All outcomes | Unclear risk | Dropouts reported but reasons for withdrawal not reported |
| Selective reporting (reporting bias) | Unclear risk | Not all of the prespecified outcomes were reported |
| Other bias | Unclear risk | Groups comparable at baseline for age, days postonset, severity (measured by % Happy Birthday song) |
Crerar 1996.
| Methods | Cross‐over RCT (only data prior to cross‐over treatment included in this review), UK | |
| Participants | Inclusion criteria: aphasia, problems with comprehension of written sentences, comprehension of small vocabulary of individual context words used in therapy, can recognise graphical representations of objects and actions in therapy sentences; right‐handed; could cope with computer interface
Exclusion criteria: none listed ‐ some initial referrals for participation could not take part: 5 withdrew due to transport and geographical location of home; 1 due to difficulty comprehending lexical items in isolation; 1 due to emotional disturbance
Group 1: 3 participants
Group 2: 5 participants Details of participants are shown in Table 6 |
|
| Interventions |
1. Verb SLT Intervention: Verb SLT ‐ improved syntactic processing leading to improved sentence comprehension Materials: computer‐based remediation software. Procedures: protocolised tasks included picture building mode, picture creation to match written sentence, sentence building mode, sentence creation from available words to match a picture. Some flexibility between treatment modes and support provided by therapist. Provided by: computer programmer and SLT. Training and expertise not reported. Delivery: 1‐to‐1, face‐to‐face; computer‐facilitated in clinical settings ("a quiet room, blinds and lighting adjusted for maximum screen clarity"). Regimen: 1 h therapy twice weekly for 3 weeks. Total dose = 6 h therapy. Tailoring: yes, based on testing profiles. Modification: not possible. Adherence: all participants retained up to (and following) cross‐over stage of RCT. 2. Preposition SLT Intervention: Preposition SLT. Materials: computer‐based remediation software. Procedures: protocolised tasks included picture building mode, picture creation to match written sentence, sentence building mode, sentence creation from available words to match a picture. Some flexibility between treatment modes and support provided by therapist. Provided by: computer programmer and speech and language therapist. Training and expertise not reported. Delivery: 1‐to‐1, face‐to‐face; computer facilitated in clinical settings ("a quiet room, blinds and lighting adjusted for maximum screen clarity"). Regimen: 1 h therapy twice weekly for 3 weeks. Total dose = 6 h therapy. Tailoring: yes, based on testing profiles. Modification: not possible. Adherence: all participants retained up to (and following) cross‐over stage of RCT |
|
| Outcomes | Primary outcomes: Real World Test ‐ verbs and prepositions (treated and untreated) Secondary outcomes: computer‐mediated assessment ‐ verbs and prepositions (treated and untreated) Morphology Data collection: baseline, post‐treatment 1 (cross‐over then baseline 2 and post‐treatment 2, which were not included in this review) |
|
| Notes | Randomisation details provided through personal communication with authors
Dropouts: none prior to cross‐over
Following 3 weeks of intervention and post‐therapy assessment, the participants crossed over to the other intervention arm and received the alternative SLT: these cross‐over data were not included in this review Statistical data included within the review meta‐analyses |
|
| Risk of bias | ||
| Bias | Authors' judgement | Support for judgement |
| Random sequence generation (selection bias) | Low risk | Patient identification tags drawn from a hat |
| Allocation concealment (selection bias) | High risk | Trialists drew patient identification tags drawn from a hat |
| Blinding (performance bias and detection bias) All outcomes | Low risk | Computer‐based tests automatically recorded. Real World Tests were unblinded |
| Incomplete outcome data (attrition bias) All outcomes | Low risk | All participants retained up to (and following) cross‐over stage of RCT |
| Selective reporting (reporting bias) | Low risk | All prespecified outcomes reported |
| Other bias | Low risk | Sample size calculation not reported Participants equal across groups age, time postonset, aphasia severity Only male participants in group 2 (preposition SLT), 2 females in group 1 (verb SLT) 2 additional participants were randomised but they had not experienced a stroke Only the stroke‐specific data have been included within this review |
Crosson 2014.
| Methods | RCT, USA | |
| Participants | Inclusion criteria: at least 6 months poststroke and had single or multiple lesions limited to the left hemisphere that included the precentral gyrus or underlying white matter as confirmed by medical records and MRI; standard score greater than 69.92 on the Peabody Picture Vocabulary Test—IV (PPVT–IV; Dunn 2007); an ability to consistently follow one‐step commands; scores on the WAB–AQ below the aphasia cutoff of 93.8 (Kertesz 1982); (d) right‐handedness prior to the stroke, as determined by the Edinburgh Handedness Inventory (Oldfield 1971); and (e) English as their first language.
Exclusion criteria: not eligible for participation in MRI or if they had a history of head trauma, neurological disorder other than stroke (e.g. Alzheimer's disease), learning disability (e.g. dyslexia), psychiatric disorder (e.g. schizophrenia), drug or alcohol abuse, or chronic medical conditions likely to impair cognition (e.g. renal or hepatic failure)
Group 1: 7 participants
Group 2: 7 participants Details of participants are shown in Table 6 |
|
| Interventions |
1. Naming therapy with gesture Intervention: gesture SLT. Literature suggests the advantages of recruitment of right‐hemisphere mechanisms during language recovery in aphasia. Crosson 2007 devised an intention‐based treatment technique that engaged the right hemisphere by shifting intention and language production mechanisms to homologous right‐hemisphere regions. Crosson 2007 defined intention as the ability to select and initiate an action from many possible competing actions. Because the intentional circuits for volitional hand movement overlap, those for word generation in the pre‐supplementary motor area (pre‐SMA) preceding a naming attempt with a volitional complex left‐hand movement could facilitate picture naming. Materials: prior to treatment, all subjects named a set of more than 400 black‐and‐white line drawings of objects and generated members of 120 categories twice. Items missed consistently were selected for treatment, beginning with the highest frequency items and progressing to lower frequency items until enough items were identified to construct the counterbalanced treatment lists and probe stimuli. Specifically, from the set of 400 pictures and 120 categories, 120 pictures and 60 categories were individually selected for each subject, with the selected picture and category sets each containing 25% consistently correct and 75% consistently incorrect at pretreatment testing. Procedures: trained on both picture naming and category generation. Phase 1 consisted of treatment sessions 1–10 and focused on the naming of 50 pictures. Phase 2 consisted of treatment sessions 11–20 and trained subjects on the naming of 50 different pictures. Phase 3 consisted of treatment sessions 21–30 and required the generation of an exemplar of each of 40 different categories. Naming trials in Phases 1 and 2 consisted of the presentation of a picture on a computer monitor for naming. In Phase 3, trials consisted of auditory and orthographic presentations of a category name for which the subject generated 1 category member. For all trials in all phases, a therapist verified response accuracy. If treatment trials were completed correctly (i.e., a picture was named correctly or a correct category exemplar was generated), subjects began the next trial. If an item was not named correctly, the therapist would provide the correct name, and subjects would then practice saying the correct response. Similarly, if a subject was unable to generate a member of a category, the therapist would provide an example, and the subject would practice saying this correct response. This correction procedure was repeated up to 3 times maximum or until the subject named the item correctly. The number of times a subject repeated the correct response was not regulated. Each member of the gesture group initiated each treatment trial with his or her left hand by opening and reaching into a box and pushing a red button. Second, during each correction procedure, each member of the gesture group also made a non‐meaningful circular gesture with his or her left hand. Provided by: speech and language therapists. The same therapists administered both the gesture and the no gesture treatments. Training not reported. Delivery: 1‐to‐1, face‐to‐face and computer, location not reported. Regimen: treatment was delivered in 3 phases (10 sessions per phase), with two 1 h treatment sessions per day, 5 d a week, for a total of 30 treatment sessions. The 2 sessions each day were at least half an hour apart. Total dose = 30 h therapy. Tailoring: yes, naming targets by successful/unsuccessful attempts on baseline measure. During therapy correction and prompt and advancement through levels based on patient ability. Modification: not reported.Adherence: therapist monitored patient's protocol adherence. For treatment sessions a research assistant—who was trained in both treatments and who was not administering treatment at any of the sites—evaluated 1 session per treatment phase (i.e., once a week) per subject for correct delivery of the assigned treatment and subsequent correction procedures. 2. SLT Intervention: SLT. Usual care. Materials: described above. Procedures: trained on both picture naming and category generation. Phase 1 to Phase 3 treatment sessions described above. For all trials in all phases, a therapist verified response accuracy, as described above. For the no gesture group, a therapist pushed a button to initiate each treatment trial. No hand movement was required by the participant during the correction procedure. Provided by: speech and language therapists. The same therapists administered both the gesture and the no gesture treatments. Training not reported. Delivery: 1‐to‐1, face‐to‐face and computer, location not reported. Regimen: treatment was delivered in 3 phases (10 sessions per phase), with two 1 h treatment sessions per day, 5 d a week, for a total of 30 treatment sessions. The 2 sessions each day were at least half an hour apart. Total dose = 30 h therapy. Tailoring: yes, naming targets by successful/unsuccessful attempts on baseline measure. During therapy correction and prompt and advancement through levels based on patient ability. Modification: not reported. Adherence: therapist monitored patient's protocol adherence. For treatment sessions a research assistant—who was trained in both treatments and who was not administering treatment at any of the sites—evaluated 1 session per treatment phase (i.e., once a week) per subject for correct delivery of the assigned treatment and subsequent correction procedures. |
|
| Outcomes | Primary outcomes: the naming of pictures from the BNT, WABAQ, and discourse production (various ‐ number of nouns; verbs; total number of words; correct information units (Nicholas 1993); utterances with new information (Del Toro 2008); propositional analysis of narrative discourse; Grammaticality. Discourse tasks: describing Norman Rockwell pictures and answering open‐ended questions. Data collection: baseline, post‐treatment. Follow‐up at 3 months |
|
| Notes | Statistical data included within the review meta‐analyses | |
| Risk of bias | ||
| Bias | Authors' judgement | Support for judgement |
| Random sequence generation (selection bias) | Unclear risk | Not reported. Stratified random sampling to equalise groups on picture‐naming ability using BNT scores. Groups were also matched on the number of subjects whose lesions extended anteriorly beyond the precentral sulcus |
| Allocation concealment (selection bias) | Unclear risk | Not reported |
| Blinding (performance bias and detection bias) All outcomes | Unclear risk | Not reported |
| Incomplete outcome data (attrition bias) All outcomes | Unclear risk | Not reported |
| Selective reporting (reporting bias) | Low risk | All prespecified outcomes reported |
| Other bias | Unclear risk | No power calculation Groups were comparable at baseline for age, education, aphasia severity, naming severity |
David 1982.
| Methods | Parallel group RCT, UK | |
| Participants | Inclusion criteria: aphasia, less than 85% on FCP (x 2), English speaking, at least 3 weeks after stroke
Exclusion criteria: previous SLT, deafness, blindness or confusion preventing participation
Group 1: 65 (of 71) participants' data reported
Group 2: 68 (of 84) participants' data reported Details of participants are shown in Table 6 |
|
| Interventions |
1. Conventional SLT Intervention: usual care SLT Materials: usual care Procedures: as deemed appropriate by SLT. Provided by: qualified therapist. Delivery: 1‐to‐1, face‐to‐face; not reported where the intervention was delivered. Regimen: up to 2 h therapy weekly for 15 to 20 weeks. Total dose = 30 h therapy. Duration of individual not reported. Tailoring: individualised. Modification: not reported. Adherence: dropout rate recorded. 2. Social support and stimulation Intervention: "Unfamiliar volunteers". General stimulation and social support. Materials: not reported. Procedures: volunteers provided with details about participant's aphasia, general support and within‐treatment assessment scores and instructed to 'encourage' communication but no instruction in SLT techniques Provided by: volunteers. Training not specified but required to be reliable and able to provide 2 h per week to patient. Delivery: 1‐to‐1, face‐to‐face, SLT department. Regimen: up to 2 h support weekly up to 15 to 20 weeks. Total dose = 30 h contact time. Tailoring: individualised. Modification: not reported. Adherence: dropout rate recorded |
|
| Outcomes | Primary outcomes: FCP, Schuell Assessment Data collection: assessed twice at baseline, at 2, 4, 8, 12 weeks, and at post‐treatment (3‐ and 6‐month follow‐up) | |
| Notes | Randomisation details provided through personal communication with authors of original review
Dropouts: 82 participants (conventional SLT 34; social support 48). Dropouts are detailed in Table 7 Statistical data included within the review meta‐analyses |
|
| Risk of bias | ||
| Bias | Authors' judgement | Support for judgement |
| Random sequence generation (selection bias) | Low risk | Random numbers table |
| Allocation concealment (selection bias) | Low risk | Adequate |
| Blinding (performance bias and detection bias) All outcomes | Low risk | Outcome assessor not treating therapist |
| Incomplete outcome data (attrition bias) All outcomes | High risk | ITT analysis not employed |
| Selective reporting (reporting bias) | Low risk | All prespecified outcomes reported |
| Other bias | Unclear risk | Sample size calculation not reported Participants in the social support and stimulation group were younger (mean age 65 years; SD 10.6) than those in the conventional SLT group (mean age 70 years; SD 8.7) |
Denes 1996.
| Methods | Parallel group RCT, Italy | |
| Participants | Inclusion criteria: global aphasia, left CVA, within first year after stroke, right‐handed, native Italian speakers, literate
Exclusion criteria: none listed
Group 1: 8 participants
Group 2: 9 participants Details of participants are shown in Table 6 |
|
| Interventions |
1. High‐intensity SLT Intervention: "Intensive SLT". Intensity is important. Cost‐benefit ratio questionable. Materials: not reported. Procedures: conversational approach more focused on comprehension (e.g. picture‐matching to understanding complex scenes, short stories, engaging patient in conversation, retelling personally relevant stories). Ecological approach based on conversation, comprehension (mostly) and production deficits. Little focus on reading/writing other than in support of the production and comprehension. Provided by: qualified therapists. Delivery: 1‐to‐1, face‐to‐face; mostly outpatient. Regimen (frequency (sessions weekly) x duration): 45‐60 min therapy sessions approximately 5 times weekly for 6 months. Dose = estimated 96.75 to 129 h therapy Tailoring: not reported. Modification: not reported. Adherence: method not reported 2. Conventional SLT Intervention: standard SLT. Materials: not reported. Procedures: based on stimulation approach. Provided by: speech and language therapists. Delivery: 1‐to‐1, face‐to‐face; mostly outpatient. Regimen : 45‐ 60 min therapy session approximately 3 times weekly for 6 months. Total dose = 78 h therapy. Tailoring: not reported. Modification: not reported. Adherence: method not reported |
|
| Outcomes | Primary outcomes: AAT Data collection: assessed at baseline and 6 months | |
| Notes | Data from an additional 4 non‐randomised participants with global aphasia were also reported. They received no SLT intervention but were assessed at 6‐month intervals, and their scores were used to account for spontaneous recovery. They were not included in this review. Statistical data included within the review meta‐analyses |
|
| Risk of bias | ||
| Bias | Authors' judgement | Support for judgement |
| Random sequence generation (selection bias) | Unclear risk | Not reported |
| Allocation concealment (selection bias) | Unclear risk | Not reported |
| Blinding (performance bias and detection bias) All outcomes | Low risk | Outcome assessors blinded |
| Incomplete outcome data (attrition bias) All outcomes | Low risk | All randomised participants included in analysis |
| Selective reporting (reporting bias) | Low risk | All prespecified outcomes reported |
| Other bias | Unclear risk | Sample size calculation not reported Groups comparable at baseline |
Di Carlo 1980.
| Methods | Parallel group RCT, USA | |
| Participants | Inclusion criteria: right‐handed, left MCA stroke
Exclusion criteria: none listed
Group 1: 7 participants
Group 2: 7 participants Details of participants are shown in Table 6 |
|
| Interventions |
1. Conventional SLT with filmed programmed instruction Intervention: "Conventional SLT with filmed programmed instruction". "New methods . . . minimise stress and frustration and reduce instruction time" "programmed instruction . . . based on modern learning theory". Developed on modern linguistic learning principles and theory (for people who were hearing impaired). Materials: 30 language training films, preceded by 10 perceptual and 5 thinking films for practice. Procedures: "Filmed programmed instruction": perceptual, thinking and language training films (designed for population with hearing impairment) based on linguistic learning theory; passing criterion of 80%, then progression to the next film. Provided by: not reported Delivery: not reported Regimen: not reported but at least 80 h for 5‐22 months. Tailoring: not reported. Modification: not reported. Adherence: not reported. 2. Conventional SLT Intervention: "Conventional SLT and non‐programmed activity". Rationale not reported. Materials: not reported. Procedures: "traditional" therapy and viewing slides, bibliotherapy and "other non‐programmed" activity. Provided by: not reported Delivery: not reported Regimen: not reported ‐ at least 80 h for 6‐ 9 months. Tailoring: not reported. Modification: not reported. Adherence: not reported. |
|
| Outcomes | Primary outcomes: reading recognition, reading comprehension, visual closure, visual learning, vocabulary learning Data collection: assessed at baseline, mid‐test and at end of treatment | |
| Notes | — | |
| Risk of bias | ||
| Bias | Authors' judgement | Support for judgement |
| Random sequence generation (selection bias) | Unclear risk | Not reported |
| Allocation concealment (selection bias) | Unclear risk | Not reported |
| Blinding (performance bias and detection bias) All outcomes | Unclear risk | Outcome assessor blinding not described |
| Incomplete outcome data (attrition bias) All outcomes | Low risk | All randomised participants included in analysis |
| Selective reporting (reporting bias) | Low risk | All prespecified outcomes reported |
| Other bias | Unclear risk | Sample size calculation not reported Groups comparable at baseline |
Doesborgh 2004.
| Methods | RCT, Netherlands | |
| Participants | Inclusion criteria: age 20‐86 years, native Dutch speaker, minimum 11 months after stroke with moderate‐to‐severe naming deficits
Exclusion criteria: illiterate, global or rest aphasia, developmental dyslexia
Group 1: 9 participants
Group 2: 10 participants Details of participants are shown in Table 6 |
|
| Interventions |
1. Computer‐mediated SLT Intervention: "multicue". Person with aphasia experiences impact of various cue types on their naming abilities. Permits internalisation and development of self cueing strategies. Materials: written cues and written feedback. Procedures: 4 series of 80 pictures randomly presented. High and low frequency of words of varying length (1‐4 syllables). Coloured picture of word. If word cannot be produced then cues are employed from choice of semantic, orthographic, sentence completion, distraction/take break. First 4 sessions: therapist follows protocol to support patient. Cues introduced sequentially over first 4 sessions. Written responses. Session 5 onwards: therapist withdraws but continues to check progress. Provided by: therapist. Training not reported. Delivery: computer‐based; 1‐to‐1; location not reported. Regimen: 30‐45 minutes therapy over 2‐3 sessions weekly for 2 months. Total dose = 10‐11 h therapy. Tailoring: cues could be reduced or omitted according to patient need. Regular therapist review on progress and problem items. Modification: none reported. Adherence: not reported. 2. No SLT Intervention: no SLT Materials: none Procedures: none. Delivery: none. Regimen: none Modification: none. Adherence: not reported. |
|
| Outcomes | Primary outcomes: BNT, ANELT‐A Data collection: assessed at baseline and end of treatment |
|
| Notes | Co‐intervention: psychosocial group therapy aimed at coping with consequences of aphasia, not reported if all participated
Patient confounder: executive function deficits
Dropouts: 1 participant (computer‐mediated SLT 1; no SLT 0) Dropouts are detailed in Table 7 Statistical data included within the review meta‐analyses |
|
| Risk of bias | ||
| Bias | Authors' judgement | Support for judgement |
| Random sequence generation (selection bias) | Low risk | Computer‐generated sequence |
| Allocation concealment (selection bias) | Low risk | Concealment in sequentially numbered opaque sealed envelopes |
| Blinding (performance bias and detection bias) All outcomes | High risk | Trialists were the outcome assessors |
| Incomplete outcome data (attrition bias) All outcomes | High risk | ITT analysis not employed |
| Selective reporting (reporting bias) | Low risk | All prespecified outcomes reported |
| Other bias | Low risk | A priori sample size calculated Groups similar at baseline |
Drummond 1981.
| Methods | Parallel group RCT, USA | |
| Participants | Inclusion criteria: none listed
Exclusion criteria: none listed
Group 1: 4 participants
Group 2: 4 participants Details of participants are shown in Table 6 |
|
| Interventions |
1. Task‐specific SLT gestural Intervention: AMERIND Gestural Code Cueing. Responses to intersystematic tasks may be enhanced via visual cue for a verbal response. Sessions designed to drill word‐retrieval skills, using cueing where necessary. Materials: 30 common nouns controlled for word frequency and picturability. Procedures: picture naming. Plus 2 pre‐therapy training sessions (20 minutes each). Also had AMERIND cues in addition to the traditional initially‐syllable and sentence ‐completion cues. Presentation of cue type randomised for each session. Provided by: not reported. Delivery: 1‐to‐1, residential aphasia programme at university. Regimen (frequency (sessions weekly) x duration): 15‐30 minutes daily for 2 weeks. Tailoring: not reported. Modification: not reported. Adherence: not reported. 2. Conventional SLT Intervention: Auditory‐verbal cueing. Initial syllable and sentence‐completion cues are more facilitatory than other cues. Drilling word‐retrieval skills using cueing when necessary. Materials: 30 common nouns controlled for word frequency and picturability. Procedures: received traditional initial‐syllable and sentence completion cues. Standardised cueing protocol for sentence completion published as appendix to paper. Provided by: not reported. Delivery: 1‐to‐1; residential aphasia programme at University. Regimen 15‐30 minutes daily for 2 weeks. Tailoring: not reported. Modification: not reported. Adherence: not reported. |
|
| Outcomes | Primary outcomes: picture naming test (20/30 items from the Aphasia Therapy Kit) (Taylor 1959), response times Data collection: assessed at baseline and at end of treatment | |
| Notes | Suitable statistical data permitting inclusion within the review meta‐analyses unavailable | |
| Risk of bias | ||
| Bias | Authors' judgement | Support for judgement |
| Random sequence generation (selection bias) | Unclear risk | Not reported |
| Allocation concealment (selection bias) | Unclear risk | Not reported |
| Blinding (performance bias and detection bias) All outcomes | Unclear risk | Not reported |
| Incomplete outcome data (attrition bias) All outcomes | Low risk | All randomised participants included in analysis |
| Selective reporting (reporting bias) | Unclear risk | All prespecified outcomes reported. However although they reported mean values for % correct responses, SD were not reported. |
| Other bias | Unclear risk | Inclusion criteria not listed Groups similar at baseline Sample size calculation not reported |
Elman 1999.
| Methods | Cross‐over group RCT (only data collected prior to cross‐over treatment included in this review), USA | |
| Participants | Inclusion criteria: > 6 months after stroke, completed SLT available via insurance, single left hemisphere stroke, 80 years or younger, premorbidly literate in English, no medical complications or history of alcoholism, 10th to 90th overall percentile on SPICA on entry, attend more than 80% of therapy
Exclusion criteria: multiple brain lesions, diagnosed alcoholism
Group 1: 12 participants
Group 2: 12 participants Details of participants are shown in Table 6 |
|
| Interventions |
1. Group SLT Intervention: SLT. Group therapy approaches effective as they facilitate generalisation, improve psychosocial functioning and participation, and are cost‐effective. Materials: communication of message using any verbal/non‐verbal methods in group format. Fostering initiation of conversation, expanding aphasia understanding, awareness of personal goals, recognition of progress made, promoting confidence. Communication facilitated by communicative drawing, roleplay, natural gestures, resources (e.g. maps) props, personal notebooks, number lines, conversational prompting, graphic choices, scripting. Reading and writing tasks. Social games for communication practice. Procedures: opening 90 min: discussion current activities and events. speech and language therapist‐facilitated discussion of topics relevant to group. Sharing of facilitator's role amongst group. Encourging peer feedback, cueing and peer volunteers. Some reading and writing tasks. Social games. Performance artist (1 h weekly) to facilitate physical exercises, creative expression. Provided by: speech and language therapist plus family or artist. Delivery: group, face‐to‐face; not reported (possibly Aphasia Centre). Regimen: 2.5 h session twice weekly for 4 months. Total dose = up to 160 h therapy. Tailoring: not reported. Modification: not reported. Adherence: 80% attendance. 2. Social support and stimulation Intervention: social group activities and classes. Social contact control, provide opportunity for socialisation. Materials: not reported. Procedures: activities varied depending on social activities of their choice but included movement classes, creative/performance arts groups, church activities, support groups. Provided by: not reported. Delivery: group, face‐to‐face; location not reported. Regimen: at least 3 h weekly for 4 months. Total dose = 52 h contact. Tailoring: not reported. Modification: not reported. Adherence: not reported. |
|
| Outcomes | Primary outcomes: Shortened Porch Index of Communicative Ability, WABAQ, Communicative Activities in Daily Living Data collection: assessed at baseline, 2 and 4 months and 4‐6 weeks from end of treatment. Qualitative 1‐to‐1 interviews with participants in SLT group (patients and caregivers) at 2 months, 4 months after therapy and at follow‐up 4‐6 weeks later | |
| Notes | Dropouts: 7 participants (conventional SLT 3; social support and stimulation 4). Dropouts are detailed in Table 7 Suitable statistical data permitting inclusion within the review meta‐analyses unavailable |
|
| Risk of bias | ||
| Bias | Authors' judgement | Support for judgement |
| Random sequence generation (selection bias) | Unclear risk | Not reported |
| Allocation concealment (selection bias) | Unclear risk | Not reported |
| Blinding (performance bias and detection bias) All outcomes | High risk | Outcome assessor inadequately blinded |
| Incomplete outcome data (attrition bias) All outcomes | High risk | ITT analysis not employed |
| Selective reporting (reporting bias) | Unclear risk | Not all prespecified outcomes were reported. CETI, Affect Balance Scale and connected speech measures data and "conversations about videotaped television segments" were not reported in the paper. |
| Other bias | Unclear risk | Groups comparable at baseline (age, education level, aphasia severity) Sample size calculation not reported |
FUATAC.
| Methods | RCT, Germany | |
| Participants | Inclusion criteria: left hemisphere cerebrovascular accident less than 3 months prior; aphasia (as per clinical diagnosis and screening test); monolingual German speaker Exclusion criteria: aphasia primarily automatisms; severe jargon; severe apraxia of speech; severe neuropsychological disorders, psychiatric disorders or both Group 1: 13 participants Group 2: 15 participants Details of participants are shown in Table 6 |
|
| Interventions |
1. CIAT Intervention: forced‐use aphasia therapy. Materials: not reported.Procedures: "therapy focused on communicative aspects". Provided by: not reported. Delivery: face‐to‐face, group, location not reported. Regimen: 5 sessions/week, each session 3 h duration, delivered over 6 week period. Tailoring: not reported. Modification: not reported. Adherence: not reported. 2. Conventional therapy Intervention Materials: not reported.Procedures: conventional therapy focused on language/linguistic skills. Provided by: not reported.Delivery: face‐to‐face, group, location not reported. Regimen: 5 sessions/week, each session 45 minutes duration, delivered over 6 week interval. Tailoring: not reported. Modification: not reported. Adherence: not reported |
|
| Outcomes | Outcomes: AAT, Aphasia Checklist Data collection: baseline and immediately postintervention (6 weeks) |
|
| Notes | Suitable statistical data permitting inclusion within the review meta‐analyses unavailable | |
| Risk of bias | ||
| Bias | Authors' judgement | Support for judgement |
| Random sequence generation (selection bias) | Unclear risk | Not reported |
| Allocation concealment (selection bias) | Unclear risk | Not reported |
| Blinding (performance bias and detection bias) All outcomes | Unclear risk | Not reported |
| Incomplete outcome data (attrition bias) All outcomes | High risk | Not all participants accounted for at follow‐up |
| Selective reporting (reporting bias) | High risk | Lack of any statistical data analysis reported for outcomes |
| Other bias | Unclear risk | Not reported whether groups were comparable at baseline |
Hinckley 2001.
| Methods | RCT, USA | |
| Participants | Inclusion criteria: single left hemisphere stroke, native English speaker, minimum 3 months after stroke, hearing and vision corrected to normal, minimum high school education, chronic non‐fluent aphasia
Exclusion criteria: none listed
Group 1: 6 participants
Group 2: 6 participants Details of participants are shown in Table 6 |
|
| Interventions |
1. Functional SLT Intervention: functional SLT. Disability‐based, context‐trained. Activity based, personal relevance emphasised. Establish compensatory strategies based on clients strengths to achieve targeted task. Materials: roleplay scripts, various actual catalogues, practice order forms, phone, credit cars, pen/paper, cue cards as individualised for each client. Procedures: roleplays of functional tasks, establish compensatory strategies (practice ordering by telephone, self generate individualised strategies). Use different strategies and modalities to achieve goal/task. Provided by: speech and language therapist trained in both treatment approaches. Delivery: 1‐to‐1, face‐to‐face, location not reported. Regimen: 20 h weekly for 5 weeks. Total dose = 100 h of therapy. Tailoring: materials individualised. Modification: materials individualised. Adherence: reviewed for adherence to allocated intervention. 2. Conventional SLT Intervention: "Impairment‐based therapy". Deficit/impairment based therapy approach. Materials: stimulus items from targeted vocabulary that combine both picture and written words. Pictured stimuli for auditory comprehension tasks. Procedures: impairment‐based, skill trained, remediating naming deficit areas using cueing hierarchies using various modalities. Centred on targeted dimensions of performance (e.g. accuracy, speed or response, nature of required cueing). Provided by: speech and language therapists trained in both treatment approaches. Delivery: 1‐to‐1, face‐to‐face, location not reported. Regimen: 20 h weekly over 5 weeks. Total dose = 100 h therapy. Tailoring: none. Modification: none. Adherence: reviewed for adherence to allocated intervention. |
|
| Outcomes | CADL‐2, CETI (completed by primary caregiver), phone and written functional task developed for project (catalogue ordering quiet and tone), PALPA oral and written picture naming Assessed at baseline and end of treatment | |
| Notes | 5 additional participants were non‐randomly assigned to a baseline group (both functional SLT and conventional SLT), but they were excluded from this review
In the functional SLT group, therapy was discontinued when performance on training probes (50% trained items) reached a minimum of 90% accuracy for 3 consecutive sessions
All speech and language therapists were trained in 2 treatment approaches Statistical data included within the review meta‐analyses |
|
| Risk of bias | ||
| Bias | Authors' judgement | Support for judgement |
| Random sequence generation (selection bias) | Unclear risk | Not reported |
| Allocation concealment (selection bias) | Unclear risk | Not reported |
| Blinding (performance bias and detection bias) All outcomes | Unclear risk | Outcome assessor not reported |
| Incomplete outcome data (attrition bias) All outcomes | Low risk | All randomised participants included in analyses |
| Selective reporting (reporting bias) | Low risk | All prespecified outcomes reported |
| Other bias | Unclear risk | Groups comparable at baseline (age, time postonset, aphasia severity, education, occupation) Sample size calculation not reported |
Katz 1997i.
| Methods | RCT, USA | |
| Participants | Inclusion criteria: single left hemisphere stroke, maximum 85 years, minimum 1 year after stroke, PICA overall between 15th to 90th percentile, premorbidly right‐handed, minimum education 8th grade, premorbidly literate in English, vision no worse than 20/100 corrected in better eye, hearing no worse than 40 dB unaided in better ear, no language treatment 3 months before entry to study, non‐institutionalised living environment
Exclusion criteria: premorbid psychiatric, reading or writing problems
Group 1: 21 participants
Group 2: 21 participants Details of participants are shown in Table 6 |
|
| Interventions |
1. Computer‐mediated SLT Intervention: "computer reading treatment software". Treatment of reading and writing skills using computers. Isolated practice possible. Minimal responses required. Schuell's stimulation approach. Targeting maximised interaction within challenging tasks. Materials: 32 activities, 232 sequentially arranged visual matching and reading activities from 2‐5 choices. Text characters (letters, numbers, symbols). No pictures. Stimulus in centre of top third of screen. Response choices simultaneously displayed bottom half of screen. Tasks sequential in hierarchy of difficulty. 10 matching activities, 22 reading comprehension tasks with 8 difficulty levels. 4 comprehension tasks had 2 difficulty levels. Matching activities were perceptual visual matching to familiarise patient with software. Reading comprehension stimuli (letters numbers, words, phrases and sentences). Procedures: visual matching and reading comprehension tasks. Speech and language therapist familiarised patient with computer, programme and tasks. Demonstrated response modes. Provided by: 4 therapists but minimal involvement. Supportive functions but not in room. Delivery: computer‐facilitated; 1‐to‐1; SLT dept (2 occasionally at home with support; not clear which group). Regimen (frequency (sessions weekly) x duration): 3 h weekly for 26 weeks. Total dose = 78 h therapy. Tailoring: 4 participants needed additional cues during 1 or more sessions. Each task had a baseline set of 20 tasks. If criterion performance of 80% correct in 3 consecutive baseline tasks then programme proceeded to next task. Typically, movement up and down training hierarchy was controlled automatically by the programme. Modification: each task had a baseline set of 20 tasks. If criterion performance of 80% correct in 3 consecutive baseline tasks then programme proceeded to next task. If criterion performance not reached on baseline then therapist used Editor option to divide baseline 20 items into 2 sets of 10 items. Adherence: therapist monitored attendance and performance. Overall report ‐ participants completed mean of 76.14 tasks (range 1‐167) after computerised treatment. 19 or 21 participants completed at least 40 tasks. 2. No SLT Intervention: no SLT Materials: none. Procedures: none. Delivery: none. Regimen: none Modification: none. Adherence: not reported. |
|
| Outcomes | Primary outcomes: PICA, WABAQ Data collection: baseline and 13 and 26 weeks | |
| Notes | Dropouts: 6 participants (computer‐mediated SLT 0, no SLT 6). Dropouts are detailed in Table 7
Across 6 hospitals, 2 community stroke groups across 5 cities Statistical data included within the review meta‐analyses |
|
| Risk of bias | ||
| Bias | Authors' judgement | Support for judgement |
| Random sequence generation (selection bias) | Low risk | Random numbers table |
| Allocation concealment (selection bias) | Unclear risk | Not reported |
| Blinding (performance bias and detection bias) All outcomes | Low risk | Outcomes measured by 1 of 4 speech and language therapists, 95% checked by second speech and language therapist with no knowledge of group allocation |
| Incomplete outcome data (attrition bias) All outcomes | High risk | Dropouts accounted for but ITT analysis not employed |
| Selective reporting (reporting bias) | Low risk | All prespecified outcomes reported |
| Other bias | Unclear risk | Groups were comparable at baseline Sample size calculation not reported |
Katz 1997ii.
| Methods | Parallel group RCT, USA | |
| Participants | Inclusion criteria: single left hemisphere stroke, maximum 85 years, minimum 1 year after stroke, PICA overall between 15th to 90th percentile, premorbidly right‐handed, minimum education 8th grade, premorbidly literate in English, vision no worse than 20/100 corrected, hearing no worse than 40 dB unaided, no language treatment 3 months before entry to study, non‐institutionalised living environment
Exclusion criteria: premorbid psychiatric, reading or writing problems
Group 1: 21 participants
Group 2: 21 participants Details of participants are shown in Table 6 |
|
| Interventions |
1. Computer‐mediated SLT Intervention: "computer reading treatment software". Treatment of reading and writing skills using computers. Isolated practice possible. Minimal responses required. Schuell's stimulation approach. Targeting maximised interaction within challenging tasks. Materials: 32 activities, 232 sequentially arranged visual matching and reading activities from 2‐5 choices. Text characters (letters, numbers, symbols). No pictures. Stimulus in centre of top third of screen. Response choices simultaneously displayed bottom half of screen. Tasks sequential in hierarchy of difficulty. 10 matching activities, 22 reading comprehension tasks with 8 difficulty levels. 4 comprehension tasks had 2 difficulty levels. Matching activities were perceptual visual matching to familiarise patient with software. Reading comprehension stimuli (letters numbers, words, phrases and sentences). Procedures: visual matching and reading comprehension tasks. Speech and language therapist familiarised patient with computer, programme and tasks. Demonstrated response modes. Provided by: 4 therapists but minimal involvement. Supportive functions but not in room. Delivery: computer‐facilitated; 1‐to‐1; SLT dept (2 occasionally at home with support; not clear which group). Regimen (frequency (sessions weekly) x duration): 3 h weekly for 26 weeks. Total dose = 78 h therapy. Tailoring: 4 participants needed additional cues during 1 or more sessions. Each task had a baseline set of 20 tasks. If criterion performance of 80% correct in 3 consecutive baseline tasks then programme proceeded to next task. Typically, movement up and down training hierarchy was controlled automatically by the programme. Modification: each task had a baseline set of 20 tasks. If criterion performance of 80% correct in 3 consecutive baseline tasks then programme proceeded to next task. If criterion performance not reached on baseline then therapist used Editor option to divide baseline 20 items into 2 sets of 10 items. Adherence: therapist monitored attendance and performance. Overall report ‐ participants completed mean of 76.14 tasks (range 1‐167) after computerised treatment. 19 or 21 participants completed at least 40 tasks. 2. Computer‐based cognitive tasks Intervention: computer‐based placebo: computerised cognitive rehabilitation software and arcade‐style games, no language stimulation. Attention control. Materials: animation, shape or colour to focus on reaction time, attention span, memory and other skills that did not overtly require language or other communication abilities. Games were commercially available. Used joystick. Games were golf, puzzles may have had some level of language processing (labelling or planning) but unstructured and incidental. Procedures: commercially available arcade‐style products. Provided by: 4 therapists but minimal involvement. Supportive functions but not in room. Delivery: computer‐based; 1‐to‐1; SLT clinic (2 occasionally at home with support not clear which group). Regimen: 3 h weekly for 26 weeks Tailoring: not reportedModification: not reportedAdherence: therapist monitored attendance and performance. |
|
| Outcomes | Primary outcomes: PICA, WABAQ Data collection: baseline, and 13 and 26 weeks | |
| Notes | Dropouts: 2 participants (computer‐mediated SLT 0; no SLT/computer‐based placebo 2). Dropouts are detailed in Table 7
Across 6 hospitals, 2 community stroke groups across 5 cities Statistical data included within the review meta‐analyses |
|
| Risk of bias | ||
| Bias | Authors' judgement | Support for judgement |
| Random sequence generation (selection bias) | Low risk | Random numbers table |
| Allocation concealment (selection bias) | Unclear risk | Not reported |
| Blinding (performance bias and detection bias) All outcomes | Low risk | Outcomes measured by 1 of 4 speech and language therapists, 95% checked by 2nd speech and language therapist with no knowledge of group allocation |
| Incomplete outcome data (attrition bias) All outcomes | High risk | Dropouts accounted for but ITT analysis not used |
| Selective reporting (reporting bias) | Low risk | All prespecified outcomes reported |
| Other bias | Unclear risk | Groups were comparable at baseline Sample size calculation not reported |
Laska 2011.
| Methods | Parallel group RCT (stratified according to NIHSS result), Sweden | |
| Participants | Consecutive admissions to stroke unit
Inclusion criteria: first ischaemic stroke with aphasia, can start SLT within 2 d of stroke onset
Exclusion criteria: rapid regression, dementia, drug abuse, severe illness, unable to participate in therapy Group 1: 62 participants Group 2: 61 participants Details of participants are shown in Table 6 |
|
| Interventions |
1. SLT (Language Enrichment Therapy) Intervention: "Early Intensive Language Enrichment (Comp) Therapy" (Salonen 1980). Commonly used clinically in Sweden. Mainly comprehension exercises, some naming hierarchy. Materials: pictures divided into 8 sections (in hierarchical difficulty): familiar phrases, compound words, basic sentences, basic words, additional words, descriptive words, standard sentences, and sentences. Procedures: protocol. Provided by: 5 specially trained therapists Delivery: face‐to‐face; 1‐to‐1; location not reported. Regimen: 45 minutes therapy 5 d weekly for 3 weeks. Total dose = 11.25 h (per protocol a minimum of 600 minutes) therapy. Tailoring: not reported. Modification: not reported. Adherence: recorded deviations from per protocol intervention of minimum 600 min of SLT. SLT per protocol 54/59 randomised; no SLT per protocol 51/56 randomised. 2. No SLT Intervention: no SLT Materials: none Procedures: none. Delivery: none over 3 weeks. Could start SLT after 21 d. Regimen: none Modification: none. Adherence: not reported. |
|
| Outcomes | Primary outcome: ANELT (at day 16) Secondary outcome: NGA (at day 16) Other measures include NIHSS, ADL measured at baseline, 3 weeks and 6 months, NGA, ANELT, NHP, EQ‐5D at 3 weeks and 6 months Relatives completed the CETI at 3 weeks and 6 months |
|
| Notes | Funded by the Stockholm County Council Foundation (Expo‐95), Karolinska Institutet, Marianne and Marcus Wallenberg Foundation and AFA Insurances Dropouts: 8 participants (1 died, 4 severely ill, 3 declined) Follow‐up: 21 participants (10 died, 9 severely ill, 1 declined, 1 missing). Dropouts are detailed in Table 7 Statistical data included within the review meta‐analyses |
|
| Risk of bias | ||
| Bias | Authors' judgement | Support for judgement |
| Random sequence generation (selection bias) | Low risk | Centrally randomised by independent statistician Method of sequence generation not reported |
| Allocation concealment (selection bias) | High risk | Consecutively sealed envelopes (opaque not specified) |
| Blinding (performance bias and detection bias) All outcomes | Low risk | 3 therapists blinded to treatment allocation; a fourth also rated recordings blinded to treatment Outcome measures conducted and assessed by blinded speech and language therapists |
| Incomplete outcome data (attrition bias) All outcomes | Low risk | ITT analysis employed |
| Selective reporting (reporting bias) | Low risk | All prespecified outcomes reported |
| Other bias | Unclear risk | SLT had a more frequent history of myocardial infarction than the non‐SLT group Groups were otherwise comparable at baseline A‐priori sample size was calculated |
Leal 1993.
| Methods | Parallel group RCT (stratified by aphasia type), Portugal | |
| Participants | Inclusion criteria: no history of neurological or psychiatric disease, first left stroke (single), first month after stroke, moderate‐severe aphasia, good health, maximum 70 years, residing near hospital with flexible transport
Exclusion criteria: mild aphasia (i.e. AQ above 80% on Test Battery for Aphasia)
Group 1: 59 participants
Group 2: 35 participants Details of participants are shown in Table 6 |
|
| Interventions |
1. Volunteer‐facilitated SLT Intervention: "volunteer facilitated therapy". Rationale not reported. Materials: speech and language therapist provided relatives with information and working material. Procedures: relatives encouraged to stimulate patient as much as possible. Provided by: relatives and volunteers. Therapists provided relatives with information and working material. Delivery: face‐to‐face; 1‐to‐1; home. Regimen (frequency (sessions weekly) x duration): "as much as possible" over 6 months. Total dose of therapy delivered over the intervention not reported. Tailoring: not reported. Modification: not reported. Adherence: not reported what it focused on, but relatives monitored monthly by therapist. Dropout rate recorded. 2. Conventional SLT Intervention: "conventional janguage sessions from a speech therapist". Effectiveness of SLT. Materials: not reported. Procedures: not reported. Provided by: therapist (training not reported). Delivery: 1‐to‐1; Face‐to‐face; out patient clinic. Regimen: 1 h therapy 3 sessions weekly for 6 months. Total dose = 78 h therapy. Tailoring: not reported. Modification: not reported. Adherence: not reported. |
|
| Outcomes | Test Battery for Aphasia created by trialists (reported to have good correlation with WAB) Assessed at baseline and 6 months poststroke | |
| Notes | Dropouts: 34 participants (conventional SLT 21; volunteer‐facilitated SLT 13). Dropouts are detailed in Table 7 Statistical data reported in a manner unsuitable for inclusion within the review meta‐analyses |
|
| Risk of bias | ||
| Bias | Authors' judgement | Support for judgement |
| Random sequence generation (selection bias) | Unclear risk | Not reported |
| Allocation concealment (selection bias) | Unclear risk | Not reported |
| Blinding (performance bias and detection bias) All outcomes | Low risk | Outcome assessor not therapist |
| Incomplete outcome data (attrition bias) All outcomes | High risk | ITT analysis not employed |
| Selective reporting (reporting bias) | Unclear risk | Insufficient information available |
| Other bias | Unclear risk | Groups were comparable at baseline. Sample size calculation not reported |
Lincoln 1982i.
| Methods | Cross‐over RCT (data extracted after completion of cross‐over treatment), UK | |
| Participants | Inclusion criteria: moderate aphasia after stroke, no previous history of brain damage, to attend for a minimum of 8 weeks, PICA overall between 35th to 65th percentile
Exclusion criteria: severely or mildly aphasic
Group 1: 6 participants
Group 2: 6 participants Details of participants are shown in Table 6 |
|
| Interventions |
1. Conventional SLT + operant training Intervention: "conventional SLT + operant training". SLT: aim of improving communication ability. Operant Training: verbal conditioning (based on Goodkin 1966). Materials: not reported. Procedures: SLT: encouraged use of automatic and serial speech, picture‐word/sentence matching, reading, writing, verbal encouragement. Operant training: verbal conditioning procedure (reinforcement, tokens for correct responses, incorrect responses ignored). Provided by: speech and language therapist or clinical psychologist. Qualified therapists provided SLT. Clinical psychologist provided operant training or social support. Delivery: 1‐to‐1; face‐to‐face; rehabilitation inpatients. Regimen: 30 minsession 4 times weekly for 4 weeks followed by another 4 weeks with cross‐over intervention. Total dose = 16 h therapy. Tailoring: hierarchy of tasks. Modification: not reported. Adherence: monitored. Some participants unable to complete full number of sessions. 2. Conventional SLT + social support Intervention: "conventional SLT + social support". SLT: aim of improving communication ability. Materials: not reported. Procedures: SLT: encouraged use of automatic and serial speech, picture‐word/sentence matching, reading, writing, verbal encouragement. Social support: predetermined topics (home, holidays, either, work, home town); participant initiates as able, direct questioning/verbal encouragement given, no attempts to correct responses. Ungraded tasks. Mainly expressive language. Provided by: speech and language therapist or clinical psychologist. Clinical psychologist provided operant training or social support. Delivery: 1‐to‐1; face‐to‐face; rehabilitation inpatients. Regimen: 30 minute session 4 times weekly for 4 weeks followed by 4 weeks with cross‐over intervention. Total dose = 16 h of contact (8 h SLT). Tailoring: SLT yes some based on difficulty of task. Social support: none. Modification: (as described in tailoring). Adherence: monitored. Some participants unable to complete full number of sessions. |
|
| Outcomes | PICA, Token Test (shortened), ONT, word fluency naming tasks, picture description, self rating abilities Assessed at baseline and end of treatment | |
| Notes | Some participants unable to complete full number of sessions (leaving slightly early, insufficient therapist time, holidays occurring during trial)
Dropouts: 13 participants (group allocation not reported). Dropouts are detailed in Table 7 Based on unpublished data, we were able to include statistical data within the review meta‐analyses |
|
| Risk of bias | ||
| Bias | Authors' judgement | Support for judgement |
| Random sequence generation (selection bias) | Low risk | Random numbers table |
| Allocation concealment (selection bias) | High risk | Partial: participants recruited by speech and language therapists then assigned to intervention by trialist |
| Blinding (performance bias and detection bias) All outcomes | Low risk | Outcome assessors blinded |
| Incomplete outcome data (attrition bias) All outcomes | High risk | ITT analysis not employed |
| Selective reporting (reporting bias) | Low risk | All prespecified outcomes reported (unpublished data and personal communication) |
| Other bias | Low risk | Groups were comparable at baseline Sample size calculation not reported |
Lincoln 1982ii.
| Methods | Cross‐over RCT (data extracted after completion of cross‐over treatment), UK | |
| Participants | Inclusion criteria: moderate aphasia after stroke, no previous history of brain damage, to attend for a minimum of 8 weeks, PICA overall between 35th to 65th percentile
Exclusion criteria: severely or mildly aphasic
Group 1: 6 participants
Group 2: 6 participants Details of participants are shown in Table 6 |
|
| Interventions |
1. Operant Training + SLT Intervention: "operant training SLT + conventional SLT". Operant training: verbal conditioning (based on Goodkin 1966). SLT: aim of improving various aspects of communication ability. Materials: not reported. Procedures: SLT: encouraged use of automatic and serial speech, picture‐word/sentence matching, reading, writing, verbal encouragement. Operant training: verbal conditioning procedure (reinforcement, tokens for correct responses, incorrect responses ignored). Provided by: speech and language therapist or clinical psychologist. Qualified therapists provided SLT. Clinical psychologist provided operant training. 1‐to‐1; face‐to‐face; rehabilitation inpatients. Regimen: 30 min session 4 times weekly for 4 weeks followed by another 4 weeks with cross‐over intervention. Total dose = 16 h therapy. Tailoring: hierarchy of tasks. Modification: not reported. Adherence: monitored. Some participants unable to complete full number of sessions. 2. Social Support + SLT Intervention: "social support + conventional SLT". SLT: aim of improving communication ability. Materials: not reported. Procedures: SLT: encouraged use of automatic and serial speech, picture‐word/sentence matching, reading, writing, verbal encouragement. Social Support: therapist conversed with patient about predetermined topics (home, holidays, either, work, home town). 1 topic per session 10 times of info on each topic generated. Ungraded tasks. Mainly expressive language. Provided by: therapist or clinical psychologist. Qualified speech and language therapists each provided SLT. Clinical psychologist provided operant training or social support. Delivery: 1‐to‐1; face‐to‐face; rehabilitation inpatients. Regimen: 30 min session 4 times weekly for 4 weeks followed by 4 weeks with cross‐over intervention. Total dose = 16 h of contact (8 h SLT). Tailoring: SLT yes, some based on difficulty of task. Social support: none. Modification: as described in tailoring. Adherence: monitored. Some participants unable to complete full number of sessions. |
|
| Outcomes | PICA, Token Test (shortened), ONT, word fluency naming tasks, picture description, self rating abilities Assessed at baseline and end of treatment | |
| Notes | Some participants unable to complete full number of sessions (leaving slightly early, insufficient therapist time, holidays occurring during trial)
Dropouts: 13 participants (group allocation not reported) Dropouts are detailed in Table 7 Based on unpublished data we were able to include statistical data included within the review meta‐analyses |
|
| Risk of bias | ||
| Bias | Authors' judgement | Support for judgement |
| Random sequence generation (selection bias) | Low risk | Random numbers table |
| Allocation concealment (selection bias) | High risk | Partial: participants recruited by speech and language therapists then assigned to intervention by trialist |
| Blinding (performance bias and detection bias) All outcomes | Low risk | Outcome assessors blinded |
| Incomplete outcome data (attrition bias) All outcomes | High risk | ITT analysis not employed |
| Selective reporting (reporting bias) | Low risk | All prespecified outcomes reported (unpublished data and personal communication) |
| Other bias | Unclear risk | Groups were comparable at baseline Sample size calculation not reported |
Lincoln 1982iii.
| Methods | Cross‐over RCT (data extracted up to point of cross‐over), UK | |
| Participants | Inclusion criteria: moderate aphasia after stroke, no previous history of brain damage, to attend for a minimum of 8 weeks, PICA overall between 35th to 65th percentile
Exclusion criteria: severely or mildly aphasic
Group 1: 12 participants
Group 2: 6 participants Details of participants are shown in Table 6 |
|
| Interventions |
1. Conventional SLT + operant training Intervention: aim of improving communication ability. Materials: not reported. Procedures: SLT: encouraged use of automatic and serial speech, picture‐word/sentence matching, reading, writing, verbal encouragement. Provided by: qualified therapists. Delivery: 1‐to‐1; face‐to‐face; rehabilitation inpatients. Regimen: 30 min session 4 times weekly for 4 weeks. Total dose = 8 h therapy (before cross‐over) Tailoring: hierarchy of tasks. Modification: not reported. Adherence: monitored. Some participants unable to complete full number of sessions. 2. Social support Intervention: "social support + conventional SLT". SLT: aim of improving communication ability. Materials: not reported. Procedures: SLT: encouraged use of automatic and serial speech, picture‐word/sentence matching, reading, writing, verbal encouragement. Social support: therapist conversed with patient about predetermined topics (home, holidays, either, work, home town). 1 topic per session 10 times of info on each topic generated. Ungraded tasks. Mainly expressive language. Provided by: therapist or clinical psychologist. Qualified speech and language therapists provided SLT. Clinical psychologist provided operant training or social support. Delivery: 1‐to‐1; face‐to‐face; rehabilitation inpatients. Regimen: 30 min session 4 times weekly for 4 weeks. Total dose = 8 h of contact (before cross‐over). Tailoring: none. Modification: none. Adherence: monitored. Some participants unable to complete full number of sessions. |
|
| Outcomes | PICA, Token Test (shortened), ONT, word fluency naming tasks, picture description, self rating abilities Assessed at baseline and end of treatment | |
| Notes | Some participants unable to complete full number of sessions (leaving slightly early, insufficient therapist time, holidays occurring during trial) Based on unpublished data we were able to include statistical data included within the review meta‐analyses |
|
| Risk of bias | ||
| Bias | Authors' judgement | Support for judgement |
| Random sequence generation (selection bias) | Low risk | Random numbers table |
| Allocation concealment (selection bias) | High risk | Partial: participants recruited by speech and language therapists then assigned to intervention by trialist |
| Blinding (performance bias and detection bias) All outcomes | Low risk | Outcome assessors blinded |
| Incomplete outcome data (attrition bias) All outcomes | High risk | ITT analysis not employed |
| Selective reporting (reporting bias) | Low risk | All prespecified outcomes reported (unpublished data and personal communication) |
| Other bias | Unclear risk | Groups were comparable at baseline Sample size calculation not reported |
Lincoln 1984a.
| Methods | Parallel group RCT, UK | |
| Participants | Inclusion criteria: acute stroke, admitted to Nottingham hospital
Exclusion criteria: unable to tolerate full language testing at 10 weeks, very mild aphasia, severe dysarthria
Group 1: 163 participants
Group 2: 164 participants
Data reported: 191 participants
Groups comparable at baseline (age, sex, aphasia types) Details of participants are shown in Table 6 |
|
| Interventions |
1. Conventional SLT Intervention: "speech and language therapy for aphasia (as per therapist judgement)". Materials: subject to individual therapists treatment plans. Procedures: subject to individual therapists treatment plans. Provided by: therapist Delivery: face‐to‐face; 1‐to‐1; in‐hospital or at home. Regimen: 1 h session 2 times weekly for 24 weeks. Total dose 48 h therapy. Tailoring: not reported. Modification: not reported. Adherence: monitored. 0‐12 sessions = 39/104 patients; 13‐14 sessions = 16/104 patients; 25‐36 sessions =22/104 patients; 37‐48 sessions = 27/104 patients. 2. No SLT Intervention: none. Materials: none. Procedures: (deferred SLT offered after trial ceased). Provided by: none. Delivery: none. Regimen: none. Tailoring: not reported. Modification: none. Adherence: none. |
|
| Outcomes | PICA, FCP Secondary outcome: MAACL Assessed at baseline, 12 weeks and at end of treatment at 24 weeks | |
| Notes | Method of randomisation and concealed allocation provided through personal communication with authors of original review
Other hospital treatment given as normal
Not all patients received planned number of sessions mainly due to recovery or withdrawal from treatment
Dropouts: 166 participants (conventional SLT 76; no SLT 90). Dropouts are detailed in Table 7 Statistical data reported unsuitable for inclusion within the review meta‐analyses |
|
| Risk of bias | ||
| Bias | Authors' judgement | Support for judgement |
| Random sequence generation (selection bias) | Low risk | Random numbers table |
| Allocation concealment (selection bias) | Low risk | Sequentially numbered sealed envelopes |
| Blinding (performance bias and detection bias) All outcomes | Low risk | Outcome assessors blinded |
| Incomplete outcome data (attrition bias) All outcomes | High risk | ITT analysis not employed |
| Selective reporting (reporting bias) | Low risk | All prespecified outcomes reported |
| Other bias | Unclear risk | Groups were comparable at baseline Sample size calculation not reported |
Lincoln 1984b.
| Methods | Cross‐over RCT (data extracted up to point of cross‐over), UK | |
| Participants | Inclusion criteria: < 35th percentile of PICA, severe aphasia following stroke, spontaneous speech (few single words), writing limited to copying, poor auditory comprehension, less than average non‐verbal intellectual functioning
Exclusion criteria: none listed
Group 1: 6 participants
Group 2: 6 participants Details of participants are shown in Table 6 |
|
| Interventions |
1. Programmed instruction + operant training + SLT Intervention: "programmed instruction with operant training and SLT". Useful and effective methods that merit further investigation in aphasia intervention. SLT: aim of improving communication ability. Materials: electric board graded language tasks. Matching letters, cards with object names or line drawings of objects. Increasing difficulty based on frequency of use of the word. 13 sets of 6 object names in graded order of difficulty. SLT not reported. Procedures: cards arranged in 13 sets of 6 cards for both names and pictures. Sets representing words of decreasing frequency of occurrence in spoken English. Board lights in response to correct answer plus therapist provides verbal praise; for incorrect answers, there is no light response, therapist shakes head and provides verbal feedback 'no'. Mostly focused on comprehension activities. Provided by: SLT from therapist. Delivery: 1‐to‐1; face‐to‐face; rehabilitation inpatients. Regimen: 30 min session twice weekly for 4 weeks (followed by cross‐over). Total dose = 4 h therapy. Tailoring: task progression based on individual's progress. Modification: (as described in tailoring). Adherence: not reported. 2. Attention control + SLT Intervention: "attention placebo plus SLT". Attention control to programmed instruction with operant training. Materials: not reported. Procedures: non‐verbal tasks (matching, visuospatial tasks, copying, recall of designs, performance scale of WAIS, manual dexterity tasks). Provided by: SLT from therapist. Delivery: 1‐to‐1; face‐to‐face; rehabilitation inpatients. Regimen: 30 min session twice weekly for 4 weeks (followed by cross‐over). Total dose = 4 h SLT. Tailoring: task progression based on individual's progress. Modification: (as described in tailoring). Adherence: not reported. More detail is available from Lincoln NB. An Investigation of the Effectiveness of Language Retraining Methods with Aphasic Stroke Patients [PhD thesis] 1980. |
|
| Outcomes | Outcomes measures: PICA, Token Test, Peabody PVT, ONT Data collection: baseline, 4 weeks then 8 weeks following cross‐over | |
| Notes | The same therapist provided conventional SLT to both groups Based on unpublished data, we were able to include statistical data included within the review meta‐analyses |
|
| Risk of bias | ||
| Bias | Authors' judgement | Support for judgement |
| Random sequence generation (selection bias) | Low risk | Random numbers table |
| Allocation concealment (selection bias) | High risk | Partial: participants recruited by speech and language therapists then assigned to intervention by trialists |
| Blinding (performance bias and detection bias) All outcomes | Unclear risk | Outcome assessor blinded for 1 measure only (PICA) |
| Incomplete outcome data (attrition bias) All outcomes | Low risk | All randomised participants included in analyses |
| Selective reporting (reporting bias) | Low risk | All prespecified outcomes reported (unpublished data and personal communication) |
| Other bias | Unclear risk | Comparisons between group 1 and group 2 showed group 2 performed significantly better on PICA test (reading cards) and copying shapes than group 1 Sample size calculation not reported |
Liu 2006a.
| Methods | Parallel group RCT, People's Republic of China | |
| Participants | Inclusion criteria: first onset aphasia, diagnosis of stroke following a CT scan; impaired language expression or comprehension skills; fully conscious (capable of concentrating for a minimum of 30 min) Exclusion criteria: obvious visual and auditory disturbances prior to onset; emotional lability; dementia; severe hepatic or renal dysfunction Group 1: 19 participants Group 2: 17 participants Details of participants are shown in Table 6 |
|
| Interventions |
1. Conventional SLT plus acupuncture Intervention: "Speech training plus acupuncture". Materials: not reported. Procedures: SLT followed Schuell's stimulation method for psychological care, acupuncture and routine neurological remedies. Provided by: not reported. Delivery: not reported. Regimen (frequency (sessions weekly) x duration): not reported. Tailoring: not reported. Modification: not reported. Adherence: not reported. 2. No SLT No SLT, routine neurological remedies. Intervention: no SLT. Materials: none. Procedures: no SLT only routine neurological remedies. Provided by: none. Delivery: none. Regimen: none. Tailoring: none. Modification: none. Adherence: not reported. |
|
| Outcomes | 'BADE' (sic) (BDAE?) and the CMA neurological branch scoring systems for the assessment of aphasia in Chinese | |
| Notes | ― | |
| Risk of bias | ||
| Bias | Authors' judgement | Support for judgement |
| Random sequence generation (selection bias) | Unclear risk | Not reported |
| Allocation concealment (selection bias) | Unclear risk | Not reported |
| Blinding (performance bias and detection bias) All outcomes | Unclear risk | Not reported |
| Incomplete outcome data (attrition bias) All outcomes | Low risk | All participants appear to have remained in the study |
| Selective reporting (reporting bias) | Low risk | All prespecified outcomes reported |
| Other bias | Unclear risk | Acupuncture was delivered alongside SLT provision
Details of therapy, duration and outcome measurement point(s) lacking Sample size calculation not reported Groups comparable for sex, age, time poststroke and lesion type |
Lyon 1997.
| Methods | RCT, USA | |
| Participants | Inclusion criteria (patient): minimum 1 year after stroke, no bilateral brain damage, ability to ambulate short distances, function independently in primary ADL, English primary language, normal range of cognition, hearing and vision, weekly contact with primary caregiver, history free of psychosis
Inclusion criteria (caregiver): normal cognitive, hearing and vision, no history of psychiatric problems
Exclusion criteria: none reported
Group 1: 21 participants (7 triads)
Group 2: 9 participants (3 triads)
Each triad comprised 1 person with aphasia, 1 caregiver, 1 communication partner. Details of participants are shown in Table 6 |
|
| Interventions |
1. Functionally‐based SLT Intervention: "Communication partners". Aims to restore a sense of purpose, direction and control to daily life for both patient and caregiver. A programme aimed at enhancing communication and well‐being in settings where patient and caregiver live and choose to interact. The plan underscores the viability of communication with a naive normal adult while concurrently strengthening more active, self determined and controlled role in daily life. Increased participation in life provides a much richer experiential base for subsequent communication between caregiver and patient. Life experience provides something to talk about. Rejuvenating the self is shown to be at the core of communication dysfunction. Materials: individualised plausible situations Procedures: 2 Phases; phase A: 6 week long. Establishing effective communication strategies between partner and person with aphasia. phase B: 14 weeks of activities of participant choice. Provided by: community volunteer communication partner. Protocol, examples. Delivery: face‐to‐face; triad (patient, volunteer, caregiver); at home or in community and 1 session, bridge between phase A and phase B, in clinic. Regimen: phase A: 1‐1.5 h twice weekly for 6 weeks; phase B: 1‐2 h session (clinic) plus 2‐4 h session (community) once weekly for 14 weeks. Total dose = not reported, estimated as phase A: 18 h, phase B: up to 110‐128 h therapy. Tailoring: individualised. Modification: individualised. Adherence: daily logs. Actual adherence or fidelity was not reported. 2. No SLT Intervention: no SLT (deferred). Materials: none. Procedures: none. Provided by: none. Delivery: none. Regimen: deferred until after study. Tailoring: none.Modification: none. Adherence: none. |
|
| Outcomes | BDAE, CADL, ABS, Psychological Wellbeing Index, Communication Readiness and Use Index, informal subjective measures Assessed at baseline and post‐treatment | |
| Notes | Some statistical data reported in a manner unsuitable for inclusion within the review meta‐analyses | |
| Risk of bias | ||
| Bias | Authors' judgement | Support for judgement |
| Random sequence generation (selection bias) | Unclear risk | Not reported |
| Allocation concealment (selection bias) | Unclear risk | Not reported |
| Blinding (performance bias and detection bias) All outcomes | High risk | Outcome assessors inadequately blinded |
| Incomplete outcome data (attrition bias) All outcomes | Unclear risk | All randomised participants appear to have been included in analyses, but it is not reported |
| Selective reporting (reporting bias) | Low risk | All prespecified outcomes reported |
| Other bias | Unclear risk | Comparability of groups at baseline not reported. Sample size calculation not reported |
MacKay 1988.
| Methods | Parallel group RCT, USA | |
| Participants | Inclusion criteria: minimum age 30 years, poststroke aphasia, minimum 6 months postonset, living within 50 mile (80 km) radius of hospital/specified geographical area
Exclusion criteria: none listed
96 participants in total: division between groups not reported Details of participants are shown in Table 6 |
|
| Interventions |
1. Volunteer‐facilitated SLT Intervention: "Community Stroke Study". Community volunteers facilitated SLT language and social stimulation. Materials: not reported. Procedures: not reported. Provided by: community volunteers. Trained by nurses and therapist. Delivery: face‐to‐face; 1‐to‐1; institutional and non‐institutional settings. Regimen: 3‐6 h once weekly for 1 year. Total dose = up to 312 h therapy. Tailoring: not reported. Modification: not reported. Adherence: not reported. 2. No SLT Intervention: no SLT. Materials: none Procedures: none. Provided by: none. Delivery: none. Regimen: deferred until after study. Tailoring: none.Modification: none. Adherence: none. |
|
| Outcomes | CADL, trialist assessment measuring social/interpersonal skills, structured questionnaires assessing economic, medical and demographic factors (completed by caregivers/family members) Assessed at baseline, 6, 12, 18 and 24 months | |
| Notes | Participants continued individual medical/nursing care
Dropouts: 1 (No SLT group). Dropouts are detailed in Table 7 Statistical data reported in a manner unsuitable for inclusion within the review meta‐analyses |
|
| Risk of bias | ||
| Bias | Authors' judgement | Support for judgement |
| Random sequence generation (selection bias) | Unclear risk | Not reported |
| Allocation concealment (selection bias) | Unclear risk | Not reported |
| Blinding (performance bias and detection bias) All outcomes | Low risk | Outcome assessors blinded |
| Incomplete outcome data (attrition bias) All outcomes | High risk | ITT analysis not employed |
| Selective reporting (reporting bias) | High risk | No data for the prespecified outcomes were reported in the paper |
| Other bias | Unclear risk | Comparability of groups at baseline not reported Sample size calculation not reported |
Mattioli 2014.
| Methods | RCT, Italy | |
| Participants | Inclusion criteria: first ever acute stroke in the territory of the MCA; aphasia with mildly impaired oral comprehension, that is, comprehension sufficient to perform a screening task of the fMRI paradigm; native Italian speakers; right‐handed, absence of previous history of other neurological or psychiatric diseases; absence of general contraindications to MRI; age < 80 years; absence of hearing deficits; mild/moderate aphasia
Exclusion criteria: non‐native Italian speakers (N=6); age > 80 (N=19); previous diagnosis of dementia or psychiatric disorders (N=8); stroke in the territory other of the MCA (N=21); severe aphasia with severe comprehension impairment (N=7); pacemaker carriers (N=6); claustrophobia (N=2); severe obesity, i.e. impossibility to put the patient in the MRI scanner (N=1) and deafness (N=4).
Group 1: 6 participants
Group 2: 6 participants Details of participants are shown in Table 6 |
|
| Interventions |
1. Daily language rehabilitation Intervention: SLT. Daily language rehab leads to improved language recovery and improved functional correlates, brain plasticity. Materials: Snodgrass and Vanderwart (1980) set (Snodgrass 1980). Procedures: mainly focusing on verbal comprehension and lexical retrieval. In each session, after a short and simple dialogue with the patient, covering his mood and status, as well as any relevant episodes occurred during the day, a naming task was usually conducted, where patients had to spontaneously name items taken from the Snodgrass and Vanderwart (1980) set (Snodgrass 1980). In the case of failure, all the facilitations were given. Single word as well as sentence comprehension was also treated with the help of available common objects and objects pictures. A semi‐structured rehabilitation setting was used, instead of a rigidly predetermined set of tasks identical for all the subjects, due to the clinical condition of the acute phase and the location (the stroke unit) where the rehabilitation was conducted. Generally, a stimulation of the impaired linguistic functions was conducted by the therapist, according to the deficits shown by the AAT. Provided by: speech and language therapists. Training not reported. Delivery: 1‐to‐1, face‐to‐face; location not reported. Regimen: 1 h session per day, for 5 d per week for 2 weeks. Total dose = 10 h therapy. Tailoring: yes. Modification: yes. Adherence: not reported. 2. No SLT Intervention: no SLT. As per usual clinical practice in that centre. But all exposed to the natural speech environment of people they were visited, and this could be considered an unstructured language therapy. Materials: none. Procedures: none. Provided by: none. Delivery: none. Regimen: none. Tailoring: none. Modification: none. Adherence: none. |
|
| Outcomes | Primary outcomes: Aachen Aphasia Test (AAT) Secondary outcomes: AAT subtests of repetition, naming, reading, writing, oral, and written comprehension; a 50‐item version of the Token test; and a semi‐quantitative scoring of several aspects of spontaneous speech (communicative ability, articulation and prosody, automatic speech, semantic, phonemic, and syntactic structure). Data collection: baseline (T1: mean (SD), 2.2 (1.3) d after stroke), 2 weeks poststroke (T2: 16.2 (1.3) d after stroke). Follow‐up 6 months (T3: 190.0 (25.5) d after stroke). |
|
| Notes | Statistical data included within the review meta‐analyses Dropouts are detailed in Table 7 |
|
| Risk of bias | ||
| Bias | Authors' judgement | Support for judgement |
| Random sequence generation (selection bias) | Low risk | Random number generator |
| Allocation concealment (selection bias) | High risk | Inadequate |
| Blinding (performance bias and detection bias) All outcomes | Low risk | Speech and language therapist blinded |
| Incomplete outcome data (attrition bias) All outcomes | Low risk | Dropouts accounted for |
| Selective reporting (reporting bias) | Low risk | All prespecified outcomes reported |
| Other bias | Low risk | Groups were comparable at baseline in terms of age, education, aphasia severity, lesion volume, NIHSS |
Meikle 1979.
| Methods | Parallel group RCT, UK | |
| Participants | Inclusion criteria: aphasia after stroke, minimum 3 weeks after stroke
Exclusion criteria: none listed
Group 1: 15 participants
Group 2: 16 participants Details of participants are shown in Table 6 |
|
| Interventions |
1. Volunteer‐facilitated SLT Intervention: "volunteer‐facilitated SLT". Efficient resource use. Materials: volunteers given basic background to aphasia, standard items of SLT equipment, initial and ongoing support and advice, encouraged to use initiative and ingenuity in developing therapeutic techniques. Procedures: SLT provided explanations to volunteers of nature of patient's disability, and test results indicated treatment focus with verbal, gestural and graphic tasks determining treatment strategy. Provided by: recruited volunteers (via newspapers, word of mouth). Included housewives, students, secretaries, retired nurse, postman. All passed interview. Introductory course (stroke, aphasia) and film. Each patient assigned 4 volunteers for 4 home visits weekly. Delivery: face‐to‐face; 1‐to‐1 and group; home (group sessions in rehab centre). Regimen: 4 home visits weekly plus group sessions for a mean of 20.8 (SD 13.5; range 2‐46) weeks. Varied. Participants remained in trial until 2 successful estimations on PICA showed no appreciable improvement, they requested withdrawal, or until end of trial in December 1978. Participants who plateaued exited trial and counted as successes. Tailoring: individualised therapy based on PICA results. Modification: not reported. Adherence: attendance recorded by therapists and volunteers. Not all documentation available at study end. 2 from volunteer group failed to complete treatment programme and excluded from analyses. 2. Conventional SLT Intervention: conventional SLT. Materials: chosen by speech and language therapist (no details). Procedures: as provided by qualified speech and language therapist. Provided by: speech and language therapist. Delivery: face‐to‐face; 1‐to‐1 and group; hospital. Regimen: 45 min session 3‐5 times weekly plus group sessions for a mean of 37.13 (SD 21.89; range 7 to 84) weeks. But varied, participants remained in trial until 2 successful estimations on PICA showed no appreciable improvement, they requested withdrawal or until end of trial. Participants who plateaued exited trial and counted as successes. Tailoring: not reported. Modification: not reported. Adherence: attendance recorded by therapists and volunteers. 5 participants missed up to half their possible treatments (illness, holidays, transport difficulties). |
|
| Outcomes | PICA Assessed at baseline and at 6‐week intervals until end of trial Wolfson Test (unpublished) (comprehension, verbal expression, writing, spelling) Assessed at baseline, after 3 months and at end of treatment | |
| Notes | In the conventional SLT group 5 participants missed up to half their possible treatments (illness, holidays, transport difficulties)
Unclear whether volunteer supervisor was a speech and language therapist
Participants remained in trial until 2 successful estimations on PICA showed no appreciable improvement, they requested withdrawal or until end of trial in December 1978
Participants who plateaued exited trial and counted as successes
Dropouts: 2 (conventional SLT, 0; volunteer‐facilitated SLT, 2). Dropouts are detailed in Table 7 Statistical data included within the review meta‐analyses |
|
| Risk of bias | ||
| Bias | Authors' judgement | Support for judgement |
| Random sequence generation (selection bias) | Unclear risk | Not reported |
| Allocation concealment (selection bias) | Unclear risk | Not reported |
| Blinding (performance bias and detection bias) All outcomes | High risk | Outcome assessor not blinded |
| Incomplete outcome data (attrition bias) All outcomes | High risk | ITT analysis not employed |
| Selective reporting (reporting bias) | Low risk | All prespecified outcomes reported |
| Other bias | Unclear risk | Group that received conventional SLT had more weeks in the trial than the volunteer‐facilitated SLT group In the conventional SLT group, 5 participants missed up to half their possible treatments (illness, holidays, transport difficulties) Sample size calculation not reported |
Meinzer 2007.
| Methods | Parallel group RCT, Germany | |
| Participants | Inclusion criteria: 1 or more participating relative, single left hemisphere stroke, aphasia, minimum 6 months postonset, globally aphasic if residual expressive language, i.e. repeat short phrases
Exclusion criteria: none listed
Group 1: 10 participants (4 subgroups)
Group 2: 10 participants (4 subgroups) Details of participants are shown in Table 6 |
|
| Interventions |
1. Volunteer‐facilitated SLT Intervention: "volunteer‐facilitated constraint‐induced SLT". Intensive therapy more effective, but high personnel and financial costs. Lay people can be trained to provide. Materials: communicative language games, pairs of cards depicting objects, everyday situations or words. Therapy materials provided by psychologist. Procedures: screens between the participants prevents seeing each others cards; participant must choose a card from their own set and ask for the identical card from another participant; can be adjusted to target different levels of language complexity. Gestures permitted. Provided by: volunteer relatives (where 2 or more relatives were available they alternated each day). Received 2 h introduction to constraint‐induced SLT; supervised during first 2 of 10 sessions by experienced therapist; following 8 sessions experts were available, further group training sessions at end of each daily training session. Delivery: group; face‐to‐face; location not reported. Regimen: 3 h therapy daily for 10 consecutive working days. Total dose = 30 h therapy. Tailoring: some adjustment of individual task difficulty. Modification: adjustments described in treatment protocol, performance requirements, reinforcements, complexity of card sets. Adherence: all randomised participants completed study and analysed. 2. Conventional SLT Intervention: "constraint‐induced aphasia therapy (Psychologist Facilitated)". Rationale not reported. Materials: communicative language games, pairs of cards depicting objects, everyday situations or words. Procedures: screens between the participants prevents seeing each others' cards; participant must choose a card from their own set and ask for the identical card from another participant; can be adjusted to target different levels of language complexity. Gestures permitted. Provided by: experienced psychologists. Delivery: group; face‐to‐face; location not reported. Regimen: 3 h therapy daily for 10 consecutive working days. Total dose = 30 h therapy. Tailoring: some adjustment of individual task difficulty. Modification: adjustments described in treatment protocol, performance requirements, reinforcements, complexity of card sets. Adherence: all randomised participants completed study and analysed. |
|
| Outcomes | Primary outcomes: AAT (Token Test, repetition, written language, naming, comprehension) Data collection: assessed at baseline and immediately post‐treatment | |
| Notes | 1 participant in each group had mild apraxia of speech Statistical data included within the review meta‐analyses |
|
| Risk of bias | ||
| Bias | Authors' judgement | Support for judgement |
| Random sequence generation (selection bias) | Unclear risk | Not reported |
| Allocation concealment (selection bias) | Unclear risk | Not reported |
| Blinding (performance bias and detection bias) All outcomes | Low risk | Outcome assessor blinded |
| Incomplete outcome data (attrition bias) All outcomes | Low risk | All randomised participants included in analyses |
| Selective reporting (reporting bias) | Low risk | All prespecified outcomes reported |
| Other bias | Unclear risk | Participants receiving constraint‐induced SLT were younger than those in the trained volunteers group Sample size calculation not reported |
MIT 2014i.
| Methods | RCT, Netherlands | |
| Participants | Inclusion criteria: aphasic after left hemisphere stroke, time poststroke 2‐3 months, premorbidly right‐handed, age 18‐80 years, native language Dutch, and MIT candidate. MIT candidacy was based on the MIT literature and defined as follows: nonfluent aphasia (< 50 ords/min), articulation deficits (Aachen Aphasia Test (AAT), subscore spontaneous language ≤ 3), repetition severely affected (AAT subtest repetition ≤ 100), and moderate to good auditory language comprehension (AAT subtest auditory comprehension ≥ 33); functional comprehension ≥ 5)
Exclusion criteria: prior stroke resulting in aphasia, bilateral lesion, intensive MIT prior to start of the study, severe hearing deficit, and psychiatric history relevant to language communication
Group 1: 16 participants
Group 2: 11 participants Details of participants are shown in Table 6 |
|
| Interventions |
1. MIT Intervention: MIT. Critical role of rhythm and formulaic language in MIT contribution of the right hemisphere is still not reported: some report increased right hemisphere activation related to MIT success. Others suggest that MIT‐induced language recovery is related to reactivation of left perilesional regions. Materials: set of utterances of increasing complexity to be trained. The first utterances in frequent use in daily life communication (e.g. "coffee please"). Later the utterances became longer, more complex, and less frequent in daily life. In addition, the patient composed a set of self chosen utterances that were functionally relevant to them (e.g. relating to hobbies). Home practice included ‐ iPod application containing short videos of a mouth singing the target utterances; patients could sing along with the video or repeat the utterance afterwards. Procedures: MIT following the American manual. The patient and the therapist sang short utterances together, while handtapping the rhythm. Gradually, the support from the therapist decreased and singing was replaced by speaking. A minimum of 50% of the therapy time was spent on the utterances provided. Provided by: speech and language therapists experienced in language rehabilitation. All trained to deliver MIT according to protocol. Delivery: 1‐to‐1, face‐to‐face, delivered in the rehabilitation centre or nursing home with rehabilitation facilities. Regimen: 6 weeks; 5 h/week (minimum face‐to‐face time 3 h/week). Total dose = 30 h of therapy. Tailoring: yes, based on selection of functionally relevant target utterances. Modification: yes, as above. Adherence: PI contacted the speech and language therapists at least once a week and asked them about what they were doing during therapy, patient acceptability, and if they had any questions or encountered problems. Speech and language therapists also were free to contact the PI whenever they had questions. 2. Control SLT Intervention: control SLT. Not aiming at language production. Used linguistic tasks often trained in severe nonfluent aphasia (e.g. written language production, language comprehension, and nonverbal communication strategies). Materials: home assignments included paper‐and‐pencil tasks (e.g. written sentence completion, word–picture matching, and word categorising tasks). Procedures: did not emphasise spoken output. Focused on other linguistic modalities usually trained in severe nonfluent aphasia (writing, language comprehension, nonverbal communication strategies). Spoken output was not discouraged but the therapists did not provide feedback regarding patients' verbal production and offered no structural training of language production. Provided by: speech and language therapists. Therapists delivering the control SLT received a protocol of what was permitted and what was not, as well as a manual containing practice materials and references that could be used. PI also helped create tailor‐made tasks for a specific patient. Delivery: 1‐to‐1, face‐to‐face, delivered in the rehabilitation centre or nursing home with rehabilitation facilities. Regimen: 6 weeks; 5 h/week (minimum face‐to‐face time 3 h/week). Total dose = 30 h of therapy. Tailoring: individualised therapy Modification: not reported. Adherence: PI contacted the speech and language therapists at least once a week, and asked them about what they were doing during therapy, patient acceptability, and if they had any questions or encountered problems. Speech and language therapists also were free to contact the PI whenever they had questions. |
|
| Outcomes | Primary outcomes: Content Info Units (CIU) in Sabadel Story retelling task Secondary outcomes: ANELT, AAT (repetition and naming subtests); MIT repetition task, Semantic Association Task Data collection: baseline, and post‐treatment (6 weeks). No follow‐up (see phase 2 of RCT MIT 2014ii) |
|
| Notes | Dropouts are detailed in Table 7 Statistical data included within the review meta‐analyses |
|
| Risk of bias | ||
| Bias | Authors' judgement | Support for judgement |
| Random sequence generation (selection bias) | Low risk | Computer‐generated |
| Allocation concealment (selection bias) | Low risk | Consecutively numbered sealed opaque envelopes |
| Blinding (performance bias and detection bias) All outcomes | Unclear risk | Researchers administering and scoring the assessments at each test moment were blinded for group allocation. In a few cases, blinding could not be maintained because the patients spontaneously informed the researcher about their therapy allocation |
| Incomplete outcome data (attrition bias) All outcomes | Low risk | ITT analysis employed |
| Selective reporting (reporting bias) | Low risk | All prespecified outcomes reported |
| Other bias | Unclear risk | Groups comparable at baseline in terms of age, time poststroke, education and aphasia severity scores, handedness. Imbalance in sex (signif (P = 0.045) more males in control SLT group than MIT) Power calculation reported |
MIT 2014ii.
| Methods | Active parallel RCT, Netherlands | |
| Participants | Inclusion criteria: aphasic after left hemisphere stroke, time poststroke 2‐3 months, premorbidly right‐handed, age 18‐80 years, native language Dutch, and MIT candidate. MIT candidacy was based on the MIT literature and defined as follows: nonfluent aphasia (< 50 ords/min), articulation deficits (Aachen Aphasia Test (AAT), subscore spontaneous language ≤ 3), repetition severely affected (AAT subtest repetition ≤ 100), and moderate to good auditory language comprehension (AAT subtest auditory comprehension ≥ 33); functional comprehension ≥ 5)
Exclusion criteria: prior stroke resulting in aphasia, bilateral lesion, intensive MIT prior to start of the study, severe hearing deficit, and psychiatric history relevant to language communication
Group 1: 16 participants
Group 2: 11 participants Details of participants are shown in Table 6 |
|
| Interventions |
1. MIT Early + SLT Intervention: MIT (as descirbed in MIT 2014i above) followed by access to conventional SLT.Provided by: speech and language therapists experienced in language rehabilitation trained to deliver MIT according to protocol. Delivery: 1‐to‐1, face‐to‐face, delivered in the rehabilitation centre or nursing home with rehabilitation facilities. Regimen: 6 weeks (5 h/week; minimum face‐to‐face time 3 h/week) of MIT followed by 6 weeks of conventional SLT. Total dose = 30 h of MIT followed by SLT (not possible to record the dose and intensity). Tailoring: yes, selection of functionally relevant target utterances. Modification: yes, degree, based on selection of functionally relevant target utterances. Adherence: conventional therapy was delivered in a pragmatic manner and was not dictated by the trial. 2. Control SLT + Delayed MIT: Intervention: control SLT(as descirbed in MIT 2014i above) followed by MIT (as descirbed in MIT 2014i above). Regimen: 6 weeks (5 h per week; minimum face‐to‐face time 3 h/week) of Control SLT followed by 6 weeks of MIT.Total dose = 60 h of therapy Tailoring: yes, selection of functionally relevant target utterances. Modification: yes, degree, based on selection of functionally relevant target utterances. Adherence: PI contacted the speech and language therapists who were giving MIT or control therapy at least once a week, and asked them about what they were doing during therapy, whether they thought the patient liked it or not, and if they had any questions or encountered problems. Speech and language therapists also were free to contact the PI whenever they had questions. |
|
| Outcomes | Primary outcomes: Content Info Units (CIU) in Sabadel Story retelling task Secondary outcomes: ANELT, AAT (repetition and naming subtests); MIT repetition task, Semantic Association Task Data collection: baseline, and post‐treatment (at 12 weeks) |
|
| Notes | Dropouts are detailed in Table 7 Statistical data included within the review meta‐analyses |
|
| Risk of bias | ||
| Bias | Authors' judgement | Support for judgement |
| Random sequence generation (selection bias) | Low risk | Computer‐generated |
| Allocation concealment (selection bias) | Low risk | Consecutively numbered sealed opaque envelopes |
| Blinding (performance bias and detection bias) All outcomes | Unclear risk | Researchers administering and scoring the assessments at each test moment were blinded for group allocation. In a few cases, blinding could not be maintained because the patients spontaneously informed the researcher about their therapy allocation |
| Incomplete outcome data (attrition bias) All outcomes | Low risk | ITT analysis employed |
| Selective reporting (reporting bias) | Low risk | All prespecified outcomes reported |
| Other bias | Unclear risk | Groups comparable at baseline in terms of age, time poststroke, education and aphasia severity scores, handedness. Imbalance in sex (signif (P = 0.045) more males in control SLT group than MIT) Power calculation reported |
NARNIA 2013.
| Methods | RCT, Australia | |
| Participants | Inclusion criteria: neurologically stable, had no previous aphasia or progressive cognitive difficulties, were proficient in English prior to their stroke and, where apraxia or dysarthria was present, these were mild and not their primary area of difficulty
Exclusion criteria: severe aphasia, anomia, apraxia or dysarthria; cognitive difficulties e.g. dementia; incapacity to provide informed consent; non‐use of English in everyday communication
Group 1: 8 participants
Group 2: 6 participants Details of participants are shown in Table 6 |
|
| Interventions |
1. Narrative Intervention: NARNIA. Therapy directly targets discourse organisation to support earlier levels of language production and improve discourse production. Materials: narrative production using published picture sequences (Toomey's 'Sequence Plus', 1992) focusing initially on identifying the main event(s), production of relevant verb and nouns and creating a complete argument structure. Functionally relevant materials were chosen e.g. planning a holiday, shaving. A framework for narrative discourse, based on story grammar, was introduced, and the sentences organised around "setting the scene" (the beginning), "the events taking place" (the middle), and "concluding the story" (the end). Following sucess in use of the narrative framework, other discourse genre frameworks (recount, procedure and exposition) were used. Mind‐mapping was used to populate discourse frameworks and link ideas, events and words which in turn supported discourse structre and organisation. Use of visual prompts was gradually decreased as therapy progressed. Some pictorial resources were used to stimulate opinions (e.g. Skills for Daily Living: Social Behaviour, Speechmark, 2002), most topics were prompted from personal experiences. Procedures: metalinguistic approach to increase awareness of both sentence and discourse structure, at all times focusing attention on the word, sentence and discourse levels. Drew on developmental frameworks for discourse production used in the pedagogy of oral and written language. Word, sentence and discourse levels were integrated to increase metalinguistic awareness of specific microstructure elements of language, followed by frameworks for macrostructure that were used to scaffold the production of discourse across a range of everyday discourse genres. Once the principles of coherence were in place, cohesive devices were targeted. Self evaluation of performance was employed after each attempt using a visual scale that required self‐monitoring of performance on 7 different indices including success at finding nouns and verbs, to completing sentences, to structural components of the discourse sample, and overall clarity of the sample. Provided by: 2 speech and language therapists. Speech and language therapist professional and trial training. Delivery: 1‐to‐1, face‐to‐face, delivered predominantly within a clinical setting as most participants were inpatients at a rehabilitation hospital or attended outpatient services. In some instances, sessions were delivered in the participant's home. Regimen: 20 individual treatment sessions delivered, with few exceptions, 4 times weekly, over 5 weeks. Total dose = 20 h of therapy. In a small number of cases, participants could not commit to 4 x weekly sessions (over 5 weeks). Sessions were then spread over a longer period of time, e.g. 20 sessions delivered 3 times weekly over a (nearly) 7 week period. Tailoring: yes. Modification: the protocol was adhered to for each participant. Minor variations were permitted in delivery according to individual differences, e.g. more prompts could be provided in the presence of comprehension difficulties, greater elaboration of topics could be encouraged when participants were less severe to maintain motivation, visual templates could be faded out more quickly if participants showed a disinclination to them, but all core elements of the protocol were included. Adherence: regular discussion and recording a proportion of sessions on video to monitor adherence to the treatment protocol. Actual adherence: no instances of non‐adherence were noted in the sessions reviewed. The clinicians engaged in regular and informal reflection of delivery of the intervention. Client rating forms on their performance on all core elements of the protocol from each session that demonstrated that all components of the protocol had been focused on. 2. Conventional SLT Intervention: conventional SLT. Therapy focusing on training specific deficits. Materials: any SLT routinely used in clinical practice. Access to all assessment data with the exception of the Curtin University Discourse Protocol (CUDP) data. Procedures: based on usual practice procedures around goal setting ‐ exercises including sentence completion, improving patients' retrieval of words, learning sentence patterns, conversation on current topics, listening, to words, and repeating and following instructions. The therapist initiated the communicative activities. The aimed to target several modes of communication. Participants were permitted to use any communication mode, including non‐verbal communication. aimed to improve word or sentence production, reading, writing or more functional activities that frequently drew on several domains. Discourse could be included in usual care as a context for generalisation of therapy targets. Provided by: speech and language therapists. Training not reported. Delivery: 1‐to‐1, face‐to‐face, delivered predominantly within a clinical setting as most participants were inpatients at a rehabilitation hospital or attended outpatient services. In some instances, sessions were delivered in the participant's home. Regimen: 20 individual treatment sessions delivered, with few exceptions, 4 times weekly, over 5 weeks. Total dose = 20 h of therapy. In a small number of cases, participants could not commit to 4 x weekly sessions (over 5 weeks). Sessions were then spread over a longer period of time, e.g. 20 sessions delivered 3 times weekly over a (nearly) 7‐week period.Tailoring: yes, individualised to patient needs. Modification: the protocol was adhered to for each participant. Minor variations were permitted in delivery according to individual differences, e.g. more prompts could be provided in the presence of comprehension difficulties, greater elaboration of topics could be encouraged when participants were less severe to maintain motivation, visual templates could be faded out more quickly if participants showed a disinclination to them, but all core elements of the protocol were included. Adherence: regular discussion and recording a proportion of sessions on video to monitor adherence to the treatment protocol. Actual adherence: no instances of non‐adherence were noted in the sessions reviewed. The clinicians engaged in regular and informal reflection of delivery of the intervention. Client rating forms on their performance on all core elements of the protocol from each session that demonstrated that all components of the protocol had been focused on. |
|
| Outcomes | Primary outcomes: Curtin University Discourse Protocol at word, sentence and discourse performance levels across 4 discourse genre Secondary outcomes: WAB‐R: bedside; and conceptual semantics (nouns – Pyramid and Palmtrees Test); verbs – Kissing and Dancing Test; Object and Action naming Battery Druks 2000, Northwestern Test of Verbs and Sentences (NAVS) (verb comprehension and verb naming subtests). Sentence level measures. NAVS Sentence Comprehension Test. Argument Structure Production Test of the NAVS (with and without lexical support) (Thompson 2011), Sentence Generation Test Data collection: baseline, and postintervention (at 5 weeks). Follow‐up at 4 to 5 weeks |
|
| Notes | Statistical data included within the review meta‐analyses | |
| Risk of bias | ||
| Bias | Authors' judgement | Support for judgement |
| Random sequence generation (selection bias) | Low risk | Computerised random numbers |
| Allocation concealment (selection bias) | Low risk | Adequate. Conducted offsite by a person independent to the research team |
| Blinding (performance bias and detection bias) All outcomes | Low risk | 2 experienced independent assessors who remained blind to treatment allocation |
| Incomplete outcome data (attrition bias) All outcomes | Low risk | No dropouts |
| Selective reporting (reporting bias) | Low risk | All prespecified outcomes reported |
| Other bias | Low risk | Groups comparable at baseline |
ORLA 2006.
| Methods | RCT, USA | |
| Participants | Inclusion criteria: right‐handed, non‐fluent aphasia, single left ischaemic stroke at least 6 months postonset
Exclusion criteria: none listed
Group 1: 6 participants
Group 2: 7 participants A non‐randomised third group that acted as a control group was also included in the study report but was excluded from this review Details of participants are shown in Table 6 |
|
| Interventions |
1. High‐intensity SLT Intervention: Oral Reading for Language in Aphasia (ORLA) Virtual therapist that people can use independently to recover or relearn language. Materials: based on neuropsychological models of reading. Connected discourse, 4 levels of difficulty based on length and reading level. Procedures: repeated practice of reading aloud sentences. Provided by: virtual therapist and RA to support technology set up and some social interaction. Delivery: computer facilitated; 1‐to‐1; aphasia clinic (outpatient). Regimen: 10 h therapy weekly for 6 weeks. Total dose = 60 h therapy. Tailoring: selection of appropriate levels of difficulty for individual participants. Modification: clear protocol of progressive levels of difficulty. Adherence: not reported. 2. Low‐intensity SLT Intervention: Oral Reading for Language in Aphasia (ORLA) Virtual therapist that people can use independently to recover or relearn language. Materials: based on neuropsychological models of reading. Connected discourse, 4 levels of difficulty based on length and reading level. Procedures: repeated practice of reading aloud sentences. Provided by: virtual therapist and RA to support technology set up and some social interaction. Delivery: face‐to‐face; 1‐to‐1 and group; aphasia clinic (outpatient). Regimen: 4 h weekly for 6 weeks. Total dose = 24 h therapy. Tailoring: selection of appropriate levels of difficulty for individual participants. Modification: clear protocol of progressive levels of difficulty. Adherence: not reported. |
|
| Outcomes | Primary outcome: WABAQ Data collection: baseline and treatment end (6 weeks) |
|
| Notes | Statistical data included within the review meta‐analyses | |
| Risk of bias | ||
| Bias | Authors' judgement | Support for judgement |
| Random sequence generation (selection bias) | Unclear risk | Not reported |
| Allocation concealment (selection bias) | Unclear risk | Not reported |
| Blinding (performance bias and detection bias) All outcomes | Unclear risk | Not reported |
| Incomplete outcome data (attrition bias) All outcomes | Low risk | All randomised participants included in analyses |
| Selective reporting (reporting bias) | Low risk | All prespecified outcomes reported |
| Other bias | Unclear risk | Groups seem to be comparable at baseline Sample size calculation not reported |
ORLA 2010.
| Methods | RCT, USA | |
| Participants | Inclusion criteria: chronic aphasia (> 12 months), single left ischaemic stroke, non‐fluent aphasia, right‐handed, 12th grade education, visual acuity no worse than 20.100 corrected in the better eye, auditory acuity no worse than 30 dB HL at 500, 1000, 2000 Hz aided in the better ear
Exclusion criteria: global aphasia
Group 1: 11 participants
Group 2: 14 participants Details of participants are shown in Table 6 |
|
| Interventions |
1. Computer‐facilitated SLT Intervention: "Oral Reading for Language in Aphasia". Virtual therapist that people can use independently to recover or relearn language. Material based on neuropsychological models of reading. Materials: connected discourse, 4 levels of difficulty based on length and reading level. Procedures: repeated practice of reading aloud sentences. The person with aphasia systematically and repeatedly reads aloud sentences and paragraphs, first in unison with the clinician and then independently Provided by: virtual therapist and research assistant to support technology set up and some social interaction Delivery: computer facilitated; 1‐to‐1; aphasia clinic (outpatient). Regimen: 1 h therapy, 2‐3 times week, for total of 24 sessions (mean 11.4 weeks) (range 6 to 16 weeks). Total dose = 24 h therapy. Tailoring: selection of appropriate levels of difficulty for individual participants. Modification: clear protocol of progressive levels of difficulty. Adherence: all randomised participants included in analyses. 2. Therapist‐facilitated SLT Intervention: "Therapist‐facilitated SLT". Rationale not reported. Materials: neuropsychologically based connected discourse, 4 levels of difficulty based on length and reading level. Procedures: the person with aphasia systematically and repeatedly reads aloud sentences and paragraphs, first in unison with the clinician. Provided by: speech and language therapist. Delivery: 1‐to‐1, face‐to‐face, aphasia centre. Regimen: 1 h therapy, 2‐3 times per week, for up to 24 sessions (mean 13.31 weeks, range 9 to 22 weeks). Total dose = 24 h therapy. Tailoring: selection of appropriate levels of difficulty for individual participants. Modification: clear protocol of progressive levels of difficulty. Adherence: all randomised participants included in analyses |
|
| Outcomes | Primary outcomes: WABAQ, WAB‐reading, WAB‐writing, discourse content information units per minute, discourse words per minute Data collection: baseline (and again pre‐treatment), post‐treatment |
|
| Notes | Statistical data included within the review meta‐analyses | |
| Risk of bias | ||
| Bias | Authors' judgement | Support for judgement |
| Random sequence generation (selection bias) | Unclear risk | Not reported |
| Allocation concealment (selection bias) | Unclear risk | Not reported |
| Blinding (performance bias and detection bias) All outcomes | Unclear risk | Not reported |
| Incomplete outcome data (attrition bias) All outcomes | Low risk | All randomised participants included in analyses |
| Selective reporting (reporting bias) | Low risk | All prespecified outcomes reported |
| Other bias | Low risk | Sample size calculation not reported Groups were comparable at baseline by age, time postonset and aphasia severity |
Prins 1989.
| Methods | Parallel group RCT, Netherlands | |
| Participants | Inclusion criteria: unilateral left CVA, minimum 3 months postonset, < 80% on auditory comprehension test, good prognosis for auditory comprehension per SLT, motivated and fit for participation
Exclusion criteria: none listed
Group 1: 10 participants
Group 2: 11 participants Details of participants are shown in Table 6 |
|
| Interventions |
1. Task specific SLT Intervention: "Systematic Therapy Programme for Auditory Comprehension Disorders (STACDAP) SLT". Treatment for auditory comprehension. Materials: pictures, audio tape recordings, picture matching tasks, picture sentence matching. Procedures: a series of 28 tasks; non‐verbal, phonology, lexical‐semantics and morphosyntax each of increasing complexity. Provided by: SLT Delivery: 1‐to‐1, face‐to‐face, location not reported. Regimen (frequency (sessions weekly) x duration): 2 sessions weekly for 5 months. Total dose of therapy delivered over the intervention not reported. Tailoring: variety of tasks qualitatively and quantitatively allows tailoring for different patient's needs. Modification: yes. Adherence: methods not reported. All randomised participants included in analysis 2. Conventional SLT Intervention: "Conventional stimulation therapy". Conventional SLT (e.g. Darley 1972, Sarno 1976, Schuell et al 1964, Wepman 1951). Materials: no details providedProcedures: conventional SLT: references given to other descriptions of stimulation therapy (as above). Provided by: therapist Delivery: 1‐to‐1, face‐to‐face; location not reported. Regimen: 2 sessions weekly for 5 months. Total dose = not reported. Tailoring: individualised. Modification: individualised. Adherence: all randomised participants included in analysis. |
|
| Outcomes | Primary outcomes: word discrimination, body‐part identification, Token Test, miscellaneous commands, reading comprehension, naming, sentence construction, spontaneous speech, STACDAP phonology, lexicon and morphosyntax Data collection: assessed at baseline and at the end of treatment | |
| Notes | Participants in additional 'no treatment' group were not randomly allocated but matched to other groups, and were therefore excluded from the review Statistical data included within the review meta‐analyses |
|
| Risk of bias | ||
| Bias | Authors' judgement | Support for judgement |
| Random sequence generation (selection bias) | Unclear risk | Not reported |
| Allocation concealment (selection bias) | Unclear risk | Not reported |
| Blinding (performance bias and detection bias) All outcomes | Unclear risk | Outcome assessor blinding not reported |
| Incomplete outcome data (attrition bias) All outcomes | Low risk | All randomised participants included in analyses |
| Selective reporting (reporting bias) | Low risk | All prespecified outcomes reported |
| Other bias | Unclear risk | STACDAP SLT group were older than the conventional SLT group at baseline Sample size calculation not reported |
Pulvermuller 2001.
| Methods | Parallel group RCT, Germany | |
| Participants | Inclusion criteria: single left MCA stroke, monolingual, competent German speakers
Exclusion criteria: severe cognitive or perceptual difficulties affecting participation, left‐handed, additional neurological diseases, depression
Group 1: 10 participants
Group 2: 7 participants Details of participants are shown in Table 6 |
|
| Interventions |
1. Constraint‐induced aphasia therapy SLT Intervention: "Constraint Induced Language Therapy" (CILT). Enhancing rehabilitation via brain plasticity, adopting model from motor rehabilitation. Materials: 32 cards with 16 pictures x 2, barriers preventing participant seeing others' cards. Procedures: CILT: small groups (2 to 3 participants) involving barrier therapeutic games; all communication verbal. Pointing or gestures not permitted. Constraint introduced by material used, verbal instructions and shaping and reinforcement contingencies. Provided by: speech and language therapist Delivery: group, face‐to‐face, location not reported. Regimen: 3‐4 h daily for 10 d. Total dose = mean 31.5 (range 23 to 33) h therapy. Tailoring: yes, variable levels of constraint. Modification: yes. variable levels of constraint. Adherence: methods not reported. All randomised participants included in analysis. 2. Conventional SLT Intervention: "Syndrome‐specific standard intervention" e.g. Conventional approaches reflecting current practice (e.g. Schuell 1974, Kotten 1993) Materials: not reported.Procedures: naming, repetition, sentence completion, following instructions, conversation topics of participants' own choice. Provided by: SLT. Delivery: 1‐to‐1, face‐to‐face, location not reported. Regimen: 2 to 3 h daily for 3 to 5 weeks. Total dose = mean 33.9 (range 20 to 54) h therapy. Tailoring: individualised. Modification: individualised. Adherence: methods not reported. All randomised participants included in analysis. |
|
| Outcomes | Primary outcomes: AAT (Token Test, comprehension, repetition, naming), CAL Data collection: assessed at baseline and at end of treatment |
|
| Notes | Dropouts are detailed in Table 7 Statistical data included within the review meta‐analyses |
|
| Risk of bias | ||
| Bias | Authors' judgement | Support for judgement |
| Random sequence generation (selection bias) | Low risk | Computer‐generated |
| Allocation concealment (selection bias) | Unclear risk | Not reported |
| Blinding (performance bias and detection bias) All outcomes | Low risk | Outcome assessor blinded |
| Incomplete outcome data (attrition bias) All outcomes | Low risk | All randomised participants included in analyses |
| Selective reporting (reporting bias) | Low risk | All prespecified outcomes reported |
| Other bias | High risk | Constraint‐induced aphasia therapy SLT group were longer after stroke (mean 98.2 (SD 74.2) months) than conventional SLT group (mean 24 (SD 20.6) months) at baseline Sample size calculation not reported |
RATS.
| Methods | Parallel group RCT, Netherlands | |
| Participants | Inclusion criteria: > 3 months after stroke, experiencing both semantic and phonological deficits, moderate/severe aphasia
Exclusion criteria: illiterate, non‐native speaker, dysarthria, global aphasia, developmental/severe acquired dyslexia, visual perceptual deficit, recovered/no aphasia
Group 1: 29 participants (poststroke recruitment time point: mean 4 (range 3 to 5) months)
Group 2: 29 participants (poststroke recruitment time point: mean 4 (range 3 to 5) months)
Group 1 older than group 2 Details of participants are shown in Table 6 |
|
| Interventions |
1. Semantic SLT Intervention: "Semantic SLT (BOX, Visch‐Brink 2001)". Aimed to enhance semantic processing. Materials: written materials Procedures: multiple choice, (right/wrong format), several levels of difficulty. Provided by: speech and language therapist trained in allocated intervention programme via workshops and in an individual session with patient. Delivery: 1‐to‐1, face‐to‐face, location not reported. Regimen: 1.5 to 3.0 h weekly, 2 or 3 sessions up to 40 weeks. Total does = 40 to 60 h therapy. Tailoring: increasing levels of difficulty possible, number of distractors, strength of semantic relation and frequency and abstractness of work. Modification: as above. Adherence: not reported. 2. Phonological SLT Intervention: "Phonological SLT (FIKS, V an Rijn 2000)". No therapy provision unlikely to be feasible or ethically acceptable. Materials: written materials.Procedures: sound structure targeting phonological input and output routes over 10 subparts e.g. rhyming consonant clusters, stress patterns, compiling words, syllabification, phonetic similarity. Provided by: speech and language therapist trained in allocated intervention programme via workshops and in an individual session with patient. Delivery: 1‐to‐1, face‐to‐face, location not reported. Regimen: 1.5 to 3 h in 2 to 3 sessions weekly for up to 40 weeks. Total dose = 40 to 60 h therapy. Tailoring: variation in degree of difficulty. Modification: not reported. Adherence: methods not reported. Not all participants completed. |
|
| Outcomes | Primary outcomes: ANELT‐A, SAT, PALPA synonym judgement, PALPA repetition of non‐words, PALPA auditory lexical decision Data collection: assessed at baseline and end of treatment | |
| Notes | Comorbidity: memory and executive function impairment
Dropouts: 12 participants (semantic SLT 6; phonological SLT 6). Dropouts are detailed in Table 7 Statistical data included within the review meta‐analyses |
|
| Risk of bias | ||
| Bias | Authors' judgement | Support for judgement |
| Random sequence generation (selection bias) | Low risk | Computer‐generated |
| Allocation concealment (selection bias) | Low risk | Sequentially numbered sealed opaque envelopes |
| Blinding (performance bias and detection bias) All outcomes | Low risk | Outcome assessors blinded |
| Incomplete outcome data (attrition bias) All outcomes | High risk | Trialists reported ITT employed but 3 participants not included (ANELT scores missing) On‐treatment analysis used |
| Selective reporting (reporting bias) | Low risk | All prespecified outcomes reported |
| Other bias | High risk | Semantic SLT group older than phonological SLT group Sample size calculation reported |
RATS‐2.
| Methods | Parallel group, Multicentre RCT, (15 hospitals across the Netherlands and Belgium) | |
| Participants | Inclusion criteria: aphasia after stroke (haemorrhagic or ischaemic stroke) less than 3 weeks previous, 18‐85 years old, life expectancy of more than 6 months, verbal communication disorder (score < 44/50 on the ANELT‐A) and a semantic disorder (SAT ‐ verbal score of less than 26/30 or Semantic Association (PALPA) score < 12/15) or a phonological disorder (Nonword Repetition Test score < 20/24 or Auditory Lexical Decision score < 76/80) Exclusion criteria: severe dysarthria, developmental dyslexia, visual perceptual disorder, premorbid dementia or aphasia, recent psychiatric disorder Group 1: 41 participants Group 2: 44 participants Details of participants are shown in Table 6 |
|
| Interventions |
1. Cognitive Linguistic SLT Intervention: "Cognitive Linguistic SLT". "Addressing specific neural networks involved in semantics and phonology by specific treatment activities might facilitate or speed up neural recovery processes". Materials: written and oral materials and some computer based Procedures: used BOX (Visch‐Brink 2001), a lexical semantic treatment programme or FIKS (van Rijn 2000) a phonological treatment programme, or a combination of the 2 depending on individual language disorders Provided by: speech and language therapist. Training not reported. Delivery: 1‐to‐1, face‐to‐face, computer and home practice, clinic or at home. Regimen: 2‐5 h weekly for 6 months (or shorter if fully recovered). Total dose = 52 h therapy. Tailoring: individualised to needs of patient by therapist. Modification: individualised Adherence: speech and language therapists recorded content and amount of therapy and discussed with trial office every 2‐3 weeks. Patient attendance at therapy recorded. Some dropouts recorded. 2. Communicative SLT Intervention: "communicative treatment". "Focuses on the disability, patients are trained to use their residual language skills combined with compensatory strategies in order to optimise information transfer". Targeted verbal and non‐verbal strategies to improve communication. Materials: PACE, roleplaying and conversational coaching. No focus on semantics, phonology or syntax permitted Procedures: written multiple choice, communication books. Exercises embedded in communicative setting. Provided by: speech and language therapist. Training not reported. Delivery: 1‐to‐1, face‐to‐face and home practice, clinic or at home. Regimen: 2‐5 h weekly for 6 months (or shorter if fully recovered). Total dose = 52 h therapy. Tailoring: individualised. Modification: individualised. Adherence: speech and language therapists recorded content and amount of therapy and discussed with trial office every 2‐3 weeks. Patient attendance at therapy recorded. Some dropouts recorded. |
|
| Outcomes | Primary outcome: ANELT‐A Secondary outcome: verbal SAT, semantic association of words with low image‐ability (PALPA), non‐words repetition (PALPA) and auditory lexical decision (PALPA), Token Test, semantic word fluency, ScreeLing (Semantic, Phonological, Syntactic) and letter fluency | |
| Notes | Dropouts: 10 (cognitive linguistic SLT 4; communicative SLT 6). Dropouts are detailed in Table 7 Statistical data included within the review meta‐analyses |
|
| Risk of bias | ||
| Bias | Authors' judgement | Support for judgement |
| Random sequence generation (selection bias) | Low risk | Randomisation stratified by centre Computer‐generated randomisation sequence per centre |
| Allocation concealment (selection bias) | Low risk | Uninvolved member of staff enclosed assignments in sealed sequentially numbered opaque envelopes stored in a drawer |
| Blinding (performance bias and detection bias) All outcomes | Unclear risk | Assessment of primary outcome (ANELT‐A) was rated by 2 independent therapists blinded to treatment allocation and time point of assessment Other assessments (58/158) were carried out by treating therapists |
| Incomplete outcome data (attrition bias) All outcomes | Low risk | ITT analysis employed |
| Selective reporting (reporting bias) | Low risk | All prespecified outcomes reported |
| Other bias | Low risk | Sample size calculation reported Groups comparable at baseline except for sex More males in the control group |
Rochon 2005.
| Methods | Parallel group RCT, Canada | |
| Participants | Inclusion criteria: chronic Broca's aphasia (BDAE), produce sufficient speech for analyses, single left hemisphere stroke, native English speaker, normal hearing on screening
Exclusion criteria: none listed
Group 1: 3 participants
Group 2: 2 participants Details of participants are shown in Table 6 |
|
| Interventions |
1. Sentence mapping Intervention: SLT. Mapping therapy to address "mapping deficit" targets comprehension impairment but anticipating gains in production. This intervention aimed to target production in nonfluent aphasia based on mapping therapy approach. Cueing approach. Level 1 ‐ agent cue to produce sentence. Level 2 ‐ 1 agent cue to produce theme cue. Level 3 ‐ identification of both roles in fixed order. Level 4 ‐ role identification varied and randomised. 4 sentence structures trained ‐ active, subject, cleft, passive and object cleft sentences. Canonical and non‐canonical sentences were also closely matched. (Sample of treatment protocol provided Rochon 2005). Materials: stimuli came from large sentence bank of > 500 semantically reversible sentences. 144 sentences in treatment phase. Stimuli to elicit sentences were colour photos of actors clearly depicting action taken against a plain backdrop. 2 small black/white icons used to reinforce difference between agent/theme in target sentence. 6 sets of 24 sentences. Random order of presentation. Procedures: each session 12 sentences levels 1‐2 and 24 at levels 3‐4. Provided by: trained RA. Delivery: face‐to‐face; 1‐to‐1; location not reported. Regimen: 1‐h session twice weekly for approximately 2.5 months. Total dose (estimated) = 22 h therapy. Tailoring: not reported. Modification: not reported. Adherence: no dropouts. 2. Social support Intervention: attention "control intervention". Materials: none. Narrative re‐telling task Rochon 1994. Procedures: unstructured conversation about current events. Narrative retelling task on alternate sessions. Provided by: trained RA Delivery: 1‐to‐1, face‐to‐face, location not reported. Regimen: 1 h session twice weekly for approximately 2.5 months. Total dose (estimated) = 22 h therapy. Tailoring: not reported. Modification: not reported. Adherence: no dropouts. |
|
| Outcomes | Outcomes: trained sentence structures: active, subject cleft, assive, object cleft; CHSPT; Picture Description and Structure Modeling Test; narrative task: mean length of utterance, percentage words in sentences, percentage well‐formed words, sentence elaboration index; PCB (reversible sentences); Picture Comprehension Test Social support and stimulation group also participated in between level probes Data collection: baseline, end of treatment and 4‐week follow‐up |
|
| Notes | Only 1 Group 1 participant entered all 4 levels; 1 only entered levels 1 and 2 (did not need levels 3 to 4); 1 participant entered levels 1, 2 and 4. Statistical data included within the review meta‐analyses |
|
| Risk of bias | ||
| Bias | Authors' judgement | Support for judgement |
| Random sequence generation (selection bias) | Unclear risk | Not reported |
| Allocation concealment (selection bias) | Unclear risk | Not reported |
| Blinding (performance bias and detection bias) All outcomes | High risk | Outcome assessor blinding inadequate Primary examiner scored all outcome measures A fifth of measures were also scored by independent assessor Point‐to‐point agreement was 98% |
| Incomplete outcome data (attrition bias) All outcomes | Low risk | All randomised participants included in analyses |
| Selective reporting (reporting bias) | Low risk | All prespecified outcomes reported |
| Other bias | Unclear risk | Sample size calculation not reported Groups comparable at baseline |
SEMaFORE.
| Methods | Cross‐over RCT (only data prior to cross‐over treatment included in this review), UK | |
| Participants | Inclusion criteria: at least 3 months poststroke onset of aphasia following a single symptomatic stroke. Word retrieval difficulty (10%‐60% of 150 item naming test)
Exclusion criteria: significant cognitive difficulties, dysarthria and verbal dyspraxia may be present but not the primary difficulty, hearing and vision can be corrected but should be adequate to take part in a study involving pictures and spoken words 25 randomised participants. Numbers allocated to the 2 groups is as yet not reported. Group 1: not reported Group 2: not reported Details of participants are shown in Table 6 |
|
| Interventions |
1. Semantic Feature Analysis Intervention: Semantic Feature Analysis. Materials: the items assigned to this condition by the randomisation procedure.Procedures: protocol based. A very precise and detailed treatment procedure, negotiated with Prof Mary Boyle as owner/originator of SFA (Boyle 1995). Provided by: research therapist. Details of experience not reported. Delivery: not reported. Regimen: 2 sessions per week of 45 min over 6 weeks. Total dose = 9 h therapy. Tailoring: not reported. Modification: not reported. Adherence: not reported. 2. Repetition in the Presence of a Picture Intervention: repetition in the presence of a picture. Materials: not reported. Procedures: protocol based. A very precise and detailed treatment procedure, negotiated with Prof Lyndsey Nickels as 1 of the most prominent users/promoters of this treatment method. Provided by: research therapist. Details of experience not reported.Delivery: not reported.Regimen: 2 sessions per week of 45 min over 6 weeks. Total dose = 9 h therapy. Tailoring: not reported. Modification: not reported. Adherence: not reported. |
|
| Outcomes | Primary outcomes: picture naming test (150 items) Secondary outcomes: word retrieval in spontaneous speech, QoL, semantic abilities, Data collection: baseline, post‐therapy 1 (cross‐over baseline 2, post‐therapy 2, follow‐up ‐ 6 weeks. Data following cross‐over are not included in this review) |
|
| Notes | UKCRN ID 10507 Dropouts are detailed in Table 7 |
|
| Risk of bias | ||
| Bias | Authors' judgement | Support for judgement |
| Random sequence generation (selection bias) | Low risk | External randomisation service |
| Allocation concealment (selection bias) | Low risk | Not reported (External randomisation service) |
| Blinding (performance bias and detection bias) All outcomes | Low risk | Yes. Assessor blinded to therapy |
| Incomplete outcome data (attrition bias) All outcomes | Unclear risk | Dropouts accounted for (25 participants enrolled, 2 died during trial and data for 23 completers analysed |
| Selective reporting (reporting bias) | Unclear risk | Insufficient data available at present, complete trial data report not yet published |
| Other bias | Unclear risk | Partial trial data available in 2 conference papers, and a presentation, but complete trial data report not yet published |
Shewan 1984i.
| Methods | Parallel group RCT (stratified for type and severity of aphasia), Canada | |
| Participants | Inclusion criteria: unilateral first CVA, Global, Broca's, Wernicke's, anomic, conduction per WAB, occlusive/stable intracerebral haemorrhagic stroke, functional English speakers
Exclusion criteria: non‐stroke, symptoms lasting fewer than 5 d, language recovery within 2 to 4 weeks postonset, unstable illness, arteriovenous malfunction, aneurysm rupture, subarachnoid haemorrhage, hearing or visual impairment, WABAQ at or above 93.8
Group 1: 28 participants
Group 2: 24 participants Details of participants are shown in Table 6 |
|
| Interventions |
1. Language Orientated Therapy SLT Intervention: "Language Orientated Therapy (LOT)". Based on psycholinguistic principles Materials: detailed in Shewan 1986 Procedures: detailed in Shewan 1986 Provided by: speech and language therapist. Trained in intervention. Delivery: 1‐to‐1, face‐to‐face; location not reported. Regimen: 1 h session 3 times weekly for 1 year (or 1.5 h twice weekly) for 12 months. Total dose = 156 h therapy. Tailoring: not reported. Modification: not reported. Adherence: fidelity to treatment delivery protocol reviewed 6 monthly by external therapist. Dropout rate recorded. 2. Conventional SLT Intervention: stimulation‐facilitation therapy based on Schuell and Wepman's approaches. Materials: not reported Procedures: not reported Provided by: speech and language therapist. Trained in intervention. Delivery: face‐to‐face; 1‐to‐1; location not reported. Regimen: 1 h session 3 times weekly for 1 year (or 1.5 h twice weekly) for 12 months. Total dose = 156 h therapy. Tailoring: not reported. Modification: not reported. Adherence: fidelity to treatment delivery protocol reviewed 6 monthly by external therapist. Dropout rate recorded. |
|
| Outcomes | Primary outcomes: WAB, ACTS Data collection: assessed at baseline, 3, 6 and 12 months | |
| Notes | Participants refusing or unable to participate were allocated to a third no‐treatment group. This group were not included in this review
Dropouts: 7 participants (language‐orientated SLT 6; conventional SLT 1). Dropouts are detailed in Table 7 Data reported unsuitable for inclusion within the review meta‐analyses |
|
| Risk of bias | ||
| Bias | Authors' judgement | Support for judgement |
| Random sequence generation (selection bias) | Unclear risk | Not reported |
| Allocation concealment (selection bias) | Unclear risk | Not reported |
| Blinding (performance bias and detection bias) All outcomes | Unclear risk | Outcome assessor blinding not reported |
| Incomplete outcome data (attrition bias) All outcomes | High risk | ITT analysis not employed |
| Selective reporting (reporting bias) | Low risk | All prespecified outcomes reported |
| Other bias | Unclear risk | Sample size calculation not reported Groups comparable at baseline |
Shewan 1984ii.
| Methods | Parallel group RCT (stratified for type and severity of aphasia), Canada | |
| Participants | Inclusion criteria: unilateral first CVA, Global, Broca's, Wernicke's, anomic, conduction per WAB, occlusive/stable intracerebral haemorrhagic stroke, functional English speakers
Exclusion criteria: non‐stroke, symptoms lasting fewer than 5 d, language recovery within 2‐4 weeks postonset, unstable illness
Group 1: 28 participants (poststroke recruitment time point: up to 4 weeks)
Group 2: 25 participants (poststroke recruitment time point: up to 4 weeks)
Groups comparable at baseline Details of participants are shown in Table 6 |
|
| Interventions |
1. Language Orientated Therapy SLT Intervention: "Language Orientated Therapy (LOT)". Based on psycholinguistic principles Materials: detailed in Shewan 1986 Procedures: detailed in Shewan 1986 Provided by: therapist trained in intervention. Delivery: 1‐to‐1, face‐to‐face; location not reported. Regimen: 1‐h session 3 times weekly for 1 year (or 1.5 h twice weekly) for 12 months. Total dose = 156 h therapy. Tailoring: not reported. Modification: not reported. Adherence: fidelity to treatment delivery protocol reviewed 6 monthly by external therapist. Dropout rate recorded. 2. Social support Intervention: "Social stimulation and support". Rationale not reported. Materials: based on stimulation orientation, providing psychological support, communication in unstructured settings. Procedures: communication stimulation Provided by: trained nurses (mostly). Given information about aphasia and instructed to stimulate communication to the best of their ability. They were neither permitted or expected to gain additional speech‐language pathology experience". Delivery: 1‐to‐1, face‐to‐face, "unstructured settings". Regimen: 1‐h session 3 times weekly for 1 year (or 1.5 h twice weekly) for 12 months. Total dose = 156 h. Tailoring: not reported. Modification: not reported. Adherence: fidelity monitored. Dropout rate recorded. |
|
| Outcomes | Primary outcomes: WAB, ACTS Data collection: assessed at baseline, 3, 6 and 12 months | |
| Notes | Participants refusing or unable to participate were allocated to a third no‐treatment group but were not included in this review
Dropouts: 12 participants (language‐orientated SLT 6; social stimulation and support 6). Dropouts are detailed in Table 7 Data reported unsuitable for inclusion within the review meta‐analyses |
|
| Risk of bias | ||
| Bias | Authors' judgement | Support for judgement |
| Random sequence generation (selection bias) | Unclear risk | Not reported |
| Allocation concealment (selection bias) | Unclear risk | Not reported |
| Blinding (performance bias and detection bias) All outcomes | Unclear risk | Outcome assessor blinding not reported |
| Incomplete outcome data (attrition bias) All outcomes | High risk | ITT analysis not employed |
| Selective reporting (reporting bias) | Low risk | All prespecified outcomes reported |
| Other bias | Unclear risk | Sample size calculation not reported Groups comparable at baseline |
Shewan 1984iii.
| Methods | Parallel group RCT (stratified for type and severity of aphasia), Canada | |
| Participants | Inclusion criteria: unilateral first stroke, Global, Broca's, Wernicke's, anomic, conduction as per WAB, occlusive or stable intracerebral haemorrhagic stroke, functional English speakers
Exclusion criteria: non‐stroke, symptoms lasting fewer than 5 d, language recovery within 2‐4 weeks after stroke, unstable illness
Group 1: 24 participants
Group 2: 25 participants Details of participants are shown in Table 6 |
|
| Interventions |
2. Conventional SLT Intervention: stimulation‐facilitation therapy based on Schuell and Wepman's approaches. Materials: not reported Procedures: not reported Provided by: speech and language therapist. Trained in intervention. Delivery: face‐to‐face; 1‐to‐1; location not reported. Regimen: 1 h session 3 times weekly for 1 year (or 1.5 h twice weekly) for 12 months. Total dose = 156 h therapy. Tailoring: not reported. Modification: not reported. Adherence: fidelity to treatment delivery protocol reviewed 6 monthly by external therapist. Dropout rate recorded. 2. Social support Intervention: "Social stimulation and support". Rationale not reported. Materials: based on stimulation orientation, providing psychological support, communication in unstructured settings. Procedures: communication stimulation Provided by: trained nurses (mostly). Given information about aphasia and instructed to stimulate communication to the best of their ability. They were neither permitted or expected to gain additional speech‐language pathology experience".Delivery: 1‐to‐1, face‐to‐face, "unstructured settings". Regimen: 1 h session 3 times weekly for 1 year (or 1.5 h twice weekly) for 12 months. Total dose = 156 h. Tailoring: not reported. Modification: not reported. Adherence: fidelity monitored. Dropout rate recorded. |
|
| Outcomes | Primary outcomes: WAB, ACTS Data collection: assessed at baseline, 3, 6 and 12 months | |
| Notes | Participants refusing or unable to participate were allocated to a third no‐treatment group but were not included in this review
Dropouts: 7 participants (conventional SLT 1; social stimulation and support 6). Dropouts are detailed in Table 7 Data reported unsuitable for inclusion within the review meta‐analyses |
|
| Risk of bias | ||
| Bias | Authors' judgement | Support for judgement |
| Random sequence generation (selection bias) | Unclear risk | Not reported |
| Allocation concealment (selection bias) | Unclear risk | Not reported |
| Blinding (performance bias and detection bias) All outcomes | Unclear risk | Outcome assessor blinding not reported |
| Incomplete outcome data (attrition bias) All outcomes | High risk | ITT analysis not employed |
| Selective reporting (reporting bias) | Low risk | All prespecified outcomes reported |
| Other bias | Unclear risk | Sample size calculation not reported Groups comparable at baseline |
Sickert 2014.
| Methods | RCT, Germany | |
| Participants | Inclusion criteria: first‐ever stroke with aphasia in the sub‐acute stage defined as time since lesion onset from 1 to 4 months poststroke. Aphasia as per Aachener Aphasia Test (AAT). All patients had to understand the rules of the game for the CIAT group. This requirement was assessed by a test game. If the patients satisfied the criteria of understanding the aim of the game, naming of items with therapeutic help and identifying 1 of 4 presented cards with object drawings, they were included in the study. All participants were native German speakers. Pre‐morbid handedness was assessed with the Edinburgh Handedness Inventory
Exclusion criteria: residual aphasia, dysarthria (scale values 0–3, dysarthria rating scale10) and apraxia of speech
Group 1: 50 participants
Group 2: 50 participants Details of participants are shown in Table 6 |
|
| Interventions |
1. Constraint‐induced aphasia therapy (CIAT) Intervention: CIAT. Avoiding learned non‐use phenomenon. Communication in verbal format has to be engaged with, thus forcing practice. Materials: therapeutic language games using card‐based object drawings, photos of everyday situations. Written language tasks (Meinzer 2005b). Visual barrier also used. Procedures: therapeutic language games. Massed practice, shaping and constraint of non‐verbal strategies. Where verbal skills good, writing to single word dictation used. Progressive degrees of difficulty built in. Also included 2 non‐aphasic patients from rehab centre in the group as groups members and 'able communicators'. Groups established of 4–6 patients plus speech therapist and 2 patients without aphasia (from the medical professional rehabilitation team). No home practice in the in the CIAT setting, but patients and relatives of both groups received professional advice. Provided by: speech and language therapist professional. Delivery: group, face‐to‐face with visual barrier between group members so they could not see each others' hands/cards, local rehab centre. Regimen: 2 h of training over 15 d. Total dose = 30 h of therapy. Tailoring: yes. The rules of communication were formulated, individualised for each participant and were gradually increased. The therapist provided as much cueing as necessary, depending on the level of each participant's verbal ability, for a successful response. Modification: yes, individualised to patient needs. After discharge from research programme continued to receive outpatient treatment at a comparable intensity level at an average of 1.9 h per week. Adherence: progressive difficulty, addition of writing tasks. Monitored. 2. Conventional SLT Intervention: conventional SLT. Usual care. Materials: not reported Procedures: standard SLT 'focused on training specific deficits' e.g. sentence completion, improving patients' retrieval of words, learning sentence patterns, conversation on current topics, listening to words, and repeating and following instructions. The therapist initiated the communicative activities. The interventions aimed to target several modes of communication. Provided by: speech and language therapists. Training not reported. Delivery: 1‐to‐1, face‐to‐face, local rehab centre. Regimen: 2 h of training over 15 d. Total dose = 30 h of therapy. Tailoring: yes. Modification: yes, individualised to patient needs. After discharge from research programme continued to receive outpatient treatment at a comparable intensity level at an average of 2.13 h per week. Adherence: progressive difficulty, addition of writing tasks. Monitored. |
|
| Outcomes | Primary outcomes: Aachen Aphasia Test Secondary outcomes: Communicative Activity Log (short version) Data collection: baseline, at 3 weeks (i.e. immediately post‐training). Follow‐up 8 weeks and 1 year |
|
| Notes | Dropouts are detailed in Table 7 Statistical data included within the review meta‐analyses |
|
| Risk of bias | ||
| Bias | Authors' judgement | Support for judgement |
| Random sequence generation (selection bias) | Low risk | Computer‐generated randomisation code |
| Allocation concealment (selection bias) | Low risk | Adequate |
| Blinding (performance bias and detection bias) All outcomes | Low risk | Yes. Speech and language therapists not involved in study |
| Incomplete outcome data (attrition bias) All outcomes | High risk | Dropouts not accounted for |
| Selective reporting (reporting bias) | Low risk | All prespecified outcomes reported |
| Other bias | Low risk | Groups comparable at baseline for age, sex, aetiology, handedness, aphasia syndrome, time postonset mean = 34.8 d; premorbid education (6 to 12 years) (M=9.2); severity AAT spontaneous speech |
Smania 2006.
| Methods | Parallel group RCT, Italy | |
| Participants | Inclusion criteria: left unilateral CVA, limb apraxia lasting a minimum of 2 months, aphasia
Exclusion criteria: previous CVA or other neurological disorders, > 80 years of age, uncooperative, orthopaedic or other disabling disorders
Group 1: 20 participants
Group 2: 21 participants
Groups comparable at baseline Details of participants are shown in Table 6 |
|
| Interventions |
1. Conventional SLT Intervention: "Conventional treatment for aphasia". Attention control for limb apraxia therapy intervention based on Basso 1979 approach. Materials: not reported. Procedures: not reported. Provided by: speech and language therapist. Delivery: not reported. Regimen: 50 minutes 3 times weekly for 10 weeks. Total dose = 25 h therapy. Tailoring: not reported. Modification: not reported. Adherence: not reported. 2. No SLT Intervention: "Limb apraxia therapy only" . Materials: not reported. Procedures: not reported. Provided by: not reported. Delivery: not reported. Regimen: 50 minutes 3 times weekly for 10 weeks. Total dose = 25 h therapy. Tailoring: not reported. Modification: not reported. Adherence: not reported. |
|
| Outcomes | Primary outcomes: Token Test, Gestural comprehension (not described) Data collection: assessed at baseline, end of treatment and 2‐month follow‐up | |
| Notes | All participants had apraxia
Dropouts: 24 participants (conventional SLT 12; no SLT 12). Dropouts are detailed in Table 7 Statistical data included within the review meta‐analyses |
|
| Risk of bias | ||
| Bias | Authors' judgement | Support for judgement |
| Random sequence generation (selection bias) | Low risk | Random numbers table |
| Allocation concealment (selection bias) | High risk | Co‐ordinating trialists allocated participants to groups |
| Blinding (performance bias and detection bias) All outcomes | Low risk | Outcome assessor blinded |
| Incomplete outcome data (attrition bias) All outcomes | High risk | ITT was not employed |
| Selective reporting (reporting bias) | Unclear risk | Not all of the prespecified outcomes were reported. Discrepancy between the reporting of comprehension language tests as 'significant improvement' in the text but then the table says they are 'ns' or non‐significant with a P value of < 0.01. |
| Other bias | Unclear risk | Sample size calculation not reported Groups comparable at baseline |
Smith 1981i.
| Methods | Parallel group RCT (subgroup within larger trial), UK | |
| Participants | Inclusion criteria: hospital catchment area, measurable residual neurological deficit, no life‐threatening concurrent illness, fit for intensive therapy, independent prior to stroke, inpatient for not more than 2 months after stroke
Exclusion criteria: too old or frail to travel to hospital, some non‐described reasons
Group 1: 16 participants
Group 2: 17 participants Details of participants are shown in Table 6 |
|
| Interventions |
1. High‐intensity SLT Intervention: "Intensive SLT". Investigating intensity of therapy. Materials: not reported. Procedures: not reported. Provided by: speech and language therapist. Delivery: 1‐to‐1, face‐to‐face; rehabilitation department (as outpatient). Regimen: 1 h 4 times weekly for up to 12 months. Total dose = up to 208 h therapy. Tailoring: not reported. Modification: not reported. Adherence: per protocol intent was 50 h of therapy but only 21 h (group not reported) 2. No SLT Intervention: no SLT. Materials: none. Procedures: none. Provided by: none but usual poststroke care e.g. visit from health visitors but frequency not reported Delivery: none Regimen: none. Tailoring: none. Modification: none. Adherence: none. |
|
| Outcomes | Primary outcomes: MTDDA, GHQ Data collection: baseline, 3, 6 and 12 months after trial admission | |
| Notes | Difficult to maintain intensive SLT input after first 3 months
Participants were also receiving physiotherapy and occupational therapy
No restrictions on other treatments prescribed by hospital staff or GP
Dropouts: 10 (plus 5 participants withdrawn prior to final analyses ‐ 3 with dysarthria but no aphasia; 2 died before first reassessment but grouping not advised) plus intensive SLT 10; no SLT: none reported. Dropouts are detailed in Table 7 Statistical data reported unsuitable for inclusion within the review meta‐analyses |
|
| Risk of bias | ||
| Bias | Authors' judgement | Support for judgement |
| Random sequence generation (selection bias) | Unclear risk | Not reported |
| Allocation concealment (selection bias) | Unclear risk | Not reported |
| Blinding (performance bias and detection bias) All outcomes | High risk | Outcome assessors not blinded |
| Incomplete outcome data (attrition bias) All outcomes | High risk | ITT analysis not employed |
| Selective reporting (reporting bias) | High risk | Statistical data not available (personal communication) |
| Other bias | Unclear risk | 20 patients in main trial had mild dementia, not reported whether any were participants with aphasia Group 1 (intensive SLT) had lower mean percentage error scores on MTDDA than group 2 (no SLT); it is not reported whether this was a significant difference Sample size calculation not reported |
Smith 1981ii.
| Methods | Parallel group RCT (subgroup within larger trial), UK | |
| Participants | Inclusion criteria: lives in hospital catchment area, measurable residual neurological deficit, no life‐threatening concurrent illness, fit for intensive therapy if assigned, independent prior to stroke, inpatient for not more than 2 months postonset
Exclusion criteria: too old or frail to travel to hospital, some non‐described reasons
Group 1: 14 participants
Group 2: 17 participants Details of participants are shown in Table 6 |
|
| Interventions |
1. Conventional SLT Intervention: "Conventional SLT". Investigating intensity of therapy. Materials: not reported. Procedures: not reported. Provided by: speech and language therapist. Delivery: 1‐to‐1 (5 also received group therapy), face‐to‐face; rehabilitation department (as outpatient). Regimen: 40 minutes twice weekly for up to 12 months. Total dose = up to 69.3 h therapy. Tailoring: not reported. Modification: not reported. Adherence: unclear. 2. No SLT Intervention: no SLT. Materials: none. Procedures: none. Provided by: none but usual poststroke care e.g. visit from health visitors but frequency not reported Delivery: none Regimen: none. Tailoring: none. Modification: none. Adherence: none. |
|
| Outcomes | Primary outcomes: MTDDA, GHQ Data collection: assessed at baseline, 3, 6 and 12 months after trial admission | |
| Notes | Participants also receiving physiotherapy and occupational therapy
No restrictions of other treatments prescribed by the hospital or GP
Dropouts: 5 participants withdrawn prior to final analyses (3 with dysarthria but no aphasia; 2 died before first reassessment but grouping not advised) plus 6 participants (conventional SLT 6; no SLT: none reported). Dropouts are detailed in Table 7 Statistical data reported unsuitable for inclusion within the review meta‐analyses |
|
| Risk of bias | ||
| Bias | Authors' judgement | Support for judgement |
| Random sequence generation (selection bias) | Unclear risk | Not reported |
| Allocation concealment (selection bias) | Unclear risk | Not reported |
| Blinding (performance bias and detection bias) All outcomes | High risk | Outcome assessors not blinded |
| Incomplete outcome data (attrition bias) All outcomes | High risk | ITT analysis not employed |
| Selective reporting (reporting bias) | High risk | Statistical data not available, personal communication |
| Other bias | Unclear risk | 20 patients in main trial had mild dementia, not reported whether any were participants with aphasia Group 1 (conventional SLT) had higher mean percentage error scores on MTDDA than group 2 (no SLT) Sample size calculation not reported |
Smith 1981iii.
| Methods | Parallel group RCT (subgroup within larger trial), UK | |
| Participants | Inclusion criteria: lives in hospital catchment area, measurable residual neurological deficit, no life‐threatening concurrent illness, fit for intensive therapy if assigned, independent prior to stroke, inpatient for not more than 2 months postonset
Exclusion criteria: too old or frail to travel to hospital, some non‐described reasons
Group 1: 16 participants
Group 2: 14 participants
Groups comparable at baseline Details of participants are shown in Table 6 |
|
| Interventions |
1. High‐intensity SLT Intervention: "Intensive SLT". Investigating intensity of therapy. Materials: not reported. Procedures: not reported. Provided by: speech and language therapist. Delivery: 1‐to‐1, face‐to‐face; rehabilitation department (as outpatient). Regimen: 1 h 4 times weekly for up to 12 months. Total dose = up to 208 h therapy. Tailoring: not reported. Modification: not reported. Adherence: per protocol intent was 50 h of therapy but only 21 h (group not reported) 2. Conventional SLT Intervention: "Conventional SLT". Investigating intensity of therapy. Materials: not reported. Procedures: not reported. Provided by: speech and language therapist. Delivery: 1‐to‐1 (5 also received group therapy), face‐to‐face; rehabilitation department (as outpatient). Regimen: 40 minutes twice weekly for up to 12 months. Total dose = up to 69.3 h therapy. Tailoring: not reported. Modification: not reported. Adherence: not reported. |
|
| Outcomes | Primary outcomes: MTDDA, GHQ Data collection: baseline, 3, 6 and 12 months after trial admission | |
| Notes | Distinction between intensive and conventional became impossible to maintain after first 3 months as individual patterns of therapy attendance emerged; in first 3 months mean 21/50 h intended
Conventional SLT group received additional group treatment; also received physiotherapy and occupational therapy
No restrictions of other treatments prescribed by the hospital or GP
Dropouts: 5 participants withdrawn prior to final analyses (3 with dysarthria but no aphasia; 2 died before first re‐assessment but grouping not advised) plus 16 participants (intensive SLT 10; conventional SLT 6). Dropouts are detailed in Table 7 Statistical data reported unsuitable for inclusion within the review meta‐analyses |
|
| Risk of bias | ||
| Bias | Authors' judgement | Support for judgement |
| Random sequence generation (selection bias) | Unclear risk | Not reported |
| Allocation concealment (selection bias) | Unclear risk | Not reported |
| Blinding (performance bias and detection bias) All outcomes | High risk | Outcome assessors not blinded |
| Incomplete outcome data (attrition bias) All outcomes | High risk | ITT analysis not employed |
| Selective reporting (reporting bias) | High risk | Statistical data not available, personal communication |
| Other bias | Unclear risk | 20 patients in main trial had mild dementia, unclear whether any were participants with aphasia Sample size calculation not reported |
SP‐I‐RiT.
| Methods | RCT, Portugal | |
| Participants | Inclusion criteria: aged 40‐80 years; native Portuguese speaker; brain imaging confirming a single left hemisphere infarct of the MCA territory; Aphasia quotient (AQ) (the arithmetic mean of the percentage score obtained in fluency, object naming, word repetition and sentence comprehension subtests of the Lisbon Aphasia Battery (BAAL) (Castro‐Caldas 1979), ranging between 6 and 77, comprising mild/moderate (50–77) and severe (6–49) aphasia; willingness to participate; and personal or family member written consent.
Exclusion criteria: time poststroke onset > 3 months at screening; inability to attend rehabilitation sessions on a daily basis; clinical evidence of dementia, based on semi‐standardised family interviews with questions about functional daily living activities and behaviour; recurrence of stroke while being scheduled to start therapy; very severe or mild aphasia (AQ < 6 or > 77) at the time of randomisation; illiteracy and severe medical or psychiatric disorder that would not allow attendance to therapy
Group 1: 15 participants
Group 2: 15 participants Details of participants are shown in Table 6 |
|
| Interventions |
1. High‐intensity SLT Intervention: intensive SLT. Intensity of therapy thought to be important component of intervention but study controls for amount. Materials: all therapists used same materials (not specified). Procedures: multimodal Stimulation Approach (MSA) (Duffy 2001). Based on stimulation, facilitation, motivation. Each linguistic modality is used to stimulate another following a programme of progressive complexity. Activities: picture confrontation naming, naming from definition and description, description of picture using complete sentences, phrase completion, comprehension of instruction exercises, yes/no questions, Wh‐ questions, detection of syntactic and semantic errors in incorrect phrases; interpretation of proverbs, reading and retelling daily news writing to dictation. Provided by: speech and language therapists supervised sessions. 5 professional speech and language therapists. Trained in MSA. Joint meetings to keep approach similar. Delivery: 1‐to‐1, face‐to‐face, 2 medical centres: SLT rehab outpatients with acute stroke unit and rehab centre with in‐and outpatients. Regimen: 2 h per day × 5 d per week, 10 weeks. Total dose = 100 h of therapy. Tailoring: yes. Modification: yes, individualised to patient needs. Adherence: monitored. If participants missed more than 5 h of consecutive therapy sessions then they were excluded from study. Unclear whether any were excluded for this reason alone. Also, non‐completions were recorded as death, transport or other logistical problems, or ill health 2. Low‐intensity SLT Intervention: low‐intensity SLT. Conventional SLT. Materials: all therapists used same materials (not specified). Procedures: Multimodal Stimulation Approach (Duffy 2001). Based on stimulation, facilitation, motivation. Each linguistic modality is used to stimulate another following a programme of progressive complexity. Activities: picture confrontation naming, naming from definition and description, description of picture using complete sentences, phrase completion, comprehension of instruction exercises, yes/no questions, Wh‐ questions, detection of syntactic and semantic errors in incorrect phrases; interpretation of proverbs, reading and retelling daily news writing to dictation. Provided by: speech and language therapists supervised sessions. 5 professional speech and language therapists. Trained in MSA. Joint meetings to keep approach similar. Delivery: 1‐to‐1, face‐to‐face, 2 medical centres (1) SLT rehab outpatients with acute stroke unit and (2) rehab centre with in‐and outpatients. Regimen: 2 h per week × 50 weeks. Total dose = 100 h of therapy. Tailoring: yes. Modification: yes, individualised to patient needs. Adherence: monitored. If participants missed more than 5 h of consecutive therapy sessions then they were excluded from study. Unclear whether any were excluded for this reason alone. Also, non‐completions were recorded as death, transport or other logistical problems, or ill health |
|
| Outcomes | Primary outcomes: Aphasia Severity Rating Scale (ASRS) of the BDAE Secondary outcomes: subtests of speech fluency, object naming, word repetition and understanding simple commands of the Lisbon Aphasia Assessment Battery (BAAL) (Castro‐Caldas 1979) and estimation of AQ and subtests of Aachen Aphasia battery (Portuguese version, PAAT) (Huber 1983; Lauterbach 2008) namely, the Token Test, reading comprehension for words and sentences and writing to dictation. Functional Communication Profile (FCP) (Sarno 1969) and Stroke Aphasia Depression Questionnaire—SAD‐Q (Portuguese version) (Rodrigues 2006; Stutcliffe 1998) Data collection: baseline, postintensive SLT (10 weeks), postusual SLT (50 weeks). Follow‐up 3 months after intervention |
|
| Notes | Portugal Dropouts are detailed in Table 7 Statistical data included within the review meta‐analyses |
|
| Risk of bias | ||
| Bias | Authors' judgement | Support for judgement |
| Random sequence generation (selection bias) | Low risk | Computer‐generated randomisation code, stratified by baseline severity (AQ mild‐mod or severe) and in blocks of 8 |
| Allocation concealment (selection bias) | Low risk | Sequentially numbered opaque sealed envelopes |
| Blinding (performance bias and detection bias) All outcomes | Low risk | Neurologist or speech and language therapist blinded to the therapeutic group |
| Incomplete outcome data (attrition bias) All outcomes | Low risk | ITT analysis employed |
| Selective reporting (reporting bias) | Low risk | All prespecified outcomes reported |
| Other bias | Unclear risk | Sample size calculation (N=114) a priori |
Szaflarski 2014.
| Methods | RCT, USA | |
| Participants | Inclusion criteria: history of LMCA stroke and residual moderate aphasia
Exclusion criteria: none listed
Group 1: 14 participants
Group 2: 10 participants Details of participants are shown in Table 6 |
|
| Interventions |
1. Constraint‐induced aphasia therapy (CIAT) Intervention: CIAT. Designed to promote verbal communication, and to limit compensatory non‐verbal strategies. Materials: not reported. Procedures: not reported. Provided by: 2 speech and language therapists, supervised sessions. Training not reported. Delivery: not reported if 1‐to‐1 or group, face‐to‐face, location not reported. Regimen: 10 daily sessions each 4 h long. Total dose = 40 h of therapy. Tailoring: yes (no details). Modification: yes (no details). Adherence: not reported. 2. No SLT Intervention: no SLT. Observation group. Materials: none. Procedures: none. Provided by: none. Delivery: none. Regimen: none. Tailoring: none. Modification: none. Adherence: none. |
|
| Outcomes | Primary outcomes: Boston Naming Test Secondary outcomes: Semantic Fluency Test, Controlled Oral Word Association Test, Complex Ideational subtest of the BDAE, Peabody Picture Vocabulary Test Data collection: baseline, 1 week prior to intervention, within 1 week of intervention. Follow‐up 3 months after intervention |
|
| Notes | Dropouts are detailed in Table 7 | |
| Risk of bias | ||
| Bias | Authors' judgement | Support for judgement |
| Random sequence generation (selection bias) | Unclear risk | Not reported |
| Allocation concealment (selection bias) | Unclear risk | Not reported |
| Blinding (performance bias and detection bias) All outcomes | Low risk | Yes ‐ data collection team blinded until all assessment completed |
| Incomplete outcome data (attrition bias) All outcomes | Unclear risk | Not reported |
| Selective reporting (reporting bias) | Unclear risk | Insufficient data available at present, complete trial data report not yet published |
| Other bias | Low risk | Groups were comparable at baseline (demographics, age, time from stroke, sex and co‐ morbidities) |
Van Steenbrugge 1981.
| Methods | Parallel group RCT, Netherlands | |
| Participants | Inclusion criteria: neurologically stable, > 3 months after stroke, aphasia, motivated, clear but 'not too severe' naming difficulties
Exclusion criteria: none listed
Group 1: 5 participants
Group 2: 5 participants
Groups comparable at baseline Details of participants are shown in Table 6 |
|
| Interventions |
1. Task Specific Naming SLT Intervention: task‐specific SLT. Materials: therapy equipment for the practice of naming was formed by half the number of items of the naming test. The 40 images were distributed as follows: 10 animals, 10 objects from the house, 10 objects without any relation to each other and 10 action verbs. The therapy material for practicing the sentence making also contained half of the number of items that was used for the test for 'making sentences'. The 15 training sentences had the following structure: 3 sentences NP‐V, NP‐5 sentences V‐NP, and NP‐7 sentences V‐PP. Procedures: systematic tracking of a number of steps. The steps that must be carried out by the practitioner are dependent on the response of the patient. This response consists of a description (B), a semantic (C) or a phonological paraphasia (D), the therapist responds with cues as respectively: "Yes, it is to sleep in, so .." (bed) , "It's not a table, but a ...?" (chair), or "It's not unicorn, but ..?" (squirrel). If the patient after these cues did not give the right response, or no response (A), then the patient will be prompted for the initial sound of the target word. If the patient does not know the initial sound, then this is offered by the therapist. In the next step, the patient is invited to designate the target word on a map, where there are 4 words in large letters (the target word, a semantically related word, a phonetic‐cognate and non‐cognate) are presented. The final step in the practice consists of the repetition of the intended word. For the naming task: for each picture, the patient is first given the opportunity to produce the appropriate sentence. When the patient fails, the patient is helped depending on the response. The patient is helped with questions like, "Who is this? '(e.g. a girl), "What is she doing? "(e.g. letter) and "What do they write?" (e.g. letter). After the lack of proper response to any of these questions, the answer is always offered by the therapist. When the patient, despite these cues, is not able to produce the correct sense, the whole sentence is offered, which the patient has to repeat. In each therapy session, the 15 items were offered once. Provided by: phase 1: research speech and language therapists, phase 2: participant's own speech and language therapist Delivery: 1‐to‐1, face‐to‐face, location not reported. Regimen: phase 1: 1 h twice weekly for 6 weeks. Phase 2: 3 weeks 'free therapy'. Tailoring: individualised. Modification: individualised. Adherence: not reported 2. Conventional SLT Intervention: general stimulation speech and language therapy especially expressive tasks. Materials: not reported.Procedures: spontaneous language (approximately 15 minutes), repeating words (approximately 10 minutes), reading out sentences (about 10 minutes), and sentence construction (about 15 minutes). With the exception of spontaneous speech, the emphasis in all these tasks was on repeated exposure to the items. If the patient was not able to produce the correct response, the correct response was given by the therapist, and the patient repeated the response. The therapy material was the same for every patient. Provided by: speech and language therapist Delivery: 1‐to‐1, face‐to‐face, location not reported. Regimen: not reported but continued for 9 weeks. Tailoring: none. Modification: not reported. Adherence: not reported |
|
| Outcomes | Outcome measures: FE‐Scale (expression), naming (test not specified), sentence construction (not described) Assessed at baseline and 6 months and follow‐up at 9 weeks | |
| Notes | Translated by Mrs Christine Versluis (Netherlands), Ms Floortje Klijn and Mr Bart Lamers (Netherlands) Statistical data included within the review meta‐analyses |
|
| Risk of bias | ||
| Bias | Authors' judgement | Support for judgement |
| Random sequence generation (selection bias) | Unclear risk | Not reported |
| Allocation concealment (selection bias) | Unclear risk | Not reported |
| Blinding (performance bias and detection bias) All outcomes | Unclear risk | Outcome assessor blinding not reported |
| Incomplete outcome data (attrition bias) All outcomes | Low risk | All randomised participants included in analyses |
| Selective reporting (reporting bias) | Low risk | All prespecified outcomes reported |
| Other bias | Unclear risk | Groups comparable at baseline (age, time poststroke) Sample size calculation not reported |
Varley 2016i.
| Methods | RCT (cross‐over), UK | |
| Participants | 50 participants randomised a
and not receiving impairment SLT Inclusion criteria: unilateral left‐hemisphere lesion, adults, at least 6 months poststroke, apraxia of speech Exclusion criteria: not premorbidly competent in English, insufficient auditory and visual acuity to interact with laptop, currently receiving impairment‐based SLT or presence of degenerative neurocognitive impairment Group 1: 25 participants reported Group 2: 25 participants reported Details of participants are shown in Table 6 |
|
| Interventions |
1. Self administered computer programme therapy targeting whole word production and error reduction strategies ("Speech‐first") Intervention: computer SLT . Errorless learning, therapy delivered at level of sufficient level of difficulty and intensity to facilitate neuronal reorganisation. Materials: computer‐based programme. Procedures: participant practiced automatic, fluent, errorless speech production. Aim for non‐fluent speech attempts and struggle and groping reduced. Self administered for 6 weeks. Computer booted up at point where participant had previously left off. Provided by: self administered but with access to support if required. Delivery: computer‐facilitated, 1 to computer, at home. Regimen: average of 3.3 h/week delivered over 6 weeks. Total dose = approx 20 h of self administered therapy. Tailoring: automatic tailoring of level of difficulty within computer programme. Modification: none other than the automated process. Adherence: computer programme recorded activity, mean 1187 (SE 135.2; range 254‐3029) min 2. Visuo‐spatial sham computer programme ("Sham‐first") Intervention: no SLT. Sham programme, minimal speech/language content, visuo‐spatial problem solving. Materials: delayed matching of complex designs. Procedures: automatically booted up to where participants had left off at previous session. Provided by: self administered but with access to support if required. Delivery: computer‐facilitated, 1 to computer, at home. Regimen: self administered over 6 weeks. Total dose = up to approx 18 h of self administered therapy. Tailoring: automatic tailoring of level of difficulty within computer programme. Modification: none other than the automated process. Adherence: computer programme recorded activity, mean 1058 (SE 154.22; range137‐3129) min |
|
| Outcomes | Primary outcomes: word Repetition Secondary outcomes: Comprehensive Aphasia Test (subtest Comprehension of Spoken Sentences); PALPA (written word to picture matching subtest); Picture naming test Data collection: baseline (x 2); post‐therapy 1; post‐therapy 2; follow‐up 8 weeks post‐therapy (time point 3) |
|
| Notes | Dropouts are detailed in Table 7 | |
| Risk of bias | ||
| Bias | Authors' judgement | Support for judgement |
| Random sequence generation (selection bias) | Low risk | Web‐based randomisation system, block randomised |
| Allocation concealment (selection bias) | Low risk | Adequate (blind envelope system by investigator blind to case) |
| Blinding (performance bias and detection bias) All outcomes | Low risk | Adequate |
| Incomplete outcome data (attrition bias) All outcomes | Low risk | Dropouts accounted for ITT analysis employed |
| Selective reporting (reporting bias) | Low risk | All prespecified outcomes reported |
| Other bias | Unclear risk | Groups were comparable at baseline in relation to measures of aphasia and apraxia severity (Spoken Picture Naming, Spoken Reversible Sentence Comprehension, Auditory Lexical Decision, Auditory Minimal Pairs, non‐word repetition accuracy; Repetition of words of increasing syllable length; non‐speech oro motor tasks, mean phonation time in seconds, DDK rates), mean time postonset 22 months (range 5‐105) months. There was a sex imbalance in the 'speech‐first' condition, with more men than women. Power calculation a priori |
Varley 2016ii.
| Methods | RCT (cross‐over), UK | |
| Participants | 50 participants randomised Inclusion criteria: unilateral left‐hemisphere lesion, adults, at least 6 months poststroke, apraxia of speech. Exclusion criteria: not premorbidly competent in English, insufficient auditory and visual acuity to interact with laptop, currently receiving impairment based SLT or presence of degenerative neurocognitive impairment. Group 1: 23 participants reported Group 2: 25 participants reported Details of participants are shown in Table 6 |
|
| Interventions |
1. Early self administered computer programme therapy targeting whole word production and error reduction strategies + late visuo‐spatial sham computer programme ("Speech‐first/Sham‐second" group) Intervention: previously described in Varley 2016i. 2. Late self administered computer programme therapy targeting whole word production and error reduction strategies + early visuo‐spatial sham computer programme ("Speech‐second/Sham‐first" group) Intervention: previously described in Varley 2016i. After a 4‐week rest phase, the cross‐over period began. The speech‐first group received sham intervention, and the sham‐first group received the speech programme. Programmes were again available for approx 6 weeks. Laptops were then withdrawn. |
|
| Outcomes | Primary outcomes: word repetition Secondary outcomes: Comprehensive Aphasia Test (subtest Comprehension of Spoken Sentences); PALPA (written word to picture matching subtest); Picture naming test Data collection: baseline (x 2); Post‐therapy 1; Post‐therapy 2; Follow‐up 8 weeks post‐therapy (Time point 3) Further reassessment was completed (outcome 2 (O2)). |
|
| Notes | Dropouts are detailed in Table 7 | |
| Risk of bias | ||
| Bias | Authors' judgement | Support for judgement |
| Random sequence generation (selection bias) | Low risk | Web‐based randomisation system, block randomised |
| Allocation concealment (selection bias) | Low risk | Adequate (blind envelope system by investigator blind to case) |
| Blinding (performance bias and detection bias) All outcomes | Low risk | Adequate |
| Incomplete outcome data (attrition bias) All outcomes | Low risk | Dropouts accounted for ITT analysis employed |
| Selective reporting (reporting bias) | Low risk | All prespecified outcomes reported |
| Other bias | Unclear risk | Groups were comparable at baseline in relation to measures of aphasia and apraxia severity (Spoken Picture Naming, Spoken Reversible Sentence Comprehension, Auditory Lexical Decision, Auditory Minimal Pairs, non‐word repetition accuracy; repetition of words of increasing syllable length; non‐speech oro motor tasks, mean phonation time in seconds, DDK rates), mean time postonset 22 months (range 5‐105) months. 39 right (or predominantly right) handed, 3 mixed laterality, 2 predominantly left‐handed) Power calculation a priori |
VERSE I.
| Methods | RCT, Australia | |
| Participants | Inclusion criteria: acute stroke admission within 5 d of stroke symptoms, CT or MRI confirmed diagnosis of stroke within 24 h after admission, aphasia as identified using the FAST, conscious, medically stable, can maintain a wakeful and alert state for at least 30 minutes, WABAQ < 93.8 Exclusion criteria: previous history of aphasia, mental illness, dementia, subarachnoid or subdural haemorrhage or neurosurgical intervention, non‐English speaking background, uncorrected hearing or vision impairment Group 1: 32 participants Group 2: 27 participants Details of participants are shown in Table 6 |
|
| Interventions |
1. High‐intensity SLT Intervention: "High intensity SLT" with intervention chosen from Lexical‐sematic SLT (BOX, Visch‐Brink 2001); Mapping SLT; or Semantic Feature Analysis: "adhered to principles of neurorehab, incorporating repetitious trained activity with facilitation of error free learning", "Picture description task involved planning and execution of verbal communication in supported context". Materials: "resources provided to each treating site".Procedures: "as per published instructions". Picture description tasks. Provided by: speech and language therapist. Delivery: 1‐to‐1, face‐to‐face, inpatients in acute hospital. Regimen: 30‐80 min 5 d weekly up to 4 weeks (or 20 sessions). Total maximum dose = 26.5 h therapy (Min of 2.5 h). Tailoring: therapists were instructed to provide treatment from the above therapy types, according the participant's needs. Modification: therapists were instructed to provide treatment from the above therapy types, according the participant's needs. Adherence: therapist recorded and monitored. Patient compliance monitored. Some self selected to drop out. 2. Conventional SLT Intervention: "Usual care", with intervention chosen from Lexical‐sematic SLT (BOX, Visch‐Brink 2001); Mapping SLT; or Semantic Feature Analysis: "adhered to principles of neurorehab, incorporating repetitious trained activity with facilitation of error free learning" "Picture description task involved planning and execution of verbal communication in supported context". Materials: "resources provided to each treating site".Procedures: "as per published instructions". Picture description tasks. Provided by: speech and language therapist. Delivery: 1‐to‐1, face‐to‐face, inpatients in acute hospital. Regimen: up to 80 minutes, 1 session per week up to 4 weeks. Total maximum dose = 5.3 h therapy. Tailoring: therapists were instructed to provide treatment from the above therapy types, according the participant's needs. Modification: therapists were instructed to provide treatment from the above therapy types, according the participant's needs. Adherence: therapist recorded and monitored. Patient compliance monitored. Some self‐selected to drop out. |
|
| Outcomes | Primary outcome measures: AQ and FCP at acute hospital discharge
Secondary outcome measures: AQ, FCP and DA scores at 6 months poststroke Data collection: 4 weeks then follow‐up at 6 months' poststroke |
|
| Notes | 3 acute‐care hospitals Groups comparable at baseline in relation to age, sex, previous stroke, stroke type and stroke classification Dropouts: 8 (intensive SLT 7; conventional SLT 1); loss to follow‐up: 6 (intensive SLT 4; conventional SLT 2). Dropouts are detailed in Table 7 Statistical data included within the review meta‐analyses |
|
| Risk of bias | ||
| Bias | Authors' judgement | Support for judgement |
| Random sequence generation (selection bias) | Low risk | Random number generator |
| Allocation concealment (selection bias) | Low risk | Sealed envelopes |
| Blinding (performance bias and detection bias) All outcomes | Low risk | Assessors blinded (3 speech and language therapists and 3 final year SLT students) |
| Incomplete outcome data (attrition bias) All outcomes | Low risk | ITT was employed |
| Selective reporting (reporting bias) | Low risk | All prespecified outcomes reported |
| Other bias | Low risk | Some indication that the 2 groups' severity of stroke and severity of aphasia differed at baseline (P = 0.057), but this was adjusted for in the analysis |
VERSE II.
| Methods | RCT, Australia | |
| Participants | Inclusion criteria: acute stroke diagnosed by a neurologist or stroke physician and confirmed by computer tomography, MRI or both with 48 h of hospital admission, aphasia as diagnosed by a score of less than 13/20 on the shortened FAST, medical stability as measured by a GCS > 10 indicating a moderate level of alertness, sufficient wakefulness to participate in therapy demonstrated by the ability to maintain sufficient alertness to interact for at least 30 consecutive minutes, WABAQ < 93.7 Exclusion criteria: documented previous diagnosis of aphasia, head injury, neurodegenerative disease or mental illness, previous medical history of sub‐arachnoid and/ or sub‐dural haemorrhage or neurosurgical intervention, uncorrected hearing or vision impairment and non‐fluent English as a second language Group 1: 12 participants Group 2: 8 participants Details of participants are shown in Table 6 |
|
| Interventions |
1. CIAT Intervention: CIAT. Based on principles of constraint induced movement therapy and neuroplasticity, provision of intensive therapy and massed practice. CIAT also provides pragmatically communicative therapeutic context thus communicative effectiveness is maximised and learned non‐use of expressive language minimised. Materials: target materials designed to shape individuals' language production with rules and reinforcement contingencies used to extend expressive output. The picture stimuli within each set of cards accommodated a verbal response ranging from single words to sentences. Increased target description, extended phrasal and clausal structures and politeness markers were encouraged to achieve increased utterance complexity and appropriateness according to each player's ability. The therapist provided language support as required to each player according to their individual needs. This was established at initial assessment and monitored and adjusted in response to the individual's performance within the treatment sessions. Full treatment protocol is available. Procedures: on CIAT as outlined by Pulvermuller 2001. Due to the early nature of the intervention, therapy was modified from the original 3 h per day to 1 h per day. Therapy was conducted by 1 speech pathologist with groups of 2‐4 people with aphasia playing CIAT. The therapy task of CIAT was a request and response language game in which participants aimed to collect the highest number of pairs of picture cards. Participants were constrained to interact through verbal production only. Sitting around a table, each participant had a visual barrier preventing them from seeing the cards of other group members, while allowing them to see and hear each other. Shielded by the screen, participants could use self cued gesture to facilitate their verbal production. Participants took turns to try to obtain a card from another player by verbally requesting a card. Each request prompted a verbal response such as confirmation, clarification or negation. Provided by: 8 speech and language therapists. Range of experience (1‐23 years), All had 3 h of therapy training prior to delivery of therapy in trial. Delivery: group, face‐to‐face, acute or rehab hospitals. Regimen: 45‐60 minutes, 5 d a week for 20 sessions over 5 weeks. Total dose = 15‐20 h therapy. Tailoring: increased target description, extended phrasal and clausal structures and politeness markers were encouraged to achieve increased utterance complexity and appropriateness according to each player's ability. The therapist provided language support as required to each player according to their individual needs. This was established at initial assessment and monitored and adjusted in response to the individual's performance within the treatment sessions. Modification: (as described in Tailoring). Adherence: not reported 2. Conventional SLT Intervention: conventional SLT. Usual care. Materials: Semantic Feature Therapy (Boyle 1995), Cued Naming Therapy (Nettleton 1991), Lexical Semantic (BOX) Therapy (Visch‐Brink 1997), Mapping Therapy (Schwartz 1994), and Phonological Feature Mapping (Raymer 1993). The therapies were administered following the respective published instructions. Participants received either 1 therapy or a combination of therapy types as appropriate. Procedures: participants in this therapy arm received an individualised programme tailored to meet their needs. Using the individual's initial assessment results to inform their decision making, the treating therapist selected the appropriate therapy from a range of approaches. Provided by: 8 speech and language therapists. Range of experience (1‐23 years), All had 3 h of therapy training prior to delivery of therapy in trial. Delivery: 1‐to‐1, face‐to‐face. Acute or rehab hospitals. Regimen: 45‐60 minutes, 5 d a week for 20 sessions over 5 weeks. Total dose = 15‐20 h therapy. Tailoring: yes, individualised programme tailored to meet individual patient needs. Initial assessment results informed decision making and selection of appropriate therapy. Modification: as therapy progressed based on individual monitoring of patient and progression through treatment hierarchies accordingly. Adherence: not reported |
|
| Outcomes | Primary outcomes: WABAQ
Secondary outcomes: Discourse Analysis, SAQoL Data collection: baseline, post‐treatment, 12 and 26 weeks poststroke |
|
| Notes | Statistical data included within the review meta‐analyses | |
| Risk of bias | ||
| Bias | Authors' judgement | Support for judgement |
| Random sequence generation (selection bias) | Low risk | Computer‐generated, blocked randomisation |
| Allocation concealment (selection bias) | Low risk | Sealed opaque envelopes controlled by admin staff external to the trial |
| Blinding (performance bias and detection bias) All outcomes | Low risk | Trained assessors not involved in provision of therapy and blinded to group allocation |
| Incomplete outcome data (attrition bias) All outcomes | Low risk | No dropouts reported ITT not employed |
| Selective reporting (reporting bias) | Low risk | All prespecified outcomes reported |
| Other bias | Unclear risk | Groups were comparable at baseline for age, sex, stroke type, hemisphere, mRS, admission to assessment (d) and aphasia severity (AQ) (but significantly (P = 0.037 more PACS in CIAT; More TACS in usual care by Oxfordshire stroke scale) |
Wertz 1981.
| Methods | Parallel group, multicentre RCT, USA (5 sites) | |
| Participants | Inclusion criteria: male veteran, aged 40‐80 years, premorbidly literate in English, first thromboembolic left CVA, no co‐existing major medical complications, hearing no worse than 40 dB in poorer ear, corrected vision no worse than 20/100 in poorer eye, adequate sensory/motor ability in 1 hand to write/gesture, 4 weeks postonset, language severity 15th to 75th overall percentile on PICA
Exclusion criteria: none listed
Group 1: 32 participants
Group 2: 35 participants Details of participants are shown in Table 6 |
|
| Interventions |
1. Group SLT Intervention: "Group SLT". Direct SLT contact designed to stimulate language through social interaction, no direct manipulation of deficits, encouraged group discussion on current events and topics; no direct attempts to improve or correct incorrect responses (4 h weekly) and group recreational activities (4 h weekly). Materials: not reported. Procedures: groups 3‐7 participants. 4 h in group with therapist plus 4 h of group activities weekly. Followed treatment protocol. Provided by: speech and language therapist. Delivery: group, face‐to‐face (4 h with therapist and group; 4 h with group); medical centre. Regimen: 4 h in group with therapist plus 4 h of group activities weekly for up to 44 weeks.Total dose = 352 h. Tailoring: some suggestion of individualised prompts to participate if required. Modification: not reported. Adherence: treatment tasks and patient performance recorded in treatment logs. Dropouts were noted. 2. Conventional SLT Intervention: "Conventional SLT". Direct, stimulus‐response manipulation of speech and language deficits plus 4 h of machine‐assisted treatment and SLT drill. Materials: not reported.Procedures: 4 h with therapist plus 4 h machine‐assisted treatment and SLT drills weekly. Traditional, individual, stimulus response type treatment of speech and language deficits in all communicative modalities. Provided by: research SLT employed to deliver all treatments and "machine‐assisted treatment" (not reported). Delivery: 1‐to‐1, face‐to‐face and machine assisted; medical centre. Regimen: 4 h with therapist plus 4 h machine‐assisted treatment and SLT drills weekly for up to 44 weeks.Total dose = 352 h therapy. Tailoring: "individualised". Modification: yes. Adherence: treatment tasks and patient performance recorded in treatment logs. Dropouts were noted. |
|
| Outcomes | Primary outcomes: PICA, Token Test, word fluency measure, Conversational Rating, informants' ratings of functional language use Data collection: assessed at baseline and every 11 weeks until end of 44‐week treatment or withdrawal of participant | |
| Notes | Dropouts: 33 participants (group SLT 16; conventional SLT 17). Dropouts are detailed in Table 7 Some statistical data included within the review meta‐analyses |
|
| Risk of bias | ||
| Bias | Authors' judgement | Support for judgement |
| Random sequence generation (selection bias) | Unclear risk | Not reported |
| Allocation concealment (selection bias) | Unclear risk | Not reported |
| Blinding (performance bias and detection bias) All outcomes | Low risk | Outcome assessors blinded |
| Incomplete outcome data (attrition bias) All outcomes | High risk | ITT analysis not employed |
| Selective reporting (reporting bias) | Unclear risk | Not all prespecified outcomes reported in the paper |
| Other bias | Unclear risk | Groups comparable at baseline Sample size calculation not reported |
Wertz 1986i.
| Methods | Cross‐over group, multicentre RCT (only data collected prior to cross‐over treatment included in this review), USA (5 sites) | |
| Participants | Inclusion criteria: male veteran, maximum 75 years old, 2‐24 weeks postonset, single left thromboembolic CVA, no previous or co‐existing neurological, serious medical or psychological disorder, no worse than 20/100 corrected vision in better eye, hearing no worse than 40 dB unaided in better ear, sensory/motor ability in 1 upper limb to gesture or write, premorbidly literate in English, maximum 2 weeks between onset and trial entry, language severity 10th to 80th PICA overall, non‐institutionalised living environment, outside assistant volunteer available
Exclusion: none listed
Group 1: 38 participants
Group 2: 40 participants Details of participants are shown in Table 6 |
|
| Interventions |
1. Conventional SLT Intervention: clinic treatment. Rationale not reported. Materials: details not reported. Procedures: "stimulus‐response treatment, designed to improve language deficits in auditory comprehension, reading, oral‐expressive language and writing". Techniques ranged from traditional facilitation methods (picture description, verbal repetition, sentence completion and confrontation naming) to specific programmes such as Melodic Intonation Therapy and PACE Provided by: speech and language therapist. Delivery: 1‐to‐1, face‐to‐face, clinic. Regimen: 8‐10 h weekly for 12 weeks. Total dose = up to 120 h therapy. Tailoring: individualised. Modification: individualised. Adherence: yes, but method not reported. 2. No SLT Intervention: deferred SLT . Materials: none. Procedures: SLT after cross‐over at 12 weeks Provided by: none Delivery: none. Regimen: not applicable. Tailoring: not applicable. Modification: not applicable. Adherence: yes, but method not reported. |
|
| Outcomes | Primary outcomes: PICA, CADL, RCBA, Token Test Data collection: baseline, 6 and 12 weeks with follow‐up at 18 and 24 weeks | |
| Notes | Estimated sample size
Dropouts: 20 participants (conventional SLT 9; no SLT 11). Dropouts are detailed in Table 7 Statistical data included within the review meta‐analyses |
|
| Risk of bias | ||
| Bias | Authors' judgement | Support for judgement |
| Random sequence generation (selection bias) | Unclear risk | Not reported |
| Allocation concealment (selection bias) | Unclear risk | Not reported |
| Blinding (performance bias and detection bias) All outcomes | Low risk | Outcome assessors blinded |
| Incomplete outcome data (attrition bias) All outcomes | High risk | ITT analysis not employed |
| Selective reporting (reporting bias) | Low risk | All prespecified outcomes reported |
| Other bias | Low risk | Groups comparable at baseline |
Wertz 1986ii.
| Methods | Cross‐over group, multicentre RCT (only data collected prior to cross‐over treatment included in this review), USA (5 sites) | |
| Participants | Inclusion criteria: male veteran, maximum 75 years old, 2‐24 weeks postonset, single left thromboembolic CVA, no previous neurological involvement/co‐existing serious medical or psychological disorder, no worse than 20/100 corrected vision in better eye, hearing no worse than 40 dB unaided in better ear, sensory/motor ability in 1 upper limb to gesture/write, premorbidly literate in English, maximum 2 weeks between onset and trial entry, language severity 10th to 80th PICA overall, non‐institutionalised living environment, outside assistant volunteer available
Exclusion: none listed
Group 1: 43 participants
Group 2: 40 participants
Groups comparable at baseline Details of participants are shown in Table 6 |
|
| Interventions |
1. Volunteer‐facilitated SLT Intervention: "Home treatment by trained volunteer". Rationale not reported. Materials: general treatment principles specified in treatment protocol but specific techniques designed to meet each patient's deficits. Techniques ranged from traditional facilitation methods (picture description, verbal repetition, sentence completion and confrontation naming) to specific programmes such as Melodic Intonation Therapy and PACE Procedures: planned and directed by SLT, treatment programme "usually stimulus‐response treatment, designed to improve language deficits in auditory comprehension, reading, oral‐expressive language and writing". Provided by: trained volunteer (family member/friend) ‐ no experience in health care prior to study. Received 6‐10 h of training including information about aphasia, observation of treatment on videotapes and demonstration and practice with treatment techniques volunteers would use with patient. Delivery: 1‐to‐1, face‐to‐face, home‐based. Regimen: 8 ‐10 h weekly for 12 weeks. Total dose = up to 120 h therapy. Tailoring: individualised.Modification: individualised. Adherence: yes, weekly communication with volunteers to review and answer questions. modify treatment tasks, via weekly face‐to‐face or telephone contact. Every 2 weeks patient and volunteer were videotaped in a half hour session and reviewed and adjustments were suggested when necessary. 2. No SLT Intervention: deferred SLT . Materials: none. Procedures: SLT after cross‐over at 12 weeks Provided by: none Delivery: none. Regimen: not applicable. Tailoring: not applicable. Modification: not applicable. Adherence: yes, but method not reported. |
|
| Outcomes | Primary outcomes: PICA, CADL, RCBA, Token Test Data collection: baseline, 6 and 12 weeks with follow‐up at 18 and 24 weeks | |
| Notes | USA over 5 sites
Estimated sample size
Dropouts: 18 participants (trained volunteer SLT 7; no SLT 11). Dropouts are detailed in Table 7 Statistical data included within the review meta‐analyses |
|
| Risk of bias | ||
| Bias | Authors' judgement | Support for judgement |
| Random sequence generation (selection bias) | Unclear risk | Not reported |
| Allocation concealment (selection bias) | Unclear risk | Not reported |
| Blinding (performance bias and detection bias) All outcomes | Low risk | Outcome assessors blinded |
| Incomplete outcome data (attrition bias) All outcomes | High risk | ITT analysis not employed |
| Selective reporting (reporting bias) | Low risk | All prespecified outcomes reported |
| Other bias | Low risk | Groups comparable at baseline |
Wertz 1986iii.
| Methods | Cross‐over group, multicentre RCT (only data collected prior to cross‐over treatment included in this review), USA (5 sites) | |
| Participants | Inclusion criteria: male veteran, maximum 75 years old, 2‐24 weeks after single left thromboembolic stroke, no previous neurological involvement/co‐existing serious medical or psychological disorder, at least 20/100 corrected vision, hearing at least 40 dB unaided, sensory/motor ability in 1 upper limb to gesture or write, premorbidly literate in English, maximum 2 weeks between onset and trial entry, language severity 10th to 80th percentile on PICA, non‐institutionalised living, volunteer available
Exclusion: none listed
Group 1: 43 participants
Group 2: 38 participants
Groups comparable at baseline Details of participants are shown in Table 6 |
|
| Interventions |
1. Volunteer‐facilitated SLT Intervention: "Home treatment by trained volunteer". Rationale not reported. Materials: general treatment principles specified in treatment protocol but specific techniques designed to meet each patient's deficits. Techniques ranged from traditional facilitation methods (picture description, verbal repetition, sentence completion and confrontation naming) to specific programmes such as Melodic Intonation Therapy and PACE Procedures: planned and directed by SLT, treatment programme "usually stimulus‐response treatment, designed to improve language deficits in auditory comprehension, reading, oral‐expressive language and writing". Provided by: trained volunteer (family member/friend) ‐ no experience in health care prior to study. Received 6‐10 h of training including information about aphasia, observation of treatment on videotapes and demonstration and practice with treatment techniques volunteers would use with patient. Delivery: 1‐to‐1, face‐to‐face, home‐based. Regimen: 8‐10 h weekly for 12 weeks. Total dose = up to 120 h therapy. Tailoring: individualised.Modification: individualised. Adherence: yes, Weekly communication with volunteers to review and answer questions. modify treatment tasks, via weekly face‐to‐face or telephone contact. Every 2 weeks patient and volunteer were videotaped in a half hour session and reviewed and adjustments were suggested when necessary. 1. Conventional SLT Intervention: clinic treatment. Rationale not reported. Materials: details not reported. Procedures: "stimulus‐response treatment, designed to improve language deficits in auditory comprehension, reading, oral‐expressive language and writing". Techniques ranged from traditional facilitation methods (picture description, verbal repetition, sentence completion and confrontation naming) to specific programmes such as Melodic Intonation Therapy and PACE) Provided by: speech and language therapist. Delivery: 1‐to‐1, face‐to‐face, clinic. Regimen: 8‐10 h weekly for 12 weeks. Total dose = up to 120 h therapy. Tailoring: individualised. Modification: individualised. Adherence: yes, but method not reported. 20 participants (conventional SLT 9; no SLT 11). |
|
| Outcomes | Primary outcomes: PICA, CADL, RCBA, Token Test Data collection: baseline, 6 and 12 weeks with follow‐up at 18 and 24 weeks | |
| Notes | Estimated sample size
Dropouts: 16 participants (volunteer‐facilitated SLT 9; conventional SLT 7). Dropouts are detailed in Table 7 Statistical data included within the review meta‐analyses |
|
| Risk of bias | ||
| Bias | Authors' judgement | Support for judgement |
| Random sequence generation (selection bias) | Unclear risk | Not reported |
| Allocation concealment (selection bias) | Unclear risk | Not reported |
| Blinding (performance bias and detection bias) All outcomes | Low risk | Outcome assessors blinded |
| Incomplete outcome data (attrition bias) All outcomes | High risk | ITT analysis not employed |
| Selective reporting (reporting bias) | Low risk | All prespecified outcomes reported |
| Other bias | Low risk | Groups comparable at baseline |
Wilssens 2015.
| Methods | Multicentre RCT, Netherlands | |
| Participants | Inclusion criteria: adult, isolated first stroke, imaging confirmed left hemisphere stroke, moderate fluent aphasia with phonological and semantic deficits (based on (lang) Stanine norms of Token test; (semantic) AAT comprehension; Verbal Semantic Association Test; PALPA Synonym Judgement and Semantic Word Association of low imageability words, (phonological) AAT Repetition, PALPA Nonword Repetition and Auditory Lexical Decision), also had to score above the 75th percentile on Raven's Coloured Progressive Matrices (Raven 1976) (visuoperceptual problem solving). by means of a standard handedness inventory (Oldfield 1971)
Exclusion criteria: participation in other treatment programme, additional neurological or psychiatric disorder, and patients with severe perceptual, additional speech (e.g. verbal apraxia), or cognitive deficits evidenced by formal neuropsychological testing
Group 1: 5 participants
Group 2: 4 participants Details of participants are shown in Table 6 |
|
| Interventions |
1. Constraint Induced Aphasia Therapy Intervention: CIAT. Intensive constraint‐based intervention thought to be effective. Materials: CIAT treatment is a communication‐based group interaction by means of communicative card games. The picture cards contain objects of high as well as low frequent words, black‐and‐white line drawings as well as colored pictures, pictures of objects as well as action cards, and pictures with minimal pairs (e.g. sock and rock) based on Maher 2006, Meinzer 2005b, Meinzer 2007, Pulvermuller 2001. Patients were allowed to produce gestures in order to facilitate verbal output, but their gestures were hidden from the other participants by a 40 cm high screen between the patient and the other participants. Procedures: dual card game was used (e.g. Maher 2006). Participants dealt cards from a set of 32‐42 coloured cards (i.e., 16‐21 pairs of identical cards) per 45 min treatments. They take turns either requesting an identical card from the other participant (4 to 6 cards per participant) or responding to that request. Constraints were along 3 dimensions: difficulty of the material; the rules of the game, as indicated by verbal instruction and shaping; and reinforcement contingencies (Pulvermuller 2001). Provided by: 7 trained speech language therapy students (3rd year professional bachelor level). Students under supervision of 6 experienced and professionally trained speech and language therapists. Students were trained according to the training protocol of lay people designed by Meinzer 2007. The speech and language therapists had been given detailed instructions by means of a 2 h presentation in which the study was presented. The basic principles of BOX and CIAT were introduced, and the materials, procedures, and approaches of both types of intervention were carefully explained. In addition, students were given a 1 h practical training session. Instruction sessions contained illustrative video materials. The students and therapists were given a detailed manual with explicit guidelines about CIAT and BOX. Delivery: group, face‐to‐face, 1 of 4 hospital settings in the Netherlands. Regimen: 2‐3 h sessions per day on 9 or 10 consecutive working days (total mean duration ± SD = 1195 ± 59, pauses not included). Each session was interrupted by 2 breaks of 10 to 15 min. Tailoring: daily records were used for a daily evaluation and critical assessment of each session in order to adjust individual or group task difficulty for the next session. Modification: yes, adjusted to individual or group task difficulty for the next session. Adherence: students and therapists kept a detailed daily record of each intervention, specifying the presence of participants and therapists, the duration of the training in minutes, and the training materials used. Actual adherence or fidelity to treatment not reported. 2. BOX Intervention: Semantic SLT. A Dutch drill‐based lexical‐semantic treatment therapy programme (Visch‐Brink 2001). Materials: focuses on the interpretation of written words, sentences, and texts (also with an auditory presentation by the speech and language therapist if required). Procedures: BOX contains a variety of semantic decision tasks aimed at enhancing semantic processing. 8 different types of exercises within each task, and the patient is required to deny or confirm the semantic relationship between (written and auditorily presented) content words, either presented separately or within the context of a sentence or text. Word choice, number of distractors, semantic relatedness, and ambiguity were taken into account in creating the different levels of difficulty (Visch‐Brink 1997). The patients in the BOX group worked alternatively by themselves on worksheets and with the therapist according to a therapy schedule (see Table 2), which allowed 1 therapist to supervise 2 patients. For example, on the first day, patient 1 started with 30 min of therapy (Therapy Schedule BOX 1) whereas patient 2 began with a 30 min individual working session (Therapy Schedule BOX 2). The next day, participants swapped therapy schedules. Patients were able to adjust their personal level of difficulty. In order to apply the shaping principle, therapists monitored performance and solicited patient feedback to ensure that patients were challenged but not overly frustrated. Provided by: 7 trained speech language therapy students (3rd year professional bachelor level). Students under supervision of 6 experienced and professionally trained speech and language therapists. Students were trained according to the training protocol of laypeople designed by Meinzer 2007. The speech and language therapists had been given detailed instructions by means of a 2 h presentation in which the study was presented. The basic principles of BOX and CIAT were introduced, and the materials, procedures, and approaches of both types of intervention were carefully explained. In addition, students were given a 1 h practical training session. Instruction sessions contained illustrative video materials. The students and therapists were given a detailed manual with explicit guidelines about CIAT and BOX. Delivery: independent practice and 1‐to‐1, face‐to‐face, 1 of 4 hospital settings in the Netherlands. Regimen: 2‐3 h sessions per day on 9 or 10 consecutive working days (total mean duration ± SD = 1150 ± 69 min, pauses not included). Each session was interrupted by 2 breaks of 10 to 15 min. Tailoring: daily records were used for a daily evaluation and critical assessment of each session in order to adjust individual or group task difficulty for the next session. Modification: yes, adjusted to individual or group task difficulty for the next session. Adherence: students and therapists kept a detailed daily record of each intervention, specifying the presence of participants and therapists, the duration of the training in minutes, and the training materials used. Actual adherence or fidelity to treatment not reported. |
|
| Outcomes | Primary outcomes: Amsterdam Nijmegen Everyday Language Test Secondary outcomes: AAT, BNT, PALPA, SAT, ANELT CETI. Particpants also completed a written nonstandardised questionnaire (6 questions on a 7‐point Likert rating scale) regarding their satisfaction. Questions were about the satisfaction of participation, whether or not they would participate a second time, the feasibility and the pleasantness of the intensive treatment, and the preference of an intensive treatment above a nonintensive treatment. Data collection: pretreatment and 1 week after treatment |
|
| Notes | Statistical data included within the review meta‐analyses | |
| Risk of bias | ||
| Bias | Authors' judgement | Support for judgement |
| Random sequence generation (selection bias) | Low risk | Computer‐generated |
| Allocation concealment (selection bias) | Low risk | Sequentially numbered opaque, sealed envelopes until randomisation |
| Blinding (performance bias and detection bias) All outcomes | Unclear risk | Not reported |
| Incomplete outcome data (attrition bias) All outcomes | Low risk | No dropouts |
| Selective reporting (reporting bias) | Low risk | All prespecified outcomes reported |
| Other bias | Low risk | Groups comparable at baseline (for age, aphasia duration, eduational level) |
Woolf 2015i.
| Methods | RCT, UK | |
| Participants | Inclusion criteria: at least 6 months postleft hemisphere stroke, word‐finding difficulties from aphasia (20%‐70% on spoken picture naming subtest of CATs), retained demonstrated picture recognition and memory skills (scoring at least 70% on the CAT semantic and recognition memory subtests); they showed no signs of visual neglect (scoring within normal limits on the CAT line bisection test); no hearing loss > 40dB (established via pure tone audiometry); no secondary neurological diagnosis such as dementia; not receiving speech and language therapy elsewhere. Participants were also required to nominate a family member, friend or volunteer who could act as their partner in a conversation assessment and, if relevant, support their use of technology. Partners had no neurological impairment and no significant hearing loss.
Exclusion criteria: incapacity
Group 1: 5 participants
Group 2: 5 participants Details of participants are shown in Table 6 |
|
| Interventions |
1. Remote telerehab Intervention: telerehab SLT. Telerehabilitation enables patients to "access remote rehabilitation services in their own homes, typically by using internet video conferencing technologies. There are efficiency savings for both patients and service providers, mainly because the need to travel is eliminated. Such savings are particularly relevant in the context of stroke rehabilitation, where there are high levels of unmet need, and where demands on services are likely to increase". Materials: standard protocol, manualised therapy. Participants had workshop comprising pictures of their target words. Procedures: 50 words each targeted at least once per session. The therapist worked with a corresponding book, which also delineated the tasks and cues that were to be used with each word. The therapy tasks were as follows. semantic verification: the therapist pointed to the target picture and asked 2 yes/no questions about the properties of the item (e.g. for lemon: "Can you squeeze it?"; "Is it sweet?"); picture naming: the therapist pointed to the picture and asked the participant to name it. If the participant was successful, they were asked to repeat the word 3 times. If the participant was unable to name the item the therapist offered the following cues (in the given order): semantic cue (e.g. for lemon: "We eat it with sugar on pancakes"), sentence or phrase completion cue (e.g. "sour as a …" lemon), first phoneme (sound) cue ("it begins with /l/"), first syllable cue ("It begins with /lƐ/"), whole word for repetition. Once the word was produced, the participant was asked to repeat it 3 times. If they were unable to say it, the therapist repeated the word 3 times. Provided by: speech and language therapist. Therapist training not reported. Participants and partners had at least 1 technology training session and a simple written and pictorial instructions. Delivery: FaceTime via iPad (or in 1 case via Skype and PC) and use of workbook; 1‐to‐1 (with partner support) delivered at home. Regimen: 1 h sessions of therapy delivered twice a week over 4 weeks.Total dose = 8 h. Tailoring: yes. Degree of difficulty and self administered practice. Modification: yes. Degree of difficulty and self administered practice. Adherence: monitored attendance and intervention fidelity. Of those randomised no sessions missed 2. Conventional SLT Intervention: face‐to‐face SLT. Conventional naming therapy. Materials: standard protocol, manualised therapy. Participants had workshop comprising pictures of their target words. Procedures: 50 words each targeted at least once per session. The therapist worked with a corresponding book, which also delineated the tasks and cues that were to be used with each word. The therapy tasks were as follows. Semantic verification: the therapist pointed to the target picture and asked 2 yes/no questions about the properties of the item (e.g. for lemon: "Can you squeeze it?"; "Is it sweet?"); picture naming: the therapist pointed to the picture and asked the participant to name it. If the participant was successful, they were asked to repeat the word 3 times. If the participant was unable to name the item the therapist offered the following cues (in the given order): semantic cue (e.g. for lemon: "We eat it with sugar on pancakes"), sentence or phrase completion cue (e.g. "sour as a …" lemon), first phoneme (sound) cue ("it begins with /l/"), first syllable cue ("It begins with /lƐ/"), whole word for repetition. Once the word was produced, the participant was asked to repeat it 3 times. If they were unable to say it, the therapist repeated the word 3 times. Provided by: speech and language therapist. Therapist training not reported. Delivery: face‐to‐face and home use of workbook 1‐to‐1 (with partner support), at clinic and home practice. Regimen: 1 h sessions of therapy delivered twice a week over 4 weeks.Total dose = 8 h. Tailoring: yes. Degree of difficulty and self administered practice. Modification: yes. Degree of difficulty and self administered practice. Adherence: monitored attendance and intervention fidelity. Monitored via video and a human computer interaction, researcher not participating in therapy intervention |
|
| Outcomes | Primary outcomes: feasibility issues, Spoken picture naming (Best 2013) with selection of 100 (2 matched sets of 50) words (treated/untreated for the SLT group) Secondary outcomes: free conversation with partner. Discourse analysis (substantive turns, number of content words per turn, number of nouns per turn). Data collection: baseline, post‐treatment (8 weeks) and 6 week follow‐up (14 weeks) |
|
| Notes | UK Statistical data included within the review meta‐analyses |
|
| Risk of bias | ||
| Bias | Authors' judgement | Support for judgement |
| Random sequence generation (selection bias) | Low risk | Computer‐generated, blocked stratification |
| Allocation concealment (selection bias) | Low risk | Adequate |
| Blinding (performance bias and detection bias) All outcomes | High risk | Member of research team ‐ so partially (but 70% of data secondary coded by additional researcher blinded to allocation and time point). Transcription and scoring was by blinded researcher |
| Incomplete outcome data (attrition bias) All outcomes | Low risk | Dropouts accounted for |
| Selective reporting (reporting bias) | Low risk | All prespecified outcomes reported |
| Other bias | Low risk | Groups were comparable at baseline (age, time poststroke and naming and picture recognition and memory screening scores) |
Woolf 2015ii.
| Methods | RCT, UK | |
| Participants | Inclusion criteria: at least 6 months postleft hemisphere stroke, word‐finding difficulties from aphasia (20‐70% on spoken picture naming subtest of CATs), retained demonstrated picture recognition and memory skills (scoring at least 70% on the CAT semantic and recognition memory subtests); they showed no signs of visual neglect (scoring within normal limits on the CAT line bisection test); no hearing loss > 40dB (established via pure tone audiometry); no secondary neurological diagnosis such as dementia; not receiving speech and language therapy elsewhere. Participants were also required to nominate a family member, friend or volunteer who could act as their partner in a conversation assessment and, if relevant, support their use of technology. Partners had no neurological impairment and no significant hearing loss.
Exclusion criteria: incapacity
Group 1: 5 participants
Group 2: 5 participants Details of participants are shown in Table 6 |
|
| Interventions |
1. Teleconf supported SLT Intervention: telerehab SLT. Telerehabilitation enables patients to "access remote rehabilitation services in their own homes, typically by using internet video conferencing technologies. There are efficiency savings for both patients and service providers, mainly because the need to travel is eliminated. Such savings are particularly relevant in the context of stroke rehabilitation, where there are high levels of unmet need, and where demands on services are likely to increase". Materials: standard protocol, manualised therapy. Participants had workshop comprising pictures of their target words. Procedures: 50 words each targeted at least once per session. The therapist worked with a corresponding book, which also delineated the tasks and cues that were to be used with each word. The therapy tasks were as follows: semantic verification: the therapist pointed to the target picture and asked 2 yes/no questions about the properties of the item (e.g. for lemon: "Can you squeeze it?"; "Is it sweet?"); picture naming: the therapist pointed to the picture and asked the participant to name it. If the participant was successful, they were asked to repeat the word 3 times. If the participant was unable to name the item the therapist offered the following cues (in the given order): semantic cue (e.g. for lemon: "We eat it with sugar on pancakes"), sentence or phrase completion cue (e.g. "sour as a …" lemon), first phoneme (sound) cue ("it begins with /l/"), first syllable cue ("It begins with /lƐ/"), whole word for repetition. Once the word was produced, the participant was asked to repeat it 3 times. If they were unable to say it, the therapist repeated the word 3 times. Provided by: speech and language therapist. Therapist training not reported. Participants and partners had at least 1 technology training session and a simple written and pictorial instructions. Delivery: FaceTime via iPad (or in 1 case via Skype and PC) and use of workbook; 1‐to‐1 (with partner support) delivered at home. Regimen: 1 h sessions of therapy delivered twice a week over 4 weeks.Total dose = 8 h. Tailoring: yes. Degree of difficulty and self administered practice. Modification: yes. Degree of difficulty and self administered practice. Adherence: monitored attendance and intervention fidelity. Of those randomised, no sessions missed 2. Teleconference‐supported conversation Intervention: social support. Attention control. Materials: none. Procedures: conversational support techniques from trained SLT students. Provided by: speech and language therapy students. Received 1/2 day training session in supported conversation techniques (conversation initiation, adaptation of communication; resolve breakdowns, use of iPad and FaceTime technology), also given handbook with further advice. Delivery: facetime via iPad, 1‐to‐1, in patients home from university. Regimen 8 remote conversations, scheduled twice a week (8 h in total). Tailoring: yes, to patient conversation. Modification: yes, individualised conversational support. Adherence: not reported |
|
| Outcomes | Primary outcomes: feasibility issues, spoken picture naming (Best 2013) with selection of 100 (2 matched sets of 50) words (treated/untreated for the SLT group) Secondary outcomes: free conversation with partner. Discourse analysis (substantive turns, number of content words per turn, number of nouns per turn). Data collection: baseline, post‐treatment (8 weeks) and 6 week follow‐up (14 weeks) |
|
| Notes | Statistical data included within the review meta‐analyses | |
| Risk of bias | ||
| Bias | Authors' judgement | Support for judgement |
| Random sequence generation (selection bias) | Low risk | Computer‐generated, blocked stratification |
| Allocation concealment (selection bias) | Low risk | Adequate |
| Blinding (performance bias and detection bias) All outcomes | High risk | Member of research team ‐ so partially (but 70% of data secondary coded by additional researcher blinded to allocation and time point). Transcription and scoring was by blinded researcher |
| Incomplete outcome data (attrition bias) All outcomes | Low risk | Dropouts accounted for |
| Selective reporting (reporting bias) | Low risk | All prespecified outcomes reported |
| Other bias | Low risk | Groups were comparable at baseline (age, time poststroke and naming and picture recognition and memory screening scores) |
Woolf 2015iii.
| Methods | RCT, UK | |
| Participants | Inclusion criteria: at least 6 months postleft hemisphere stroke, word finding difficulties from aphasia (20‐70% on spoken picture naming subtest of CATs), retained demonstrated picture recognition and memory skills (scoring at least 70% on the CAT semantic and recognition memory subtests); they showed no signs of visual neglect (scoring within normal limits on the CAT line bisection test); no hearing loss >40dB (established via pure tone audiometry); no secondary neurological diagnosis such as dementia; not receiving speech and language therapy elsewhere. Participants were also required to nominate a family member, friend or volunteer who could act as their partner in a conversation assessment and, if relevant, support their use of technology. Partners had no neurological impairment and no significant hearing loss.
Exclusion criteria: incapacity
Group 1: 5 participants
Group 2: 5 participants Details of participants are shown in Table 6 |
|
| Interventions |
1. Conventional SLT Intervention: face‐to‐face SLT. Conventional naming therapy. Materials: standard protocol, manualised therapy. Participants had workshop comprising pictures of their target words. Procedures: 50 words each targeted at least once per session. The therapist worked with a corresponding book, which also delineated the tasks and cues that were to be used with each word. The therapy tasks were as follows: semantic verification: the therapist pointed to the target picture and asked 2 yes/no questions about the properties of the item (e.g. for lemon: "Can you squeeze it?"; "Is it sweet?"); picture naming: the therapist pointed to the picture and asked the participant to name it. If the participant was successful, they were asked to repeat the word 3 times. If the participant was unable to name the item the therapist offered the following cues (in the given order): semantic cue (e.g. for lemon: "We eat it with sugar on pancakes"), sentence or phrase completion cue (e.g. "sour as a …" lemon), first phoneme (sound) cue ("it begins with /l/"), first syllable cue ("It begins with /lƐ/"), whole word for repetition. Once the word was produced, the participant was asked to repeat it 3 times. If they were unable to say it, the therapist repeated the word 3 times. Provided by: speech and language therapist. Therapist training not reported. Delivery: face‐to‐face and home use of workbook 1‐to‐1 (with partner support), at clinic and home practice. Regimen: 1 h sessions of therapy delivered twice a week over 4 weeks.Total dose = 8 h. Tailoring: yes, degree of difficulty and self administered practice. Modification: yes, degree of difficulty and self administered practice. Adherence: monitored attendance and intervention fidelity. Monitored via video and a human computer interaction, researcher not participating in therapy intervention 2. Teleconf supported conversation Intervention: social support. Attention control. Materials: none. Procedures: vconversational support techniques from trained SLT students. Provided by: speech and language therapy students. Received 1/2 day training session in supported conversation techniques (conversation initiation, adaptation of communication; resolve breakdowns, use of iPad and Facetime technology), also given handbook with further advice. Delivery: facetime via iPad, 1‐to‐1, in patients home from University. Regimen 8 remote conversations, scheduled twice a week (8 h in total). Tailoring: yes, to patient conversation. Modification: yes, individualised conversational support. Adherence: not reported |
|
| Outcomes | Primary outcomes: feasibility issues, spoken picture naming (Best 2013), with selection of 100 (2 matched sets of 50) words (treated/untreated for the SLT group) Secondary outcomes: free conversation with partner. Discourse analysis (substantive turns, number of content words per turn, number of nouns per turn). Data collection: baseline, post‐treatment (8 weeks) and 6‐week follow‐up (14 weeks) |
|
| Notes | Statistical data included within the review meta‐analyses | |
| Risk of bias | ||
| Bias | Authors' judgement | Support for judgement |
| Random sequence generation (selection bias) | Low risk | Computer‐generated, blocked stratification |
| Allocation concealment (selection bias) | Low risk | Adequate |
| Blinding (performance bias and detection bias) All outcomes | High risk | Member of research team ‐ so partially (but 70% of data secondary coded by additional researcher blinded to allocation and time point). Transcription and scoring was by blinded researcher |
| Incomplete outcome data (attrition bias) All outcomes | Low risk | Dropouts accounted for |
| Selective reporting (reporting bias) | Low risk | All prespecified outcomes reported |
| Other bias | Low risk | Groups were comparable at baseline (age, time poststroke and naming and picture recognition and memory screening scores) |
Wu 2004.
| Methods | Parallel group RCT, People's Republic of China | |
| Participants | Inclusion criteria: none described
Exclusion criteria: none described
Group 1: 120 participants
Group 2: 116 participants Details of participants are shown in Table 6 |
|
| Interventions |
1. Conventional SLT Intervention: "2 step method for aphasia". Rationale not reported. Materials: not reported. Procedures: visual stimulus, gesture and word pattern, following pronunciation, reading single word and entertainments. Provided by: step 1: doctor or nurse; step 2: family members trained by doctors and nurses. Delivery: face‐to‐face; 1‐to‐1; step 1: inpatient; step 2: at home. Regimen (frequency (sessions weekly) x duration): frequency of therapy delivered over 6 months not reported. Total dose of therapy delivered over the intervention ‐ not reported. Tailoring: not reported. Modification: not reported. Adherence: not reported. 2. No SLT Intervention: "No SLT" |
|
| Outcomes | None available | |
| Notes | Translated by Chinese Cochrane Centre | |
| Risk of bias | ||
| Bias | Authors' judgement | Support for judgement |
| Random sequence generation (selection bias) | Unclear risk | Not reported |
| Allocation concealment (selection bias) | Unclear risk | Not reported |
| Blinding (performance bias and detection bias) All outcomes | Low risk | Outcome assessor blinded |
| Incomplete outcome data (attrition bias) All outcomes | Low risk | All randomised participants included in analyses |
| Selective reporting (reporting bias) | High risk | Lack of any statistical data analysis reported for outcomes |
| Other bias | Unclear risk | Not reported whether groups were comparable at baseline Sample size calculation not reported |
Wu 2013.
| Methods | RCT, People's Republic of China | |
| Participants | Inclusion criteria: Broca's aphasia 1‐3 months poststroke
Exclusion criteria: none described
Group 1: 3 participants
Group 2: 2 participants Details of participants are shown in Table 6 |
|
| Interventions |
1. Conventional SLT Intervention: SLT. Usual therapy. Materials: not reported. Procedures: not reported. Provided by: not reported. Delivery: mode and location of delivery not reported. Regimen: 30mins/day, once a day, 5 d/week. Tailoring: not reported. Modification: not reported. Adherence: not reported. 2. No SLT Intervention: no SLT. Materials: none. Procedures: none Delivery: none. Regimen: none. Tailoring: none. Modification: none. Adherence: none. |
|
| Outcomes | Primary outcomes: Chinese Rehabilitation Research Centre Aphasia Examination (CRRCAE) Secondary outcomes: WAB, BDAE Data collection: "post‐treatment" (not specified) |
|
| Notes | Abstract only Statistical data not included within the review |
|
| Risk of bias | ||
| Bias | Authors' judgement | Support for judgement |
| Random sequence generation (selection bias) | Unclear risk | Not reported |
| Allocation concealment (selection bias) | Unclear risk | Not reported |
| Blinding (performance bias and detection bias) All outcomes | Unclear risk | Not reported |
| Incomplete outcome data (attrition bias) All outcomes | Low risk | No dropouts |
| Selective reporting (reporting bias) | High risk | Lack of any statistical data analysis reported for outcomes |
| Other bias | Unclear risk | Not reported if groups were comparable at baseline |
Xie 2002.
| Methods | RCT (matched and then randomised), People's Republic of China | |
| Participants | Inclusion criteria: "clinically diagnosed with stroke suffering spoken language impairment"
Exclusion criteria: none described
Group 1: 17 participants
Group 2: 17 participants Details of participants are shown in Table 6 |
|
| Interventions |
1. Language training Intervention: SLT. Role in rehab. Materials: not reported. Procedures: training of attention, memory, words, hearing and cognition, instructions, sentence comprehension, use of communicating cards, gesture, pronunciation, sentence expression. Provided by: nurses. Some suggestion that family also involved in delivering the therapy. Training not reported. Delivery: face‐to‐face; unclear if therapy was 1‐to‐1 or group, not reported if therapy was delivered at home. Regimen: 6 times a week, 1 h each time delivered over 12 months. Total dose of therapy delivered over the intervention = 312 h. Tailoring: not reported. Modification: not reported. Adherence: not reported. 2. No SLT Intervention: no SLT. Materials: none. Procedures: none. Delivery: none. Regimen: none. Tailoring: none. Modification: none. Adherence: none. |
|
| Outcomes | Primary outcomes: Chinese Language Impairment Examination Secondary outcomes: none described Data collection: baseline, 6 months (mid intervention) and 12 months |
|
| Notes | ― | |
| Risk of bias | ||
| Bias | Authors' judgement | Support for judgement |
| Random sequence generation (selection bias) | Unclear risk | No details available ("randomised") |
| Allocation concealment (selection bias) | Unclear risk | Not reported |
| Blinding (performance bias and detection bias) All outcomes | Low risk | Yes. ("assessment was carried out by a fixed person all Ihrough the study, who did not amend the language function training and therefore did not know the group the patient belonged to") |
| Incomplete outcome data (attrition bias) All outcomes | Low risk | No dropouts reported |
| Selective reporting (reporting bias) | High risk | Lack of any statistical data analysis reported for outcomes |
| Other bias | Low risk | Groups were comparable at baseline (age, education level, type of spoken language impairment, severity of spoken language impairment, degree of spoken language comprehension) |
Yao 2005i.
| Methods | Parallel group RCT, People's Republic of China | |
| Participants | Inclusion criteria: poststroke aphasia
Exclusion criteria: none listed
Group 1: 30 participants
Group 2: 30 participants Details of participants are shown in Table 6 |
|
| Interventions |
1. Group SLT Intervention: "Collective Language Strenghtening Training". Rationale not reported. Materials: not reported. Procedures: doctor or nurse talked to all patients, and they were encouraged to communicate with each other in small groups (10 participants). Provided by: doctor or nurse (training not reported). Delivery: face‐to‐face; group; location not reported. Regimen: therapy delivered daily for 28 d. Total dose of therapy delivered over the intervention not reported. Tailoring: not reported. Modification: not reported. Adherence: not reported. 2. No SLT Intervention: no therapy. Materials: none Procedures: none. Provided by: none. Delivery: none. Regimen: none. Tailoring: none. Modification: none. Adherence: not reported. |
|
| Outcomes | Primary outcome: CRRCAE Data collection: baseline, 28 d and 3‐month follow‐up | |
| Notes | Translated by Chinese Cochrane Centre Statistical data included within the review meta‐analyses |
|
| Risk of bias | ||
| Bias | Authors' judgement | Support for judgement |
| Random sequence generation (selection bias) | Unclear risk | Not reported |
| Allocation concealment (selection bias) | Unclear risk | Not reported |
| Blinding (performance bias and detection bias) All outcomes | Low risk | Outcome assessor blinded |
| Incomplete outcome data (attrition bias) All outcomes | Low risk | All randomised participants included in analyses |
| Selective reporting (reporting bias) | Low risk | All prespecified outcomes reported |
| Other bias | Unclear risk | Comparability of groups at baseline not reported Limited inclusion criteria listed and no exclusion criteria Sample size calculation not reported |
Yao 2005ii.
| Methods | Parallel group RCT, People's Republic of China | |
| Participants | Inclusion criteria: poststroke aphasia
Exclusion criteria: none listed
Group 1: 24 participants
Group 2: 30 participants Details of participants are shown in Table 6 |
|
| Interventions |
1. Conventional SLT Intervention: "One‐to‐one rehabilitative training". Rationale not reported. Materials: not reported. Procedures: nurse talked to each patient. Provided by: doctor or nurse (training not reported). Delivery: face‐to‐face; 1‐to‐1; location not reported. Regimen: therapy delivered daily for 28 d. Total dose of therapy delivered over the intervention not reported. Tailoring: not reported. Modification: not reported. Adherence: not reported. 2. No SLT Intervention: no therapy. Materials: none Procedures: none. Provided by: none. Delivery: none. Regimen: none. Tailoring: none. Modification: none. Adherence: not reported. |
|
| Outcomes | CRRCAE Assessed at baseline, 28 d and 3‐month follow‐up | |
| Notes | Translated by Chinese Cochrane Centre Statistical data included within the review meta‐analyses |
|
| Risk of bias | ||
| Bias | Authors' judgement | Support for judgement |
| Random sequence generation (selection bias) | Unclear risk | Not reported |
| Allocation concealment (selection bias) | Unclear risk | Not reported |
| Blinding (performance bias and detection bias) All outcomes | Low risk | Outcome assessor blinded |
| Incomplete outcome data (attrition bias) All outcomes | Low risk | All randomised participants included in analyses |
| Selective reporting (reporting bias) | Low risk | All prespecified outcomes reported |
| Other bias | Unclear risk | Comparability of groups at baseline not reported Limited inclusion criteria listed and no exclusion criteria Sample size calculation not reported |
Yao 2005iii.
| Methods | Parallel group RCT, People's Republic of China | |
| Participants | Inclusion criteria: aphasia following stroke
Exclusion criteria: none listed
Group 1: 30 participants
Group 2: 24 participants Details of participants are shown in Table 6 |
|
| Interventions |
1. Group SLT Intervention: "Collective Language Strenghtening Training". Rationale not reported. Materials: not reported. Procedures: doctor or nurse talked to all patients and they were encouraged to communicate with each other in small groups (10 participants). Provided by: doctor or nurse (training not reported). Delivery: face‐to‐face; group; location not reported. Regimen: therapy delivered daily for 28 d. Total dose of therapy delivered over the intervention not reported. Tailoring: not reported. Modification: not reported. Adherence: unclear. 2. Conventional SLT Intervention: "One‐to‐one rehabilitative training". Rationale not reported. Materials: not reported. Procedures: nurse talked to each patient. Provided by: doctor or nurse (training not reported). Delivery: face‐to‐face; 1‐to‐1; location not reported. Regimen: therapy delivered daily for 28 d. Total dose of therapy delivered over the intervention not reported. Tailoring: not reported. Modification: not reported. Adherence: not reported. |
|
| Outcomes | Primary outcome: CRRCAE Data collection: baseline, 28 d and 3‐month follow‐up | |
| Notes | Translated by Chinese Cochrane Centre Statistical data included within the review meta‐analyses |
|
| Risk of bias | ||
| Bias | Authors' judgement | Support for judgement |
| Random sequence generation (selection bias) | Unclear risk | Not reported |
| Allocation concealment (selection bias) | Unclear risk | Not reported |
| Blinding (performance bias and detection bias) All outcomes | Low risk | Outcome assessor blinded |
| Incomplete outcome data (attrition bias) All outcomes | Low risk | All randomised participants included in analyses |
| Selective reporting (reporting bias) | Low risk | All prespecified outcomes reported |
| Other bias | Unclear risk | Comparability of groups at baseline not reported Limited inclusion criteria listed and no exclusion criteria Sample size calculation not reported |
Zhang 2007i.
| Methods | Parallel group RCT, People's Republic of China | |
| Participants | Inclusion criteria outpatients with "apoplectic aphemia" Exclusion criteria: none available Group 1: 19 participants Group 2: 17 participants Details of participants are shown in Table 6 |
|
| Interventions |
1. SLT Intervention: "Rehabilitation". Rationale not reported. Materials: not reported. Procedures: rehabilitation, visual‐listening, articulation, speech training. Provided by: other therapists working in setting. Delivery: not reported. Regimen: not reported. Tailoring: not reported. Modification: not reported. Adherence: not reported. 2. No SLT Intervention: no therapy. Materials: none Procedures: none. Provided by: none. Delivery: none. Regimen: none. Tailoring: none. Modification: none. Adherence: not reported. |
|
| Outcomes | Primary outcomes: Aphasia Battery of Chinese (verbal expression, comprehension, reading, writing), CFCP, BDAE Data collection: assessed before and after therapy |
|
| Notes | People's Republic of China Dropouts: none |
|
| Risk of bias | ||
| Bias | Authors' judgement | Support for judgement |
| Random sequence generation (selection bias) | Unclear risk | Not reported |
| Allocation concealment (selection bias) | Unclear risk | Not reported |
| Blinding (performance bias and detection bias) All outcomes | Low risk | Assessor blinded |
| Incomplete outcome data (attrition bias) All outcomes | Low risk | All randomised participants appear to have been included within the analyses |
| Selective reporting (reporting bias) | Unclear risk | Not reported |
| Other bias | Unclear risk | Details not reported Groups comparable at baseline |
Zhang 2007ii.
| Methods | Parallel group RCT, People's Republic of China | |
| Participants | Inclusion criteria outpatients with "apoplectic aphemia" Exclusion criteria: not reported Group 1: 20 participants Group 2: 17 participants Details of participants are shown in Table 6 |
|
| Interventions |
1. SLT Intervention: "Rehabilitation plus acupuncture group". Rationale not reported. Materials: not reported. Procedures: rehabilitation, visual‐listening, articulation, speech training and acupuncture. Provided by: other therapists working in setting. Delivery: not reported. Regimen: not reported. Tailoring: not reported. Modification: not reported. Adherence: not reported. 2. No SLT Intervention: no therapy. Materials: none. Procedures: none. Provided by: none. Delivery: none. Regimen: none. Tailoring: none. Modification: none. Adherence: not reported. |
|
| Outcomes | Primary outcomes: Aphasia Battery of Chinese, CFCP, BDAE Data collection: assessed before and after therapy |
|
| Notes | Dropouts: none | |
| Risk of bias | ||
| Bias | Authors' judgement | Support for judgement |
| Random sequence generation (selection bias) | Unclear risk | Not reported |
| Allocation concealment (selection bias) | Unclear risk | Not reported |
| Blinding (performance bias and detection bias) All outcomes | Low risk | Assessor blinded |
| Incomplete outcome data (attrition bias) All outcomes | Low risk | All randomised participants appear to have been included within the analyses |
| Selective reporting (reporting bias) | Unclear risk | Not reported |
| Other bias | Unclear risk | Not reported Groups comparable at baseline |
Zhao 2000.
| Methods | Parallel group RCT, People's Republic of China | |
| Participants | Inclusion criteria: people with aphasia from "ischaemic apoplexy" Exclusion criteria: not reported Group 1: 98 participants Group 2: 40 participants |
|
| Interventions |
1. SLT Intervention: speech and language therapy with acupuncture. Rationale not reported. Materials: not reported. Procedures: not reported. Provided by: nursing staff, training not reported. Delivery: not reported. Regimen: not reported. Delivered over 2 months. Tailoring: not reported. Modification: not reported. Adherence: not reported. 2. No SLT No SLT, routine medicine over 2 months. Materials: none. Procedures: none. Provided by: none. Delivery: none. Regimen: none. Tailoring: none. Modification: none. Adherence: not reported. |
|
| Outcomes | Primary outcomes: Aphasia Battery of Chinese Data collection: assessed before and after therapy | |
| Notes | Dropouts: none | |
| Risk of bias | ||
| Bias | Authors' judgement | Support for judgement |
| Random sequence generation (selection bias) | Unclear risk | Not reported |
| Allocation concealment (selection bias) | Unclear risk | Not reported |
| Blinding (performance bias and detection bias) All outcomes | Unclear risk | Not reported |
| Incomplete outcome data (attrition bias) All outcomes | Low risk | All randomised participants appear to have been included within the analyses |
| Selective reporting (reporting bias) | Unclear risk | Not reported |
| Other bias | Unclear risk | Not reported No statistically significant differences reported between the groups at baseline |
AAC: Alternative and Augmentative Communication; AAT: Aachen Aphasia Test; ACTS: Auditory Comprehension Test for Sentences; ADL: activities of daily living; AMERIND:American Indian, a general communication system; ANELT: Amsterdam‐Nijmegen Everyday Language Test; AQ: Aphasia Quotient; BDAE: Boston Diagnostic Aphasia Examination; CADL:Communication Abilities of Daily Living; CETI: Communicative Effectiveness Index; CFCP: Chinese Functional Communication Profile; CHSPT: Caplan and Hanna Sentence Production Test; CIAT: constraint‐induced aphasia therapy; CMA: Canadian Medical Association; CRRCAE: Chinese Rehabilitation Research Centre Aphasia Examination; CT: computerised tomography; CVA: cerebrovascular accident; DA: discourse analysis; dB: decibels; FAST: Frenchay Aphasia Screening Test; FCP: FunctionalCommunication Profile; FE scale: Functional‐Expression scale; GCS: Glasgow coma scale; GHQ: general health questionnaire; GP: general practitioner; ITT: intention‐to‐treat; MAACL: Multiple Adjective AffectCheck‐List; MCA: middle cerebral artery; MDT: multidisciplinary team; MRI: magnetic resonance imaging; MTDDA: Minnesota Test for the Differential Diagnosis of Aphasia; NGA: Norsk Grunntest for Afasi; NHP: Nottingham Health Profile; NHS: National Health Service (UK); NIHSS: National Institutes of Health Stroke Scale; ONT: Object Naming Test; ORLA: Oral Reading for Language in Aphasia; PACE: Promoting Aphasics' Communicative Effectiveness; PALPA: Psycholinguistic Assessments of Language Processing in Aphasia; PCB: Philidelphia Comprehension Battery; Peabody PVT: Peabody Picture Vocabulary Test; PICA: Porch Index of Communicative Abilities; RCBA: Reading Comprehension Battery for Aphasia; RCT: randomised controlled trial; SAQolL: stroke and aphasia quality of life scale; SAT: Semantic Association Test; SD: standard deviation; SLT: speech and language therapy; SPICA: Shortened Porch Index of Communicative Abilities; STACDAP: Systematic Therapy for Auditory Comprehension Disorders in Aphasic Patients; TACS: Texas Aphasia Contrastive‐Language Series; TOMs: Therapy Outcomes Measures; WAB: Western Aphasia Battery; WAIS: Wechsler Adult Intelligence Scale.
Characteristics of excluded studies [ordered by study ID]
| Study | Reason for exclusion |
|---|---|
| Albert 1973 | Non‐RCT |
| Avent 2004 | Non‐RCT |
| Basso 1975 | Non‐RCT |
| Beukelman 1980 | Non‐RCT |
| Bloom 1962 | Non‐RCT |
| Breitenfeld 2005 | Non‐SLT intervention (music therapy) |
| Caute 2013 | Non‐RCT |
| Cherney 2007 | Experimental and control groups had same SLT intervention with experimental group also receiving cortical stimulation |
| Cherney 2010 | Non‐SLT intervention (epidural cortical stimulation) |
| Cherney 2011 | Non‐RCT |
| Cherney 2014 | Quasi‐randomised trial |
| Cohen 1992 | Included conditions other than stroke Unable to obtain aphasia‐specific data |
| Cohen 1993 | Included conditions other than stroke Unable to obtain aphasia‐specific data |
| Cupit 2010 | Single‐subject, multiple baseline across behaviours design |
| Ding 1995 | non‐RCT |
| Dubner 1972 | Non‐RCT |
| Gu 2002 | Unable to obtain aphasia‐specific data |
| Gu 2003 | Unable to obtain aphasia‐specific data |
| Hagen 1973 | Quasi‐randomised trial |
| Harnish 2014 | Non‐RCT |
| Hartman 1987 | Quasi‐randomised trial |
| Hinckley 2005 | Non‐RCT |
| Holmqvist 1998 | Unable to obtain aphasia‐specific data |
| IHCOP 2014 | Non‐RCT |
| Ji 2011 | Non‐SLT intervention (acupuncture) |
| Jungblut 2004 | Randomisation to groups inadequate; group allocation could be predicted |
| Kagan 2001 | Quasi‐randomised trial |
| Kalra 1993 | Not all participants had aphasia Unable to obtain aphasia‐specific data |
| Kendall 2015 | Non‐RCT |
| Kinsey 1986 | Randomisation dictated order of task presentation Aimed to establish impact of task delivery on performance Not a therapeutic intervention |
| Kurt 2008 | Quasi‐randomised trial |
| Lara 2009 | Pharmacological intervention evaluation |
| Lara 2011 | Pharmacological intervention evaluation |
| Li 2005 | Non‐RCT |
| Lincoln 1986 | Non‐RCT |
| Liu 2006b | Stroke specific data unavailable |
| Loeher 2007 | Non‐RCT |
| Luo 2008 | Non‐SLT comparison (SLT + acupuncture versus SLT) |
| Maher 2008 | Non‐RCT |
| Marcotte 2013 | Non‐RCT |
| Marshall 2001 | Intervention did not aim to improve communication skills but learning of non‐words |
| Mattioli 2010 | Non‐RCT |
| McCall 2007 | Non‐RCT |
| Meinzer 2005 | Randomisation to groups inadequate; group allocation could be predicted |
| Pistarini 1989 | Non‐RCT |
| Popovici 1992 | Included conditions other than stroke (mixed aetiology ‐ stroke and TBI) Unable to obtain aphasia‐specific data |
| Qiu 2003 | Non‐SLT intervention (acupuncture) |
| Quinteros 1984 | Quasi‐randomised trial |
| Rasmussen 2013 | Non‐SLT intervention |
| Raymer 2008 | Non‐RCT |
| Reinvang 1976 | Non‐RCT |
| Rudd 1997 | Unable to obtain aphasia‐specific data |
| Stoicheff 1960 | Included conditions other than stroke Unable to obtain aphasia‐specific data |
| Thompson 2010 | Quasi‐randomised trial |
| Tseng 2014 | Non‐RCT Unclear whether any postintervention assessment of language function is available |
| Van Lancker 1997 | Study was not completed |
| Vauth 2008 | Non‐RCT |
| Vines 2007 | Non‐SLT intervention (transcranial direct current stimulation) |
| Wang 2004 | Not all participants had aphasia Unable to obtain aphasia‐specific data |
| Weiduschat 2011 | Non‐SLT intervention (transcranial magnetic stimulation) |
| Wenke 2014 | Non‐RCT (2 cohort comparison study design) |
| West 1973 | Non‐RCT (matched controls) |
| Wolfe 2000 | Unable to obtain aphasia‐specific data |
| Wood‐Dauphinee 1984 | Included conditions other than stroke Unable to obtain aphasia‐specific data |
| Xu 2005 | Mixed aetiology (18 traumatic brain injury, 18 brain infarct, 6 brain ischaemia, 6 brain poisoning, 12 brain haemorrhage) |
| Zhang 2004 | Unable to obtain aphasic‐specific data |
RCT: randomised controlled trial; SLT: speech and language therapy; TBI: traumatic brian injury.
Characteristics of studies awaiting assessment [ordered by study ID]
E‐VIC 1990.
| Methods | "An experimental group and a control group of subjects, with patients assigned randomly to one or other treatment." |
| Participants | N = 40 Inclusion criteria: within 6 weeks of stroke, severe global aphasia Exclusion criteria: none |
| Interventions | 20 sessions over 3 to 5 weeks 1. E‐VIC delivered by therapist 2. Conventional SLT delivered by therapist |
| Outcomes | Unclear 'primary goal of the project is to determine whether training with the experimental intervention has an effect on rate and level of recovery of language function' |
| Notes | — |
Gans 1977.
| Methods | RCT ("randomly divided into two equal groups") |
| Participants | 8 "aphasia patients (aged 41 to 77) with predominantly expressive aphasia" Inclusion criteria: not reported Exclusion criteria: not reported |
| Interventions | 1. Experimental group: first level of melodic intonation therapy based on Sparks 1974 2. Control group: intervention details not reported All participants received "three 1 hour individual weekly sessions" |
| Outcomes | Not reported |
| Notes | Abstract only. British Library cannot locate the full‐text paper |
Gonzalez 2012.
| Methods | "Prospective comparative study, randomised, multicenter, superiority, a student study group for 3 months using the workbook C.COM compared to a control group not using it, but receiving the same amount of speech therapy using such non‐imaged media of communication" |
| Participants | 29 recent stroke patients with severe expressive aphasia from 43 to 91 years, without visual gnostic disorder, were included in 6 participating centres of the great Southwest. The 2 groups did not differ at baseline in terms of severity of aphasia, related disorders, and pragmatic assessment of the communication |
| Interventions | "In France, the communication workbook C.COM, associated with a specific procedure for the construction, use, and guidance of partner and caregiver, has been used since 2004. Communication is studied on a test of pragmatic communication (test of the 6 tasks) with 6 arbitrary instructions, graded according to 2 levels of difficulty, with a double‐blind videotape evaluation. Secondarily, the study examines what patient and partner think about the effectiveness of the C.COM, its effective use every day, the scores on tests assessing associated verbal communication, functional communication, the analytical capabilities of language, the depressive state" |
| Outcomes | Not reported |
| Notes | Abstract only. Further information sought from the authors regarding randomisation and who delivered the intervention, but no response received to date |
Gonzalez‐Rothi 2004.
| Methods | No details available |
| Participants | No details available |
| Interventions | No details available |
| Outcomes | No details available |
| Notes | Website reference only. No abstract available. Clarification sought from authors but not obtained |
Howard 1985.
| Methods | Cross‐over RCT |
| Participants | 12 adults with chronic acquired aphasia Inclusion criteria: "specific word‐finding problems, as a consequence of acquired aphasia; were at least 6 months and mostly several years post onset; no severe visual problems; could repeat single words; no visual agnosia; and agreed to take part in the experiment" Exclusion criteria: none listed |
| Interventions | 1. Semantic treatment 2. Phonological treatment "Each patient in the study participated in both types of treatment (obviously with different target sets); 4 weeks (without formal therapy) intervened between the two types. Half the patients had 2 weeks of treatment with each method and half had 1 week. Half of the patients began with semantic and half with phonological therapy; equal numbers of patients in each treatment duration condition received the treatments in each of the two orders" |
| Outcomes | Picture naming test |
| Notes | — |
HTA 2015 (author not known).
| Methods | Health technology assessment. No other information available at present |
| Participants | Data not available |
| Interventions | Data not available |
| Outcomes | Data not available |
| Notes | No abstract available. Project commissioned by German Agency for Health Technology Assessment at the German Institute for Medical Documentation and Information (DAHTA DIMDI) http://onlinelibrary.wiley.com/o/cochrane/clhta/articles/HTA‐32015000383/frame.html |
Stachowiak 1994.
| Methods | Randomised stratified trial with involvement from Biometrical Center Aachen |
| Participants | 156 Inclusion criteria: aphasia, at least 4 months post onset Exclusion criteria: 75 years or older, bilateral lesions, retro and anterograde amnesia, progressive disease (e.g. dementia), inability to complete first part of Token Test, failure to pass screening test for computer use Group 1: 77.9% had aphasia following stroke Group 2: 77.2% had aphasia following stroke |
| Interventions | 1. Conventional SLT (as below) augmented by computer‐facilitated SLT (additional 30 h) 2. Conventional SLT ‐ 5 h weekly for 6 weeks |
| Outcomes | AAT (and subtests Token Test, repetition, written language, naming, language comprehension) |
| Notes | Funded by the German Ministry for Research and Technology (BMFT) |
Zhang 2015.
| Methods | "Randomly divided into a music therapy group (N = 42) and speech language therapy group (N = 42) . . . based on table of random numbers" |
| Participants | 84 Inclusion criteria: "post‐stroke patients with non‐fluent aphasia" Exclusion criteria: none reported |
| Interventions | 1. Conventional SLT 2. Music therapy No other details about the individual interventions are available in the abstract |
| Outcomes | Chinese version: WAB Data collection: "before and after therapy" (1 month post‐treatment) |
| Notes | Abstract only. Difficulty locating the full text paper as there is limited information about the journal this trial is published in |
AAT: Aachen Aphasia Test; SLT: speech and language therapy; WAB: Western Aphasia Battery.
Characteristics of ongoing studies [ordered by study ID]
ASK.
| Trial name or title | Reducing the psychosocial impact of aphasia on mood and quality of life in people with aphasia and the impact of caregiving in family members through the Aphasia Action Success Knowledge (Aphasia ASK) program: a cluster randomised controlled trial ("In stroke patients with aphasia and their caregivers does the Aphasia ASK Action Success Knowledge (ASK) program, compared to an attention control package, promote better mood and overall quality of life outcomes?") |
| Methods | RCT. Hospital clusters will be randomised to either 1 of the 2 treatment arms. Participants will undergo the assigned treatment arm with a qualified speech pathologist from when they are first recruited until 12 months poststroke. Allocation is not concealed |
| Participants | 344 people with aphasia and their family members Inclusion criteria: within 6 months poststroke, diagnosis of aphasia as a result of first stroke (as assessed using the Western Aphasia Battery‐Revised), 18 years of age or older, have adequate hearing and vision levels to participate as judged by the treating speech pathologist Exclusion criteria: concomitant cognitive disorders such as dementia or primary progressive aphasia, aphasia of an aetiology other than stroke, a history of recurrent depression (3 or more previous diagnosed episodes defined as needing to see a health practitioner for treatment – either psychotherapy or medication prescribed, confirmed by self report), current psychiatric diagnosis (e.g. depressive disorder; anxiety disorder, confirmed by medical record), current depressive symptoms upon screening with Stroke Aphasic Depression Questionnaire Hospital Version‐10 (score of 9 or more) or the Depression Intensity Scale Circles (score of 3 or more), currently receiving treatment in a psychiatric setting, enrolment in other aphasia or depression clinical treatment studies |
| Interventions | 1. The Aphasia ASK intervention consists of a face‐to‐face intervention and follow‐up phone calls provided by a speech pathologist up until 12 months poststroke. The intervention is for 6‐8 weeks for an hour each week. The topics in the intervention include a number of modules and cover a range of areas including: caregiver training (e.g. communication partner training), education (on aphasia, successful coping strategies and support services) stress management, positive adaptive strategies, sharing of personal stories and developing peer‐based support. The participants will be able to prioritise the order of modules based on their personal interest and needs. The prioritisation occurs during the module 'Before we begin'. The first session establishes the goals for the programme using collaborative goal setting techniques. The goals form the basis for prioritising the modules that are covered in future weeks. For example, if the participant's goal is to stay positive, there is a module on positive thinking that includes information about and practice on exercises for strategies which were drawn from the counselling literature. At the end of each module, further resources are recommended including community based options/programmes/resources. Goals are revisited each session. The modules are designed as a guide and should be incorporated with clinical skill and knowledge to ensure the programme is person‐centred. Aphasia ASK is to be delivered as individual sessions with only 1 participant with aphasia and their family member(s) involved at any time. Follow‐up monthly phone calls or visits (whichever method is suitable for the participants) will be made until 12 months poststroke. The follow‐up calls with revisit the participant goals set during the programme and provide additional information and resources where necessary. An Aphasia ASK programme manual has been written for the provider therapist and a separate aphasia friendly workbook has been written for the recipients. Recipients will receive the written materials prior to each session 2. A secondary stroke prevention programme forms the content of the attention control package. It will be provided in a similar dosage (1 h session per week for 6‐8 weeks and follow‐up monthly phone calls until 12 months poststroke) and similar format (written support materials, delivered to both patients and their family) to the Aphasia ASK intervention The information that will inform the modules will include: What is stroke? Recovery from stroke Understanding risk factors for stroke; Lifestyle interventions; Barriers to implementing lifestyle changes; Understanding your medication |
| Outcomes | Primary outcomes: Assessment for Living with Aphasia (ALA); Stroke and Aphasia Depression Questionnaire (SADQ‐21) Secondary outcomes: Bakas Caregiver Outcomes Scale –Revised (BCOS); General Health Questionnaire (GHQ‐28), self reported stroke risk‐related behaviours of people with aphasia Data collection: baseline (enrolment of study, within 6 months of aphasia onset) and at postintervention (at 12 months post aphasia onset) of stroke |
| Starting date | 18 May 2015 |
| Contact information | Prof Linda Worrall Address: CCRE in Aphasia Rehabilitation, School of Health and Rehabilitation Sciences, Level 8, Therapies Building 84a, The University of Queensland, St Lucia, QLD 4072 Australia l.worrall@uq.edu.au |
| Notes | http://www.anzctr.org.au/ACTRN12614000979651.aspx Expected completion: 31/12/2018 |
Big CACTUS.
| Trial name or title | A study to assess the clinical and cost effectiveness of aphasia computer treatment versus usual stimulation or attention control long term post stroke (Big CACTUS) |
| Methods | Pragmatic, parallel group randomised controlled adjunct trial design |
| Participants | N = 285 Inclusion criteria: participants will be included if aged 18 or over, diagnosis of stroke(s), onset of stroke at least 4 months prior to randomisation, diagnosis of aphasia, subsequent to stroke, as confirmed by a trained speech and language therapist, word retrieval difficulties tested by the naming test of the Comprehensive Aphasia Test (score of 10%‐90%, 5‐43/48) and ability to perform a simple matching task with the StepbyStep programme (to confirm sufficient vision and cognitive ability to participate in the intervention) Exclusion criteria: participants will be excluded from the study if they have another premorbid speech and language disorder caused by a neurological deficit other than stroke (a formal diagnosis can be reported by the participant or relatives and confirmed by the recruiting speech and language therapist); they are unable to repeat words (suggesting presence of severe dyspraxia), they require treatment for a language other than English (as the software is in English) and they are currently using the StepbyStep computer programme or other computer speech therapy aimed at word retrieval/naming |
| Interventions | 1. self managed computerised therapy intervention plus usual care (UC) (N = 95). The intervention targets word retrieval as it is 1 of the challenges most frequently experienced by people with aphasia, restricting their communication. The intervention is composed of 3 components: SLT‐tailored computer exercises; regular self managed practice and volunteer support to assist with treatment adherence and carryover into daily activity 2. Usual care control arm (N = 95). Usual care may consist of participation in a range of activities to a greater or lesser extent. This may include face‐to‐face speech and language therapy targeting language impairment (reading, writing, speaking or understanding); therapy focusing on compensatory communication strategies, provision of communication aids or psychological support; attendance at voluntary support groups or informal communication support from family and friends. Participants randomised to the UC group will not receive any project‐specific intervention 3. Attention control plus UC group (N = 95). SLT to select puzzle book of appropriate level. Contacted month by research team to check progress with puzzles and see if need another book |
| Outcomes | Primary outcomes: change in the number of words (of personal relevance to the participant) named correctly at 6 months will be measured by a picture‐naming task; improvement in functional communication will be measured by blinded ratings of video‐recorded conversations between a speech and language therapist and participants using the activity scale of the Therapy Outcome Measures and number of target words used in conversation, at 6 months Secondary outcomes: improvement in patient perception of communication will be measured using the COAST ‐ a patient‐reported measure of communication participation and related quality of life Data collection: baseline, 6 months, 9 months and 12 months |
| Starting date | 01 September 2014 |
| Contact information | Dr Rebecca Palmer, School of Health and Related Research, University of Sheffield, r.l.palmer@sheffield.ac.uk |
| Notes | http://www.nets.nihr.ac.uk/projects/hta/122101 Trial website: http://www.sheffield.ac.uk/scharr/sections/dts/ctru/bigcactus Expected recruitment completion 30/07/2016. Reporting: 30 June 2018 |
CATChES.
| Trial name or title | Computerised Therapy in Chronic Stroke (CATChES) |
| Methods | Cross‐over design 3 fMRI/DTI time points before and after iPad facilitated therapy for expressive speech problems |
| Participants | N = 40 Inclusion Criteria: left hemisphere, first ever stroke; non‐fluent expressive aphasia, aged > 18 years, adequate co‐operation for scanning, right‐handed prior to stroke (Edinburgh Inventory of Handedness), native British‐English speakers, no history of neurological or psychiatric disorders, no specific cognitive deficits (other than language), no contra‐indication to MRI scan (as per WBIC protocol), able to lie flat in scanner for 2 hours, provision of consent from patient, chronic aphasia (present for more than 12 months) Exclusion Criteria: women with any chance of pregnancy, claustrophobia, contra‐indication to MRI (as per WBIC protocol), concomitant medical disorder that means patient unable to lie flat for 2 hours, history of significant premorbid cognitive impairment, alcohol or illicit drug abuse, history of significant neurological disease, major organ failure, age more than 80 years. Following recruitment ‐ demonstration of intact inner speech with good overt speech or demonstration of poor inner speech with poor overt speech |
| Interventions | 1. Computerised therapy delivered at home via a portable tablet 2. Mind games (attention, memory, spatial awareness and executive function) therapy delivered at home via a portable tablet |
| Outcomes | Primary outcome: brain changes as measured by fMRI and DTI Secondary outcomes: effectiveness, feasibility and adherence to computerised therapy used on portable tablet. Qualitative feedback. Number of participants showing language improvements as measured by neuropsychological language batteries Data collection: measured at 5, 10 and 18 weeks from baseline |
| Starting date | November 2013 |
| Contact information | Prof Elizabeth Warburton eaw23@medschl.cam.ac.uk |
| Notes | National Institute for Health Research. Results expected by 2016 http://clinicaltrials.gov/show/NCT01928602 |
COMPARE.
| Trial name or title | Constraint induced or multi‐modal aphasia rehabilitation: an RCT of therapy for stroke‐related chronic aphasia (COMPARE) |
| Methods | 3‐arm RCT |
| Participants | N = 198 (66 participants in each arm) Patients with chronic poststroke aphasia will be eligible for this trial Inclusion criteria: documented single stroke resulting in aphasia at least 6 months and not more than 3 years prior to assessment; aphasia of any type (<93.8 WABAQ); normal or corrected hearing and vision Exclusion criteria: previous stroke or neurological event/diagnosis (head injury, neurosurgery, dementia, epilepsy), severe apraxia of speech or dysarthria, diagnosed major clinical depression or other mental health condition, English as a second language |
| Interventions | 1. Multi‐modal aphasia rehabilitation (M‐MAT) 2. Constraint induced aphasia therapy (CIAT Plus) 3. Usual care (standardised, limited aphasia therapy) For both CIAT and M‐MAT, 30 h of treatment (3 h/d, 5 d/week, for 2 weeks) and a daily home practice communication task (15 minutes) will be given to each participant, consistent with previous CIAT and M‐MAT studies All aphasia therapy will be delivered in a small group setting (3 participants per group) by a qualified speech pathologist |
| Outcomes | Primary outcomes: Western Aphasia Battery‐ Aphasia Quotient (WABAQ) Secondary outcomes: Stroke and Aphasia Quality of Life Scale (SAQOL‐39), Communicative Effectiveness Index (CETI), connected speech measures and resource utilisation Data collection: baseline, immediately after treatment and at 12 weeks post‐treatment |
| Starting date | 2015 (trial set‐up); 2016 (recruitment) |
| Contact information | Assoc Prof Miranda Rose, La Trobe University, Melbourne, Australia m.rose@latrobe.edu.au |
| Notes | Expected completion: 2018 Clinical trials registration no currently being organised |
FCET2EC.
| Trial name or title | FCET2EC (From controlled experimental trial to = 2 everyday communication): How effective is intensive integrative therapy for stroke‐induced chronic aphasia under routine clinical conditions? |
| Methods | Prospective randomised open blinded end‐point (PROBE) design |
| Participants | N = 126 Inclusion criteria: non‐haemorrhagic or haemorrhagic cortical, subcortical, or subcortico‐cortical stroke; presence of aphasia for at least 6 months; aged 18‐70 years; German as (the first) native language; score of at least 1 (between 0 and 5) on the communicative ability scale of the Aachen Aphasia Test (AAT); less than the maximum score of 10 error points on the first of 5 sub‐tests of the AAT Token Test (securing basic comprehension of spoken instructions) Exclusion criteria: no verifiable aphasia according to the criteria of the AAT; aphasia due to traumatic brain injury or neurodegenerative diseases; severe uncontrolled medical problems; severe uncorrected‐to‐normal visual or auditory impairment |
| Interventions | 1. Intensive integrative aphasia therapy. Intensive language therapy (3 weeks, 5 d/week ≥ 10 h/week) provided in regular clinical setting and consisting of a combination of language systematic and communicative‐pragmatic treatment. Group starts intensive language therapy within 3 workdays (or as soon as possible) after baseline exam 2. Waiting list control group. Control group starts intensive language therapy after a 3‐week waiting period with assessments prior to and after the waiting period |
| Outcomes | Primary outcome: ANELT‐A Secondary outcomes: specially devised screening measures for language systematic and communicative‐pragmatic communication ability; the German version of the Stroke and Aphasia Quality of Life Scale‐39/SAQOL‐39; German version of the Communicative Effectiveness Index/CETI; B‐scale (intelligibility) of the ANELT scenarios; ratings of the syntactic complexity of the ANELT scenarios using the AAT scoring system for spontaneous speech; ratings of non‐verbal communication skills on the ANELT scenarios (based on the Scenario test, measures of general cognitive functioning Data collection: baseline, 3 weeks and at 6 months post‐treatment. A subgroup from both conditions will also be assessed 5 weeks post‐treatment |
| Starting date | Trial started in February 2012; patient recruitment started 1 April 2012 |
| Contact information | Annette Baumgaertner, PhD Faculty of Health and Social Sciences, Fresenius University of Applied Sciences, Alte Rabenstrasse 2, 20148 Hamburg, Germany, email: baumgaertner@hs‐fresenius.de Caterina Breitenstein, PhD Dept of Neurology, University of Muenster, Albert‐Schweitzer‐Campus 1, bldg A1 48149 Muenster, Germany Email: caterina.breitenstein@uni‐muenster.de |
| Notes | Last patient enrolled in June 2014 (last patient out after 6‐month follow‐up: January 2015) N = 156 participants enrolled (N = 78 per group); no participants lost to immediate follow‐up; N = 2 participants lost at the 6‐months follow‐up |
IMITATE.
| Trial name or title | IMITATE: an intensive computer‐based treatment for aphasia based on action observation and imitation |
| Methods | N = 57 participants with aphasia randomised into 2 groups |
| Participants | Inclusion criteria: single ischaemic infarction in the MCA territory involving the cerebral cortex, aphasia, visual attention and language comprehension sufficient to perform imitation fMRI tasks, right‐handed prior to stroke Exclusion criteria: cardiac pacemakers, claustrophobia, neurosurgical clips, significant cognitive impairment likely to impair co‐operation on cognitive tasks |
| Interventions | 1. IMITATE: home‐based, 30 min, 3 times daily, 6 d weekly (total of 9 h weekly) for 6 weeks' observation of audio‐visual presentations of words and phrases followed by oral repetition of the stimuli 2. Control: not reported |
| Outcomes | Primary outcome: WAB Secondary outcome measures: subtests from the Apraxia Battery for Adults, the BNT, the 'cookie theft' picture description task from the BDAE, the SAQoL Data collection: not reported |
| Starting date | August 2007 |
| Contact information | Professor Steven Small small@uchicago.edu |
| Notes | Expected completion: 2013 NCT00713050 |
Kukkonen 2007.
| Trial name or title | Timing and intensity of SLT services among people with aphasia |
| Methods | N = 40 participants with aphasia randomised into 4 groups that vary in the intensity of SLT allocated and in the onset of therapy Participants have also been stratified by age: younger group (50‐60 years) and older group (65‐80 years) |
| Participants | Inclusion criteria: 50‐80 years old, first CVA in the left hemisphere, living locally, diagnosis in university hospital, diagnosis confirmed by CT/MRI, availability of a relative; therapy sessions stating 4 weeks after onset |
| Interventions | 1. High‐intensity SLT group: 45 minutes 2 times per day, 5 d per week for 6 weeks 2. Moderate‐intensity SLT group: 45 minutes 2 times per day, 2 d per week for 6 weeks 3. Conventional SLT: 45 minutes twice a week for 6 weeks 4. Control group: SLT‐services on the waiting list for first 20 weeks and then like high‐intensity SLT group if needed Spouses or caregiver(s) received support and information from the speech and language therapists twice (1 h per meeting) |
| Outcomes | Primary outcome measure: functional communicative skills (CETI) (people with aphasia and their caregiver(s) complete the forms separately Secondary outcome measures: speech comprehension (Token Test, Pizzamigglio Sentence Test, Token Test and subtests from the BDAE); Speech production (BDAE subtests) and BNT, Quick Aphasia Screening Test,and time to complete tests is also measured. Emotional well being: Montgomery & Åberg Depression scale (people with aphasia) and with Beck's Depression scale (caregivers) Data collection: assessments were administered at 1 , 4, 10, 14, 20, 32 and 52 weeks poststroke . Each participant had a over 1 year (56 weeks) follow‐up |
| Starting date | October 2002 ‐ May 2007 (data collection completed) No dropouts, but 4 participants died within 2 months post onset |
| Contact information | Tarja Kukkonen, Speech and Language Therapist Ph, MEsc, MSc Lecturer in Logopedics, Department of Speech, Communication and Voice Research, 33014 University of Tampere, Finland Tel. +358 44 3455033 Tarja.Kukkonen@uta.fi |
| Notes | No dropouts from study |
Kurland ‐ NCT02012374.
| Trial name or title | Overcoming learned non‐use in chronic aphasia |
| Methods | Single blind parallel group RCT |
| Participants | N = 24 Inclusion criteria: unilateral left hemisphere stroke at least 6 months earlier; aphasia with moderate‐to‐severe word retrieval impairments; at least 21 years of age; premorbidly right handed; native speaker of English Exclusion criteria: history of developmental learning difficulties; history of prior neurological illnesses; chronic medical illnesses that restrict participation in intensive therapy; recent alcohol or drug dependence; severe uncorrected impairments of vision or hearing; any contraindication to a 3T MRI procedure (e.g. claustrophobia, metal implants or fragments in body, pregnancy) |
| Interventions | 1. Constrained‐intensive language action therapy Following a phase of baseline pre‐treatment testing, speech therapy sessions take place 5 d/week for 3 h per session during 2 consecutive weeks. Spoken responses are explicitly modelled and encouraged during therapy. Following the intensive 2‐week treatment, participants are trained in using individualised home practice programmes on iPads. They practice approximately daily for 6 months, checking in weekly with an speech and language practitioner via videoconferencing software and return for probes monthly. 6 months post‐treatment, testing will take place following completion of the home practice phase and again at 12 months post‐treatment 2. Unconstrained intensive language action therapy Following a phase of baseline pre‐treatment testing, speech therapy sessions take place 5 d/week for 3 h per session during 2 consecutive weeks. All communicative responses are encouraged during therapy. Following the intensive 2‐week treatment, participants are trained in using individualised home practice programmes on iPads. They practice approximately daily for 6 months, checking in weekly with an speech and language practitioner via videoconferencing software and return for probes monthly. 6 months post‐treatment testing will take place following completion of the home practice phase and again at 12 months post‐treatment |
| Outcomes | Primary outcome: change from baseline on Confrontation Naming Task Secondary outcomes: change from baseline Boston Diagnostic Aphasia Examination; change from baseline Boston Naming Test; change from baseline discourse samples; change from baseline Assessment of Living with Aphasia Data collection: baseline, assessments immediately post‐treatment (2 weeks) and assessments post home practice programme at approximately 6 and 12 months post‐treatment |
| Starting date | February 2013 |
| Contact information | Dr Jacquie Kurland, University of Massachusetts, Amherst, Massachusetts, United States, 01003 Tel. +413‐545‐4007 jkurland@comdis.umass.edu |
| Notes | Expected completion: August 2016 |
LIFT 2014.
| Trial name or title | A stratified randomised control trial of an intensive, comprehensive aphasia program to compare patient outcomes post stroke with usual care Short title: Can a new intensive model of aphasia rehabilitation achieve better outcomes than usual care? |
| Methods | Parallel single blinded 2 arm stratified block randomisation pragmatic trial Stratified randomisation will be used in order to ensure balance between LIFT and usual care groups with respect to severity of aphasia (mild/moderate, severe) using the Language Screening Test (LAST) screening assessment |
| Participants | N = 234 Family members/carers of people with aphasia (N = 234) Treating speech pathologists (N = up to 50): Stakeholders (N = 30) Inclusion criteria: Participants with aphasia: confirmed stroke (medical chart) and confirmed aphasia using the Language Screening Test; score above cut‐off on the cognitive subtest of the Comprehensive Aphasia Test; willing to forego other speech therapy for the duration of the study and during follow‐up; able to toilet independently or with the assistance of an accompanying caregiver; requires at least 7 more weeks of therapy as reported by the referring speech pathologist; English language, hearing and vision sufficient for therapy as judged by the referring speech pathologist and the research assistant. Family members/carers of participants with aphasia: able to speak English. Treating speech pathologists: qualified practising speech pathologists, employed by either the University of Queensland (UQ) or the partner hospitals, who are providing either LIFT or usual care to the people with aphasia in this study. Speech pathology stakeholders: speech pathology managers, speech pathologists and consumers (i.e. people with aphasia and their family members/carers) Exclusion criteria: Participants with aphasia: a co‐existing neurological or mental health condition (e.g. dementia, severe depression); severe apraxia of speech or severe dysarthria; global aphasia preventing completion of assessments tasks; transition care patients who receive aphasia services at home on discharge from hospital. Family members/carers of people with aphasia: must not have dementia or other cognitive impairments; must not have uncorrected vision or hearing impairments that will prevent participation. Treating speech pathologists: no exclusion criteria. Speech pathology stakeholders: no exclusion criteria |
| Interventions | 1. LIFT: 3 week intensive programme + 4 weeks maintenance, delivered by trained speech pathologists at The UQ CCRE Aphasia Clinic and other rehabilitation centres of our Partner Organisations. Participants in LIFT attend 60 minute sessions 10 times a week for individual therapy, 60 minute sessions 5 times each week of computer‐based therapy and 60 minute sessions twice per week of group therapy 2. Usual care: any aphasia therapy up to 12 months poststroke, delivered by typical speech pathology service providers in outpatient hospital setting or community based rehabilitation setting in the patients' homes or centres |
| Outcomes | Primary outcome: Content Information Units (CIUs) and Assessment for Living with Aphasia (ALA) Secondary outcomes: Comprehensive Aphasia Test (CAT), the Philadelphia Naming Test (Short Forms A and B), participant satisfaction (measured using a semi‐structured interview), Assessment of Quality of Life (AQoL‐4D). Secondary outcomes for use with family members of people with aphasia include: Communicative Effectiveness Index (CETI), Bakas Caregiver Outcomes Scale and participant satisfaction. Secondary outcomes for use with treating SLT include: Australian Therapy Outcome Measure (AUSTOMs). Secondary outcomes for use with speech language stakeholders include semi‐structured stakeholder interviews Data collection: baseline, post‐treatment and 12 months post onset of stroke |
| Starting date | 1 January 2014 |
| Contact information | Professor Linda Worrall Address: CCRE in Aphasia Rehabilitation, School of Health and Rehabilitation Sciences, Level 8, Therapies Building 84a, The University of Queensland, St Lucia, QLD 4072 Australia l.worrall@uq.edu.au |
| Notes | www.anzctr.org.au/trial/registration/trialreview.aspx?ACTRN=12613001182785 Expected completion: 31/08/2019 |
MIT USA.
| Trial name or title | Melodic Intonation Therapy USA |
| Methods | Interventional, randomised, active control, efficacy study, parallel assignment, single blind (outcomes assessor) treatment |
| Participants | Inclusion criteria: first ischaemic left‐hemisphere stroke, minimum of 12 months post onset, right‐handed prior to stroke, diagnosis of non‐fluent or dysfluent aphasia Exclusion criteria: > 80 years of age; > 1 stroke; presence of metal, metallic or electronic devices (cannot be exposed to MRI environment); terminal health condition; history of major neurological or psychiatric disease (e.g. epilepsy, meningitis, encephalitis); use of psychoactive drugs/medications (e.g. antidepressants, antipsychotic, stimulants); active participation in other stroke recovery trials testing experimental interventions |
| Interventions | 1. 75 sessions of MIT (approximately 16 weeks) 2. 75 sessions of speech repetition therapy (developed for this study ‐ verbal treatment method of equal intensity) (approximately 16 weeks) 3. No therapy (16 weeks) |
| Outcomes | Primary outcome: number of correct information units per minute produced during spontaneous speech Secondary outcomes: standard picture naming test, timed automatic speech, linguistically based measures of phrase and sentence analysis, functional and structural imaging measures Data collection at baseline (x 2), midpoint of therapy, end of therapy, 4 weeks after end of therapy |
| Starting date | 2008 |
| Contact information | Gottfried Schlaug (PI): gschlaug@bidmc.harvard.edu Andrea Norton, Music and Neuroimaging Laboratory, Stroke Recovery Laboratory, Beth Israel Deconess Medical Centre and Harvard Medical School, 330 Brookline Avenue_palmer 127, Boston MA 02215 Tel: +1 617 6328926 nossorc1@phhp.ufl.edu www.muscianbrain.com |
| Notes | ClinicalTrials.gov ID: NCT00903266 Expected completion: 2012 |
Nehra ‐ CTRI/2014/04/004554.
| Trial name or title | To study the effectiveness of 'Comprehensive Neuropsychological Rehabilitation' as an adjunct to standard pharmacological treatment for improving language and quality of life in patients with post stroke aphasia: a randomised controlled clinical trial |
| Methods | Randomised, parallel group, placebo controlled trial |
| Participants | N = 40 Inclusion criteria: participants of either sex aged 18‐65 years; any education level; language: Hindi or English; handedness: right; patients suffering first‐time ischaemic stroke diagnosed with non‐fluent or fluent aphasia within a year of index event; all consenting patients; caregiver (taking up the role of home‐based therapist) is available who has frequent contact with the subject (e.g. an average of 10 h per week or more), and can accompany the subject to all clinic visits for the duration of the rehabilitation programme Exclusion criteria: patients suffering from more than 1 episode of stroke affecting language and cognition, any medical condition limiting life expectancy; any major neurological disorder affecting cognition; any major psychiatric disorder; use of psychoactive drugs; active participation in other stroke recovery trials testing experimental intervention about cognition; pregnant women; patients with any contraindication for MRI and patients having claustrophobia |
| Interventions | 1. Intervention: comprehensive neuropsychological rehabilitation with aphasia therapy would be given along with normal clinical course of treatment by the treating doctor(neurologist). The rehabilitation would be patient specific and would likely be 4‐8 weeks for each patient. The next session would only be introduced if the patient is able to reach the ceiling effect for the tasks of the current week. The patient would be called once a week. Each session would last for 45 minutes to an hour 2. Control group: no comprehensive neuropsychological rehabilitation with aphasia therapy would be given, however, the normal clinical course of treatment would continue by the treating doctor. The control group patients would be called the same number of times as the patients of the intervention group by maintaining a follow‐up with the treating doctor (neurologist) and not the clinical neuropsychologist |
| Outcomes | Primary outcomes: change in the scores of language functioning from pre to postintervention in the following
domains: acoustic problems; speech and language problems; simple mathematical problems; perceptuo‐motor and writing problems; and visual and reading problems. Change in the scores from pre to postintervention of quality of life Secondary outcomes: change in scores from pre to postintervention of the following: cognitive functioning (memory, attention and executive functioning); depression and correlate with changes in neural activations (imaging using fMRI) Data collection: baseline, post‐1 month treatment and post‐3 months of comprehensive neuropsychological rehabilitation with aphasia therapy with the use of fMRI |
| Starting date | 01 May 2014 |
| Contact information | Assoc Prof Ashima Nehra, All India Institute of Medical Sciences, Faculty Chambers, Room # NS‐718, VIIth Floor, NEUROSCIENCES CENTER (AIIMS) All India Institute of Medical Sciences, New Delhi South, DELHI 110029 India ashimanwadhan@gmail.com |
| Notes | Expected completion: 01 May 2017 |
ORLA‐Write.
| Trial name or title | ORLA Write ‐ enhancing written communication in persons with aphasia |
| Methods | RCT |
| Participants | N = 50 Inclusion criteria: men or women with diagnosis of an aphasia subsequent to a left‐hemisphere infarct(s) that is confirmed by CT scan or MRI, an Aphasia Quotient score on the Western Aphasia Battery of 50 to 85, 6 months post injury, premorbidly right‐handed, determined by Edinburgh Handedness Inventory, completed at least an eighth grade education, premorbidly literate in English, visual acuity may be corrected but must be sufficient for reading visual stimuli on computer screen, auditory acuity may be aided but must be sufficient for hearing auditory stimuli in ORLA programme Exclusion Criteria: any other neurological condition that could potentially affect cognition or speech, such as Parkinson's Disease, Alzheimer's Dementia, traumatic brain injury, any significant psychiatric history prior to the stroke, such as severe major depression or psychotic disorder requiring hospitalisation, subjects with mood disorders who are currently stable on treatment will be considered, active substance abuse |
| Interventions | 1. ORLA: (Oral Reading for Language in Aphasia), a computer‐based virtual therapy system, for 90 min/d, 6 d/week for 6 weeks 2. ORLA + writing: practice on ORLA + writing computer programme Both 90 min/d, 6 d/week for 6 weeks |
| Outcomes | Primary outcomes: writing Score on the Western Aphasia Battery‐Revised (WAB‐R) Secondary outcomes: Western Aphasia Battery‐Revised Aphasia Quotient and Language Quotient (WAB‐R AQ and LQ); Written Language Sample Analysis; correct information units within written response to the picture description task of the WAB‐R; Communicative Effectiveness Index (CETI); ASHA Quality of Communication Life Scale (QCL); Data collection 6 weeks |
| Starting date | February 2013 |
| Contact information | Prof Leora Cherney, Rehabilitation Institute of Chicago lcherney@ric.org Dr. Jaime B. Lee, Rehabilitation Institute of Chicago jlee@ric.org |
| Notes | Trial Registration: NCT01790880 End date: December 2015 |
Osborne 2012.
| Trial name or title | Constraint in aphasia therapy. Is it important for clinical outcomes? |
| Methods | Pilot RCT with cross‐over |
| Participants | Clients with a diagnosis of aphasia with expressive language impairments |
| Interventions | 1. Constraint‐induced aphasia therapy (CIAT) 2. Unconstrained aphasia therapy (UAT) Therapy was conducted for 90 min/d 2 x week for 4 weeks. Following reassessment, groups received alternate treatment type |
| Outcomes | Not reported |
| Starting date | 2012 |
| Contact information | Prof Lyndsey Nickels, ARC Centre of Excellence in Cognition and its Disorders (CCD), NHMRC Centre of Clinical Research Excellence in Aphasia Rehabilitation, Department of Cognitive Science, Macquarie University, Sydney, NSW 2109 Australia lyndsey.nickels@mq.edu.au |
| Notes | Expected completion: late 2015 Personal communication |
PMvSFA.
| Trial name or title | Speech therapy for aphasia: comparing two treatments (PMvSFA) |
| Methods | Parallel group RCT |
| Participants | N = 80 Inclusion criteria: single, left‐hemisphere stroke, English as primary language prior to stroke Exclusion criteria: other neurological disorders, untreated depression |
| Interventions | 1. Phonomotor therapy 2. Semantic feature analysis therapy Individuals in both groups will receive 60 h of therapy for free (2 h/d, 5 d/week, 6 weeks) |
| Outcomes | Primary outcome: spoken word production (confrontation naming) Secondary outcomes: response latency, verb production (confrontation naming) Data collection: baseline and 3 months following treatment termination |
| Starting date | March 2014 |
| Contact information | Dr Diane L Kendall, Department of Veterans Affairs, University of Washington diane.kendall@va.gov |
| Notes | Expected completion: October 2017 (final data collection date for primary outcome measure) |
RATS‐3.
| Trial name or title | The efficacy of cognitive linguistic therapy in the acute stage of aphasia: an RCT |
| Methods | Parallel group RCT Cognitive linguistic SLT versus no SLT Massed practice: 2 weeks post onset up to 2 months post onset |
| Participants | N = 150 participants with aphasia within 2 weeks of acute stroke |
| Interventions | 1. Cognitive linguistic therapy: BOX (semantic therapy), FIKS (phonological therapy), or both for 7 h/week for 4 weeks (at least 2 h each week is 1‐to‐1 SLT with the therapist) 2. No SLT: (deferred) |
| Outcomes | Primary outcome: ANELT‐A
Secondary outcomes: verbal SAT, semantic word fluency, non‐words repetition (PALPA), Auditory Lexical Decision (PALPA), letter fluency Data collection: 4 weeks (end of therapy), 3 months after randomisation, 6 months after randomisation |
| Starting date | January 2011 |
| Contact information | EG Visch‐Brink e.visch‐brink@erasmusmc.nl M de Jong‐Hagelstein m.hagelstein@erasmusmc.nl |
| Notes | Expected completion: July 2014 |
TNT ‐ ACTRN12614000081617.
| Trial name or title | TnT: Tablets and Technology during stroke Recovery. Determining the effect of access to and use of tablet technology on stroke survivor quality of life |
| Methods | Parallel RCT |
| Participants | N = 60 Inclusion criteria: aged 18+ years, admitted for rehabilitation for a recent (< 12 weeks ago) stroke (infarct or haemorrhagic) and received training and used tablet technology (i.e. iPad) during their inpatient stay Exclusion criteria: unable to follow 1 stage instructions, pre‐morbid or stroke related impairments preventing effective use of the iPad (may include cognition, motor planning or visual impairments) and patient has arranged access to a tablet device to use after discharge |
| Interventions | 1. Intervention group: given an iPad on discharge from inpatient rehabilitation. They will have it for 4 weeks and during this time will be able to use the iPad and the accompanying applications, in any way they so desire. Applications loaded on the iPads given to patients will include but are not limited to those which by design facilitate: communication (i.e. Speech Sounds on Cue, Conversation TherAppy), cognitive function (Memory, iMazing), dexterity (i.e. Dexteria), movement (i.e. physiotherapyexercises.com), socialisation (i.e. Facebook, Safari for email access) and participation in fun leisure‐based games (i.e. Angry Birds, Uno). Frequency of use of computer technology (which includes tablet devices such as the iPad, but also computers/smart phones/iPods) will be collected in both the control and intervention group through weekly telephone surveys 2. Standard post inpatient rehabilitation and care. Standard care is defined access to all the usual postdischarge services (i.e. referral to outpatient therapy/day hospital programmes/in home services) which is available within the patient's health service |
| Outcomes | Primary outcome: quality of life using the Stroke and Aphasia Quality of Life (SaQOL) Secondary outcome measures: WAB, Self efficacy using the Stroke Self‐Efficacy Questionnaire, participation using the Activity Card Sort (ACS) Data collection: baseline and 1 month postdischarge from inpatient rehabilitation |
| Starting date | 28 January 2014 |
| Contact information | Dr Heidi Janssen PhD, MHSC, BPhysio Hunter Medical Research Institute Stroke Research Team Level 3 East Lot 1, Kookaburra Circuit, New Lambton Heights NSW 2305 Mailing Address: HMRI, Locked Bag 1000, New Lambton NSW 2305 Australia Heidi.Janssen@hnehealth.nsw.gov.au |
| Notes | Recruitment completed. Data currently being analysed and will be published in due course ANZCTR (Ref 23308) |
U‐Health.
| Trial name or title | U‐Health Service using mobile device for improvement of post‐stroke upper limb function and aphasia |
| Methods | Parallel group RCT |
| Participants | N = 36 Inclusion criteria: stroke confirmed by brain imaging study, impairment in upper extremity function or speech, native speaker of Korean Exclusion criteria: previous history of aphasia, psychiatric or psychotic problem, severe cognitive dysfunction, severe hearing or visual loss, cannot sit with devices |
| Interventions | 1. Mobile programme for occupational and speech therapy 2. Traditional rehabilitation therapy |
| Outcomes | Primary outcomes: Fugl‐Meyer upper extremity scale, short form K‐FAST (Korean version of Frenchay Aphasia Screening) Secondary outcomes: hand grip strength, Korean version of the Western Aphasia Battery (K‐WAB) Data collection: baseline and at 4 weeks |
| Starting date | March 2013 |
| Contact information | Prof Nam‐Jong Paik Department of Rehabilitation Medicine, Seoul National University, Republic of Korea E‐mail: njpaik@snu.ac.kr |
| Notes | Trial Reg No: NCT01815905 |
VERSE III.
| Trial name or title | Very Early Rehabiliation in SpEech (VERSE): the development of an Australian randomised controlled trial of aphasia therapy after stroke |
| Methods | 3‐arm prospective multicentre RCT |
| Participants | Inclusion criteria: acute stroke with resultant acute aphasia of any type and score < 93.7 of the Aphasia Quotient (no TIA, SAH or SDH), medical stability at recruitment, ability to maintain a wakeful alert state for 30 consecutive minutes within 14 d of stroke onset, normal or corrected hearing and vision Exclusion criteria: pre‐existing aphasia, patients who have suffered a head injury, have had or require neurosurgery, pre‐existing clinical diagnosis of dementia or major depression, concurrent progressive neurological disorders, patients unable to participate in English‐based therapy due to English being a second language |
| Interventions | 1. Usual care (ward‐based aphasia therapy at discretion of therapist likely to include non‐standardised aphasia therapy, counselling and patient/family education) likely to be 1 to 3 sessions of 30 min/week 2. Usual care plus (daily 1‐to‐1 ward‐based aphasia therapy; non‐standardised aphasia therapy, counselling, patient/family education) 20 sessions of 45‐60 min (minimum 3 to maximum 5 sessions per week) 3. Very Early Rehabiliation in Speech (VERSE) (daily 1‐to‐1 ward‐based prescribed aphasia therapy; standardised intervention prescribed by expert advisory committee to meet goals based on patient needs) 20 sessions of 45‐60 minutes (minimum 3 to maximum 5 sessions per week) SLT starts before day 14 post aphasia onset. 20 sessions |
| Outcomes | Primary outcome: Western Aphasia Battery Aphasia Quotient Score Secondary outcome: Western Aphasia Battery Aphasia Quotient Score, Discourse Analysis (correct information units), anxiety Depression Rating Score, Stroke and Aphasia Quality of Life (SAQoL), Resources Utilisation Questionnaire Data collection: baseline, 12 and 26 weeks poststroke. Blinded outcome assessment |
| Starting date | 23 September 2013 |
| Contact information | Dr Erin Godecke School of Psychology and Social Sciences, Edith Cowan University, Australia e.godecke@ecu.edu.au |
| Notes | Trial Reg No: ACTRN12613000776707 |
ABC: Aphasia Battery in Chinese; ADL: activities of daily living; ANELT: Amsterdam‐Nijmegen Everyday Language Test; AQ: Aphasia Quotient; BDAE: Boston Diagnostic Aphasia Examination; BNT: Boston Naming Test; CAT: Comprehensive Aphasia Test; CCRE: Centre for Clinical Research Excellence; CETI: Communicative Effectiveness Index; CIAT: constraint‐induced aphasia therapy; CIU: correct information unit; CT: computerised tomography; CVA: cerebrovascular accident; DTI: diffusion tensor imaging; FCP: Functional Communication Profile; fMRI: functional magnetic resonance imaging; NHS: National Health Service (UK); MCA: middle cerebral artery; MIT: melodic intonation therapy; MRI: magnetic resonance imaging; PALPA: Psycholinguistic Assessments of Language Processing in Aphasia; PACE: Promoting Aphasics' Communicative Effectiveness therapy; PGI: Patient Global Impression; RCT: randomised controlled trial; SAH: subarachnoid haemorrhage; SAQoL: Stroke and Aphasia Quality of Life Scale; SAT: Semantic Association Test; SDH: subdural haematoma; SLT: speech and language therapy; TIA: transient ischaemic attack; TOMs: Therapy Outcome Measures; UAT: unconstrained aphasia therapy; WAB: Western Aphasia Battery; WBIC: Wolfson Brain Imaging Centre.
Differences between protocol and review
Amendments to the original 1999 review
Following close inspection of the original review and detailed discussion among this review team (Greener 1999), we made adjustments to the review, many of which reflect changes in Cochrane procedures, review methodologies, and style and structure in the time since the publication of the original review. These amendments were ratified by the Cochrane Stroke Group Editorial Board on 23 November 2006.
Background
We updated the Background section to include a definition of SLT and aphasia, and to reflect current approaches and rationale to SLT interventions and outcomes.
Objectives
We amended the Objectives to a single statement according to the standard format of Cochrane reviews; that is, to assess the effects of SLT interventions for aphasia following stroke.
Types of studies
It was unclear whether or not quasi‐randomised controlled trials were included in the original review. We have excluded quasi‐randomised trials.
Types of interventions
We compressed the Types of interventions into three broad categories: SLT versus no SLT intervention, SLT versus social support or stimulation, and SLT intervention A versus SLT intervention B (where A and B refer to two different types of therapeutic interventions or approaches).
Types of outcome measures
We refined the Types of outcome measures to a single primary outcome measure of functional communication. Secondary outcomes include other measures of communication (receptive or expressive language, or both), psychosocial outcomes, patient satisfaction with the intervention, number of participant dropouts for any reason, adherence to the allocated intervention, economic outcomes (such as cost to the patient, caregivers, families, health service, and society) and caregiver or family satisfaction. We extracted data relating to death, morbidity and cognitive skills in the original review, but on reflection, we did not consider these to be relevant indicators of the effectiveness of an SLT intervention, and we therefore excluded them from this update. The original review reported overall functional status (e.g. Barthel Index) as one of a number of primary outcomes. As described above, we focused on a single primary outcome (in line with the current review methodology).
Data extraction tool
For this 2016 version of the review, PC and MB created and piloted a new electronically based data extraction tool. MB and HK or PE had extracted data from trials included the 2012 review using a paper‐based tool.
Search methods for identification of studies
Re‐running the original search strategy for the MEDLINE and CINAHL databases raised over 12.6 million references. Therefore, Brenda Thomas, the Cochrane Stroke Group Trials Search Co‐ordinator, devised up‐to‐date search strategies. We handsearched the International Journal of Language and Communication Disorders (previously named the British Journal of Disorders of Communication, theEuropean Journal of Disorders of Communication and the International Journal of Disorders of Communication) from 1969 to 2005. This journal has been indexed by MEDLINE since 2006 and was thus included in our electronic searches from this date.
Description of studies
The original 1999 review listed studies other than identified RCTs in the Characteristics of excluded studies table, including single case or case series studies. As there are a vast number of such studies, the updated table now only presents potentially relevant studies that appear to be randomised but which we excluded for other reasons (e.g. quasi‐randomised or where we could not extract aphasia‐specific data).
Comparisons
Mid‐trial outcome scores were included in the 1999 review. We have focused our reporting on postintervention and follow‐up scores. We have not included analyses of the number of participants who deteriorated on particular outcome measures.
Other amendments
As we were unable to obtain the extraction sheets for the trials included in the review (published in 1999), we cross‐checked the data extracted for the original review with the available published and unpublished data. We made some amendments regarding the exclusion of some studies and the categorisation of the methods of allocation concealment used in the included trials.
In the 2012 review update, we excluded quasi‐randomised studies, so we excluded one study that had contributed to the 1999 review (Hartman 1987). In addition, on reviewing the data from another trial (Kinsey 1986), we decided that the reported comparison was not a therapy intervention as such, but rather a comparison of task performance (computer‐based or with a therapist). We thus excluded this trial from subsequent reviews. The review team considered allocation concealment for one study to be 'inadequate' in the 1999 review (MacKay 1988). We failed to get confirmation of the method of allocation from the authors, and therefore we amended the allocation for this trial to 'unclear'. The 1999 review included a matched control group of no SLT intervention for one trial (Prins 1989). However, unlike the other groups in this trial, this group was not randomised, therefore we have excluded it from this update. Another study had been excluded from the original review on the grounds that it was not an RCT (Shewan 1984). Discussion with the trialists has since revealed that it was, and we have now included it in the 2012 and 2016 reviews.The original 1999 review included outcomes relating to the impact of SLT on the emotional well‐being of family members (Lincoln 1984a). Such outcomes do not directly relate to the aims of this review, so we have not included these measures.
Information added to the 1999 review
Following an extensive search up to April 2009, we identified an additional 20 trials as suitable for inclusion in the review. The 2010 review included data from 30 trials involving 1840 randomised participants (Kelly 2010).
Information added to the 2012 review
Following an extensive search from inception of the electronic databases up to July 2011, we identified an additional nine trials eligible for inclusion in the review. This 2012 review update now includes data from 39 trials involving 2518 randomised participants.
Information added to the 2016 review
Following a revised and extended search (incorporating additional electronic databases) from inception of the databases up to 22 September 2015, we identified an additional 18 trials (22 randomised comparisons) eligible for inclusion in the review. This 2016 review update now includes data from 57 completed trials (74 randomised comparisons) involving 3002 randomised participants.
Contributions of authors
MB designed the review, conducted the search, screened and retrieved references for inclusion and exclusion criteria, contacted relevant authors, obtained translations for non‐English publications, obtained unpublished data, extracted data from included trials, evaluated methodological quality, entered and analysed the data, interpreted the findings, and wrote the review.
HK conducted an early version of the search (1999 to 2009) and screened and retrieved references for inclusion and exclusion criteria, contacted relevant authors and academic institutions, obtained translations for non‐English publications, obtained unpublished data, extracted data from included trials, evaluated methodological quality, entered and analysed data, interpreted the findings, and contributed to the writing of the review.
JG provided statistical support for data extraction and analysis and commented on review drafts.
PE co‐authored the original review, contributed to the evaluation of the methodological quality and interpretation of certain studies, and commented on the updated review.
PC conducted the new search (for the 2015 review), screened and retrieved references for inclusion and exclusion criteria, obtained translations for non‐English publications, obtained unpublished data, extracted data from included trials, evaluated methodological quality, entered the data, interpreted the findings, and wrote the review.
Sources of support
Internal sources
Nursing, Midwifery and Allied Health Professions Research Unit, UK.
External sources
Chief Scientist Office Scotland, UK.
Declarations of interest
Marian Brady is a speech and language therapist, member of the Royal College of Speech and Language Therapists, and is registered with the Health and Care Professions Council, UK.
Helen Kelly is a speech and language therapist and member of the Royal College of Speech and Language Therapists.
Pam Enderby has been involved in two studies included in this review. She did not contribute to the assessment or interpretation of either of these studies.
Jon Godwin: none known.
Pauline Campbell: none known.
New search for studies and content updated (conclusions changed)
References
References to studies included in this review
ACTNoW 2011 {published and unpublished data}
- Bowen A. Assessing the effectiveness of communication therapy in the North West ‐ ACTNoW study. http://www.controlled‐trials.com/mrct/ukctrsearch.html (accessed 26 November 2014).
- Bowen A, Hesketh A, Patchick E, Young A, Davies L, Vail A, et al. Clinical Effectiveness, Cost Effectiveness and Service Users' Perceptions of Early, Intensively‐Resourced Communication Therapy Following a Stroke, a Randomised Controlled Trial (The ACT NoW Study). London: Health Technology Assessment, 2011. [DOI] [PubMed] [Google Scholar]
- Bowen A, Patchick E. Assessing the effectiveness of communication therapy in the North West ‐ the ACT NoW study: a work in progress. [Abstract OG01]. Proceedings of the 4th UK Stroke Forum Conference 1‐3 December 2009, SECC, Glasgow, UK. Wiley‐Blackwell, 2009.
- Patchick E, Watkins C, Wilkinson M, Bowen A. Attention control within the ACTNoW randomized controlled trial: getting it right?. Clinical Rehabilitation 2010;24(958):958. [Google Scholar]
- Young A, Gomersall T, Patchick E, Bowen A. The ACTNoW qualitative study: exploring the perspectives of people with aphasia or dysarthria who participated in the randomised controlled trial (RCT). [Abstract 114]. International Journal of Stroke 2010;5(Suppl 3):59. [Google Scholar]
B.A.Bar 2011i {published and unpublished data}
- Nobis‐Bosch R, Springer L, Radermacher I, Huber W. Supervised home training in aphasia: language learning in dialogues. Forum Logopadie 2010;24(5):6‐13. [Google Scholar]
- Nobis‐Bosch R, Springer L, Radermacher I, Huber W. Supervised home training of dialogue skills in chronic aphasia: a randomized parallel group study. Journal of Speech Language and Hearing Research 2011;54(4):1118‐36. [DOI] [PubMed] [Google Scholar]
B.A.Bar 2011ii {published and unpublished data}
- Nobis‐Bosch R, Springer L, Radermacher I, Huber W. Supervised home training in aphasia: language learning in dialogues. Forum Logopadie 2010;24(5):6‐13. [Google Scholar]
- Nobis‐Bosch R, Springer L, Radermacher I, Huber W. Supervised home training of dialogue skills in chronic aphasia: a randomized parallel group study. Journal of Speech Language and Hearing Research 2011;54(4):1118‐36. [DOI] [PubMed] [Google Scholar]
Bakheit 2007 {published and unpublished data}
- Bakheit M, Shaw S, Barrett L, Wood J, Carrington S, Griffiths S, et al. A prospective, randomized, parallel group, controlled study of the effect of intensity of speech and language therapy on early recovery from poststroke aphasia. Clinical Rehabilitation 2007;21(10):885‐94. [DOI] [PubMed] [Google Scholar]
CACTUS 2013 {published and unpublished data}
- Latimer NR, Dixon S, Palmer R. Cost‐utility of self‐managed computer therapy for people with aphasia. International Journal of Technology Assessment in Health Care 2013;29(4):402‐9. [DOI] [PubMed] [Google Scholar]
- Palmer R, Enderby P, Cooper C, Latimer N, Julious S, Paterson G, et al. Computer therapy compared with usual care for people with long‐standing aphasia poststroke: a pilot randomized controlled trial. Stroke 2012;43(7):1904‐11. [DOI] [PubMed] [Google Scholar]
- Palmer R, Enderby P, Mortley J, Cooper C, Dixon S, Julious S, et al. Cost effectiveness of aphasia therapy compared with usual stimulation for people with long standing aphasia (CACTUS): results of a pilot study. International Journal of Stroke 2011;6(Suppl 2):4. [Google Scholar]
- Palmer R, Enderby P, Mortley J, Cooper C, Dixon S, Julious S, et al. Evaluating the cost effectiveness of computer therapy compared with usual stimulation for people with long standing aphasia: a feasibility study. Protocol April 2010.
- Palmer R, Enderby P, Mortley J, Cooper C, Dixson S, Julious S, et al. Cost effectiveness of aphasia computer therapy compared with usual stimulation for people with longstanding aphasia: a feasibility study (CACTUS). [Abstract OG25]. Proceedings of the 4th UK Stroke Forum Conference 1‐3 December 2009, SECC, Glasgow, UK. Wiley‐Blackwell, 2009.
- Palmer R, Paterson G. Do volunteers have a role in the workforce to support long term speech and language rehabilitation?. International Journal of Stroke 2013;8(Suppl 3):32. [Google Scholar]
- Palmer R, Paterson G, Delaney A, Hughes H, Enderby P. Independent speech and language practice with aphasia computer software is an acceptable alternative to face to face therapy in the long term post stroke. Stroke 2013;44(2):NS14. [Google Scholar]
- Palmer R, Paterson G, Delany A. Have your say: engaging people with communication disorders in stroke research. Proceedings of the 5th UK Stroke Forum Conference 30 November‐2 December 2010 SECC, Glasgow, UK. Wiley‐Blackwell, 2010.
Conklyn 2012 {published data only}
- Conklyn D, Novak E, Boissy A, Bethoux F, Chemali K. The effects of modified melodic intonation therapy on nonfluent aphasia: a pilot study. Journal of Speech Language and Hearing Research 2012;55(5):1463‐71. [DOI] [PubMed] [Google Scholar]
Crerar 1996 {published and unpublished data}
- Crerar MA. A computer‐based microworld for the assessment and remediation of sentence processing deficits in aphasia. Unpublished PhD thesis. Napier University, Edinburgh. 1991. [DOI] [PubMed]
- Crerar MA, Ellis AW, Dean EC. Remediation of sentence processing deficits in aphasia using a computer‐based microworld. Brain and Language 1996;52(1):229‐75. [DOI] [PubMed] [Google Scholar]
Crosson 2014 {unpublished data only}
- Altmann LJ, Hazamy AA, Carvajal PJ, Benjamin M, Rosenbek JC, Crosson B. Delayed stimulis‐specific improvements in discourse following anomia treatment using an intentional gesture. Journal of Speech Language and Hearing Research 2014;57(2):439‐54. [DOI] [PMC free article] [PubMed] [Google Scholar]
- Benjamin ML, Towler S, Garcia A, Park H, Sudhyadhom A, Harnish S, et al. A behavioral manipulation engages right frontal cortex during aphasia therapy. Neurorehabilitation and Neural Repair 2014;28(6):545‐53. [DOI] [PMC free article] [PubMed] [Google Scholar]
- Crosson B. Treating intention in aphasia: neuroplastic substrates. https://clinicaltrials.gov/ct2/show/NCT00567242 (accessed 22 September 2015).
- Crosson B, Fabrizio KS, Singletary F, Cato MA, Wierenga CE, Parkinson RB, et al. Treatment of naming in nonfluent aphasia through manipulation of intention and attention: a phase 1 comparison of two novel treatments. Journal of the International Neuropsychological Society 2007;13(4):582‐94. [DOI] [PubMed] [Google Scholar]
David 1982 {published and unpublished data}
- David R, Enderby P, Bainton D. Response to Huber W, Poeck K, Springer L, Willmes K. Journal of Neurology, Neurosurgery and Psychiatry 1983;46(7):692‐3. [DOI] [PMC free article] [PubMed] [Google Scholar]
- David R, Enderby P, Bainton D. Response to Marshall RC, Golper LA. Journal of Neurology, Neurosurgery and Psychiatry 1983;46(7):689‐91. [DOI] [PMC free article] [PubMed] [Google Scholar]
- David R, Enderby P, Bainton D. Response to TR Pring. British Journal of Disorders of Communication 1983;18(2):73‐7. [PubMed] [Google Scholar]
- David R, Enderby P, Bainton D. Treatment of acquired aphasia: speech therapists and volunteers compared. Journal of Neurology, Neurosurgery and Psychiatry 1982;45(11):957‐61. [DOI] [PMC free article] [PubMed] [Google Scholar]
- David RM. A comparison of speech therapists and volunteers in the treatment of acquired aphasia. Unpublished thesis, University of London, UK. 1982.
- David RM, Enderby P, Bainton D. Progress report on an evaluation of speech therapy for aphasia. British Journal of Disorders of Communication 1979;14(2):85‐8. [DOI] [PubMed] [Google Scholar]
- Enderby P. Proposed evaluation of speech therapy for acquired aphasia. British Journal of Disorders of Communication 1976;11(2):144‐8. [DOI] [PubMed] [Google Scholar]
Denes 1996 {published and unpublished data}
- Denes G, Perazzolo C, Piani A, Piccione F. Intensive versus regular speech therapy in global aphasia: a controlled study. Aphasiology 1996;10(4):385‐94. [Google Scholar]
Di Carlo 1980 {published data only (unpublished sought but not used)}
- Carlo L. Language recovery in aphasia: effect of systematic filmed programmed instruction. Archives of Physical Medicine and Rehabilitation 1980;61(1):41‐4. [PubMed] [Google Scholar]
Doesborgh 2004 {published and unpublished data}
- Doesborgh SJC, Sandt‐Koenderman MWME, Dippel DWJ, Harskamp F, Koudstaal PJ, Visch‐Brink EG. Cues on request: the efficacy of Multicue, a computer program for word finding therapy. Aphasiology 2004;18(3):213‐22. [Google Scholar]
Drummond 1981 {unpublished data only}
- Drummond SS, Rentschler GJ. The efficacy of gestural cueing in dysphasic word‐retrieval responses. Journal of Communication Disorders 1981;14(4):287‐98. [DOI] [PubMed] [Google Scholar]
Elman 1999 {published data only (unpublished sought but not used)}
- Elman RJ, Bernstein‐Ellis E. Psychosocial aspects of group communication treatment. Seminars in Speech and Language 1999;20(1):65‐72. [DOI] [PubMed] [Google Scholar]
- Elman RJ, Bernstein‐Ellis E. The efficacy of group communication treatment in adults with chronic aphasia. Journal of Speech, Language and Hearing Research 1999;42(2):411‐9. [DOI] [PubMed] [Google Scholar]
FUATAC {unpublished data only}
- ISRCTN26390986. Forced Use Aphasia Therapy in the ACute phase (FUATAC). http://www.isrctn.com/ISRCTN26390986 (accessed 22 September 2015).
- Küst J, Kuhn D, Wadehn J, Karbe H. Communication oriented forced‐use therapy for aphasic patients [Kommunikationsorientierte forced‐use Therapie bei Aphasikern]. http://www.refonet.de/veranstaltungen/documents/05004Posterrefonetupdate2007.pdf (accessed 25 March 2012).
Hinckley 2001 {published and unpublished data}
- Hinckley JJ, Patterson JP, Carr TH. Differential effects of context‐ and skill‐based treatment approaches: preliminary findings. Aphasiology 2001;15(5):463‐76. [Google Scholar]
Katz 1997i {published and unpublished data}
- Katz RC, Wertz RT. Computerized hierarchical reading treatment in aphasia. Aphasiology 1992;6(2):165‐77. [Google Scholar]
- Katz RC, Wertz RT. The efficacy of computer‐provided reading treatment of chronic aphasic adults. Journal of Speech, Language and Hearing Research 1997;40(3):493‐507. [DOI] [PubMed] [Google Scholar]
- Katz RC, Wertz RT, Lewis SM, Esparza C, Goldojarb MA. A comparison of computerized reading treatment, computer stimulation, and no treatment for aphasia. In: Prescott TE editor(s). Clinical Aphasiology. Vol. 19, Austin, Texas: Pro‐Ed, 1991:243‐54. [Google Scholar]
Katz 1997ii {published and unpublished data}
- Katz RC, Wertz RT. Computerized hierarchical reading treatment in aphasia. Aphasiology 1992;6(2):165‐77. [Google Scholar]
- Katz RC, Wertz RT. The efficacy of computer‐provided reading treatment of chronic aphasic adults. Journal of Speech, Language and Hearing Research 1997;40(3):493‐507. [DOI] [PubMed] [Google Scholar]
- Katz RC, Wertz RT, Lewis SM, Esparza C, Goldojarb MA. A comparison of computerized reading treatment, computer stimulation, and no treatment for aphasia. In: Prescott TE editor(s). Clinical Aphasiology. Vol. 19, Austin, Texas: Pro‐Ed, 1991:243‐54. [Google Scholar]
Laska 2011 {published and unpublished data}
- Laska AC, Kahan T, Hellblom A, Murray V, Arbin M. A randomized controlled trial on very early speech and language therapy in acute stroke patients with aphasia. Cerebrovascular Diseases 2011; Vol. 1, issue (Suppl 1):66‐74. [DOI: 10.1159/000329835] [DOI] [PMC free article] [PubMed]
- Laska AC, Kahan T, Hellblom A, Murray V, Arbin M. A randomized controlled trial on very early speech and language therapy in patients with acute stroke and aphasia. Cerebrovascular Diseases 2010;29(Suppl 2):Abst. 1. [DOI] [PMC free article] [PubMed] [Google Scholar]
- Laska AC, Kahan T, Hellblom A, Murray V, Arbin M. Design and methods of a randomised controlled trial on early speech and language therapy in patients with acute stroke and aphasia. Topics in Stroke Rehabilitation 2008;15(3):256‐61. [DOI] [PubMed] [Google Scholar]
Leal 1993 {published and unpublished data}
- Ferro JM, Leal G, Farrajota L, Fonseca J, Guerreiro M, Castro‐Caldas A. Speech therapy or home training for stroke aphasics?. Journal of Neurology 1992;239(Suppl 3):20. [Google Scholar]
- Leal MG, Farrajota L, Fonseca J, Guerriero M, Castro‐Caldas A. The influence of speech therapy on the evolution of stroke aphasia. Journal of Clinical and Experimental Neuropsychology 1993;15(3):399. [Google Scholar]
- Leal MG, Farrajota L, Fonseca J, Santos ME, Guerriero M, Ferro JM, et al. The influence of speech therapy on the evolution of stroke aphasia. Unpublished report. Language Research Laboratory, Lisbon, Portugal, 1994.
Lincoln 1982i {published and unpublished data}
- Lincoln NB. An Investigation of the Effectiveness of Language Retraining Methods with Aphasic Stroke Patients. [PhD thesis]. London, UK: University of London, 1980. [Google Scholar]
- Lincoln NB, Pickersgill MJ, Hankey AI, Hilton CR. An evaluation of operant training and speech therapy in the language rehabilitation of moderate aphasics. Behavioural Psychotherapy 1982;10(2):162‐78. [Google Scholar]
Lincoln 1982ii {published and unpublished data}
- Lincoln NB. An Investigation of the Effectiveness of Language Retraining Methods with Aphasic Stroke Patients. [PhD thesis]. 1980. [Google Scholar]
- Lincoln NB, Pickersgill MJ, Hankey AI, Hilton CR. An evaluation of operant training and speech therapy in the language rehabilitation of moderate aphasics. Behavioural Psychotherapy 1982;10(2):162‐78. [Google Scholar]
Lincoln 1982iii {published and unpublished data}
- Lincoln NB. An Investigation of the Effectiveness of Language Retraining Methods with Aphasic Stroke Patients. [PhD thesis]. 1980. [Google Scholar]
- Lincoln NB, Pickersgill MJ, Hankey AI, Hilton CR. An evaluation of operant training and speech therapy in the language rehabilitation of moderate aphasics. Behavioural Psychotherapy 1982;10(2):162‐78. [Google Scholar]
Lincoln 1984a {published and unpublished data}
- Berman A, Rowntree P, Smith L, Chambers C, Russell R, Chipperfield E, et al. Speech therapy for the stroke patient. The Lancet 1984;2(8394):104. [PubMed] [Google Scholar]
- Howard D. Speech therapy for aphasic stroke patients. The Lancet 1984;1(8391):1413‐4. [PubMed] [Google Scholar]
- Lendrem W, Lincoln NB. Spontaneous recovery of language in patients with aphasia between 4 and 34 weeks after stroke. Journal of Neurology, Neurosurgery and Psychiatry 1985;48(8):743‐8. [DOI] [PMC free article] [PubMed] [Google Scholar]
- Lendrem W, McGuirk E, Lincoln N. Factors affecting language recovery in aphasic stroke patients receiving speech therapy. Journal of Neurology, Neurosurgery and Psychiatry 1988; Vol. 51, issue 8:1103‐10. [DOI] [PMC free article] [PubMed]
- Lincoln N, Mulley GP, Jones AC, McGuirk E, Lendrem W, Mitchell JRA. Effectiveness of speech therapy for aphasic stroke patients. The Lancet 1984;1(8388):1197‐200. [DOI] [PubMed] [Google Scholar]
- Lincoln NB. Psychological effects of speech therapy. International Journal of Rehabilitation Research 1985; Vol. 8, issue Suppl 4:22.
- Lincoln NB, Jones AC, Mulley GP. Psychological effects of speech therapy. Journal of Psychosomatic Research 1985;29(5):467‐74. [DOI] [PubMed] [Google Scholar]
- Lincoln NB, McGuirk E. Speech therapy for the stroke patient. The Lancet 1984;2(8394):104. [PubMed] [Google Scholar]
- Williams J, Wenden F, Jenkins DG. Speech therapy for aphasic stroke patients. The Lancet 1984;1(8391):1413. [PubMed] [Google Scholar]
Lincoln 1984b {published and unpublished data}
- Lincoln NB. An Investigation of the Effectiveness of Language Retraining Methods with Aphasic Stroke Patients. [PhD thesis] 1980.
- Lincoln NB, Pickersgill MJ. The effectiveness of programmed instruction with operant training in the language rehabilitation of severely aphasic patients. Behavioural Psychotherapy 1984;12(3):237‐48. [Google Scholar]
Liu 2006a {published data only (unpublished sought but not used)}
- Liu Y, Zhang L. The TCM‐combined treatment for aphasia due to cerebrovascular disorders. Zhongyi Zazhi [Journal of Traditional Chinese Medicine] 2006;26(1):19‐21. Chinese. [PubMed] [Google Scholar]
Lyon 1997 {published and unpublished data}
- Lyon JG, Cariski D, Keisler L, Rosenbek J, Levine R, Kumpula J, et al. Communication partners: enhancing participation in life and communication for adults with aphasia in natural settings. Aphasiology 1997;11(7):693‐708. [Google Scholar]
MacKay 1988 {published data only (unpublished sought but not used)}
- Mackay S, Holmes DW, Gersumky AT. Methods to assess aphasic stroke patients. Geriatric Nursing 1988;9(3):177‐9. [DOI] [PubMed] [Google Scholar]
Mattioli 2014 {published and unpublished data}
- Ambrosi C, Mattioli F, Mascaro L, Biagi L, Tosetti M, Gasparotti R. Functional MR imaging of patients with mild aphasia after stroke: Activation of language network from acute to chronic phase and preliminary results of early rehabilitation effect. Neuroradiology Journal 2010;23:340. [Google Scholar]
- Mattioli F, Ambrosi C, Mascaro L, Scarpazza C, Pasquali P, Frugoni M, et al. Early aphasia rehabilitation Is associated with functional reactivation of the left inferior frontal gyrus: a pilot study. Stroke 2014;45(2):545‐52. [DOI] [PubMed] [Google Scholar]
Meikle 1979 {published data only (unpublished sought but not used)}
- Meikle M, Wechsler E, Tupper A, Benenson M, Butler J, Mulhall D, et al. Comparative trial of volunteer and professional treatments of dysphasia after stroke. BMJ 1979;2(6182):87‐9. [DOI] [PMC free article] [PubMed] [Google Scholar]
Meinzer 2007 {published and unpublished data}
- Meinzer M, Streiftau S, Rockstroh B. Intensive language training in the rehabilitation of chronic aphasia ‐ effective training by laypersons. Journal of the International Neuropsychological Society 2007;13(5):846‐53. [DOI] [PubMed] [Google Scholar]
MIT 2014i {published and unpublished data}
- Meulen AC, Sandt‐Koenderman WME, Visch‐Brink EG, Smits M, Duivenvoorden HJ, Ribbers GM. The efficacy of melodic intonation therapy (MIT) in aphasia rehabilitation: Research Protocol Version 2. http://www.trialregister.nl/trialreg/admin/rctview.asp?TC=1961 (accessed 22 September 2015).
- Meulen I, Sandt‐Koenderman ME, Heijenbrok‐Kal MH, Visch‐Brink EG, Ribbers GM. The efficacy and timing of melodic intonation therapy in subacute aphasia. Neurorehabilitation and Neural Repair 2014;28(6):536‐44. [DOI] [PubMed] [Google Scholar]
- Meulen I, Sandt‐Koenderman ME, Ribbers GM. Melodic Intonation Therapy: present controversies and future opportunities. Archives of Physical Medicine and Rehabilitation 2012;93(Suppl 1):S46‐52. [DOI] [PubMed] [Google Scholar]
MIT 2014ii {published and unpublished data}
- Meulen AC, Sandt‐Koenderman WME, Visch‐Brink EG, Smits M, Duivenvoorden HJ, Ribbers GM. The efficacy of melodic intonation therapy (MIT) in aphasia rehabilitation: Research Protocol Version 2. http://www.trialregister.nl/trialreg/admin/rctview.asp?TC=1961 (accessed 22 September 2015).
- Meulen I, Sandt‐Koenderman ME, Heijenbrok‐Kal MH, Visch‐Brink EG, Ribbers GM. The efficacy and timing of melodic intonation therapy in subacute aphasia. Neurorehabilitation and Neural Repair 2014;28(6):536‐44. [DOI] [PubMed] [Google Scholar]
- Meulen I, Sandt‐Koenderman ME, Ribbers GM. Melodic Intonation Therapy: present controversies and future opportunities. Archives of Physical Medicine and Rehabilitation 2012;93(Suppl 1):S46‐52. [DOI] [PubMed] [Google Scholar]
NARNIA 2013 {published data only}
- ACTRN12613001263785. For people with aphasia following stroke, is a manualised narrative intervention programme aimed at improving discourse in everyday communication situations more effective than usual speech pathology intervention as measured by improved language ability across the different levels of language (i.e. words, sentences, discourse) in everyday communication activities?. http://www.anzctr.org.au/ACTRN12613001263785.aspx (accessed 22 September 2015). [ACTRN12613001263785]
- Whitworth A, Leitão S, Cartwright J, Webster J, Hankey GJ, Zach J, et al. NARNIA: a new twist to an old tale. A pilot RCT to evaluate a multilevel approach to improving discourse in aphasia. Aphasiology 2015;29(11):1345‐82. [Google Scholar]
ORLA 2006 {published and unpublished data}
- Cherney LR, Babbitt EM, Cole R, Vuuren S, Hurwitz R, Ngampatipatpong M. Computer treatment for aphasia: efficacy and treatment intensity. Archives of Physical Medicine and Rehabilitation 2006;87:E5 (Abst.18). [Google Scholar]
- Cherney LR, Lee J, Babbit E, Hurwitz R. Is more better? Preliminary results from a computer treatment study for aphasia. Proceedings of the Clinical Aphasiology Conference 2007. May 22‐26 2007; Scottsdale. Arizona, USA. 2007.
- Cole R, Cherney L. ORLA (Oral Reading for Language in Aphasia with Virtual Therapist). www.bltek.com/virtual‐teachers/orla.html (accessed 26 November 2014).
ORLA 2010 {published and unpublished data}
- Cherney LR. Oral Reading for Language in Aphasia (ORLA): evaluating the efficacy of computer‐delivered therapy in chronic nonfluent aphasia. Topics in Stroke Rehabilitation 2010;17(6):423‐31. [DOI] [PubMed] [Google Scholar]
Prins 1989 {published and unpublished data}
- Prins RS. Aphasia: classification, treatment and recovery [Afasie: classificatie, behandeling en herstelverloop]. Unpublished doctoral dissertation, University of Amsterdam 1987.
- Prins RS, Schoonen R, Vermuelen J. Efficacy of two different types of speech therapy for aphasic patients. Applied Psycholinguistics 1989;10(1):85‐123. [Google Scholar]
Pulvermuller 2001 {published and unpublished data}
- Pulvermuller F, Neininger B, Elbert T, Mohr B, Rockstroh B, Koebbel P. Constraint‐induced therapy of chronic aphasia after stroke. Stroke 2001;32(7):1621‐6. [DOI] [PubMed] [Google Scholar]
RATS {published and unpublished data}
- Doesborgh SJC, Sandt‐Koenderman MWE, Dippel DWJ, Koudstaal PJ, Visch‐Brink EG. Effects of semantic treatment on verbal communication and linguistic processing in aphasia after stroke: a randomized controlled trial. Stroke 2004;35(1):141‐6. [DOI] [PubMed] [Google Scholar]
- Sandt‐Koenderman MWE, Harskamp F, Duivenvoordend HJ, Remerie SC, Voort‐Klees YA, Wielaert SM, et al. MAAS (Multi‐axial Aphasia System): realistic goal setting in aphasia rehabilitation. International Journal of Rehabilitation Research 2008;31(4):314‐20. [DOI] [PubMed] [Google Scholar]
RATS‐2 {published and unpublished data}
- Jong‐Hagelstein M. Word Finding Deficits in Aphasia: Diagnosis and Treatment [PhD thesis]. Rotterdam: Erasmus Universiteit, 2011. [Google Scholar]
- Jong‐Hagelstein M, Sandt‐Koenderman WME, Prins ND, Dippel DW, Koudstaal PJ, Visch‐Brink EG. Efficacy of early cognitive‐linguistic treatment and communicative treatment in aphasia after stroke: a randomised controlled trial (RATS‐2). Journal of Neurology, Neurosurgery and Psychiatry 2011;82(4):399‐404. [DOI] [PubMed] [Google Scholar]
- Hagelstein M, Rotterdam EMC. The effectiveness of cognitive linguistic therapy in the acute phase of aphasia: a randomised controlled trial. Afasiologie 2006;4((Special Issue)):62‐4. [Google Scholar]
- ISRCTN67723958. The efficacy of cognitive linguistic therapy in the acute stage of aphasia: a randomized controlled trial. The Rotterdam Aphasia Therapy Study‐2. http://www.trialregister.nl/trialreg/admin/rctview.asp?TC=736 (accessed 26 November 2014).
Rochon 2005 {published and unpublished data}
- Rochon E, Laird L, Bose A, Scofield J. Mapping therapy for sentence production impairments in nonfluent aphasia. Neuropsychological Rehabilitation 2005;15(1):1‐36. [DOI] [PubMed] [Google Scholar]
SEMaFORE {published and unpublished data}
- Morris J. SemaFoRe: Semantic feature & Repetition therapy in aphasia: a pilot RCT. www.ukctg.nihr.ac.uk/trials?query=%257B%2522query%2522%253A%2522semafore%2522%257D (accessed 22 September 2015).
Shewan 1984i {published and unpublished data}
- Shewan CM, Bandur DL. Treatment of Aphasia: A Language‐oriented Approach. San Diego: College‐Hill Press, 1986. [Google Scholar]
- Shewan CM, Kertesz A. Effects of speech and language treatment on recovery from aphasia. Brain and Language 1984;23(2):272‐99. [DOI] [PubMed] [Google Scholar]
Shewan 1984ii {published and unpublished data}
- Shewan CM, Bandur DL. Treatment of Aphasia: A Language‐oriented Approach. San Diego: College‐Hill Press, 1986. [Google Scholar]
- Shewan CM, Kertesz A. Effects of speech and language treatment on recovery from aphasia. Brain and Language 1984;23(2):272‐99. [DOI] [PubMed] [Google Scholar]
Shewan 1984iii {published and unpublished data}
- Shewan CM, Bandur DL. Treatment of Aphasia: A Language‐oriented Approach. San Diego: College‐Hill Press, 1986. [Google Scholar]
- Shewan CM, Kertesz A. Effects of speech and language treatment on recovery from aphasia. Brain and Language 1984;23(2):272‐99. [DOI] [PubMed] [Google Scholar]
Sickert 2014 {published data only}
- NCT01625676. Constraint‐induced aphasia therapy following sub‐acute stroke: a modified therapy schedule. http://clinicaltrials.gov/show/NCT01625676 (accessed 22 September 2015). [NCT01625676]
- Sickert A, Anders LC, Munte TF, Sailer M. Constraint‐induced aphasia therapy following sub‐acute stroke: a single‐blind, randomised clinical trial of a modified therapy schedule. Journal of Neurology, Neurosurgery Psychiatry 2014;85(1):51‐5. [DOI] [PubMed] [Google Scholar]
Smania 2006 {published and unpublished data}
- Smania N, Aglioti SM, Girardi F, Tinazzi M, Fiaschi A, Cosentino A, et al. Rehabilitation of limb apraxia improves daily life activities in patients with stroke. Neurology 2006;67(11):2050‐2. [DOI] [PubMed] [Google Scholar]
- Smania N, Girardi F, Domenicali C, Lora E, Aglioti S. The rehabilitation of limb apraxia: a study in left‐brain‐damaged patients. Archives of Physical Medicine and Rehabilitation 2000;81(4):379‐88. [DOI] [PubMed] [Google Scholar]
Smith 1981i {published and unpublished data}
- Duffy FR. Speech therapy after stroke: a randomised controlled trial ‐ an interim report. Demonstration Centres in Rehabilitation Newsletter, Volume 28, 1982.
- Smith DS, Goldenberg E, Ashburn A, Kinsella G, Sheikh K, Brennan PJ, et al. Remedial therapy after stroke: a randomised controlled trial. BMJ 1981;282(6263):517‐20. [DOI] [PMC free article] [PubMed] [Google Scholar]
Smith 1981ii {published and unpublished data}
- Duffy FR. Speech therapy after stroke: a randomised controlled trial ‐ an interim report. Demonstration Centres in Rehabilitation Newsletter, Volume 28, 1982.
- Smith DS, Goldenberg E, Ashburn A, Kinsella G, Sheikh K, Brennan PJ, et al. Remedial therapy after stroke: a randomised controlled trial. BMJ 1981;282(6263):517‐20. [DOI] [PMC free article] [PubMed] [Google Scholar]
Smith 1981iii {published and unpublished data}
- Duffy FR. Speech therapy after stroke: a randomised controlled trial ‐ an interim report. Demonstration Centres in Rehabilitation Newsletter, Volume 28, 1982.
- Smith DS, Goldenberg E, Ashburn A, Kinsella G, Sheikh K, Brennan PJ, et al. Remedial therapy after stroke: a randomised controlled trial. BMJ 1981;282(6263):517‐20. [DOI] [PMC free article] [PubMed] [Google Scholar]
SP‐I‐RiT {published and unpublished data}
- Lauterbach M, Leal G, Aguiar M, Fonseca I, Farrajota L, Fonseca J, et al. Intensive vs conventional speech therapy in aphasia due to ischaemic stroke: a randomized controlled trial. Proceedings of the British Aphasiology Society Biennial International Conference Sept 10‐12 2007; Edinburgh, UK. UK: British Aphasiology Society, 2007:67‐8.
- Martins IP, Leal G, Fonseca I, Farrajota L, Aguiar M, Fonseca J, et al. A randomized, rater‐blinded, parallel trial of intensive speech therapy in sub‐acute post‐stroke aphasia: the SP‐I‐R‐IT study. International Journal of Language and Communication Disorders 2013;48(4):421‐31. [DOI] [PubMed] [Google Scholar]
Szaflarski 2014 {published data only (unpublished sought but not used)}
- Szaflarski J, Allendorfer J, Ball A, Banks C, Dietz A, Hart K, et al. Randomized controlled trial of constraint‐induced aphasia therapy in patients with chronic stroke. Neurology 2014;82(10 Suppl):S21.001. [Google Scholar]
Van Steenbrugge 1981 {published and unpublished data}
- Steenbrugge WJ, Prins RS. Word finding difficulties and efficacy of systematic language therapy in aphasic patients. Logopedie en Foniatrie 1981;53:622‐37. [Google Scholar]
Varley 2016i {published and unpublished data}
- Varley R, Cowell PE, Dyson L, Inglis L, Roper A, Whiteside SP. Self‐administered computer therapy for apraxia of speech: two‐period randomized control trial with crossover. Stroke 2016;47(3):822‐8. [DOI] [PubMed] [Google Scholar]
- Varley R, Windsor F, Whiteside S. Whole word therapy for acquired apraxia of speech. Proceedings of the Clinical Aphasiology Conference 2005. May 31 ‐ June 4 2005; Sanibel Island, Florida, USA. 2005.
- Whiteside SP, Inglis AL, Dyson L, Roper A, Harbottle A, Ryder J, et al. Error reduction therapy in reducing struggle and grope behaviours in apraxia of speech. Neuropsychological Rehabilitation 2012;22(2):267‐94. [DOI] [PubMed] [Google Scholar]
Varley 2016ii {published and unpublished data}
- Varley R, Cowell PE, Dyson L, Inglis L, Roper A, Whiteside SP. Self‐administered computer therapy for apraxia of speech: two‐period randomized control trial with crossover. Stroke 2016;47(3):822‐8. [DOI] [PubMed] [Google Scholar]
- Varley R, Windsor F, Whiteside S. Whole word therapy for acquired apraxia of speech. 35th Clinical Aphasiology Conference, Sanibel Island (Florida). 2005.
- Whiteside SP, Inglis AL, Dyson L, Roper A, Harbottle A, Ryder J, et al. Error reduction therapy in reducing struggle and grope behaviours in apraxia of speech. Neuropsychological Rehabilitation 2012;22(2):267‐94. [DOI] [PubMed] [Google Scholar]
VERSE I {published and unpublished data}
- Godecke E, Ciccone N, Granger A, Hankey G, West D, Cream A, et al. Aphasia therapy in early stroke recovery. International Journal of Stroke 2011;6(Issue supplement 1):12. [Google Scholar]
- Godecke E, Hird K, Lalor E. Aphasia therapy in the acute hospital setting: is it justified?. Internal Medicine Journal 2008;38(Suppl 4):A88. [Google Scholar]
- Godecke E, Hird K, Lalor EE, Phillips M. Who needs early aphasia therapy? [Abstract 38]. Cerebrovascular Diseases 2010;29(Suppl 2):337. [Google Scholar]
- Godecke E, Hird K, Lalor EE, Rai T, Phillips MR. Very early poststroke aphasia therapy: a pilot randomized controlled efficacy trial. International Journal of Stroke 2012;7(8):635‐44. [DOI] [PubMed] [Google Scholar]
- Godecke E, West D, Cartwright J, Cream A, Ciccone N, Granger A, et al. Intensive aphasia therapy in the early poststroke recovery phase: is group intervention a viable therapy option?. International Journal of Stroke 2009;4(Issue‐s1):28. [Google Scholar]
- West D, Cream A, Godecke E, Cartwright J, Ciccone N, Granger AS, et al. Intensive aphasia therapy in the early poststroke recovery phase: is group intervention a viable therapy option? [Abstract B30]. International Journal of Stroke 2009;4(Suppl 1):28. [Google Scholar]
VERSE II {unpublished data only}
- Ciccone NA, West DK, Cream A, Cartwright J, Rai T, Granger AS, et al. Constraint‐induced aphasia therapy (CIAT): a randomised controlled trial in very early stroke rehabilitation. Aphasiology 2016;30(5):566‐584. [Google Scholar]
- Godecke E, Cowan E, Rai T, Ciccone NA, Granger AS, Cream A, et al. Does the amount of aphasia therapy in the first 4‐5 weeks after stroke improve outcome? Very Early Rehabilitation in SpEech‐II (VERSE II). Cerebrovascular Diseases 2012;33(Suppl 2):42. [Google Scholar]
Wertz 1981 {published and unpublished data}
- Avent JR, Wertz RT. Influence of type of aphasia and type of treatment on aphasic patients' pragmatic performance. Aphasiology 1996;10(3):253‐65. [Google Scholar]
- Wertz R, Collins MJ, Weiss D, Kurtzke JF, Friden T, Brookshire RH, et al. Veterans administration cooperative study on aphasia: a comparison of individual and group treatment. Journal of Speech and Hearing Research 1981;24(4):580‐94. [DOI] [PubMed] [Google Scholar]
Wertz 1986i {published and unpublished data}
- Kurtzke JF, Wertz RT, Weiss DG, Garcia‐Bunuel L, Aten JL, Brookshire RH, et al. Comparison of improvement in neurologic severity and language in treated and untreated aphasic patients. Neurology 1985;35(Suppl 1):122. [Google Scholar]
- Marshall RC, Wertz RT, Weiss DG, Aten J, Brookshire RH, Garcia‐Bunuel L, et al. Home treatment for aphasic patients by trained nonprofessionals. Journal of Speech and Hearing Disorders 1989;54(3):462‐70. [DOI] [PubMed] [Google Scholar]
- Wertz R, Weiss WG, Aten JL, Brookshire RH, Garcia‐Bunuel L, Holland AL, et al. Comparison of clinic, home and deferred language treatment. Archives of Neurology 1986;43(4):653‐8. [DOI] [PubMed] [Google Scholar]
Wertz 1986ii {published and unpublished data}
- Kurtzke JF, Wertz RT, Weiss DG, Garcia‐Bunuel L, Aten JL, Brookshire RH, et al. Comparison of improvement in neurologic severity and language in treated and untreated aphasic patients. Neurology 1985;35(Suppl 1):122. [Google Scholar]
- Marshall RC, Wertz RT, Weiss DG, Aten J, Brookshire RH, Garcia‐Bunuel L, et al. Home treatment for aphasic patients by trained nonprofessionals. Journal of Speech and Hearing Disorders 1989;54(3):462‐70. [DOI] [PubMed] [Google Scholar]
- Wertz R, Weiss WG, Aten JL, Brookshire RH, Garcia‐Bunuel L, Holland AL, et al. Comparison of clinic, home and deferred language treatment. Archives of Neurology 1986;43(4):653‐8. [DOI] [PubMed] [Google Scholar]
Wertz 1986iii {published and unpublished data}
- Kurtzke JF, Wertz RT, Weiss DG, Garcia‐Bunuel L, Aten JL, Brookshire RH, et al. Comparison of Improvement in neurologic severity and language in treated and untreated aphasic patients. Neurology 1985;35(Suppl 1):122. [Google Scholar]
- Marshall RC, Wertz RT, Weiss DG, Aten J, Brookshire RH, Garcia‐Bunuel L, et al. Home treatment for aphasic patients by trained nonprofessionals. Journal of Speech and Hearing Disorders 1989;54(3):462‐70. [DOI] [PubMed] [Google Scholar]
- Wertz R, Weiss WG, Aten JL, Brookshire RH, Garcia‐Bunuel L, Holland AL, et al. Comparison of clinic, home and deferred language treatment. Archives of Neurology 1986;43(4):653‐8. [DOI] [PubMed] [Google Scholar]
Wilssens 2015 {published data only}
- Wilssens I, Vandenborre D, Dun K, Verhoeven J, Visch‐Brink E, Marien P. Constraint‐induced aphasia therapy versus intensive semantic treatment in fluent aphasia. American Journal of Speech‐Language Pathology 2015;24(2):281‐94. [DOI] [PubMed] [Google Scholar]
Woolf 2015i {published and unpublished data}
- Woolf C, Caute A, Haigh Z, Galliers J, Wilson S, Kessie A, et al. A comparison of remote therapy, face to face therapy and an attention control intervention for people with aphasia: a quasi‐randomised controlled feasibility study. Clinical Rehabilitation 2016;30(4):359‐73. [DOI] [PubMed] [Google Scholar]
Woolf 2015ii {published data only}
- Woolf C, Caute A, Haigh Z, Galliers J, Wilson S, Kessie A, et al. A comparison of remote therapy, face to face therapy and an attention control intervention for people with aphasia: a quasi‐randomised controlled feasibility study. Clinical Rehabilitation 2016;30(4):359‐73. [DOI] [PubMed] [Google Scholar]
Woolf 2015iii {published data only}
- Woolf C, Caute A, Haigh Z, Galliers J, Wilson S, Kessie A, et al. A comparison of remote therapy, face to face therapy and an attention control intervention for people with aphasia: a quasi‐randomised controlled feasibility study. Clinical Rehabilitation 2016;30(4):359‐73. [DOI] [PubMed] [Google Scholar]
Wu 2004 {published data only (unpublished sought but not used)}
- Wu X. Analysis of the effect of 'two‐step method' on aphasia in patients with acute cerebrovascular disease. Zhongguo Linchuang Kangfu [Chinese Journal of Clinical Rehabilitation] 2004;8(22):4422‐3. Chinese. [Google Scholar]
Wu 2013 {published data only}
- Wu H‐X, Qiu W‐H, Kang Z, Yang Q. The Study on Recovery Mechanism of Expressive Aphasia after Stroke Based on fMRI [abstract: 0039]. Journal of Head Trauma Rehabilitation 2013;28(5):E45. [Google Scholar]
Xie 2002 {published data only}
- Xie SL, Zhu MG, Zhang XL, Xue ZJ. The role of community nursing in family rehabilitation of stroke patients with impaired spoken language. Zhongguo Linchuang Kangfu [Chinese Journal of Clinical Rehabilitation] 2002;6(21):3289. [Google Scholar]
Yao 2005i {published data only (unpublished sought but not used)}
- Yao J, Xue Y, Li F. Clinical application research on collective language strengthened training in rehabilitation nursing of cerebral apoplexy patients with aphasia. Huli Yanjiu [Chinese Nursing Research] 2005;19(3B):482‐4. Chinese. [Google Scholar]
Yao 2005ii {published data only (unpublished sought but not used)}
- Yao J, Xue Y, Li F. Clinical application research on collective language strengthened training in rehabilitation nursing of cerebral apoplexy patients with aphasia. Huli Yanjiu [Chinese Nursing Research] 2005;19(3B):482‐4. Chinese. [Google Scholar]
Yao 2005iii {published data only (unpublished sought but not used)}
- Yao J, Xue Y, Li F. Clinical application research on collective language strengthened training in rehabilitation nursing of cerebral apoplexy patients with aphasia. Huli Yanjiu [Chinese Nursing Research] 2005;19(3B):482‐4. Chinese. [Google Scholar]
Zhang 2007i {published data only}
- Zhang H‐M. Clinical treatment of apoplectic aphemia with multi‐needle puncture of scalp‐points in combination with visual‐listening‐speech training. Zhenci Yanjiu [Acupuncture Research] 2007;32(3):190‐4. Chinese. [PubMed] [Google Scholar]
Zhang 2007ii {published data only (unpublished sought but not used)}
- Zhang H‐M. Clinical treatment of apoplectic aphemia with multi‐needle puncture of scalp‐points in combination with visual‐listening‐speech training. Zhenci Yanjiu [Acupuncture Research] 2007;32(3):190‐4. Chinese. [PubMed] [Google Scholar]
Zhao 2000 {published data only (unpublished sought but not used)}
- Zhao H, Ying B, Shen C. Clinical study on the effect of combined therapy of medicine acupuncture and speech training on aphasia from ischemic apoplexy. Henan Zhongyi [Henan Traditional Chinese Medicine] 2000;20(5):31‐2. Chinese. [Google Scholar]
References to studies excluded from this review
Albert 1973 {published data only}
- Albert ML, Sparks RW, Helm NA. Melodic intonation therapy for aphasia. Archives of Neurology 1973;29(2):130‐1. [DOI] [PubMed] [Google Scholar]
Avent 2004 {published data only}
- Avent J. Group treatment for aphasia using cooperative learning principles. Topics in Language Disorder 2004;24(2):118‐24. [Google Scholar]
Basso 1975 {published data only}
- Basso A, Faglioni P, Vignolo LA. Controlled study of language re‐education in aphasia: comparison between treated and untreated aphasics. Revue Neurologique 1975;131(9):607‐14. [PubMed] [Google Scholar]
Beukelman 1980 {published data only}
- Beukelman DR, Yorkston KM, Waugh PF. Communication in severe aphasia: effectiveness of three instruction modalities. Archives of Physical Medicine and Rehabilitation 1980;61(6):248‐52. [PubMed] [Google Scholar]
Bloom 1962 {published data only}
- Bloom LM. A rationale for group treatment of aphasic patients. Journal of Speech and Hearing Disorders 1962;27:11‐16. [DOI] [PubMed] [Google Scholar]
Breitenfeld 2005 {published data only}
- Breitenfeld T, Jergovi K, Vargek Solter V, Demarin V. Music therapy in aphatic stroke patients ‐ a pilot study. European Journal of Neurology 2005;12(Suppl 2):55 (P1060). [Google Scholar]
Caute 2013 {published data only}
- Caute A, Pring T, Cocks N, Cruice M, Best W, Marshall J. Enhancing communication through gesture and naming therapy. Journal of Speech, Language, and Hearing Research 2013;51(6):337‐51. [DOI] [PubMed] [Google Scholar]
Cherney 2007 {published and unpublished data}
- Cherney LR, Small SL. Intensive language therapy for nonfluent aphasia with and without surgical implantation of an investigational cortical stimulation device: preliminary language and imaging results.. Proceedings of the Clinical Aphasiology Conference 2007. May 22‐26 2007; Scottsdale. Arizona, USA. Pittsburgh, USA: University of Pittsburgh, 2007.
Cherney 2010 {published data only}
- Cherney LR, Erickson RK, Small SL. Epidural cortical stimulation as adjunctive treatment for non‐fluent aphasia: preliminary findings. Journal of Neurology, Neurosurgery and Psychiatry 2010;81(9):1014‐21. [DOI] [PubMed] [Google Scholar]
- NCT00170703. Assessment of cortical stimulation combined with rehabilitation to enhance recovery in Broca's aphasia. http://clinicaltrials.gov/show/NCT00170703 (accessed 26 November 2014).
Cherney 2011 {published data only}
- Cherney LR, Halper AS, Kaye RC. Computer‐based script training for aphasia: emerging themes from post‐treatment interviews. Journal of Communication Disorders 2011;44(4):493‐501. [DOI] [PubMed] [Google Scholar]
Cherney 2014 {published data only}
- Cherney LR, Kaye RC, Vuuren S. Acquisition and maintenance of scripts in aphasia: a comparison of two cuing conditions. American Journal of Speech and Language Pathology 2014;23(2):S343‐60. [DOI] [PMC free article] [PubMed] [Google Scholar]
- NCT01597037. Aphasia rehabilitation: modulating cues, feedback and practice. http://clinicaltrials.gov/show/NCT01597037 (accessed 22 September 2015).
Cohen 1992 {published data only}
- Cohen NS. The effect of singing instruction on the speech production of neurologically impaired persons. Journal of Music Therapy 1992;XXIX(2):87‐102. [Google Scholar]
Cohen 1993 {published data only}
- Cohen NS, Masse R. The application of singing and rhythmic instruction as a therapeutic intervention for persons with neurogenic communication disorders. Journal of Music Therapy 1993;XXX(2):81‐99. [Google Scholar]
Cupit 2010 {published data only}
- Cupit J, Rochon E, Leonard C, Laird L. Social validation as a measure of improvement after aphasia treatment: Its usefulness and influencing factors. Aphasiology 2010;24(11):1486‐500. [Google Scholar]
Ding 1995 {published data only}
- Ding H, Lin L, Wu G, Liu Y, Xiao H. Computer‐aided speech therapy system. Zhongguo Shengwu Gongcheng Xuebao [Chinese Journal of Biomedical Engineering] 1995;14(1):39‐44. Chinese. [Google Scholar]
Dubner 1972 {published data only}
- Dubner H. The role of the speech pathologist in the early treatment of the aphasic patient. Rehabilitation Literature 1972;33(11):330‐1 passim. [PubMed] [Google Scholar]
Gu 2002 {published data only}
- Gu Y, Li SL. The effect of 3‐month rehabilitation therapy for the speech function of aphasiacs. Zhongguo Linchuang Kangfu [Chinese Journal of Clinical Rehabilitation] 2002;6(7):956‐7. Chinese. [Google Scholar]
Gu 2003 {published data only}
- Gu Y, Wang S, Li S. The method and therapy effect of the early speech therapy on aphasia. Zhongguo Linchuang Kangfu [Chinese Journal of Clinical Rehabilitation] 2003;7(3):382‐3, Chinese. [Google Scholar]
Hagen 1973 {published data only}
- Hagen C. Communication abilities in hemiplegia: effect of speech therapy. Archives of Physical Medicine and Rehabilitation 1973;54(10):454‐63. [PubMed] [Google Scholar]
Harnish 2014 {published data only}
- Harnish SM, Morgan J, Lundine JP, Bauer A, Singletary F, Benjamin ML, et al. Dosing of a cued picture‐naming treatment for anomia. American Journal of Speech and Language Pathology 2014;23(2):S285‐99. [DOI] [PubMed] [Google Scholar]
Hartman 1987 {published data only}
- Albert ML, Helm‐Estabrooks N. Aphasia therapy works. Archives of Neurology 1988;42:372‐3. [DOI] [PubMed] [Google Scholar]
- Hartman J, Landau W. Comparison of formal language therapy with supportive counselling for aphasia due to acute vascular accident. Archives of Neurology 1987;44(6):646‐9. [DOI] [PubMed] [Google Scholar]
- Landau WM, Hartman JS. In reply to Wertz and Albert. Archives of Neurology 1988; Vol. 45:373.
- Wertz RT. Comparison of treatment with counselling is not a test of treatment for aphasia. Archives of Neurology 1988; Vol. 45:371‐2. [DOI] [PubMed]
Hinckley 2005 {published and unpublished data}
- Hinckley J, Carr T. Comparing the outcomes of intensive and non‐intensive context‐based aphasia treatment. Aphasiology 2005;19(10):965‐74. [Google Scholar]
Holmqvist 1998 {published data only (unpublished sought but not used)}
- Thorsén A‐M, Widén Holmqvist L, Pedro‐Cuesta J, Koch L. A randomised controlled trial of early supported discharge and continued rehabilitation at home after stroke. Stroke 2005;36(2):297‐302. [DOI] [PubMed] [Google Scholar]
- Widén Holmqvist L, Koch L, Kostulas V, Holm M, Widsell G, Tegler H, et al. A randomised controlled trial of rehabilitation at home after stroke in southwest Stockholm. Stroke 1998;29(3):591‐7. [DOI] [PubMed] [Google Scholar]
IHCOP 2014 {unpublished data only}
- Woolf C. The effects of phoneme discrimination and semantic therapies for speech perception deficits in aphasia. National Research Register.
- Woolf C, Panton A, Rosen S, Best W, Marshall J. Therapy for auditory processing impairment in aphasia: An evaluation of two approaches. Aphasiology 2014;28(12):1481‐505. [Google Scholar]
Ji 2011 {published data only}
- Ji X, Li HB. Simple motor aphasia caused by cerebral infarction treated with blood‐pricking at Yamen (GV 15) combined with language training. Zhongguo Zhen Jiu [Chinese Acupuncture & Moxibustion] 2011;31(11):979‐82. Chinese. [PubMed] [Google Scholar]
Jungblut 2004 {published and unpublished data}
- Jungblut M, Aldridge D. Effects of a specific music therapy approach in the treatment of patients suffering from chronic nonfluent aphasia. Neurologie und Rehabilitation 2004;10(2):69‐78. [Google Scholar]
Kagan 2001 {published and unpublished data}
- Kagan A, Black SE, Duchan JF, Simmons‐Mackie N, Square P. Training volunteers as conversation partners using 'supported conversation for adults with aphasia' (SCA): a controlled trial. Journal of Speech, Language and Hearing Research 2001;44(3):624‐38. [DOI] [PubMed] [Google Scholar]
Kalra 1993 {published data only}
- Kalra L, Dale P, Crome P. Improving stroke rehabilitation: a controlled study. Stroke 1993;24(10):1462‐7. [DOI] [PubMed] [Google Scholar]
Kendall 2015 {published data only}
- Kendall DL, Oelke M, Brookshire CE, Nadeau SE. The influence of phonomotor treatment on word retrieval abilities in 26 individuals with chronic aphasia: an open trial. Journal of Speech Language and Hearing Research 2015;58(3):798‐812. [DOI] [PubMed] [Google Scholar]
Kinsey 1986 {published data only (unpublished sought but not used)}
- Kinsey C. Microcomputer speech therapy for dysphasic adults: a comparison with two conventionally administered tasks. British Journal of Disorders of Communication 1986;21(1):125‐33. [DOI] [PubMed] [Google Scholar]
Kurt 2008 {published and unpublished data}
- Kurt T, Kizilisik O, Satici SB, Akhan G. The efficacy of the short‐term language therapy in aphasic patients without comprehension deficit during the subacute stage of stroke. European Journal of Neurology 2008;15(Suppl 3):374 (P2694). [Google Scholar]
Lara 2009 {published data only}
- Lara JP, Barbancho MA, Berthier ML, Green C, Navas P, wid‐Milner MS, et al. ERPs correlates of recovery from chronic post‐stroke aphasia in patients treated with memantine and constraint‐induced aphasia therapy. European Journal of Neurology 2009;16(S3):457. [Google Scholar]
Lara 2011 {published data only}
- Lara JP, Barbancho MA, Berthier ML, Green C, Navas P, Wid‐Milner MS, et al. ERP evidence of therapy‐related reorganization of language of patients with post stroke chronic aphasia. Clinical Neurophysiology 2011;122:S172. [Google Scholar]
Li 2005 {published data only}
- Li QW, Chen ZM, Huang SS, Li LJ, Tang GH, Luo DM, et al. Outcome evaluation of language disorder diagnosis apparatus ZM2.1 in treatment of Broca's aphasia. Zhongguo Linchuang Kangfu [Chinese Journal of Clinical Rehabilitation] 2005;9(25):14‐6. Chinese. [Google Scholar]
Lincoln 1986 {published data only}
- Lincoln, NB, McGuirk E. Prediction of language recovery in aphasic stroke patients using the Porch Index of Communicative Ability. British Journal of Disorders of Communication 1986;21(1):83‐8. [DOI] [PubMed] [Google Scholar]
Liu 2006b {published data only (unpublished sought but not used)}
- Liu X, Dai R, Cheng L. Correlation between the design of aphasia rehabilitative program and the diseased sites of cerebrum. Zhongguo Linchuang Kangfu [Chinese Journal of Clinical Rehabilitation] 2006;10(14):7‐9. Chinese. [Google Scholar]
Loeher 2007 {published data only}
- Loeher KE. Spaced Versus Massed Practice in Aphasia Therapy [PhD Thesis]. Detroit: Wayne State University, 2007. [Google Scholar]
Luo 2008 {published data only}
- Luo W, Tan J, Huang H. Clinical observation on treatment of cerebral infarction‐induced Broca aphasia by tiaoshen fuyin acupuncture therapy combined with language training. Zhongguo Zhen Jiu [Chinese Acupuncture and Moxibustion] 2008;28(3):171‐5. [PubMed] [Google Scholar]
Maher 2008 {unpublished data only}
- NCT00223847. An investigation of constraint induced language therapy for aphasia. https://clinicaltrials.gov/ct2/show/NCT00223847 (accessed 26 November 2014).
- Wu S. An investigation of constraint induced language therapy for treatment of aphasia. www.rorc.research.va.gov/Project_Template.cfm?Project_ID=2141693285 (accessed 25 March 2012).
Marcotte 2013 {published data only}
- Marcotte K, Perlbarg V, Marrelec G, Benali H, Ansaldo AI. Default‐mode network functional connectivity in aphasia: therapy‐induced neuroplasticity. Brain and Language 2013;124(1):45‐55. [DOI] [PubMed] [Google Scholar]
Marshall 2001 {published data only}
- Marshall RC, Freed DB, Karow CM. Learning of subordinate category names by aphasic subjects: a comparison of deep and surface‐level training methods. Aphasiology 2001;15(6):585‐98. [Google Scholar]
Mattioli 2010 {published data only}
- Mattioli F, Magoni M, Ambrosi C, Gasparotti R. fMRI correlates of early aphasia rehabilitation after stroke: preliminary results. Journal of Neurology 2010;257:S19. [Google Scholar]
McCall 2007 {published data only}
- McCall D, Linebarger MC, Berndt RS. Predicting effects of computer‐based intervention on structure and content of aphasic patients' spoken language. Brain and Language 2007;103(1‐2):207‐8. [Google Scholar]
Meinzer 2005 {published and unpublished data}
- Meinzer M, Djundja D, Barthel G, Elbert T, Rockstroh B. Long‐term stability of improved language functions in chronic aphasia after constraint‐induced aphasia therapy. Stroke 2005;36(7):1462‐6. [DOI] [PubMed] [Google Scholar]
Pistarini 1989 {published data only}
- Pistarini C, Guarnaschelli C, Bazzini A, Zonca G. Evaluation of efficacy of a logopedic rehabilitation method. Riabilitazione 1989;22(1):47‐55. [Google Scholar]
Popovici 1992 {published data only}
- Popovici M, Mihailescu L. Melodic intonation in the rehabilitation of Romanian aphasics with bucco‐lingual apraxia. Romanian Journal of Neurology and Psychiatry 1992;30(2):99‐113. [PubMed] [Google Scholar]
Qiu 2003 {published data only}
- Qiu HY, Gao C, Liu YC. Treatment of basal segmental aphasia by acupuncture and programmed musical electro‐acupuncture apparatus. New Journal of Traditional Chinese Medicine 2003;35(12):48‐9. Chinese. [Google Scholar]
Quinteros 1984 {published data only}
- Quinteros B, Williams DRR, White CAM, Pickering M. The costs of using trained and supervised volunteers as part of a speech therapy service for dysphasic patients. British Journal of Disorders of Communication 1984;19:205‐12. [PubMed] [Google Scholar]
Rasmussen 2013 {published data only}
- Rasmussen RS, Overgaard K, Ostergaard A, Kjaer P, Skerris A, Skou C, et al. Post‐stroke rehabilitation at home reduced disability and improved quality of life: a randomized controlled trial. Cerebrovascular Diseases 2013;35(January):94‐5. [Google Scholar]
Raymer 2008 {unpublished data only}
- NCT00764400. Treatment for word retrieval impairments in aphasia. https://clinicaltrials.gov/ct2/show/NCT00764400 (accessed 26 November 2014).
- Raymer AM, McHose B, Smith KG, Iman L, Ambrose A, Casselton C. Contrasting effects of errorless naming treatment and gestural facilitation for word retrieval in aphasia. Neuropsychological Rehabilitation 2011;22(2):235‐66. [DOI] [PMC free article] [PubMed] [Google Scholar]
Reinvang 1976 {published data only}
- Reinvang IR, Hjeltnes N, Guvaag SP. Aphasia treatment in stroke patients. Results achieved in 18 patients 3‐6 months after accident. Tidsskr Nor Laegeforen 1976;96(27):1421‐3. [PubMed] [Google Scholar]
Rudd 1997 {published data only}
- Rudd AG, Wolfe CDA, Tilling K, Beech R. Randomised controlled trial to evaluate early discharge scheme for patients with stroke. BMJ 1997;315(October):1039‐44. [DOI] [PMC free article] [PubMed] [Google Scholar]
Stoicheff 1960 {published data only}
- Stoicheff M. Motivating instructions and language performance of dysphasic subjects. Journal of Speech and Hearing Research 1960;3(1):75‐85. [DOI] [PubMed] [Google Scholar]
Thompson 2010 {published data only}
- Thompson CK, Choy JJ, Holland A, Cole R. Sentactics®: Computer‐automated treatment of underlying forms. Aphasiology 2010;24(10):1242‐66. [DOI] [PMC free article] [PubMed] [Google Scholar]
Tseng 2014 {published data only}
- Tseng CE, Lin CP, Tsai PC, Yip BS, Lin CM, Yang FP. Melodic intonation therapy in stroke patients with aphasia: A DTI study. Cerebrovascular Diseases 2014;38(September):40. [Google Scholar]
Van Lancker 1997 {published data only (unpublished sought but not used)}
- Lancker D, Hall E, Goldojarb M. An interactive video system to test and treat nonliteral language disorders. Rehabilitation R&D Progress Reports 1997;34(May):255‐6. [Google Scholar]
Vauth 2008 {published data only}
- Vauth F, Hampel P, Scibor M, Handschu R, Richter J, Keidel M. Synchronic telepractise: a new (additional) form of aphasia therapy. Forum Logopadie 2008;224(4):12‐9. [Google Scholar]
Vines 2007 {published data only}
- Vines BW, Norton AC, Schlaug G. Applying transcranial direct current stimulation in combination with melodic intonation therapy facilitates language recovery for Broca's aphasic patients. [Abstract P150]. Stroke 2007;38(2):519. [Google Scholar]
Wang 2004 {published data only}
- Wang D, Lu Y, Xie R, Yao J. Effect of different intensities of rehabilitation therapy on the prognosis of patients with stroke. Chinese Journal of Clinical Rehabilitation 2004;8(22):4410‐1. [Google Scholar]
Weiduschat 2011 {published data only}
- Weiduschat N, Thiel A, Rubi‐Fessen I, Hartmann A, Kessler J, Merl P, et al. Effects of repetitive transcranial magnetic stimulation in aphasic stroke: a randomized controlled pilot study. Stroke 2011;42(2):409‐15. [DOI] [PubMed] [Google Scholar]
Wenke 2014 {published data only}
- Wenke R, Lawrie M, Hobson T, Comben W, Romano M, Ward E, et al. Feasibility and cost analysis of implementing high intensity aphasia clinics within a sub‐acute setting. International Journal of Speech‐Language Pathology 2014;16(3):250‐9. [DOI] [PubMed] [Google Scholar]
West 1973 {published data only}
- West JA. Auditory comprehension in aphasic adults: improvement through training. Archives of Physical Medicine and Rehabilitation 1973;54(2):78‐86. [PubMed] [Google Scholar]
Wolfe 2000 {published data only}
- Wolfe CDA, Tilling K, Rudd AG. The effectiveness of community‐based rehabilitation for stroke patients who remain at home: a pilot randomized trial. Clinical Rehabilitation 2000;14(6):563‐9. [DOI] [PubMed] [Google Scholar]
Wood‐Dauphinee 1984 {published data only}
- Wood‐Dauphinee S, Shapiro S, Bass E, Fletcher C, Georges P, Hensby V, et al. A randomized trial of team care following stroke. Stroke 1984;15(5):864‐72. [DOI] [PubMed] [Google Scholar]
Xu 2005 {published data only}
- Xu Y, Li Q, Hao Y. Observation on the efficacy of acupuncture plus rehabilitation composite treatment for apoplectic aphasia. Shanghai Zhenjiu Zazhi [Shanghai Journal of Acupuncture and Moxibustion] 2005;24(8):30‐1. Chinese. [Google Scholar]
Zhang 2004 {published data only}
- Zhang T, Li LL, Bi S, Mei YW, Xie RM, Luo ZM, et al. Effects of three‐stage rehabilitation treatment on acute cerebrovascular diseases: a prospective randomized controlled multicenter study. Zhonghua Yixue Zazhi [Chinese Medical Journal] 2004;84(23):1948‐54. [PubMed] [Google Scholar]
References to studies awaiting assessment
E‐VIC 1990 {published data only (unpublished sought but not used)}
- Goodenough‐Tregapnier C. Functional communication using VIC. Annual International Conference of the IEEE Engineering in Medicine and Biology Society 1990;12(3):1313‐4. [Google Scholar]
- Goodenough‐Trepagnier C. Early intervention with globally aphasic stroke patients using a computerized visual communication technique. [Abstract 461]. Journal of Rehabilitation Research and Development 1990;28(Pt 1):369‐70. [Google Scholar]
- Goodenough‐Trepagnier C. Evaluation of the functional communicative benefit of VIC for persons with chronic global aphasia. Rehabilitation R&D Progress Reports 1990;28(1):368‐9. [Google Scholar]
- Goodenough‐Trepagnier C. VIC Performance‐effect of grammatical category. Proceedings of the 12th RESNA Annual Conference: Technology for the Next Decade, June 25‐30, 1989. New Orleans, Louisiana, 1989:143‐4.
Gans 1977 {published data only}
- Gans K, Derk Weidner WE. Melodic intonation therapy and confrontation naming in adult aphasics. Ohio Journal of Speech and Hearing 1977;13(1):30‐40. [Google Scholar]
Gonzalez 2012 {published data only}
- Gonzalez I, Petit H, Muller F, Daviet JC, Trias J, De, Boissezon X, et al. The workbook of communication C.COM in disclosure alterations of severe vascular aphasia [Le cahier de communication C.COM dans les alterations de la communication de l'aphasie vasculaire severe]. Annals of Physical and Rehabilitation Medicine 2012;55(Suppl 1):e213‐6. [Google Scholar]
Gonzalez‐Rothi 2004 {published data only}
- Gonzalez‐Rothi LJ, Wu S. An investigation of constraint induced language therapy for treatment of aphasia. http://www.vard.org/rorc/currently_funded_research.html (accessed 26 November 2014).
Howard 1985 {published and unpublished data}
- Howard D, Patterson K, Franklin S, Orchard‐Lisle V, Morton J. Treatment of word retrieval deficits in aphasia. A comparison of two therapy methods. Brain 1985;108((Pt 4)):817‐29. [PubMed] [Google Scholar]
HTA 2015 (author not known) {published data only}
- DAHTA DIMDI. Need and evidence in logopedics and computer‐based speech therapy in 50‐year‐old stroke patients in Germany (Project record). Health Technology Assessment Database 2015, issue 3.
Stachowiak 1994 {published and unpublished data}
- Stachowiak FJ. Computer‐based aphasia therapy with the Lingware/STACH System. In: Stachowiak FJ, Bleser R, Deloche G, Kaschel R, Kremin H, North P, et al. editor(s). Developments in the Assessment and Rehabilitation of Brain‐Damaged Patients ‐ Perspectives from a European Concerted Action. Tübingen: Gunter Narr Verlag Tűbingen, 1993:353‐80. [Google Scholar]
- Stachowiak FJ. Computers in aphasia rehabilitation. In: Christensen A‐L, Uzzell BP editor(s). Brain Injury and Neuropsychological Rehabilitation: International Perspectives. 1st Edition. Hillsdale New Jersey: Lawrence Erlbaum Associates, 1994:133‐160. [Google Scholar]
- Stachowiak FJ. Micro‐computers in the assessment and rehabilitation of brain‐damaged patients. Technology and Health Care 1993;1(1):19‐43. [DOI] [PubMed] [Google Scholar]
Zhang 2015 {published data only}
- Zhang Y, Yao Y, Lu X. Therapeutic effect of music therapy and speech language therapy on post‐stroke patients with non‐fluent aphasia. Chinese Medical Association 2015;4:274‐8. [Google Scholar]
References to ongoing studies
ASK {published data only}
- ACTRN12614000979651. In stroke patients with aphasia and their caregivers does the Aphasia ASK Action Success Knowledge (ASK) program, compared to an attention control package, promote better mood and overall quality of life outcomes. http://www.anzctr.org.au/ACTRN12614000979651.aspx (accessed 22 September 2015). [ACTRN12614000979651]
Big CACTUS {published data only}
- ISRCTN68798818. Cost effectiveness of aphasia computer treatment versus usual stimulation or attention control long term post stroke. http://isrctn.org/ISRCTN68798818 (accessed 22 September 2015). [ISRCTN68798818]
- Palmer R. Clinical and cost effectiveness of aphasia computer therapy compared with usual stimulation or attention control long term post stroke (CACTUS) (Project record). Health Technology Assessment Database 2014;4:1‐34. [Google Scholar]
- Palmer R, Cooper C, Enderby P, Brady M, Julious S, Bowen A, et al. Clinical and cost effectiveness of computer treatment for aphasia post stroke (Big CACTUS): study protocol for a randomised controlled trial. Trials 2015;16(1):18. [DOI] [PMC free article] [PubMed] [Google Scholar]
CATChES {published data only}
- NCT01928602. Does inner speech improve access to overt speech in aphasia following stroke? An fMRI study utilising computerised rehabilitation software. http://clinicaltrials.gov/show/NCT01928602 (accessed 22 September 2015).
COMPARE {published and unpublished data}
- Rose M, Attard M, Mok Z, Lanyon L, Foster A. Multi‐modality aphasia therapy is as efficacious as a constraint‐induced aphasia therapy for chronic aphasia: a phase 1 study. Aphasiology 2013;27(8):938‐71. [Google Scholar]
- Rose M, Attard MC, Mok Z, Katthagen S. Variability in treatment responsiveness to constraint and multi‐modal aphasia therapy calls for larger well‐powered trials in chronic aphasia. International Journal of Stroke 2014;9(Suppl 1):9. [Google Scholar]
- Rose M, Mok Z, Katthagen S. The comparative impact of multi‐modality and constraint induced aphasia therapy on discourse in aphasia. The 16th International Aphasia Rehabilitation Conference. 2014:8.
FCET2EC {published and unpublished data}
- Baumgaertner A, Grewe T, Ziegler W, Floel A, Springer L, Martus P, et al. FCET2EC (From controlled experimental trial to = 2 everyday communication): How effective is intensive integrative therapy for stroke‐induced chronic aphasia under routine clinical conditions? A study protocol for a randomized controlled trial. Trials 2013;14(1):308 doi:10.1186/1745‐6215‐14‐308. [DOI] [PMC free article] [PubMed] [Google Scholar]
- Breitenstein C, Baumgaertner A, Grewe T, Floel A, Ziegler W, Martus P, et al. From controlled experimental trial to=2 everyday communication (FCET2EC): how effective is intensive speech and language therapy in chronic aphasia?. Proceedings of the 16th International Aphasia Rehabilitation Conference 2014. The Hague, The Netherlands, 2014:20.
- NCT01540383. Effectiveness of intensive aphasia therapy under routine clinical conditions (FCET2EC). www.clinicaltrials.gov/ct2/show/NCT01540383 (accessed 22 September 2015). [NCT01540383]
IMITATE {published data only (unpublished sought but not used)}
- Lee J, Fowler R, Rodney D, Cherney L, Small SL. IMITATE: An intensive computer‐based treatment for aphasia based on action observation and imitation. Aphasiology 2010;24(4):449‐65. [DOI] [PMC free article] [PubMed] [Google Scholar]
- NCT00713050. Speech and language therapy after stroke. ClinicalTrials.gov NCT00713050 (accessed 22 September 2015).
- Schmah T, Strother SC, Zemel RS, Yourganov G, Schiel M, Buchholz B, et al. Complexity of functional connectivity in aphasia treatment. Stroke 2011;42(11):e619. [Google Scholar]
Kukkonen 2007 {published and unpublished data}
- Kukkonen T, Korpijaakko‐Huuhka AM. How much is enough and when is the right time? What do we know about the good practice and timing of aphasia rehabilitation?. Proceedings of the British Aphasiology Society Biennial International Conference Sept 10‐12 2007; Edinburgh. UK: British Aphasiology Society, 2007:67‐8.
- Kukkonen T, Molnár G, Korpijaakko‐Huuhka A‐M. How much is enough and when is the right time? Developing strategies for assessing aphasia rehabilitation. 27th World Congress of the International Association of Logopedics and Phoniatrics; 2007 Aug 5‐9; Copenhagen (Denmark).
Kurland ‐ NCT02012374 {published data only}
- NCT02012374. Overcoming learned non‐use in chronic aphasia: behavioral, fMRI and QoL outcomes. http://clinicaltrials.gov/show/NCT02012374 (accessed 22 September 2015). [NCT02012374]
LIFT 2014 {published and unpublished data}
- ACTRN12613001182785. Can a new intensive model of aphasia rehabilitation achieve better outcomes than usual care with chronic aphasia resulting from stroke?. https://www.anzctr.org.au/Trial/Registration/TrialReview.aspx?id=364926 (accessed 22 September 2015). [ACTRN12613001182785]
- Rodriguez AD, Worrall L, Brown K, Grohn B, McKinnon E, Pearson C, et al. Aphasia LIFT: Exploratory investigation of an intensive comprehensive therapy program. Aphasiology 2013;27(11):1339‐61. [Google Scholar]
- Wenke R, Lawrie M, Hobson T, Comben W, Romano M, Cardell E, et al. High Intensity Aphasia Clinics: embedding the evidence into Queensland Health Project Completion Report. Brisbane: Queensland Health, 2012. [Google Scholar]
MIT USA {unpublished data only}
- Schlaug G. Melodic Intonation Therapy (MIT). Stroke Trials Registry, Internet Stroke Center: www.strokecenter.org/trials/ (accessed 22 September 2015).
- Schlaug G. Singing to speaking: observations in healthy singers and patients with Broca's aphasia. American Association for the Advancement of Science Annual Meeting; 2010 Feb 18‐22; San Diego (CA). http://aaas.confex.com/aaas/2010/webprogram/Paper1481.html. (accessed 25 March 2012).
- Schlaug G, Marchina S, Norton A. From singing to speaking: why singing may lead to recovery of expressive language function in patients with Broca's aphasia. Music Perception 2008;25(4):315‐23. [DOI] [PMC free article] [PubMed] [Google Scholar]
- Schlaug G, Norton A. Behavioral and neural correlates of melodic intonation therapy versus speech repetition therapy in patients with non‐fluent aphasia [Abst. CT P37]. Proceedings of the International Stroke Conference 2009; 2009 Feb 18‐20; San Diego (CA). 2009.
- Schlaug G, Norton A, Marchina S, Zipse L, Wan CY. From singing to speaking: facilitating recovery from nonfluent aphasia. Future Neurology 2010;5(5):657‐65. [DOI] [PMC free article] [PubMed] [Google Scholar]
Nehra ‐ CTRI/2014/04/004554 {published data only}
- CTRI/2014/04/004554. To study the effectiveness of ‘Comprehensive Neuropsychological Rehabilitation’ as an adjunct to standard pharmacological treatment for improving language and quality of life in patients with post stroke aphasia: a randomized controlled clinical trial. www.ctri.nic.in/Clinicaltrials/pmaindet2.php?trialid=8024 (accessed 22 September 2015).
ORLA‐Write {published data only}
- NCT01790880. Enhancing written communication in persons with aphasia: a clinical trial. http://clinicaltrials.gov/show/NCT01790880 (accessed 22 September 2015).
Osborne 2012 {published data only}
- Osborne A, Nickels L. Constraint in aphasia therapy. Is it important for clinical outcomes?. International Journal of Stroke 2012;7(Suppl 1):53‐4. [Google Scholar]
PMvSFA {published data only}
- NCT02153710. Speech therapy for aphasia: comparing two treatments (PMvSFA). https://clinicaltrials.gov/show/NCT02153710 (accessed 22 September 2015).
RATS‐3 {unpublished data only}
- NTR3271. Rotterdam Aphasia Therapy Study‐3: The efficacy of early, intensive cognitive‐linguistic therapy in aphasia after stroke (a randomized controlled trial). ‐ RATS‐3. http://www.trialregister.nl/trialreg/admin/rctview.asp?TC=3271 (accessed 26 November 2014).
- Nouwens F. Rotterdam Aphasia Therapy Study‐3: The efficacy of early, intensive cognitive‐linguistic therapy in aphasia after stroke (a randomized controlled trial) (RATS‐3). http://apps.who.int/trialsearch/Trial2.aspx?TrialID=NTR3271 (accessed 22 September 2015).
TNT ‐ ACTRN12614000081617 {published data only}
- ACTRN12614000081617. Tablets and technology during stroke recovery. https://www.anzctr.org.au/Trial/Registration/TrialReview.aspx?id=365227&isClinicalTrial=False (accessed 22 September 2015).
U‐Health {published data only}
- NCT01815905. U‐Health service using mobile device for improvement of post‐stroke upper limb function and aphasia. http://clinicaltrials.gov/show/NCT01815905 (accessed 22 September 2015).
VERSE III {published data only}
- ACTRN12613000776707. A three armed, prospective multicentre randomised controlled speech therapy trial comparing usual care, usual care plus and Very Early Rehabilitation in Speech (VERSE) with blinded outcome assessment of the Aphasia Quotient score in patients with aphasia following acute stroke. Australian New Zealand Clinical Trials Registry (accessed 26 November 2014).
- Godecke E, Armstrong E, Bernhardt J, Middleton S, Rai T, Cadilhac D, et al. Multidisciplinary clinical rehabilitation very early rehabilitation in speech (verse): progress report on an Australian randomized controlled trial of aphasia therapy after stroke. International Journal of Stroke 2014;9:223. [Google Scholar]
- Godecke E, Armstrong E, Bernhardt J, Middleton S, Rai T, Holland A, et al. Very Early Rehabilitation in SpEech (VERSE): the development of an Australian randomised controlled trial of aphasia therapy after stroke. International Journal of Stroke 2013;8:44‐5. [Google Scholar]
Additional references
Altman 2001
- Altman DG, Schulz KF, Moher D, Egger M, Davidoff F, Elbourne D, et al. The revised CONSORT statement for reporting randomized trials: explanation and elaboration. Annals of Internal Medicine 2001;134(8):663‐94. [DOI] [PubMed] [Google Scholar]
Bastiaanse 1995
- Bastiaanse R, Bosje M, Visch‐Brink EG. Dutch adaptation of Kay J, Lesser R, Coltheart M. Psycholinguistic Assessment of Language Processing in Aphasia. Hove, UK: Lawrence Erlbaum Associates Ltd, 1995. [Google Scholar]
Benson 1996
- Benson DF, Ardila A. Aphasia: A Clinical Perspective. New York: Oxford University Press, 1996. [Google Scholar]
Best 2013
- Best W, Greenwood A, Grassly J, Herbert R, Hicklin J, Howard D. Aphasia rehabilitation: does generalisation from anomia therapy occur and is it predictable? A case series study. Cortex 2013;49(9):2345‐57. [DOI] [PubMed] [Google Scholar]
Bhogal 2003
- Bhogal SK, Teasell R, Speechley M. Intensity of aphasia therapy, impact on recovery. Stroke 2003;34(4):987‐93. [DOI] [PubMed] [Google Scholar]
Blomert 1994
- Blomert L, Kean ML, Koster C, Schokker J. Amsterdam‐Nijmegen Everyday Language Test: construction, reliability and validity. Aphasiology 1994;8(4):381‐407. [Google Scholar]
Borkowski 1967
- Borkowski JG, Benton AL, Spreen O. Word fluency and brain damage. Neuropsychologia 1967;5(2):135‐40. [Google Scholar]
Boyle 1995
- Boyle M, Coelho CA. Application of semantic feature analysis as a treatment for aphasic dysnomia. American Journal of Speech‐Language Pathology 1995;4(November):94‐8. [Google Scholar]
Bradburn 1969
- Bradburn NM. The Structure of Psychological Well‐being. Chicago IL: Aldine, 1969. [Google Scholar]
Brooks 1996
- Brooks R, the EuroQol Group. EuroQol; the current state of play. Health Policy 1996;37(1):53‐72. [DOI] [PubMed] [Google Scholar]
Brott 1989
- Brott T, Adams HP, Olinger C, Marler JR, Barsan WG, Biller J, et al. Measurements of acute cerebral infarction: a clinical examination scale. Stroke 1989;20(7):864–70. [DOI] [PubMed] [Google Scholar]
Caplan 1998
- Caplan D, Hanna JE. Sentence production by aphasic patients in a constrained task. Brain and Language 1998;63(2):184‐218. [DOI] [PubMed] [Google Scholar]
Castro‐Caldas 1979
- Castro‐Caldas A. Diagnostico e Evolucao das Afasias de Causa Vascular. Lisboa: Faculdade de Medicina de Lisboa, 1979. [Google Scholar]
Cherney 2008
- Cherney LR, Patterson JP, Raymer A, Frymark T, Schooling T. Evidence‐based systematic review: effects of intensity of treatment and constraint‐induced language therapy for individuals with stroke‐induced aphasia. Journal of Speech, Language and Hearing Research 2008;51(5):1282‐99. [DOI] [PubMed] [Google Scholar]
Code 2003
- Code C, Herrmann M. The relevance of emotional and psychological factors in aphasia to rehabilitation. Neuropsychological Rehabilitation 2003;13(1/2):109‐32. [DOI] [PubMed] [Google Scholar]
Crosson 2007
- Crosson B, Fabrizio KS, Singletary F, Cato MA, Wierenga CE, Parkinson RB, et al. Treatment of naming in nonfluent aphasia through manipulation of intention and attention: a phase 1 comparison of two novel treatments. Journal of the International Neuropsychological Society 2007;13(4):582‐94. [DOI] [PubMed] [Google Scholar]
Del Toro 2008
- Toro CM, Altmann LJ, Raymer AM, Leon S, Blonder LX, Gonzalez Rothi LJ. Changes in aphasic discourse after contrasting treatments for anomia. Aphasiology 2008;22(7‐8):881‐92. [Google Scholar]
DeRenzi 1962
- DeRenzi E, Vignolo LA. The Token Test: a sensitive test to detect receptive disturbances in aphasics. Brain 1962;85(December):665‐78. [DOI] [PubMed] [Google Scholar]
Druks 2000
- Druks J, Masterson J. An Object and Action Naming Battery. Hove: Psychology Press, 2000. [Google Scholar]
Duffy 2001
- Duffy J, Coelho C. Schuell's stimulation approach to rehabilitation. In: Chapey R editor(s). Language Interventions Strategies in Aphasia and Related Neurogenic Communication Disorders. Baltimore: Lippincott Williams & Wilkins, 2001:341–82. [Google Scholar]
Dunn 2007
- Dunn LM, Dunn DM. PPVT‐4 Manual. Bloomington, MN: NCS Pearson, Inc, 2007. [Google Scholar]
Ebrahim 1986
- Ebrahim S, Barer D, Nouri F. Use of the Nottingham Health Profile with patients after stroke. Journal of Epidemiology and Community Health 1986;40(2):166‐9. [DOI] [PMC free article] [PubMed] [Google Scholar]
Elsner 2012
- Elsner B, Kugler J, Pohl M, Mehrholz J. Transcranial direct current stimulation (tDCS) for improving aphasia in patients after stroke. Cochrane Database of Systematic Reviews 2012, Issue 4. [DOI: 10.1002/14651858.CD009760.pub3] [DOI] [PubMed] [Google Scholar]
Enderby 2007
- Enderby P. Therapy Outcomes Measures for Rehabilitation Professionals. Wiley, 2006. [Google Scholar]
Engelter 2006
- Engelter ST, Gostynski M, Papa A, Frei M, Born C, Ajdacic‐Gross V, et al. Epidemiology of aphasia attributable to first ischemic stroke: incidence, severity, fluency, etiology, and thrombolysis. Stroke 2006;37(6):1379‐84. [DOI] [PubMed] [Google Scholar]
Fink 1994
- Fink RB, Schwartz MF, Rochon E, Myers JL, Socolof GS, Bluestone R, et al. Picture description with structure modelling (PDSM): a procedure for measuring syntactic generalisation. Poster presented at Academy of Aphasia, Boston 1994.
Goldberg 1972
- Goldberg D. The detection of psychiatric illness by questionnaire. Mandsley Monograph No 21. London: Oxford University Press, 1972. [Google Scholar]
Goodglass 1972
- Goodglass H, Kaplan E. Boston Diagnostic Aphasia Examination. Philadelphia: Lea and Febiger, 1972. [Google Scholar]
Goodglass 1983
- Goodglass H, Kaplan E. The Assessment of Aphasia and Related Disorders. Philadelphia, PA: Lea and Febiger, 1983. [Google Scholar]
Greener 2001
- Greener J, Enderby P, Whurr R. Pharmacological treatment for aphasia following stroke. Cochrane Database of Systematic Reviews 2001, Issue 4. [DOI: 10.1002/14651858.CD000424] [DOI] [PMC free article] [PubMed] [Google Scholar]
Higgins 2011
- Higgins JPT, Green S (editors). Cochrane Handbook for Systematic Reviews of Interventions Version 5.1.0 [updated March 2011]. The Cochrane Collaboration, 2011. Available from www.cochrane‐handbook.org.
Hilari 2003
- Hilari K, Byng S, Lamping DL, Smith SC. Stroke and Aphasia Quality of Life Scale‐39 (SAQOL‐39) ‐ evaluation of acceptability, reliability, and validity. Stroke 2003;34(8):1944‐50. [DOI] [PubMed] [Google Scholar]
Hoffmann 2014
- Hoffmann TC, Glasziou PP, Boutron I, Milne R, Perera R, Moher D, et al. Better reporting of interventions: template for intervention description and replication (TIDieR) checklist and guide. BMJ 2014;348(g1687):1‐12. [DOI] [PubMed] [Google Scholar]
Holland 1980
- Holland A. Communicative Abilities in Daily Living. Baltimore: University Park Press, 1980. [Google Scholar]
Holland 1998
- Holland A, Frattali C, Fromm D. Communication Activities of Daily Living. 2nd Edition. Austin Texas: Pro‐Ed, 1998. [Google Scholar]
Huber 1983
- Huber W, Poeck K, Weniger D, Willmes K. Der Aachener Aphasia Test. 1983.
Huber 1984
- Huber E, Poeck K, Wilmes K. The Aachen Aphasia Test. In: Rose FC editor(s). Progress in Aphasiology. New York: Ravens Press, 1984:291‐303. [PubMed] [Google Scholar]
Kaplan 1983
- Kaplan E, Goodglass H, Weintraub S. Boston Naming Test. Philadelphia, PA: Lea and Febiger, 1983. [Google Scholar]
Kay 1992
- Kay J, Lesser R, Coltheart M. Psycholinguistic Assessments of Language Processing in Aphasia. Hove: Psychology Press, 1992. [Google Scholar]
Kertesz 1982
- Kertesz A. Western Aphasia Battery. New York: Grune and Stratton, 1982. [Google Scholar]
LaPointe 1979
- LaPointe LL, Horner J. Reading Comprehension Battery for Aphasia. USA, 1979. Tigard OR: CC Publications.
Laska 2001
- Laska AC, Hellblom A, Murray V, Kahan T, Arbin M. Aphasia in acute stroke and relation to outcome. Journal of Internal Medicine 2001;249(5):413‐22. [DOI] [PubMed] [Google Scholar]
Lauterbach 2008
- Lauterbach M, Martins IP, Garcia P, Cabeça J, Ferreira AC, Willmes K. Cross linguistic aphasia testing: the Portuguese version of the Aachen Aphasia Test (AAT). Journal of the International Neuropsychological Society 2008;14(6):1046–56. [DOI] [PubMed] [Google Scholar]
Lincoln 1982
- Lincoln NB, Pickersgill MJ, Hankey AI, Hilton CR. An evaluation of operant training and speech therapy in the language rehabilitation of moderate aphasics. Behavioural Psychotherapy 1982;10(2):162‐78. [Google Scholar]
Lomas 1989
- Lomas J, Pickard L, Bester S, Elbard H, Finlayson A, Zoghaib C. The Communicative Effectiveness Index: development and psychometric evaluation of a functional communication measure for adults. Journal of Speech and Hearing Disorders 1989;54(1):113‐24. [DOI] [PubMed] [Google Scholar]
Long 2008
- Long AF, Hesketh A, Paszek G, Booth M, Bowen A, the ACT NoW Research Study. Development of a reliable, self‐report outcome measure for pragmatic trials of communication therapy following stroke: the Communication Outcome After STroke (COAST) scale. Clinical Rehabilitation 2008;22(12):1083‐94. [DOI] [PubMed] [Google Scholar]
Long 2009
- Long A, Hesketh A, Bowen A, the ACT NoW Research Study. Communication outcome after stroke: a new measure of the carer's perspective. Clinical Rehabilitation 2009;23(9):846–56. [DOI] [PubMed] [Google Scholar]
Maher 2006
- Maher L, Kendall D, Swearengin J, Rodriguez A, Leon S, Pingel K, et al. A pilot study of use‐dependent learning in the context of constraint induced language. Journal of the International Neuropsychological Society 2006;12(6):843‐52. [DOI] [PubMed] [Google Scholar]
Meinzer 2005b
- Meinzer M, Djunda D, Barthel G, Elbert T, Rockstroh B. Long‐term stability of improved language functions in chronic aphasia after constraint induced aphasia therapy. Stroke 2005;36(7):1462‐6. [DOI] [PubMed] [Google Scholar]
Moher 2001
- Moher D, Schulz KF, Altman DG. The CONSORT statement: revised recommendations for improving the quality of reports of parallel‐group randomised trials. Lancet 2001;357(9263):1191‐4. [PubMed] [Google Scholar]
Moss 2006
- Moss A, Nicholas M. Language rehabilitation in chronic aphasia and time post onset: a review of single‐subject data. Stroke 2006;37(12):3043‐51. [DOI] [PubMed] [Google Scholar]
Nettleton 1991
- Nettleton J, Lesser R. Therapy for naming difficulties in aphasia: application of a cognitive neuropsychological model. Journal of Neurolinguistics 1991;6(2):139‐57. [Google Scholar]
Nicholas 1993
- Nicholas LE, Brookshire RH. A system for quantifying the informativeness and efficiency of the connected speech of adults with aphasia. Journal of Speech, Language, and Hearing Research 1993;36(2):338‐50. [DOI] [PubMed] [Google Scholar]
Nicholas 1995
- Nicholas L, Brookshire RH. Presence, completeness and accuracy of main concepts in the connected speech of non‐brain injured adults. Journal of Speech and Hearing Research 1995;38(1):145‐56. [DOI] [PubMed] [Google Scholar]
Oldfield 1965
- Oldfield RC, Wingfield A. A series of pictures for use in object naming. Psycholinguistics research unit, Special report No. PLU/65/19, Oxford 1965.
Oldfield 1971
- Oldfield RC. The assessment and analysis of handedness: the Edinburgh inventory. Neuropsychologica 1971;9(1):97‐113. [DOI] [PubMed] [Google Scholar]
Parr 1997
- Parr S, Byng S, Gilpin S, Ireland C. Talking about Aphasia: Living with Loss of Language after Stroke. Buckingham: OUP, 1997. [Google Scholar]
Porch 1967
- Porch B. Porch Index of Communicative Ability. Austin, TX: Pro‐Ed, 1967. [Google Scholar]
Porch 1971
- Porch BE. Porch Index of Communicative Ability. 2nd Edition. Palo Alto, CA: Consulting Psychologists' Press, 1971. [Google Scholar]
Porch 1981
- Porch BE. Porch Index of Communicative Ability. 3rd Edition. Palo Alto, CA: Consulting Psychologists Press, 1981. [Google Scholar]
Prins 1980
- Prins RS. Psycholinguistic aspects of aphasia diagnosis and therapy [Psycho Linguistische aspekten van afasie diagnostiek en therapie]. Gerontologie 1980;11(1):22‐8. [PubMed] [Google Scholar]
Raven 1976
- Raven JC. Coloured Progressive Matrices. London, UK: H.K. Lewis, 1976. [Google Scholar]
Raymer 1993
- Raymer AM, Thompson C, Jacobs B, LeGrand H. A model‐driven analysis of generalisation effects for naming treatment in aphasia. Aphasiology 1993;7(1):27‐53. [Google Scholar]
Reinvang 1985
- Reinvang I. Aphasia and Brain Organisation. Aphasia and Brain Organisation. New York: Plenum Press, 1985. [Google Scholar]
RevMan 2014 [Computer program]
- The Nordic Cochrane Centre, The Cochrane Collaboration. Review Manager (RevMan). Version 5.3. Copenhagen: The Nordic Cochrane Centre, The Cochrane Collaboration, 2014.
Robey 1994
- Robey R. The efficacy of treatment for aphasic persons: a meta‐analysis. Brain and Language 1994;47(4):582‐608. [DOI] [PubMed] [Google Scholar]
Robey 1998a
- Robey R. A meta‐analysis of clinical outcomes in the treatment of aphasia. Journal of Speech, Language and Hearing Research 1998;41(1):172‐87. [DOI] [PubMed] [Google Scholar]
Rodrigues 2006
- Rodrigues I, Santos M, Leal G. [Validação de uma escala de depressão para afásicos: Stroke Aphasic Depression Questionnaire—SAD‐Q]. Sinapse 2006;2(6):506‐13. [Google Scholar]
Saffran 1988
- Saffran EM, Schwartz MF, Linebarger M, Martin N, Bochetto P. The Philadelphia Comprehension Battery for aphasia. Unpublished manuscript 1988.
Salonen 1980
- Salonen L. The language enriched individual therapy programme for aphasic patients. In: Sarno M, Höök O editor(s). Aphasia, Assessment and Treatment. Stockholm: Almqvist and Wiksell, 1980. [Google Scholar]
Sarno 1969
- Sarno MT. The Functional Communication Profile: Manual of Directions. Vol. 42, New York Institution of Rehabilitation Medicine, 1969. [Google Scholar]
Schegloff 2004
- Schegloff EA. Putting the interaction back into dialogue. Open peer commentary. Behavioral and Brain Sciences 2004;27(2):207‐8. [DOI] [PubMed] [Google Scholar]
Schegloff 2007
- Schegloff EA. Sequence Organization in Interaction. A Primer in Conversation Analysis I. Cambridge, England: University Press, 2007. [Google Scholar]
Schuell 1965
- Schuell H. Minnesota Test for Differential Diagnosis of Aphasia. Minneapolis, MN: University of Minnesota Press, 1965. [Google Scholar]
Schwartz 1994
- Schwartz MF, Saffran EM, Fink RB, Myers JL, Martin N. Mapping therapy: a treatment programme for agrammatism. Aphasiology 1994;8(1):19‐54. [Google Scholar]
Shewan 1979
- Shewan CM. The Auditory Comprehension Test for Sentences (ACTS). Chicago II: Biolinguistics, 1979. [Google Scholar]
Shewan 1984
- Shewan CM, Kertesz A. Effects of speech and language treatment on recovery from aphasia. Brain and Language 1984;23(2):272‐99. [DOI] [PubMed] [Google Scholar]
Snodgrass 1980
- Snodgrass JG, Vanderwart M. A standardized set of 260 pictures: norms for name agreement, image agreement, familiarity, and visual complexity. Journal of Experimental Psychology: Human Learning and Memory 1980;6(2):174. [DOI] [PubMed] [Google Scholar]
Soares 2004
- Soares HP, Daniels S, Kumar A, Clarke M, Scott C, Swann S, et al. Bad reporting does not mean bad methods for randomised trials: observational study of randomised controlled trials performed by the Radiation Therapy Oncology Group. BMJ 2004;328(7430):22‐4. [DOI] [PMC free article] [PubMed] [Google Scholar]
Sparks 1974
- Sparks R. Melodic Intonation Therapy: Methodology Manual. Melodic Intonation Therapy: Methodology Manual. Third Edition. Boston: Aphasia Research Section, Neurology Service, V.A. Hospital, November 1974. [Google Scholar]
Spreen 1969
- Spreen O, Benton A. Neurosensory Center Comprehensive Examination for Aphasia. Victoria BC: Neuropsychology Laboratory, University of Victoria, 1969. [Google Scholar]
Stutcliffe 1998
- Stutcliffe L, Lincoln N. The assessment of depression in aphasic stroke patients: the development of the Stroke Aphasic Depression Questionnaire. Clinical Rehabilitation 1998;2155(98):506‐13. [DOI] [PubMed] [Google Scholar]
Swinburn 2004
- Swinburn K, Porter G, Howard D. Comprehensive Aphasia Test. 1st Edition. Hove: Psychology Press, 2004. [Google Scholar]
Taylor 1959
- Taylor M, Marks M. Aphasia Rehabilitation Manual and Therapy Kit. Aphasia Rehabilitation Manual and Therapy Kit. New York: McGraw‐Hill, 1959. [Google Scholar]
Thompson 2011
- Thompson CK. Northwestern assessment of verbs and sentences. Evanston, IL: Northwestern University, 2011. [Google Scholar]
Thorndike 1944
- Thorndike El, Lorge I. Teacher's word book of 30,000 words. New York: Teachers College, Columbia University, 1944. [Google Scholar]
Vermeulen 1979
- Vermeulen J. Psychometrische Eigenschappen Van de AAT. Aphasia Center, St. Lucas Ziekenhuis, 1979. [Google Scholar]
Visch‐Brink 1996
- Visch‐Brink EG, Denes G, Stronks D. Visual and verbal semantic processing in aphasia. Brain and Language 1996;55(1):130‐2. [Google Scholar]
Visch‐Brink 1997
- Visch‐Brink EG, Bajema IM, Sandt‐Koenderman ME. Lexical semantic therapy: BOX. Aphasiology 1997;11(11):1057‐78. [Google Scholar]
Visch‐Brink 2001
- Visch‐Brink EG, Bajema IM. BOX:Een semantisch therapie programma [BOX: A semantic therapy program. BOX:Een semantisch therapie programma. Lisse, the Netherlands: Swets and Zeitlinger, 2001. [Google Scholar]
Wertz 1986
- Wertz R, Weiss WG, Aten JL, Brookshire RH, Garcia‐Bunuel L, Holland AL, et al. Comparison of clinic, home and deferred language treatment. Archives of Neurology 1986;43(7):653‐8. [DOI] [PubMed] [Google Scholar]
Yao 2005
- Yao J, Xue F, Li F. Clinical application research on collective language strengthened training in rehabilitation nursing of cerebral apoplexy patients with aphasia. Chinese Nursing Research 2005;19(3B):482‐4. [Google Scholar]
Zuckerman 1965
- Zuckerman M, Lubin B. Manual for the Multiple Affect Adjective Checklist. San Diego, California: Educational and Industrial Testing Service, 1965. [Google Scholar]
References to other published versions of this review
Brady 2012
- Brady MC, Kelly H, Godwin J, Enderby P. Speech and language therapy for aphasia following stroke. Cochrane Database of Systematic Reviews 2012. [DOI] [PubMed] [Google Scholar]
Greener 1999
- Greener J, Enderby P, Whurr R. Speech and language therapy for aphasia following stroke. Cochrane Database of Systematic Reviews 1999, Issue 4. [DOI: 10.1002/14651858.CD000425] [DOI] [PubMed] [Google Scholar]
Kelly 2010
- Kelly H, Brady MC, Enderby P. Speech and language therapy for aphasia following stroke. Cochrane Database of Systematic Reviews 2010, Issue 5. [DOI: 10.1002/14651858.CD000425.pub2] [DOI] [PubMed] [Google Scholar]