

ABSTRACT
Vascular smooth muscle cells (VSMCs) are an important source of foam cells in atherosclerosis. The mechanism for VSMC-derived foam cell formation is, however, poorly understood. Here, we demonstrate that the P2RY12/P2Y12 receptor is important in regulating macroautophagy/autophagy and VSMC-derived foam cell formation in advanced atherosclerosis. Inhibition of the P2RY12 receptor ameliorated lipid accumulation and VSMC-derived foam cell formation in high-fat diet-fed apoe-/- mice (atherosclerosis model) independent of LDL-c levels. Activation of the P2RY12 receptor blocked cholesterol efflux via PI3K-AKT, while genetic knockdown or pharmacological inhibition of the P2RY12 receptor inhibited this effect in VSMCs. Phosphoproteomic analysis showed that the P2RY12 receptor regulated the autophagy pathway in VSMCs. Additionally, activation of the P2RY12 receptor inhibited MAP1LC3/LC3 maturation, SQSTM1 degradation, and autophagosome formation in VSMCs. Genetic knockdown of the essential autophagy gene Atg5 significantly attenuated P2RY12 receptor inhibitor-induced cholesterol efflux in VSMCs. Furthermore, activation of the P2RY12 receptor led to the activation of MTOR through PI3K-AKT in VSMCs, whereas blocking MTOR activity (rapamycin) or reducing MTOR expression reversed the inhibition of cholesterol efflux mediated by the P2RY12 receptor in VSMCs. In vivo, inhibition of the P2RY12 receptor promoted autophagy of VSMCs through PI3K-AKT-MTOR in advanced atherosclerosis in apoe-/- mice, which could be impeded by an autophagy inhibitor (chloroquine). Therefore, we conclude that activation of the P2RY12 receptor decreases cholesterol efflux and promotes VSMC-derived foam cell formation by blocking autophagy in advanced atherosclerosis. Our study thus suggests that the P2RY12 receptor is a therapeutic target for treating atherosclerosis.
Abbreviations: 2-MeSAMP: 2-methylthioadenosine 5′-monophosphate; 8-CPT-cAMP: 8-(4-chlorophenylthio)-adenosine-3ʹ,5ʹ-cyclic-monophosphate; ABCA1: ATP binding cassette subfamily A member 1; ABCG1: ATP binding cassette subfamily G member 1; ACTB: actin beta; ADPβs: adenosine 5′-(alpha, beta-methylene) diphosphate; ALs: autolysosomes; AMPK: AMP-activated protein kinase; APOA1: apolipoprotein A1; APs: autophagosomes; ATG5: autophagy related 5; ATV: atorvastatin; AVs: autophagic vacuoles; CD: chow diet; CDL: clopidogrel; CQ: chloroquine; DAPI: 4ʹ,6-diamidino-2-phenylindole; dbcAMP: dibutyryl-cAMP; DIL-oxLDL: dioctadecyl-3,3,3,3-tetramethylin docarbocyanine-oxLDL; EIF4EBP1/4E-BP1: eukaryotic translation initiation factor 4E binding protein 1; EVG: elastic van gieson; HE: hematoxylin-eosin; HDL: high-density lipoprotein; HFD: high-fat diet; KEGG: Kyoto Encyclopedia of Genes and Genomes; LDL-c: low-density lipoprotein cholesterol; LDs: lipid droplets; MAP1LC3/LC3: microtubule associated protein 1 light chain 3; Masson: masson trichrome; MCPT: maximal carotid plaque thickness; MK2206: MK-2206 2HCL; NBD-cholesterol: 22-(N-[7-nitrobenz-2-oxa-1,3-diazol-4-yl] amino)-23,24-bisnor-5-cholen-3β-ol; OLR1/LOX-1: oxidized low density lipoprotein receptor 1; ORO: oil Red O; ox-LDL: oxidized low-density lipoprotein; SQSTM1/p62: sequestosome 1; TEM: transmission electron microscopy; TIC: ticagrelor; ULK1: unc-51 like autophagy activating kinase 1; VSMCs: vascular smooth muscle cells
KEYWORDS: Atherosclerosis, autophagy, foam cell, P2RY12 receptor, VSMC
Introduction
Atherosclerosis is a progressive disease of large arteries and a leading cause of stroke and cardiovascular diseases. Elevated levels of circulating low-density lipoprotein cholesterol (LDL-c), which is a major source of cholesterol and lipids, are associated with the development of atherosclerosis [1]. A standard therapy widely used to treat atherosclerosis is reducing plasma LDL-c levels with lipid-lowering agents, such as statins. However, even among patients undergoing intensive statin therapy, over 50% of treated patients did not achieve the beneficial effects of this therapy, and side effects, such as diabetes, myopathy, hepatotoxicity, and renal toxicity, also occurred [2]. A PCSK9 inhibitor, a new lipid-lowering agent, markedly reduced LDL-c levels and reversed plaques. However, a lack of long-term safety and efficacy data and the high cost of PCSK9 inhibitors limit their clinical use [3]. Therefore, it is imperative to identify new targets for the treatment of atherosclerosis.
The P2RY12/P2Y12 receptor, originally identified in platelets, is a member of the P2 receptor family, which consists of the ion-channel P2RX/P2X and the G-protein-coupled P2RY/P2Y receptors. It is activated by adenosine diphosphate to induce platelet aggregation and thromboembosis [4]. Thereby, the P2RY12 receptor of platelets has been used as a target for the treatment of thromboembolism, and clinically several P2RY12 receptor inhibitors as antiplatelet drugs are recommended for secondary prevention of stroke and cardiovascular disease. However, recent clinical studies have suggested that P2RY12 receptor inhibitors, such as clopidogrel (CDL) and ticagrelor (TIC), may be more effective than other antiplatelet drugs in patients with stroke of atherosclerotic origin [5–8]. Moreover, animal studies have also shown that the P2RY12 receptor may potentiate atherogenesis by the vessel wall P2RY12 receptor but not the platelet P2RY12 receptor [9]. Furthermore, the P2RY12 receptor is more frequently found in VSMCs, fewer in endothelial cells, and not in macrophages in culprit plaques of patients with acute myocardial infarction [10]. The P2RY12 receptor is also expressed on VSMCs of the human internal mammary artery and human carotid plaques [11–13]. The expression of P2RY12 receptor in VSMCs can be enhanced by nicotine via nicotinic acetylcholine receptors and by thrombin or oxidized low-density lipoprotein (ox-LDL) via the NFKB/NF-κB pathway [11–13]. The proliferation and migration of VSMCs are an important step in the development of atherosclerosis. We have demonstrated that the P2RY12 receptor promotes the progression of atherosclerosis by enhancing VSMC migration [12]. Other studies also reported that the P2RY12 receptor promotes the proliferation of VSMCs [11]. In the present study, we found that most of P2RY12-positive VSMCs were distributed in the vicinity of the necrotic core and foam cells. Foam cell formation due to cholesterol overloading is the defining pathological characteristic of atherosclerotic plaques and was originally thought to be derived from macrophages [14]. However, a recent study proposed that VSMCs may substantially contribute to a population of foam cells (up to 50% in humans) [15]. Currently, little is known about the mechanisms underlying VSMC-derived foam cell formation, and the role of the P2RY12 receptor on VSMC-derived foam cell formation is unknown.
Macroautophagy/autophagy is a highly conserved and tightly regulated subcellular process involved in the degradation of long-lived proteins and damaged organelles through lysosomes [16]. Lipophagy is a type of selective autophagy that has been suggested to contribute to lipid metabolism through the breakdown of intracellular lipids. Defects in lipophagy have been linked to important metabolic disorders, such as atherosclerosis, fatty liver, and obesity, in animals [17]. In macrophage-derived foam cells, lipophagy regulates cholesterol efflux via LIPA/LAL/lysosomal acid lipase. Lipid droplets (LDs) are delivered to lysosomes and then hydrolyzed to generate free cholesterol, mainly for ABCA1 (ATP binding cassette subfamily A member 1)-dependent efflux [17]. Previous ultrastructural analysis demonstrated that defective autophagy occurs in VSMCs in the atherosclerotic lesions of humans and rabbits [18]. Inhibitors of the P2RY12 receptor promotes autophagy-associated cell death in glioma cells [19]. In the present study, we also found that CDL, an inhibitor of the P2RY12 receptor, reduced the number of VSMC-derived foam cells in vitro and in vivo. These results raise the possibility that the P2RY12 receptor promotes VSMC-derived foam cell formation by inhibiting autophagy in advanced atherosclerosis.
In the present study, we found that the P2RY12 receptor facilitates VSMC-derived foam cell formation in advanced atherosclerosis. Our data reveal that there is a relationship between lipophagic flux and atherosclerosis, which is regulated by the P2RY12 receptor, while also supporting the idea that the P2RY12 receptor is a new therapeutic target for the treatment of atherosclerosis.
Results
Atorvastatin and the P2RY12 receptor inhibitor CDL may exert a synergistic anti-atherosclerotic effect
To test whether the P2RY12 receptor inhibitor CDL and atorvastatin (ATV) together exert synergistic effects in preventing the aggravation of atherosclerotic plaques, we conducted a monocentric, randomized, double-blinded trial in patients with carotid plaques. Patients were randomly allocated to receive either 20 mg of ATV or 75 mg of CDL + 20 mg of ATV daily. The maximal carotid plaque thickness (MCPT), an early and noninvasive predictor of clinical cerebrovascular and coronary events [20,21], was analyzed by ultrasound upon enrollment (Baseline) and 6 months after treatment (6 M). As of 30 November 2019, a total of 103 patients were randomized in the CESAR trail, and 74 patients have finished a 6-month follow-up, including 37 patients for ATV and 37 patients for ATV + CDL (Table 1). The decreases in MCPT were more apparent in the ATV + CDL group than in the ATV group (ATV + CDL 7.85 ± 16.11% versus ATV 0.70 ± 14.52%; P < 0.05; Figure 1A). No increase was recorded in bleeding complications. The occurrence of non-hemorrhagic adverse events was not significantly different between treatments.
Table 1.
Characteristics of participants
| Characteristic | ATV (N = 37) |
ATV + CDL (N = 37) |
|---|---|---|
| Age, y | 61.54 (10.00) | 60.62 (8.33) |
| Male, % | 64.86 | 73 |
| Systolic pressure, mm Hg Diastolic pressure, mm Hg |
125.59 (12.03) 76.92 (9.38) |
127.92 (15.47) 77.97 (8.94) |
| Diabetes, % | 13.51 | 16.22 |
| Smoking, % | 27.03 | 35.14 |
| HDL cholesterol, mM | 1.30 (0.33) | 1.15 (0.32) |
| LDL cholesterol, mM | 1.97 (0.60) | 1.87 (0.68) |
Data of age, systolic pressure, diastolic pressure, HDL cholesterol and LDL cholesterol displayed as mean (SEM) in ATV and ATV + CDL group. Data of male, diabetes and smoking represented as the occupation % in ATV and ATV + CDL group. LDL represents low-density lipoprotein; HDL represents high-density lipoprotein.
Figure 1.
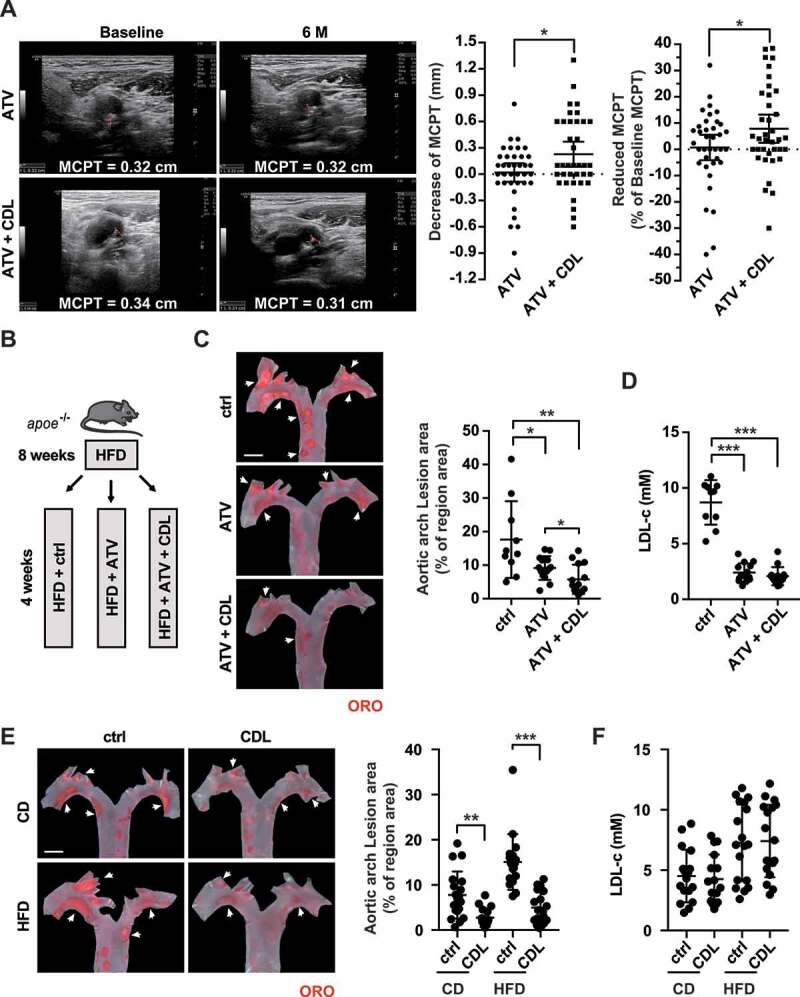
Atorvastatin and the P2RY12 receptor inhibitor CDL may exert a synergistic anti-atherosclerotic effect. (A) Representative carotid ultrasound images of patients treated with ATV or ATV + CDL; images were obtained upon enrollment (baseline) and 6 months after treatment initiation (6 M). The red line indicates the MCPT. Graphs show MCPT (mm and %) was lower in patients after 6 months of treatment than at enrollment (n = 37 for ATV treatment and n = 37 for ATV + CDL treatment). (B) Schematic representation illustrating that apoe-/- mice were given an HFD for 8 weeks to induce atherosclerotic lesions and maintained on an HFD for another 4 weeks during which the vehicle control (ctrl), ATV or ATV + CDL was administered daily. (C) Images of ORO staining showing en face total aortas obtained from mice in the indicated groups. Scale bar: 2 mm. White arrows indicate plaques in the aorta. The percent of the en face aortic arch area that was occupied by the ORO-positive area was assessed (n = 10, 14, and 14, respectively). (D) Serum LDL-c levels in mice in the ctrl, ATV, and ATV + CDL groups (n = 10, 14, and 14, respectively). (E) apoe-/- mice were given an HFD for 8 weeks to induce baseline atherosclerotic lesions. Then, the mice were changed to a normal chow diet (CD) or maintained on an HFD for another 4 weeks, and during this time, CDL or ctrl was administered daily. Images of ORO staining showing en face total aortas obtained from mice in the indicated groups. Scale bar: 2 mm. White arrows indicate plaques in the aorta. The percent en face aortic arch area that was occupied by the ORO-positive area was assessed (n = 19, 16, 18, and 18, respectively). (F) Serum LDL-c levels of mice from the CD + ctrl, CD + CDL, HFD + ctrl and HFD + CDL groups (n = 17, 16, 18 and 18, respectively). All data are shown as the mean ± SEM. *, P < 0.05; **, P < 0.01; ***, P < 0.001
We further validated the synergistic effect of CDL and ATV in apoe-/- mice by feeding the mice a high-fat diet (HFD) for 8 weeks to induce atherosclerotic lesions and then maintaining the HFD for another 4 weeks, during which ATV, ATV + CDL or vehicle control (ctrl) was administered daily (Figure 1B). The Oil Red O (ORO)-stained atherosclerotic lesion area in the aortic arch revealed that compared to the control group (17.6 ± 3.6%), the ATV and ATV + CDL treatments significantly reduced the lesion area to 9.2 ± 0.9% and 5.8 ± 1.1%, respectively. As expected, ATV-treated mice had lower LDL-c levels. Despite similar lipid profiles (including LDL-c levels) and comparable body weights, the ORO-positive areas in the ATV + CDL treatment group were 36.96% smaller than those observed with ATV treatment alone (ATV + CDL 5.8 ± 1.1% versus ATV 9.2 ± 0.9%; P < 0.001; Figure 1C,D, S1A and S1B). These findings suggest that CDL works collaboratively with ATV to mitigate atherosclerosis independent of LDL-c levels.
To explore the role of CDL in advanced atherosclerosis, we administered either a normal chow diet (CD) or HFD to apoe-/- mice for an additional 4 weeks after the atherosclerotic lesions were established (via HFD for 8 weeks). ORO staining in the aortic arch revealed that the lipid deposition area was smaller in the CDL group than in the ctrl group in both the CD and HFD conditions (Figure 1E). Importantly, the body weights and lipid profiles (including LDL-c levels) were not different between the CDL and ctrl groups regardless of the diet (Figure 1F, S1 C and S1D). Together, these findings reveal that inhibition of the P2RY12 receptor mitigates atherosclerosis and works collaboratively with ATV but independently of LDL-c levels.
The P2RY12 receptor inhibitor ameliorates lipid accumulation and VSMC-derived foam cell formation in advanced atherosclerosis
To analyze the composition of plaques, we assessed arteriosclerotic lesions in the aortic root. The plaque area and necrosis core were analyzed by hematoxylin-eosin (HE) staining (Figure 2A). Compared with the ctrl group, the CDL group had smaller plaque sizes and a smaller percentage of plaque in necrosis core areas under both CD and HFD conditions (Figure 2B,C). There was no difference in the percentage of plaque in collagen content or the continuity of elastin between the control and CDL groups (Fig. S2A-C). In line with the reduced plaque areas at the aortic arch that were indicated by ORO, lipid staining by ORO in the aortic root also revealed that the CDL group had smaller lipid deposition relative to plaque area than were observed in the ctrl group, regardless of whether CD or HFD was applied (Figure 2D). Previous studies have suggested that the P2RY12 receptor is expressed abundantly in VSMCs and upregulated during the development of atherosclerosis [10,12]. More recent studies suggest that in advanced atherosclerosis, at least 50% of foam cells are derived from VSMCs [15,22]. To test whether the P2RY12 receptor is directly involved in VSMC-derived foam cell formation, we stained plaques with VSMC-specific marker antibodies and performed lipid staining with fluorescent BODIPY (Figure 2E). BODIPY staining is another indicator for neutral fat deposition, and we found similar results as ORO that, compared with control mice, mice of CDL group had less lipid deposition relative to plaque area on CD or HFD condition (Figure 2F). ACTA2/α-SMA and PDGFRB/PDGFRβ were used to label VSMCs in plaques [23]. We found that CDL significantly reduced lipid deposition in lesional VSMCs indicated by a reduced number of ACTA2+ BODIPY+ or PDGFRB+ BODIPY+ cells per mm2 plaque area on CD or HFD condition (Figure 2G,H). This was also confirmed by co-staining another two VSMC-specific markers, MYH11 or TAGLN and BODIPY (Fig. S3). Importantly, we co-stained the carotid plaques of patients treated with aspirin (ctrl) or aspirin + CDL (CDL) by BODIPY with the VSMC marker ACTA2 (Fig. S4A). We found that the BODIPY-positive area had a smaller occupation of plaque area in the CDL group than the ctrl group, indicating reduced lipid deposition by CDL. Additionally, the number of ACTA2+ BODIPY+ cells per mm2 plaque area was also smaller patients of CDL group than the ctrl group (Fig. S4B and S4 C). Moreover, we found a significant number of foam cells were originated from VSMCs in these human plaques, consistent with a previous report [15]. Thus, we conclude that the inhibition of the P2RY12 receptor effectively reduces the size of the lipid core and the number of VSMC-derived foam cells in advanced atherosclerosis.
Figure 2.
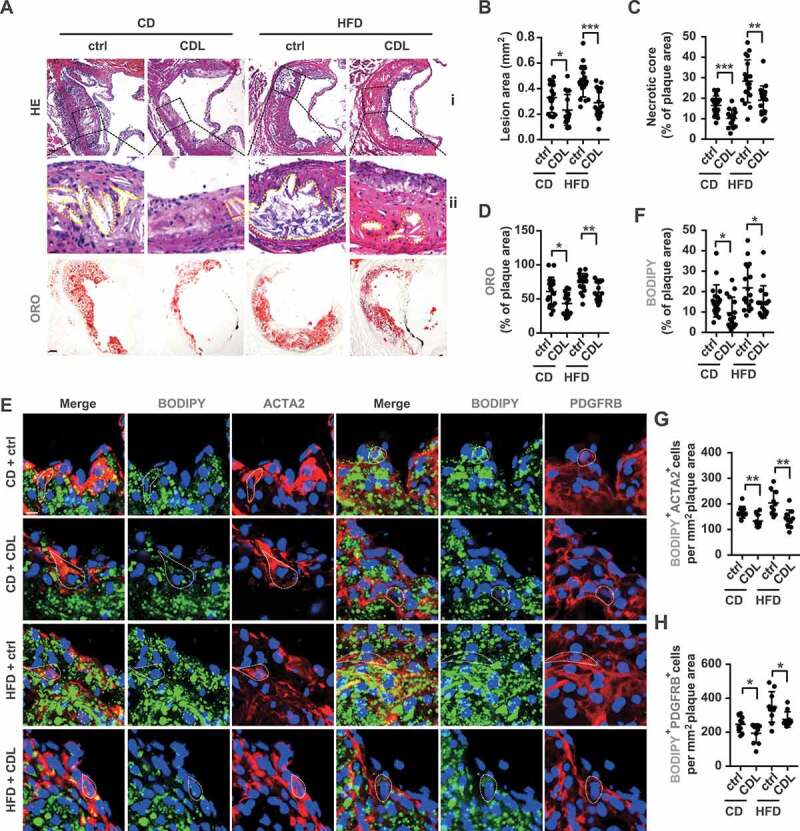
The P2RY12 receptor inhibitor ameliorates lipid accumulation and VSMC-derived foam cell formation in advanced atherosclerosis. (A) Representative images of aortic root sections obtained from mice in the CD + ctrl, CD + CDL, HFD + ctrl and HFD + CDL groups. For HE, (ii) Enlargement of the insert shown in (I) with the necrotic core marked by a yellow line. Scale bars: 40 μm (upper), 15 μm (bottom). For ORO, Scale bar: 40 μm. The plaque area (B) and percentage of the plaque area that was occupied by the necrotic core (C) and ORO (D) are presented (n = 19, 16, 18, and 18, respectively). (E) Fluorescence images of ACTA2-BODIPY or PDGFRB-BODIPY in aortic root sections obtained from mice in the CD + ctrl, CD + CDL, HFD + ctrl and HFD + CDL groups. Nuclei were stained with DAPI (blue). Scale bar: 20 μm. White dashed lines indicate VSMC-derived foam cells. The percentage of the plaque area that was occupied by BODIPY (F) are presented (n = 19, 16, 18, and 18, respectively) among indicated groups. The number of ACTA2+ BODIPY+ cells (G) or PDGFRB+ BODIPY+ cells (H) per mm2 of plaques in the indicated groups is presented (n = 10 per group). All data are shown as the mean ± SEM from 3 to 5 independent experiments. *, P < 0.05; **, P < 0.01; ***, P < 0.001
The P2RY12 receptor promotes VSMC-derived foam cell formation by inhibiting cholesterol efflux
Because the P2RY12 receptor inhibitor CDL widely used clinically is a prodrug and requires biotransformation into its active form by cytochrome P450 system before binding to the P2RY12 receptor in vivo. To investigate whether the P2RY12 receptor is involved in regulating VSMC-derived foam cell formation in vitro, we treated oxLDL-stimulated VSMCs with the P2RY12 receptor agonist adenosine 5′-(alpha, beta-methylene) diphosphate (ADPβs) or the P2RY12 receptor antagonist 2-methylthioadenosine 5′-monophosphate (2-MeSAMP) instead of CDL. We visualized lipids in VSMCs by BODIPY or ORO staining, and the positive area was quantified. We found that compared with control cells, ADPβs significantly increased the LDs area in VSMCs. Conversely, compared with controls, 2-MeSAMP alone decreased the LDs area in VSMCs. Additionally, 2-MeSAMP abolished the ADPβs-increased LDs area (Figure 3A). The total cholesterol content in VSMCs was also measured. Consistent with the changes in BODIPY or ORO staining, ADPβs increased total cholesterol levels in VSMCs, and pretreating VSMCs could reverse this effect with 2-MeSAMP (Figure 3B). Because ADPβs may also interact with the P2RY1/P2Y1 receptor, to verify our findings, we used a lentivirus-mediated P2RY12 receptor-specific shRNA (shP2ry12) to knockdown P2RY12 receptor expression in VSMCs. The P2RY12 protein and mRNA levels were much lower in shP2ry12-transduced cells than in control empty vector-transduced cells (shctrl) (Figure 3C). In shctrl cells, compared with the control group, ADPβs induced larger LDs areas and higher levels of total cholesterol. Moreover, knockdown of the P2RY12 receptor abolished the effect of ADPβs in VSMCs (Figure 3D,E). In addition, we used the siP2ry1 to knockdown the P2RY1 receptor and found that the increased lipid deposition induced by ADPβs in VSMCs could not be reversed by siP2ry1, suggesting that the P2RY1 receptor is not involved in the process of ADPβs-induced lipid deposition in VSMCs (Fig. S5A-C). Therefore, we conclude that activation of the P2RY12 receptor induces VSMC-derived foam cell formation.
Figure 3.
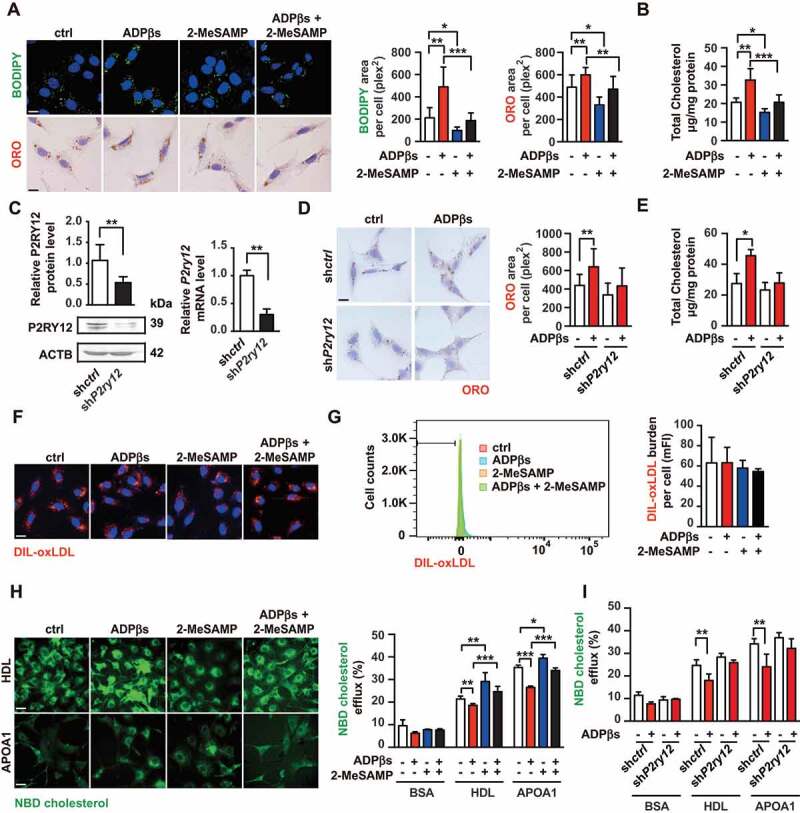
The P2RY12 receptor promotes VSMC-derived foam cells by inhibiting cholesterol efflux. (A) Confocal images (upper) or optical images (bellow) of VSMCs labeled by BODIPY or ORO. Ox-LDL-stimulated VSMCs were treated with vehicle control, a P2RY12 receptor activator (ADPβs), a P2RY12 receptor inhibitor (2-MeSAMP), or a combination of the two and then imaged 24 h post-stimulation. The average body (left) or ORO (right) area per cell was assessed. Scale bar: 10 μm. (B) Total cholesterol levels in VSMCs were determined as described in A. (C) WB and PCR analysis of VSMCs transfected with a lentivirus containing the control vector (shctrl) or the P2RY12 receptor shRNA (shP2ry12). (D) ORO images of ox-LDL-loaded VSMCs in the indicated group. The graph shows the area positive for ORO per cell. The scale: 10 μm. (E) Total cholesterol levels in VSMCs were quantified as described in D. (F) Representative fluorescence images of VSMCs obtained in the indicated group and labeled with DIL-oxLDL at 37°C for 4 h. Cells were rinsed and incubated in complete medium without Dil-oxLDL. Scale bar: 10 μm. (G) Representative flow cytometry histogram of DIL-oxLDL-processed VSMCs obtained in the indicated group. Experiments were analyzed by flow cytometry to determine the mean DIL-oxLDL burden (mFI). (H) Representative fluorescent images of the NBD-cholesterol burden in VSMCs obtained in the indicated group after incubation with HDL or APOA1 for 4 h. The HDL and APOA1-mediated cholesterol efflux (%) were analyzed in these groups. Scale bar: 10 μm. (I) HDL- and APOA1-mediated cholesterol efflux (%) was measured in shctrl-infected or shP2ry12-infected VSMCs stimulated with ADPβs or vehicle control. All data are presented as the mean ± SEM from 3 to 5 independent experiments. *, P < 0.05; **, P < 0.01; ***, P < 0.001
Lipid accumulation in VSMCs could be caused by changes in lipid uptake or cholesterol efflux. Hence, we investigated whether the P2RY12 receptor enhances the phagocytosis of ox-LDL. VSMCs were treated with ADPβs in the presence or absence of 2-MeSAMP prior to incubation with DIL-oxLDL. We found that the binding of DIL-oxLDL in VSMCs was not influenced by ADPβs or 2-MeSAMP as indicated by immunofluorescent analysis and flow cytometry (Figure 3F,G), and the protein and mRNA levels of phagocytosis receptors, including MSR1, OLR1/LOX-1 (oxidized low density lipoprotein receptor 1), and CD36, were also not affected (Fig. S6). Next, we evaluated whether the P2RY12 receptor inhibits cholesterol efflux. To this end, we stimulated the 22-(N-[7-nitrobenz-2-oxa-1,3-diazol-4-yl] amino)-23,24-bisnor-5-cholen-3β-ol (NBD-cholesterol)-loaded VSMCs with ADPβs or 2-MeSAMP, and the efflux of the labeled cholesterol to lipid-poor APOA1 (apolipoprotein A1) or high-density lipoprotein (HDL) was analyzed. We found that compared with the control group, treatment with ADPβs inhibited cholesterol efflux to both APOA1 and HDL. In contrast, 2-MeSAMP alone promoted cholesterol efflux to both APOA1 and HDL. In addition, 2-MeSAMP reversed ADPβs-inhibited cholesterol efflux (Figure 3H). We further verified this finding in shP2ry12-infected cells and found that the ratio of cholesterol efflux observed in shP2ry12-infected cells did not change after ADPβ stimulation (Figure 3I). These results indicate that the P2RY12 receptor promotes VSMC-derived foam cell formation by inhibiting cholesterol efflux.
The P2RY12 receptor inhibits cholesterol efflux through the PI3K-AKT signaling pathway
Next, we investigated the potential signaling pathway that could underlie P2RY12 receptor-induced foam cell formation from VSMCs. Activation of the P2RY12 receptor inhibits cAMP-PKA and activates the PI3K-AKT pathway in platelets [24,25]. We examined whether similar mechanisms are involved in increasing lipid deposition in VSMCs. We found that when the levels of cAMP were ectopically increased using two cAMP analogs, dibutyryl-cAMP (dbcAMP) or 8-(4-chlorophenylthio)-adenosine-3ʹ,5ʹ-cyclic-monophosphate (8-CPT-cAMP), the latter is a nonhydrolyzable cAMP analog [19], both had no impact on ADPβs-promoted lipid deposition. In contrast, regulating PI3K-AKT signaling had a discernible effect. Both LY294002 (a PI3K inhibitor) and MK-2206 2 HCL (MK2206, an AKT inhibitor) significantly inhibited ADPβ-induced lipid deposition indicated by BODIPY staining and the total cholesterol levels detected in VSMCs (Figure 4A,B). We then examined whether PI3K-AKT mediates the suppressed cholesterol efflux observed after P2RY12 receptor activation. Examination of the ratio of cholesterol efflux showed that LY294002 or MK2206 abolished the decreases in cholesterol efflux that were mediated by ADPβs (Figure 4C). Furthermore, we observed increased levels of the phosphorylation of PIK3R1 and AKT1 in response to ADPβs, an effect that could be reversed by adding 2-MeSAMP and that was inhibited in shP2ry12-infected cells (Figure 4D,E). These results indicate that the P2RY12 receptor hinders cholesterol efflux and ultimately induces foam cell formation in VSMCs by activating the PI3K-AKT signaling pathway.
Figure 4.
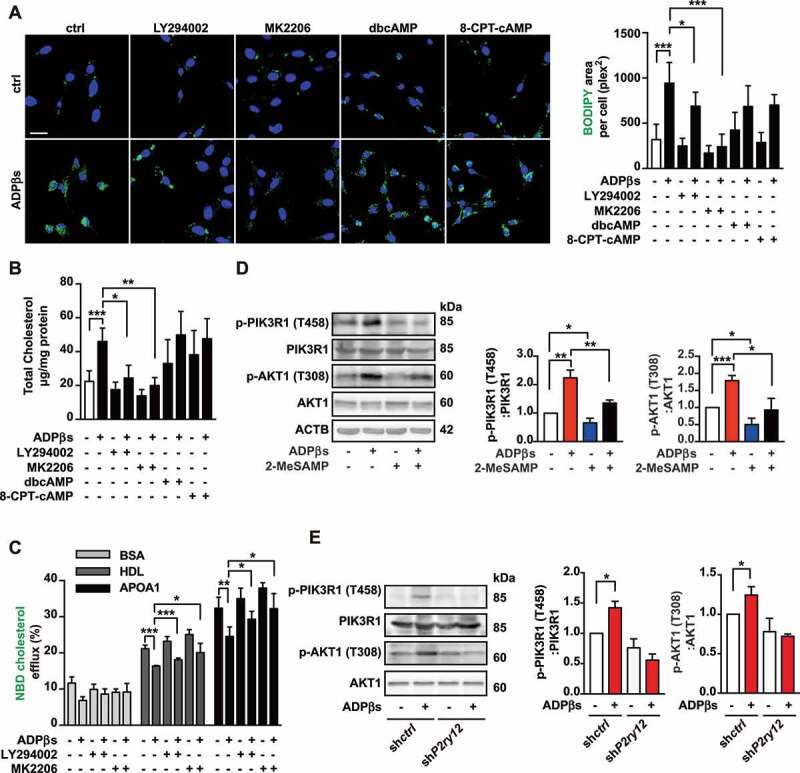
The P2RY12 receptor inhibits cholesterol efflux through the PI3K-AKT signaling pathway. (A) Representative images of BODIPY-positive area in VSMCs obtained from the indicated group. Nuclei were stained with DAPI (blue). Scale bar: 20 μm. Ox-LDL-stimulated VSMCs were cultured with LY294002 (50 µM), MK-2206 2HCl (MK2206, 5 µM), dbcAMP (0.02 mM) or 8-CPT-cAMP (0.02 mM) for 30 min, and then ADPβs or vehicle control was added for 24 h before the cells were analyzed to determine the size of the BODIPY-positive area. (B) Total cholesterol levels were measured in VSMCs as described in A. (C) HDL- and APOA1-mediated cholesterol efflux (%) was measured in VSMCs in the indicated groups. (D) Western blot for PIK3R1 and AKT1 phosphorylation in VSMCs treated with or without ADPβs or 2-MeSAMP. Representative western blots (left) and normalized ratios of p-PIK3R1:PIK3R1 or p-AKT1:AKT1 (right). (E) Western blot for PIK3R1 and AKT1 phosphorylation in shctrl-treated VSMCs and shP2ry12-treated VSMCs. Cells were treated with ADPβs or vehicle control for 24 h. Representative western blots (left) and normalized ratios of p-PIK3R1:PIK3R1 or p-AKT1:AKT1 (right). All data are presented as the mean ± SEM from 3 to 5 independent experiments. *, P < 0.05; **, P < 0.01; ***, P < 0.001
The P2RY12 receptor inhibits the autophagy-lysosome pathway in VSMCs
Differences in cholesterol efflux are generally considered to result from changes in the expression of ATP-binding cassette transporters. However, our analysis of the expression of ABCA1 and ABCG1 (ATP binding cassette subfamily G member 1) proteins revealed no significant differences among the groups (Fig. S6). Previous research has shown that cholesterol efflux relies on LIPA to generate free cholesterol for efflux [17]. To explore whether LIPA is involved in P2RY12 receptor-induced changes in cholesterol efflux, we stained the cells with the lysosome marker LysoTracker Red together with BODIPY after we stimulated the VSMCs with ADPβs, 2-MeSAMP or ADPβs plus 2-MeSAMP for 0 h, 6 h, 12 h, or 24 h. We found that LysoTracker Red-BODIPY colocalization was significantly lower in the ADPβs group than in the control group after as few as 6 h; this effect was reversed by 2-MeSAMP treatment for 24 h (Figure 5A,B). This evidence suggests that the P2RY12 receptor regulates the lysosome-related pathway. Previous studies performed in macrophages have suggested that autophagy plays a role in generating free cholesterol for efflux, especially when lipids are overloaded [17]. CDL-induced autophagy has previously been reported in gliomas [19]. Moreover, PI3K-AKT is a critical regulator of autophagy, which has been implicated in controlling fat metabolism. Thus, we hypothesized that P2RY12 receptor activation regulates the autophagy-lysosome pathway in VSMCs. To explore whether the P2RY12 receptor regulates autophagy, we first stained MAP1LC3/LC3 (microtubule associated protein 1 light chain 3) in VSMCs treated with ADPβs or 2-MeSAMP in the presence or absence of chloroquine (CQ) (Figure 5C). As expected, CQ challenge resulted in overall increased numbers of autophagic structures than were observed in cells not treated with CQ. Compared with control cells, ADPβs significantly decreased the number of autophagic structures (LC3 dots), and 2-MeSAMP reversed the effect. Additionally, in the CQ condition, we found that the number of autophagic structures was lower in the ADPβs group than in the control group. Moreover, the number of LC3 dots was increased when 2-MeSAMP added alone, and it was further increased when cells were treated with 2-MeSAMP by combination with CQ, which is a sign of autophagic flux. Furthermore, ADPβs + 2-MeSAMP treatment resulted in higher numbers of autophagic structures than were observed in the ADPβs group when CQ was added to both groups (Figure 5C,D). Additionally, we analyzed protein extracts for the presence of LC3B-II, which is the lipidated form of LC3B that is generally used for the detection of autophagic activity in cells incubated on the presence or absence of CQ. Accordingly, CQ administration results in an overall increase in the level of LC3B-II, and we detected a decrease in the level of LC3B-II in protein extracts obtained from the ADPβs group, and this decrease was reversed by 2-MeSAMP treatment. In addition, under CQ conditions, we still observed that the level of LC3B-II was lower in the ADPβs group than in the group treated with CQ alone, and this decrease was also reversed by 2-MeSAMP treatment. As anticipated, ADPβs displayed a decrease in net LC3B-II flux, which was reversed when cells were pre-treated with 2-MeSAMP, demonstrating that ADPβs inhibited autophagy, and the P2RY12 receptor inhibitor 2-MeSAMP could reverse the impaired autophagy by ADPβs (Figure 5E). Moreover, these results were validated in shP2ry12-transfected VSMCs (Figure 5F). We then examined SQSTM1/p62 (sequestosome 1), an autophagy substrate, in both detergent-soluble and insoluble fractions. Defective autophagic flux is accompanied by the accumulation of SQSTM1 protein in insoluble fractions. We found that the insoluble SQSTM1 fraction showed significantly more accumulation in the ADPβs group, and 2-MeSAMP reversed the ADPβs-induced accumulation of insoluble SQSTM1. This change was abolished when cells were treated with CQ, suggesting that ADPβs impairs autophagy while 2-MeSAMP could reverse the injury induced by 2-MeSAMP (Figure 5G). Additionally, the mRNA levels of Lc3b and Sqstm1 remained unchanged (Figure 5H). LC3B has two transcript variants, we further detected the transcript variant 1 and 2 of LC3B with specific primers and found no difference among groups (Fig. S7A). This evidence suggested that these proteins are not regulated at the transcriptional level; rather, this effect is due to changes occurring at the protein level. Furthermore, we verified these effects using the autophagy flux reporter mRFP-GFP tandem fluorescent-tagged Lc3 adenovirus (ad-mRFP-GFP-Lc3). mRFP+ GFP+ LC3 dots (yellow dots) represent autophagosomes or their precursors, whereas mRFP+ GFP− dots (red dots) indicate autolysosomes because GFP fluorescence is lost in the lysosomal acidic pH. We found that compared with control cells, the number of autophagosomes (yellow dots) and autolysosomes (red dots) were both significantly decreased in VSMCs with ADPβs, and the P2RY12 receptor antagonist 2-MeSAMP alone increased autophagic activity (more yellow and red dots). Moreover, 2-MeSAMP could significantly abolish autophagy impairment of ADPβs inducing (Figure 5I). Collectively, these data suggest that the P2RY12 receptor inhibits the autophagy-lysosome pathway in VSMCs.
Figure 5.
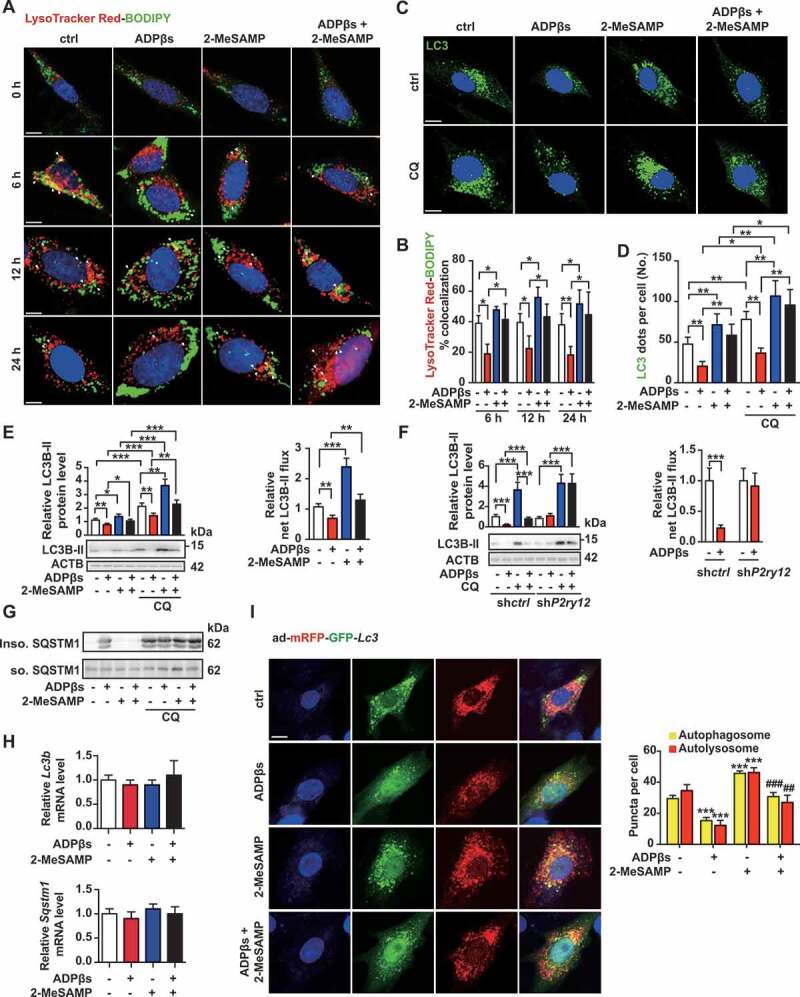
The P2RY12 receptor inhibits the autophagy-lysosome pathway in VSMCs. (A) Immunofluorescence for LysoTracker Red (red)-BODIPY (green) in VSMCs treated with or without ADPβs or 2-MeSAMP at the indicated time points. Hoechst 33342 was used to visualize nuclei (blue). Scale bar: 5 μm. (B) Percent colocalization between LysoTracker Red and BODIPY (white arrows in A) and the mean ± SEM of 20 different cells in each experiment. (C) Representative images of LC3 staining in VSMCs of indicated groups. DAPI was used to visualize nuclei (blue). Scale bars: 5 μm (top). Cells were pretreated with or without 50 μmol/L CQ for 2 h and then cultured with ADPβs or 2-MeSAMP. The number of LC3 (green) dots (D) is presented. The data are shown as the mean ± SEM for 20 different cells in each experiment. (E) Immunoblots for LC3 from VSMCs are shown for the indicated group. Graphs for LC3B-II relative to the control are presented above the band, relative net LC3B-II flux in groups as described in the right. (F) Immunoblots are shown for LC3B in shctrl-VSMCs or shP2ry12-VSMCs cultured with or without ADPβs. The graph above the band represents the densitometric value obtained for LC3B-II. Relative net LC3B-II flux in groups as described in the right. (G) Immunoblots for SQSTM1 in VSMCs in the indicated group. VSMCs were stimulated with vehicle control, ADPβs, 2-MeSAMP or a combination of the two. Cell lysates were separated into detergent (0.5% TX-100)-soluble and insoluble fractions. (H) Quantitative real-time PCR analysis of the mRNA levels of Lc3b and Sqstm1 in VSMCs treated with vehicle control, ADPβs, 2-MeSAMP, or their combination. Data are normalized to Actb expression. (I) Immunofluorescence images (left) for VSMCs transfected with ad-mRFP-GFP-Lc3 and then treated with vehicle control, ADPβs, 2-MeSAMP, or their combination. DAPI was used to visualize nuclei (blue). Scale bar: 10 μm. Quantitative data in the right represent the number of autophagosomes (yellow) dots and autolysosome (red) dots (n > 20 cells of each slide). All data are presented as the mean ± SEM from 3 to 5 independent experiments. For A-H, *, P < 0.05; **, P < 0.01; ***, P < 0.001. For I, ***, P < 0.001 compared with control group; ##, P < 0.01 compared with ADPβs group; ###, P < 0.001 compared with ADPβs group
The P2RY12 receptor decreases cholesterol lipolysis and promotes VSMC foam cell formation by inhibiting autophagy
To test the hypothesis that the P2RY12 receptor regulates lipid metabolism via effects on autophagy, we first detected a direct association between LDs and autophagosomes by immunofluorescence analysis. We used BODIPY to stain neutral lipids and LC3 antibody to label autophagy-related structures in VSMCs. Li et al. reported that autophagy is impaired in VSMCs when cells are treated with ox-LDL for 12 h [26]. The autophagy activator rapamycin reduced foam cell formation in ox-LDL-treated VSMCs, while the inhibitor 3 MA increased foam cell formation. Consistent with these findings, we found that the autophagy inhibitor CQ significantly increased lipid deposition and that the autophagy activator rapamycin and torin-1 each significantly decreased lipid accumulation in VSMCs. Moreover, the colocalization of LC3-BODIPY was decreased in the ADPβs group and increased when we treated VSMCs with 2-MeSAMP alone. Additionally, 2-MeSAMP abolished the decreased colocalization of LC3-BODIPY induced by ADPβs. When lysosomes were inhibited with CQ, as expected, the colocalization of LC3-BODIPY increased overall over that in cells not treated with CQ. Among cells treated with CQ, the colocalization of LC3-BODIPY was still apparently decreased in ADPβs; conversely, 2-MeSAMP alone promoted the colocalization of LC3-BODIPY.
Moreover, 2-MeSAMP reversed the decrease in the colocalization of LC3-BODIPY induced by ADPβs (Figure 6A,B). To further characterize the status of autophagic flux during the process of lipid degradation, we applied transmission electron microscopy (TEM) to determine the mechanism underlying LDs sequestration by autophagosomes (Figure 6C). LDs were readily identifiable as round light-density structures that were not limited by a bilayer lipid membrane [17,27]. We found that the average number and area of LDs per cell section were increased in cells treated with ADPβs while decreased with 2-MeSAMP treatment. 2-MeSAMP reversed ADPβs-induced increases in lipid deposition (Figure 6D). We further analyzed the autophagic structures in TEM images. The average number of total AVs was lower in the ADPβs group, and this reduction was reversed when we pretreated the cells with 2-MeSAMP (Figure 6E). AVs are composed of autophagosomes (APs/APGs) and autolysosomes (ALs/AUTs). Both the average numbers of APs and ALs were lower in the ADPβs group but reversed when we pretreated the cells with 2-MeSAMP (Figure 6F). To further test whether the decreased autophagy observed in the ADPβs group could account for the decrease in cholesterol efflux rate and promotion of lipid accumulation, we transfected VSMCs with siRNA to knockdown ATG5 (autophagy related 5), a crucial protein in the autophagic catabolic process (Fig. S5D). We found that the downregulation of ATG5 efficiently diminished cholesterol efflux and increased lipid deposition in VSMCs. We observed an ATG5-dependent reduction in the accumulation of cholesteryl content was observed in the ADPβs + 2-MeSAMP group when it was compared to the ADPβs group (Figure 6G,H). The cholesterol efflux rate was also determined (Figure 6I). Collectively, these results indicate that autophagy is reduced via the activation of the P2RY12 receptor, which promotes the accumulation of cholesterol and foam cell formation in VSMCs.
Figure 6.
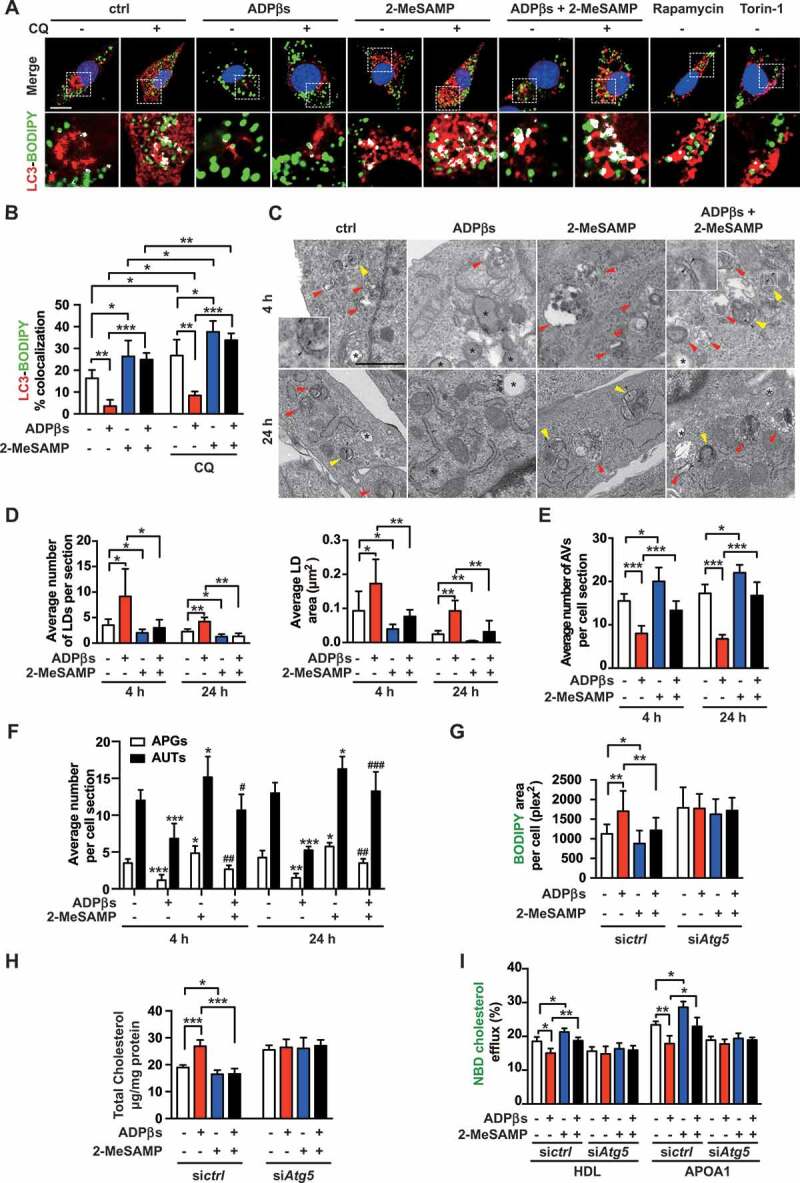
The P2RY12 receptor decreases cholesterol lipolysis and promotes VSMC foam cell formation by inhibiting autophagy. (A) Confocal images of LC3 (red)-BODIPY (green) in VSMCs of indicated groups. Enlargement of the insert show colocalized pixels in white (below). VSMCs were treated with vehicle control, ADPβs, 2-MeSAMP, CQ (50 μmol/L), which VSMCs in each group were pretreated 50 μg/mL ox-LDL. CQ was pre-added for 2 h. Rapamycin and torin-1 were used as positive controls. DAPI was used to visualize nuclei (blue). Scale bar: 10 μm. The percent colocalization between LC3 and BODIPY is presented (B). (C) Electron micrographs of VSMCs submitted to the indicated treatments for 4 or 24 h. LDs (asterisks); APGs, autophagosomes, initial autophagic vacuoles (AVs) (yellow arrowheads); AUTs, autolysosomes, late or degradative AVs (red arrowheads); and double-membrane structures (black arrowheads). scale bar: 1 μm. The average number and LDs area per cell section were also determined in images of TEM (D). Morphometric analysis was used to calculate the average number of total AVs per cell section (E). The number of APGs or AUTs per cell section was also assessed (F). The BODIPY-positive area (G), total cholesteryl content (H), and HDL- and APOA1-mediated cholesterol efflux (I) measured in VSMCs transfected with a control siRNA (sictrl) or an Atg5 siRNA (siAtg5) are presented. Cells were treated with vehicle control, ADPβs, 2-MeSAMP, or a combination of these factors. All data are presented as the mean ± SEM of 3 to 5 independent experiments. *, P < 0.05; **, P < 0.01; ***, P < 0.001 vs control or indicated group; #, P < 0.05 vs ADPβs group; ##, P < 0.01 vs ADPβs group
The P2RY12 receptor inhibits autophagy via the PI3K-AKT-MTOR pathway
To further explore the mechanism by which the P2RY12 receptor regulates autophagy in VSMCs, we systematically evaluated and compared the phosphoproteome profiles of gene sets in KEGG signaling pathways. Six autophagy-related phosphoproteins are indicated in Figure 7A. These 6 proteins are all scattered in the membrane nucleation process in the “Autophagy-animal” category, suggesting that autophagy is regulated in the initial phase. Thus, the positive effect of ADPβs on autophagy could be implemented by two possible mechanisms: 1) ADPβs might modulate upstream autophagy-regulatory signaling pathways, such as AMP-activated protein kinase (AMPK) or MTOR; and 2) ADPβs might directly affect the initial steps of vesicle nucleation during which activated PIK3C3/VPS34 generates PtdIns3P. Additionally, metabolic autophagy is regulated by the Ser/Thr protein kinases MTOR and AMPK, which are best known for orchestrating anabolic and catabolic pathways in general, including autophagy [28]. Moreover, the inhibition of MTOR improves atherosclerosis, and the activation of MTOR1 promotes the inflammatory response to arterial injury, as has been reported [29,30]. In our study, we found that the phosphorylation of MTOR and EIF4EBP1/4E-BP1 (eukaryotic translation initiation factor 4E binding protein 1; an MTOR substrate) were both increased after treatment with ADPβs, suggesting an alteration in MTOR activity (Figure 7B). We also tested whether the P2RY12 receptor could regulate AMPK activity or BECN1/beclin-1 by detecting the phosphorylation of the protein kinase AMP-activated catalytic subunit alpha (PRKAA) at Thr172 and BECN1 at Ser15. The level of phosphorylation of PRKAA and BECN1 was not altered by P2RY12 receptor activation (Figure 7B). This data, therefore, suggests that the P2RY12 receptor regulates autophagosome formation by altering the activities of MTOR. We also examined the effects occurring downstream of MTOR. The phosphorylation of ULK1 (unc-51 like autophagy activating kinase 1) at Ser757 was significantly increased after treatment with ADPβs, and this effect was reversed by 2-MeSAMP treatment (Figure 7B). To verify that activation of the P2RY12 receptor induces the increased phosphorylation of MTOR, EIF4EBP1, and ULK1, we used shP2ry12-treated VSMCs. We found that knockdown of the P2RY12 receptor abolished the ADPβs-induced increased phosphorylation of MTOR, EIF4EBP1, and ULK1 (Figure 7C). We further verified whether the P2RY12 receptor induces the MTOR-ULK1 signaling pathway through PI3K-AKT. We found that the AKT inhibitor MK2206 abolished the increases in the phosphorylation of MTOR, EIF4EBP1, and ULK1 that were induced by ADPβs (Figure 7D). To confirm the involvement of MTOR in regulating cholesterol efflux and eventual lipid deposition, we blocked MTOR activity using rapamycin and found that rapamycin alone promoted cholesterol efflux and diminished lipid deposition in VSMCs. Moreover, rapamycin reversed the effect of ADPβs on the inhibition of cholesterol efflux and increased lipid deposition in cells (Figure 7E-G). We next transfected cells with a siRNA against Mtor (Fig. S5E). Furthermore, in siMtor cells, ADPβs failed to impede cholesterol efflux or induce lipid deposition (Figure 7H-J). Thus, we conclude that the activation of the P2RY12 receptor inhibits autophagy-dependent lipid degradation and increases lipid deposition by the PI3K-AKT-MTOR pathway.
Figure 7.
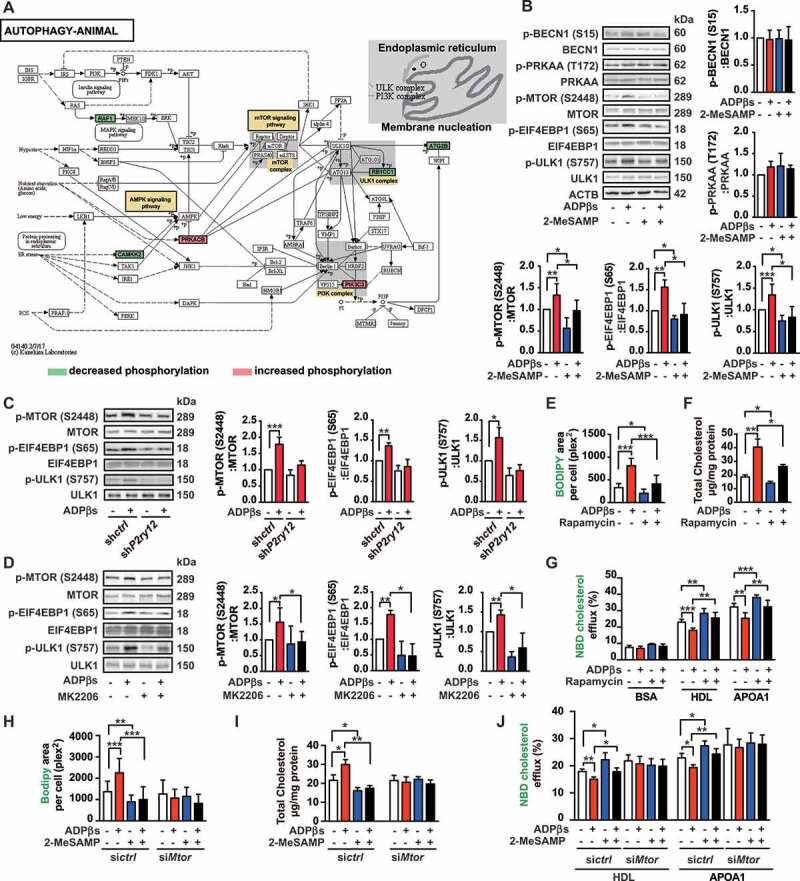
The P2RY12 receptor inhibits autophagy via the PI3K-AKT-MTOR pathway. (A) Activation of the AUTOPHAGY-ANIMAL signaling pathway in VSMCs treated with ADPβs. Phosphorylation levels are shown for each protein in the pathway relative to that observed in the control cells and indicated by a color scale of red (increased) to green (decreased). Proteins with no phosphorylation data are colored in white. (B) Representative western blots (left) and the normalized ratios of p-BECN1/beclin-1:BECN1/beclin-1, p-PRKAA:PRKAA, p-MTOR:MTOR, p-EIF4EBP1:EIF4EBP1, p-ULK1:ULK1 (right and below) in VSMCs treated with vehicle control, ADPβs, 2-MeSAMP, or a combination of these factors. (C) Representative western blots (left) and normalized ratios of p-MTOR:MTOR, p-EIF4EBP1:EIF4EBP1, p-ULK1:ULK1 (right) in shctrl-treated VSMCs or shP2ry12-treated VSMCs that were also treated with ADPβs or vehicle control. (D) Representative western blots (left) and normalized ratios of p-MTOR:MTOR, p-EIF4EBP1:EIF4EBP1, p-ULK1:ULK1 (right) in VSMCs treated with vehicle control, ADPβs, MK2206 (an AKT inhibitor), or a combination of these factors. The BODIPY-positive area, total cholesteryl content, and HDL and APOA1-mediated cholesterol efflux (%) were measured in VSMCs treated with rapamycin (E-G) or transfected with siRNA for MTOR (siMtor) (H-J) and are presented here. All data are presented as the mean ± SEM from 3 to 5 independent experiments. *, P < 0.05; **, P < 0.01; ***, P < 0.001
The P2RY12 receptor inhibitor induces autophagy in advanced atherosclerosis
We further explored whether CDL would induce autophagy in HFD apoe-/- mice. To induce advanced atherosclerosis, apoe-/- mice were given HFD for 8 weeks and maintained on HFD for another 4 weeks, during which ctrl, CDL, or CQ was administered. In western blots, we found that the level of LC3B-II was increased in aorta homogenate of the CDL group than that of the control group, and its level was further increased in the CQ + CDL group. CDL displayed a 3.9-fold increase in LC3B-II flux. Consistently, the protein level of SQSTM1 was lower in the CDL group than in the ctrl group, and this decrease was reversed by CQ (Figure 8A). However, the mRNA levels of Lc3b and Sqstm1 in aorta remained unchanged among groups (Figure 8B). Moreover, when detecting the transcript variant 1 and 2 of LC3B with specific primers, we also found no difference among groups (Fig. S7B). These results suggest that CDL induces autophagy in the atherosclerosis model of apoe-/- mice. To further verify that the P2RY12 receptor inhibitor promotes autophagy in advanced atherosclerosis, we analyzed the autophagy-related markers LC3 and SQSTM1 in VSMCs of arteriosclerotic lesions in the aortic root of the apoe-/- mouse atherosclerosis model using immunofluorescence staining (Figure 8C). We found that under HFD conditions, the number of ACTA2+ LC3+ cells per mm2 plaque area is increased in the CDL group than in the control group. Moreover, it was further increased in the CQ + CDL group (Figure 8D). We further analyzed the ACTA2+ SQSTM1+ cells at the aorta root of these groups. We found that compared with control mice, CDL significantly decreased the number of ACTA2+ SQSTM1+ cells per mm2 area in plaques, and this effect was blocked in mice, which were treated with CDL by combination with CQ (Figure 8E). Additionally, we found similar results in another P2RY12 receptor inhibitor TIC as shown in Fig. S8A-D. This evidence suggested that the P2RY12 receptor inhibitor induces autophagy in advanced atherosclerosis of apoe-/- mice.
Figure 8.
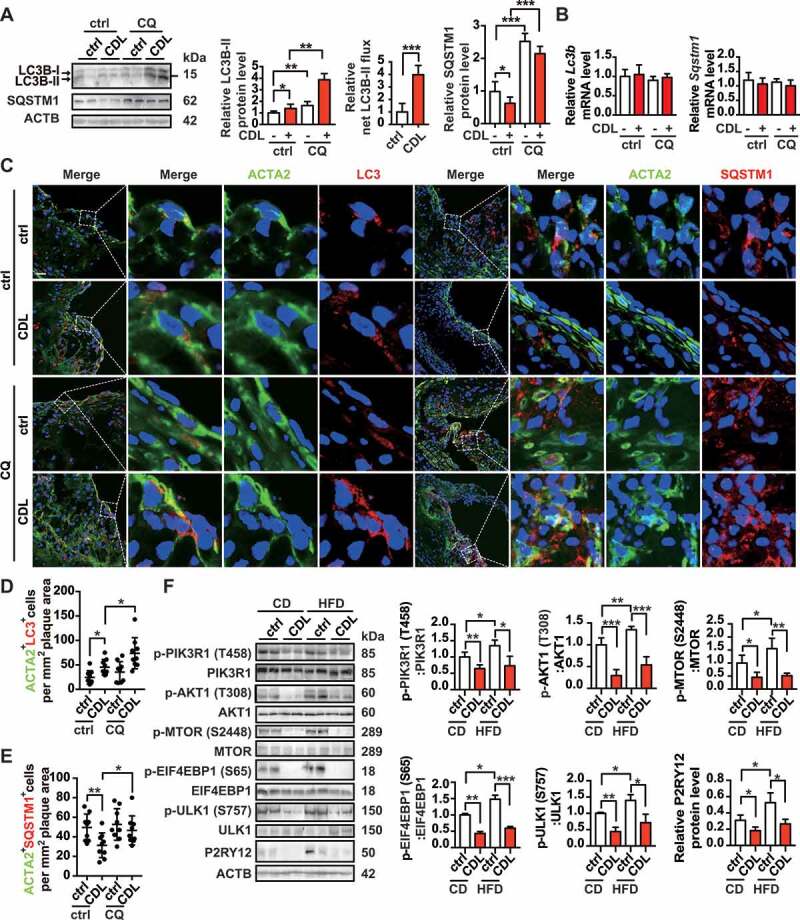
The P2RY12 receptor inhibitor induces autophagy in advanced atherosclerosis. (A) Immunoblot analysis of the expression of LC3B and SQSTM1 in extracts from the aortas of mice in the indicated group. apoe-/- mice were given HFD for 8 weeks to induce atherosclerotic lesions and maintained on a HFD for another 4 weeks, during which ctrl, CDL or CQ (50 μmol/L) was administered. Quantitative data represent the fold-change observed after normalizing the indicated protein band intensities relative to ACTB. LC3B-II flux is calculated in the middle. (B) Quantitative real-time PCR analysis of the mRNA levels of Lc3b and Sqstm1 in extracts from the aortas of mice in ctrl, CDL, CQ, or CQ + CDL group. Data are normalized to Actb expression. (C) apoe-/- mice were given HFD for 8 weeks to induce atherosclerotic lesions and maintained on a HFD for another 4 weeks, during which ctrl, CDL or CQ was administered. ACTA2 (green)-LC3 (red) and ACTA2 (green)-SQSTM1 (red) in aortic root sections of these groups were then estimated. Nuclei are shown in blue. Scale bar: 50 μm. The number of ACTA2+ LC3+ cells (D) or ACTA2+ SQSTM1+ cells (E) per mm2 of plaques in the indicated groups is presented (n = 9 per group). (F) Representative western blots (left) of extracts obtained from the aortas of mice among the indicated groups and normalized ratios of p-MTOR:MTOR, p-ULK1:ULK1, p-PIK3R1:PIK3R1, p-AKT1:AKT1, and p-EIF4EBP1:EIF4EBP1 and fold-change differences in P2RY12 after normalizing the indicated protein band intensities to that of ACTB. All data are presented as the mean ± SEM of 3 to 5 independent experiments. *, P < 0.05; **, P < 0.01; ***, P < 0.001
Additionally, we analyzed LC3 and SQSTM1 in VSMCs in the carotid plaques of patients in the ctrl and CDL group by immunofluorescence staining (Fig. S4D). Compared with the ctrl group, we found that the number of ACTA2+ LC3+ cells per mm2 plaque area was higher, and the number of ACTA2+ SQSTM1+ cells was lower in carotid plaques relative to plaque area (Fig. S4E). Since the P2RY12 receptor activation regulates foam cell formation by impairing autophagy through the PI3K-AKT-MTOR signaling pathway in vitro, we further evaluated these proteins and related phosphorylation sites in the aortas of apoe-/- mice. In accordance with our observations in vitro, we found that compared with the vehicle group, the P2RY12 receptor inhibitor significantly inhibited the phosphorylation of PIK3R1, AKT1, MTOR, ULK1, and EIF4EBP1 regardless of whether the CD or HFD group was evaluated (Figure 8F). We also found that the percentage of VSMCs positive for the phosphorylation form of PIK3R1, AKT1, MTOR, and ULK1 were less in the carotid plaques of patients in CDL group than in ctrl group, while the percentage of VSMCs positive for PIK3R1, AKT1, MTOR, and ULK1 remained unchanged between this two group (Fig. S9). These results suggest that the inhibition of the P2RY12 receptor induces autophagy in advanced atherosclerosis.
The P2RY12 receptor inhibitor ameliorates VSMC-derived foam cell formation by inducing autophagy in advanced atherosclerosis
We then investigated whether CQ blocked the lipid core-reducing effects of the P2RY12 receptor inhibitor and its effect on VSMC-derived foam cells in advanced atherosclerosis. We first evaluated lipid deposition in the aortic arch by ORO. We found that CQ impeded the reduction in the area of plaque caused by CDL in the aortic arch (Figure 9A). We further explored plaque character and lipid deposition in the aortic root using ORO or BODIPY staining. We found that CQ blocked the effect of CDL in reducing lipid accumulation in the aortic root (Figure 9C-E). In addition, the body weights and lipid profiles of these four groups were not significantly different (Figure 9B, S1E, and S1 F). We further stained the plaques in the aortic root with VSMC-specific marker antibodies and BODIPY (Figure 9C). The effect of the P2RY12 receptor inhibitor (CDL) on the reduction in VSMC-derived foam cells was also blocked by CQ (Figure 9F,G). Additionally, we found similar results with TIC (Fig. S8E-M). These results suggest that inhibition of the P2RY12 receptor mitigates lipid deposition and VSMC-derived foam cell formation by inducing autophagy in advanced atherosclerosis.
Figure 9.
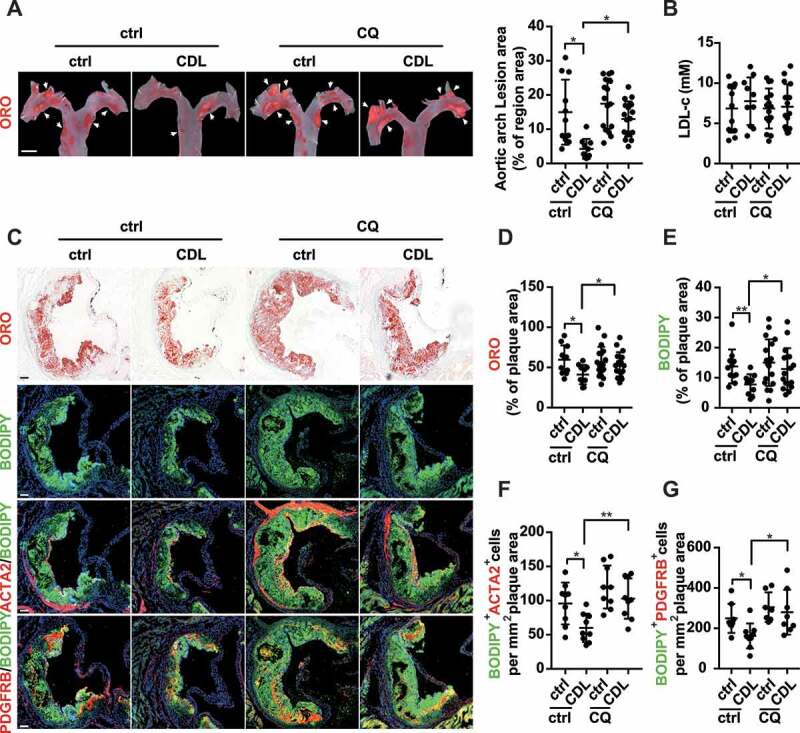
The P2RY12 receptor inhibitor ameliorates VSMC-derived foam cell formation by inducing autophagy in advanced atherosclerosis. apoe-/- mice were given HFD for 8 weeks to induce atherosclerotic lesions and maintained on HFD for another 4 weeks, during which ctrl, CDL or CQ was administered. (A) ORO image of aortic arches obtained from mice in the indicated groups (left). Scale bar: 2 mm. White arrows indicate plaques in the aorta. Lesions were calculated as a percentage of the surface area of the aortic arch (n = 11, 10, 16, and 17, respectively). (B) Serum LDL-c levels in mice in the ctrl, CDL, CQ, or CQ + CDL groups (n = 11, 10, 15, and 15, respectively). (C) Representative images of aortic root sections obtained from ctrl, CDL, CQ, and CQ + CDL groups stained with ORO, ACTA2-BODIPY, or PDGFRB-BODIPY. Scale bar: 20 μm. For fluorescence images, Nuclei were stained with DAPI (blue). The percentage of the plaque area that was occupied by ORO (D) or BODIPY (E) are presented (n = 11, 10, 18, and 17, respectively) among indicated groups. The number of ACTA2+ BODIPY+ cells (F, n = 9 per group) or PDGFRB+ BODIPY+ cells (G, n = 8, 9, 7 and 8, respectively) per mm2 of plaques in the indicated groups is presented. All data are presented as the mean ± SEM from 3 to 5 independent experiments. *, P < 0.05; **, P < 0.01
Discussion
Our study demonstrates that activation of the P2RY12 receptor promotes VSMC-derived foam cell formation and lipid accumulation by inhibiting autophagy through the PI3K-AKT-MTOR signaling pathway in advanced atherosclerosis. We propose a model that explains the relationships among the P2RY12 receptor, the lipophagic flux of VSMC-derived foam cells, and atherosclerosis (Graphical Abstract 1).
The mammalian P2RY12 receptor is first found to be expressed on platelets and is responsible for amplifying and sustaining platelet activation, which results in platelet aggregation and coagulation [24]. Recent clinical and animal studies have suggested that P2RY12 receptor inhibitors may play a role in anti-atherosclerosis effects by targeting the vessel wall P2RY12 receptor but not the platelet P2RY12 receptor [5–9]. Our previous study demonstrated that the P2RY12 receptor promotes the progression of atherosclerosis by enhancing VSMC migration [12]. Phenotype transformation of VSMC is an important characteristic during the process of atherosclerosis [31,32]. In our previous study, we found that activating or inhibiting the P2RY12 receptor of VSMCs does not affect the protein level of VSMC-specific ACTA2, CNN (calponin), TAGLN, and MYH11 (data not shown). We also detected the mRNA levels of VSMC phenotype transformation-related molecules such as Lgals3, Tcf21, and Lum (lumican) in P2ry12 silencing and control VSMCs (data not shown). Importantly, our current data demonstrated that P2RY12 receptor inhibitors alleviated necrotic lesion size, lipid accumulation, and VSMC-derived foam cells in advanced atherosclerosis independent of serum LDL-c levels and exerted a synergistic anti-atherosclerotic effect with statins. Statins are a class of drugs frequently prescribed to lower plasma levels of cholesterol and used for the primary and secondary prevention of atherosclerotic vascular diseases, such as stroke, cardiovascular disease, and peripheral vascular diseases. However, even in patients undergoing intensive statin therapy, residual risk remains in the form of additional vascular events, and in some patients, atherosclerotic plaques still show no significant changes [2]. More recent data have shown that PCSK9, a serine protease, actively targets LDL-R and causes its excessive accumulation, while PCKS9 inhibitors markedly reduce LDL-c levels and reverse plaques. However, the high cost of these compounds and a lack of long-term safety and efficacy data limit their use in high-risk patients unable to meet lipid targets on maximal medication regimes [3]. P2RY12 receptor inhibitors, such as CDL, have been applied in the secondary prevention of stroke and cardiovascular disease (CVD), and their safety has been confirmed. We found that lipid deposition was much lower in mice in the CDL group than in those in the ctrl group. Even under HFD conditions, CDL-treated mice had less lipid deposition than was observed in ctrl-treated mice. In the present study, we found that P2RY12 receptor inhibitors could affect lipid accumulation and VSMC-derived foam cell formation in advanced atherosclerosis independent of serum LDL-c levels, and they may, therefore, represent a potential new treatment option for atherosclerosis.
VSMCs are a source of foam cells, which are the defining pathologic characteristic of atherosclerotic plaques [33]. Moreover, the presence of VSMC-derived foam cells in atherogenesis has been hitherto underestimated. It has been reported that a very large part of human coronary artery intimal foam cells were derived from VSMCs (at least 50%) [15]. In our study, we used ACTA2, MYH11, TAGLN, and PDGFRB to label VSMCs in plaques [23] and found that 44.5% of foam cells originated from VSMCs (data not shown). Among then, ACTA2, MYH11, TAGLN are specific markers for the contractile phenotype of VSMCs. PDGFRB is used for indicating the synthetic phenotypes of VSMCs, but it cannot rule out other mesenchymal cells like fibroblasts and pericytes. Intracellular lipid homeostasis reflects the balance between cholesterol uptake and cholesterol efflux. Any disruption to this balance will lead to cholesterol overloading and foam cell formation. Initially, the uptake of modified LDL, such as oxidized or glycosylated LDL, via a scavenger receptor, was thought to be the main pathway for cholesterol accumulation and foam cell formation [34]. However, in the present study, we found that the P2RY12 receptor promotes VSMC-derived foam cell formation by inhibiting cholesterol efflux. Cholesterol efflux that occurs via macrophage foam cells includes intracellular LDs cholesteryl ester hydrolysis, cholesterol reverse transport from plaques, and circulation to the liver for metabolism [35]. Foam cells originating from VSMCs exhibit selective loss of the ABCA1 cholesterol reverse transporter [17]. However, we did not find that the P2RY12 receptor affected the expression of the cholesterol reverse transporters ABCA1 and ABCG1. Therefore, we speculated that the P2RY12 receptor could affect cholesteryl ester hydrolysis to promote VSMC-derived foam cell formation. Two main signaling pathways have been shown to act downstream of the P2RY12 receptor in platelets; these include the cAMP-PKA and PI3K-AKT pathways [25]. To determine the P2RY12 receptor signaling pathway, including VSMC-derived foam cell formation, we used two signaling pathway inhibitors and found that the P2RY12 receptor induced lipid accumulation and foam cell formation via the PI3K-AKT pathway.
To identify the exact mechanism by which the P2RY12 receptor induced lipid accumulation and VSMC-derived foam cell formation, phosphoproteomics analysis performed in VSMCs showed that the activation of the P2RY12 receptor significantly changed the phosphorylation levels of CAMKK2/CaMkkβ, RAF1, PRKACB, PIK3C3/VPS34, RB1CC1/FIP200, and ATG2B. These proteins were all located in the membrane nucleation process, suggesting that autophagy was regulated in the initial phase and involved in two possible mechanisms: upstream autophagy-regulatory signaling pathways, such as AMPK or MTOR, or the initial steps of vesicle nucleation via activated PIK3C3. Accumulating evidence demonstrates that autophagy plays an important role in cholesterol efflux and that defects in autophagy can influence the progression of several chronic diseases, such as atherosclerosis [36]. Ksenya Shchors et al. demonstrated that ticlopidine, an inhibitor of the P2RY12 receptor, promotes autophagy and reduces glioma cell viability [19]. In this study, we showed that the activation of the P2RY12 receptor resulted in autophagy flux impairment and facilitated lipid accumulation and VSMC-derived foam cell formation. The inhibition or knockdown of the P2RY12 receptor could reverse autophagy flux. The activation of the P2RY12 receptor decreased both the content of LC3B-II and the number of autophagosomes regardless of whether CQ was added, suggesting that P2RY12 receptor activation impedes the formation of autophagosomes. Furthermore, we investigated the potential mechanisms underlying how the P2RY12 receptor inhibits autophagy. Based on the phosphoproteomics results, we tested the autophagy pathway and found that AKT suppressed autophagy by directly repressing MTOR via the phosphorylation of Ser2448. The phosphorylated levels of MTOR were reversed when PIK3R1 or AKT1 was inhibited. In addition, many studies have also reported on the involvement of the PI3K-AKT-MTOR pathway. Moore et al. reported that the P2RY12 receptor activates MTOR by phosphorylating TSC2 at Ser939. In this study, we found that the P2RY12 receptor suppressed autophagy via the PI3K-AKT-MTOR pathway. Previous studies have shown that MTOR plays a key role in the regulation of autophagy [37], and Ksenya Shchors et al. demonstrated that the P2RY12 receptor inhibitor ticlopidine increases cAMP levels to increase autophagic flux [19]. Our results show that P2RY12 receptor inhibitors enhanced cholesterol lipolysis and decreased VSMC-derived foam cell formation in vivo by modulating autophagy.
In conclusion, our study reveals that the P2RY12 receptor is essential in maintaining VSMC lipophagic flux and cholesterol homeostasis in advanced atherosclerosis. Our results shed light on the links between the P2RY12 receptor and lipophagic flux in VSMC-derived foam cell formation. Additionally, these results also suggest that P2RY12 receptor inhibitors, such as CDL or TIC, might be useful for treating atherosclerosis and defective lipophagy-related diseases.
Materials and methods
Study sample
The present study sample comprises participants enrolled in the Clopidogrel Enhance Statin on Atherosclerosis Regression (CESAR) trial, a prospective population-based cohort study developed to evaluate the effects of statin monotherapy or statin plus CDL combination therapy on carotid atherosclerosis (China Clinical Trials number, ChiCTR1800016747). This study was approved by the Medical Ethics Committee of Huazhong University of Science and Technology, Wuhan, China. All participants gave informed consent. Patients with carotid atherosclerosis were randomized into two groups: a statin (ATV) treatment group and a statin (ATV) plus CDL group. Briefly, subjects were eligible for enrollment if they were (1) patients with carotid atherosclerosis, (2) ≥18 years old, and (3) without a history of stroke, myocardial infarction, or chronic inflammatory conditions, such as systemic lupus erythematosus, Lyme disease, gonococcal arthritis, or bacterial endocarditis. Clinical information included age, sex and the presence of cardiovascular risk factors (hypertension [history of hypertension or systolic blood pressure >140 mmHg or diastolic blood pressure > 90 mmHg], diabetes mellitus [fasting blood glucose level ≥ 6.99 mmol/L or the subject’s self-report of diabetes, insulin use, or oral hypoglycemic use], cholesterol level, and current tobacco use [within a year]). Carotid artery plaque was assessed by high-resolution ultrasound according to a standard scanning and reading protocol. Six locations of the carotid artery were examined for plaque presence: the far walls and near walls of the common carotid artery, the bifurcation, and the internal carotid artery [38,39]. The MCPT was measured at the highest plaque prominence in any of the six assessed locations at baseline and after six months during follow-up. The present study sample was enrolled between June 2018 and November 2019.
Human carotid artery plaques were collected from patients with symptomatic or asymptomatic carotid artery stenosis ≥ 70% as detected by duplex sonography and confirmed using computed tomography angiography undergoing carotid endarterectomy. The control patients only received aspirin treatment (100 mg/d), while the CDL group received both CDL (75 mg/d) and aspirin (100 mg/d) treatments before surgery. All procedures involving human samples were approved by the Medical Ethics Committee of Huazhong University of Science and Technology, Wuhan, China. Informed consents were obtained from all participating patients.
Reagents and antibodies
The following reagents were used: NBD-cholesterol (Life Technologies, N1148; 1 μg/mL), ADPβs (Sigma-Aldrich, M3763; 10 μmol/L), 2-MeSAMP (Sigma-Aldrich, M1434; 100 μmol/L), CQ (Sigma-Aldrich, C6628; 50 μmol/L), LY294002 (Sigma-Aldrich, L9908; 50 µM), APOA1 (Sigma-Aldrich, A0722; 10 μg/mL), rapamycin (Sigma-Aldrich, V900930; 1 μmol/L), MK2206 (Selleck Chemicals, S1078; 5 µM), dbcAMP (Enzo Life Sciences, CN1254-0030; 0.02 mM), 8-CPT-cAMP (Enzo Life Sciences, CN130-0020; 0.02 mM), ox-LDL (Yiyuan Biotech, YB-002; 50 μg/mL) and HDL (Yiyuan Biotech, YB-003; 50 μg/mL). The following primary antibodies were used: anti-LC3 (Medical & Biological Laboratories Co, PM036), anti-SQSTM1 (Cell Signaling Technology, 23214 and 88588), anti-ATG5 (Cell Signaling Technology, 12995), anti-p-PIK3R1/PI3 K p85-T458 (Cell Signaling Technology, 4228), anti-p-AKT1-T308 (Cell Signaling Technology, 13038), anti-AKT1 (Cell Signaling Technology, 4691), anti-BECN1/Beclin-1 (Cell Signaling Technology, 3495), anti-p-BECN1-S15 (Cell Signaling Technology, 84966), anti-PRKAA1 and PRKAA2 (Cell Signaling Technology, 5831), anti-p-PRKAA1-T172 and p-PRKAA2-T172 (Cell Signaling Technology, 2535), anti-p-MTOR-S2448 (Cell Signaling Technology, 5536), anti-MTOR (Cell Signaling Technology, 2983), anti-p-ULK1-S757 (Cell Signaling Technology, 14202), anti-ULK1 (Cell Signaling Technology, 8054), anti-p-EIF4EBP1-S65 (Cell Signaling Technology, 9451), anti-EIF4EBP1 (Cell Signaling Technology, 9644), anti-ACTA2 (Abcam, ab5694), anti-ABCA1 (Abcam, ab18180), anti-ABCG1 (Abcam, ab36969), anti-LC3B (Abcam, ab48394), anti-PDGFRB/PDGFRβ (Abcam, ab69506), anti-MYH11 (Abcam, ab683), anti-MSR1 (Sangon Biotech, D122703), anti-CD36 (Sangon Biotech, D161529), anti-OLR1 (Sangon Biotech, D260927), anti-ACTA1 (Sangon Biotech, D121592), anti-PIK3R1 antibody (Proteintech, 60225), anti-TAGLN (Proteintech, 10493), anti-ACTB (actin beta) (Abconal, AC026), anti-ACTA2 (Servicebio, GB13044), anti-P2RY12 receptor (OriGene, TA328648). The following secondary antibodies were used for western blot experiments: anti-mouse (Abconal, AS003) and anti-rabbit (Abconal, AS014) HRP-conjugated IgGs. The following secondary antibodies were used for confocal microscopy experiments: anti-mouse Alexa Fluor 488-conjugated (Thermo Fisher Scientific, R37114), anti-mouse Alexa Fluor 594-conjugated (Thermo Fisher Scientific, R37115), anti-rabbit Alexa Fluor 488-conjugated (Thermo Fisher Scientific, R37118), anti-rabbit IgG (H + L) cross-adsorbed Cyanine3 (Thermo Fisher Scientific, A-11008), anti-rat Alexa Fluor 594-conjugated (Thermo Fisher Scientific, A-21209).
Animals
Male apoe-/- mice were obtained at 8 weeks of age from Hua Fukang Experimental Animal Center (Beijing, China). Mice were fed a HFD consisting of 1.25% cholesterol and 20% fat (Special Diet Services, D12079B) for 8 weeks to induce advanced plaques. Then, these mice were randomly assigned to a normal chow diet (CD) or a HFD for another 4 weeks in addition to daily treatment with CDL (Plavix, 20 mg/kg), ATV (Lipitor, 10 mg/kg), CDL + ATV, or vehicle control (ctrl) by means of jelly administration, as described elsewhere [9]. To check autophagy flux in vivo, the mice were intraperitoneally preinjected with CQ (50 mg/kg, dissolved in 0.9% NaCl) every other day [40–42]. Sterile 0.9% NaCl (Baxter International Inc., H19983148) was intraperitoneally administered as a control treatment.
Atherosclerotic lesion analysis
Whole aortas were excised from the aortic root to the iliac bifurcation, carefully peeled of perivascular fat and opened longitudinally. Subsequently, the aortas were pinned enface, stained with ORO, and photographed with a digital camera (Nikon, Japan). The total surface area and ORO-positive lesion area were measured using NIS-element software (Nikon Instruments, Thames, UK). The percent surface area occupied by the ORO-positive area was assessed.
Lipid measurement
Blood from fasting mice was collected into BD Vacutainer Plus plasma tubes (BD Biosciences, 367960) by cardiac puncture and centrifuged at 1,300 g for 10 min at 4°C, to collect the serum. The total cholesterol, HDL, LDL and triglycerides levels in the serum were measured by a microplate spectrophotometer using Total cholesterol assay kit (Nanjing Jiancheng Bioengineering Institute, A111-1-1), High-density lipoprotein cholesterol assay kit (Nanjing Jiancheng Bioengineering Institute, A112-1-1), Low-density lipoprotein cholesterol assay kit (Nanjing Jiancheng Bioengineering Institute, A113-1-1) and triglyceride assay kit (Nanjing Jiancheng Bioengineering Institute, A110-1-1) according to the manufacturer’s protocol.
Histology and immunofluorescence staining
ORO, HE, Masson and EVG staining were performed on serial sections (5 μm thick) of aortic root samples. Then, the sections were observed under an optical microscope (Olympus, Japan). For immunofluorescence staining, serial sections were incubated with antibodies against LC3 (Medical & Biological Laboratories Co, PM036), SQSTM1, ACTA2 or PDGFRB. VSMCs were fixed, permeabilized, and then incubated with antibodies against LC3 (PM036). The immune complexes were detected by fluorescently labeled secondary antibodies, and 4ʹ,6-diamidino-2-phenylindole (DAPI) (Beyotime, C1005) was used to stain nuclei. The sections or VSMCs were observed under a Nikon A1-Si confocal microscope (Nikon, Tokyo, Japan). For sections, the positive area and positive cell count relative to plaque were measured by NIS-element software (Nikon Instruments, Thames, UK) as reported [43,44]. For VSMCs, the number of LC3-positive dots per cell was measured using ImageJ software.
Cell culture and transfection
Mouse aortic VSMCs were obtained as previously described [12,45]. Cells were cultured in Dulbecco’s Modified Eagle Medium/Nutrient Mixture F-12 (HyClone, SH30023.01) supplemented with 10% fetal bovine serum (ScienCell, 0500) and 1% penicillin/streptomycin (Biosharp, BL505A) and incubated at 37°C in humidified 5% CO2. VSMCs were used from passages 5–20. For the genetic knockdown of the P2RY12 receptor, VSMCs were transfected with previously constructed shP2ry12 or shctrl vector lentiviruses [12]. The expression level of the P2RY12 receptor was detected 3 d later by western blotting and PCR. For the genetic knockdown of Atg5 and Mtor, cells were transfected with a siRNA (Ribobio) against Atg5 or Mtor or a ctrl siRNA using Lipofectamine 2000 (Invitrogen, 11668) according to the manufacturer’s protocol. The 3 target sequences of the siRNAs against Atg5 were as follows: ACCGGAAACTCATGGAATA, ATCTGAGCTACCCAGATAA, and GCATCTGAGCTACCCAGAT, and the 3 target sequences of the siRNAs against Mtor were as follows: GCATATGGCCGAGATTTAA, GGTCATGCCCACATTCCTT, and GGAAGATCCTGCACATTGA.
ORO staining
VSMCs were fixed in 4% PFA in phosphate-buffered saline (PBS) (Servicebio, G0002) and then rinsed with PBS three times. The cells were then stained with ORO for 30 min at room temperature. Staining was assessed by optical microscopy (Olympus, Japan) and quantified by ImageJ software (NIH) after appropriate thresholding.
BODIPY staining
LDs were stained by incubating the cells or sections with 4,4-difluoro-1,3,5,7,8-pentamethyl-4-bora-3a,4a-diaza-s-indacene (BODIPY) (Thermo Fisher Scientific, D3922) for 30 min, followed by processing for immunofluorescence as described previously [46]. Staining was assessed by Olympus IX73 fluorescence microscopy (Olympus, Japan) or Nikon A1-Si confocal microscopy (Nikon, Tokyo, Japan). Quantification was performed using ImageJ software after appropriate thresholding.
LysoTracker Red staining
After the designated treatments, the lysosomes in living cells were highlighted with LysoTracker Red (Beyotime, C1046) at 75 nM for 60 min at 37°C according to the manufacturer’s protocol. The nuclei were visualized by Hoechst 33342 (Solarbio, C0031). Quantification was performed using ImageJ software.
Analysis of total cholesteryl content
Intracellular total cholesterol levels were measured using a cholesterol fluorometric assay kit (Cayman Chemical, 10007640) [47]. VSMCs cultured in 6-well plates were lysed with 0.5% Triton X-100 (Sinoparm Chemical Reagent Co., 30188928) and centrifuged at 18000 g at 4°C for 30 min. The supernatants were then used for cholesterol measurements. The level of intracellular cholesterol was normalized to the protein concentration of the sample.
Analysis of DIL-oxLDL uptake
The method used to analyze the uptake of dioctadecyl-3,3,3,3-tetramethylin docarbocyanine-oxLDL (DIL-oxLDL) (Yiyuan Biotech, YB-0010) has been described elsewhere [48]. VSMCs were supplemented with DIL-oxLDL at 10 μg/ml for 4 h and then washed with PBS. The uptake of DIL-oxLDL was analyzed in immunofluorescence images. Moreover, flow cytometry was also performed, and the mean fluorescence intensity (mFI) was calculated.
Cholesterol efflux assay
Cholesterol efflux was determined as described elsewhere [49,50]. Briefly, VSMCs were incubated with NBD-cholesterol for 4 h. After cholesterol loading, the cells were washed, equilibrated for 2 h and incubated for 4 h with Dulbecco’s Modified Eagle Medium containing no phenol red (Gibco, 21063) with 0.2% BSA (Biofroxx, 9048-46-8) and APOA1 or HDL. Control wells were treated with only 0.2% BSA to measure the background. The medium was collected, and the cells were lysed at 37°C with 0.3 M NaOH solution (Sinopharm Chemical Reagent Co., 10019718) for 15 min. The fluorescence intensity of the cell lysate and cell culture supernatant was measured with a microplate spectrophotometer. The efflux rate was calculated as follows: Efflux (%) = medium counts:(medium counts + cell lysate counts) x 100.
Autophagic flux
VSMCs were transfected with ad-mRFP-GFP-Lc3 (Hanbio) according to the manufacturer’s protocol. The cells were washed 24 h later with PBS (Hyclone, SH30256.01) and replaced with serum-free medium supplemented with ADPβs or 2-MeSAMP for the indicated time. Then, the cells on coverslips were fixed with 4% PFA for 15 min and washed with PBS. The cells were examined using confocal microscopy for mRFP and GFP fluorescence by Nikon A1-Si confocal microscopy (Nikon, Tokyo, Japan). The number of mRFP+ GFP+ and mRFP+ GFP− dots were analyzed using ImageJ software as reported [51]. The data was measured for each treatment condition, and > 20 cells were analyzed for each population.
Western blot analysis
Cell lysate and aorta homogenate were obtained by RIPA lysis buffer (Beyotime, PM0013B) containing complete protease inhibitors (Wuhan goodbio technology CO., G2006, G2008, G2007-1 and G2007-1) To completely solubilize LC3B-II from cells or tissue, we used SDS lysis buffer (1% SDS) containing complete protease inhibitors [52–54]. Cell lysates and aorta homogenates were then subjected to western blot analysis. The membranes were incubated with the following rabbit antibodies: MSR1, OLR1, CD36, ACAT1, ABCA1, ABCG1, ATG5, SQSTM1, LC3B (Abcam, ab48394), total and p-BECN1-S15, total and p-PRKAA-T172, total and p-MTOR-S2448, total and p-ULK1-S757, total and p-AKT1-T308, total and p-PIK3R1-T458, and total and p-EIF4EBP1-S65. ACTB was used as a loading control. Detection was performed using a BioSpectrum Imaging System (UVP, Upland, CA, USA). To get the unsaturated bands with the intensities in the linear range, a short pre-exposure was used to calculate the signal intensity. The band intensity was analyzed by ImageJ software. Net LC3B-II flux was determined by subtracting the densitometric value of CQ-untreated LC3B-II from corresponding CQ-treated LC3B-II value [52,55,56].
Real-time PCR
Total RNA was extracted from VSMCs and aortas using Trizol reagent (Invitrogen, 15596026). cDNA was amplified using a SYBR Premix Ex TaqTM Kit (Takara, RR420A) on a thermocycler (Bio-Rad, Hercules, CA, USA). The primers for the P2ry12 receptor were 5ʹ- TACCCTACAGAAACACTCAAGG −3ʹ (forward) and 5ʹ- GTGGTATTGGCTGAGGTGGT −3ʹ (reverse). The primers for Lc3b transcript variant 1 (NM_026160.5) were 5ʹ- AGGGGACCCTAACCCCATAG −3ʹ (forward) and 5ʹ- CCCCTGACACTGCTCTTCTG −3ʹ (reverse). The primers for Lc3b transcript variant 2 (NM_001364358.1) were 5ʹ- AGATCCCAGTGATTATAGAGCGA −3ʹ (forward) and 5ʹ- AACCACATCCTAAGGCCAGC −3ʹ (reverse). The primers for Lc3b, which could test both of Lc3b transcript variant 1 and 2 were 5ʹ- TTATAGAGCGATACAAGGGGGAG −3ʹ (forward) and 5ʹ- CGCCGTCTGATTATCTTGATGAG −3ʹ (reverse). The primers for Sqstm1 were 5ʹ- ATGTGGAACATGGAGGGAAGA −3ʹ (forward) and 5ʹ-GGAGTTCACCTGTAGATGGGT −3ʹ (reverse). The primers for Actb were 5ʹ- GTACCACCATGTACCCAGGC −3ʹ (forward) and 5ʹ- AACGCAGCTCAGTAACAGTCC −3ʹ (reverse). Actb served as the control for comparison. qRT-PCR was performed in triplicate and repeated in at least three separate experiments. Data analysis was performed using the comparative CT method as previously described [57].
Electron microscopy
The cells were fixed with 2.5% glutaraldehyde. After the tissues were submitted to ethanol dehydration and embedded in LX112 resin (LADD Research Industries), ultrathin sections were sliced by an Ultrathin Slicer (EM UC7 (Leica, German) and stained with uranyl acetate followed by lead citrate. All grids were viewed on a transmission electron microscope (Tecnal G2 20 TWIN, FEI, USA) at 200 kV. Morphometric analysis was performed using ImageJ in 15–20 different micrographs for each condition after thresholding. Autophagic vacuoles (AVs) were identified using previously established criteria [27].
Phosphoproteomic analysis
Phosphoproteomic analysis was conducted as described elsewhere [58]. Briefly, VSMCs were treated in the presence or absence of ADPβs (three samples per group) and used for proteomic analysis in the study. SDT buffer was added to the samples. The lysate was sonicated, boiled and centrifuged to obtain the supernatant. Protein concentrations were determined using BCA Protein Assay Kits (Bio-Rad, USA). Twenty micrograms of proteins were separated on a 12.5% SDS-PAGE gel and visualized by Coomassie Blue R-250 staining. Then, 200 μg of proteins obtained from each sample were washed, blocked, and digested to obtain peptides. The peptides of each sample were desalted on C18 Cartridges (Empore™ SPE Cartridges C18 [standard density], bed I.D. 7 mm, volume 3 ml, Sigma), concentrated by vacuum centrifugation and reconstituted in 40 µl of 0.1% (v:v) formic acid (Sigma-Aldrich, 33015). The peptide content was estimated by UV light spectral density at 280 nm. The lyophilized peptides were resuspended, and TiO2 beads (shimadzu, 5020–75000) were used to enrich the phosphorylated peptides. Each fraction was injected for nanoLC-MS/MS analysis. A Q Exactive mass spectrometer (Thermo Scientific) was used for LC-MS/MS analysis. The MS data were analyzed using MaxQuant software version 1.5.3.17 (Max Planck Institute of Biochemistry in Martinsried, Germany). The FASTA protein sequences of differentially changed proteins were blasted against the online Kyoto Encyclopedia of Genes and Genomes (KEGG) database (http://geneontology.org/) to retrieve their KOs and subsequently mapped to pathways in KEGG [59]. The corresponding KEGG pathways were extracted. Benjamini-Hochberg correction for multiple testing was further applied to adjust derived p-values. For phosphoproteomic analysis, we thank Shanghai Applied Protein Technology Co., Ltd. for technological assistance.
Statistical analysis
Quantitative data are presented as the mean ± SEM and represent 3 to 5 independent experiments. The results were analyzed using Student’s t-test or one-way ANOVA using SPSS 13.0 statistical software (SPSS Inc.), and differences with P < 0.05 were considered statistically significant.
Supplementary Material
Funding Statement
This work was supported by grants from the National Natural Science Foundation of China (No. 81820108010 to B.H., No. 81571139 and 81974182 to L.M.), the National Key Research and Development Program of China (no. 2018YFC1312200 to B.H.), the National Natural Science Foundation of China (No. 81771249 to Y.P.X. and No. 81671147 to H.J.J.), and the Natural Science Foundation of Hubei Province of China (No. 2016CFB518 to B.H.).
Disclosure statement
No potential conflict of interest was reported by the authors.
Supplementary material
Supplemental data for this article can be accessed here.
References
- [1].Herrington W, Lacey B, Sherliker P, et al. Epidemiology of atherosclerosis and the potential to reduce the global burden of atherothrombotic disease. Circ Res. 2016. February 19;118(4):535–546. [DOI] [PubMed] [Google Scholar]
- [2].Ward NC, Watts GF, Eckel RH.. Statin Toxicity. Circ Res. 2019;124(2):328–350. [DOI] [PubMed] [Google Scholar]
- [3].Solanki A, Bhatt LK, Johnston TP. Evolving targets for the treatment of atherosclerosis. Pharmacol Ther. 2018;187:1–12. [DOI] [PubMed] [Google Scholar]
- [4].Hechler B, Gachet C. Purinergic receptors in thrombosis and inflammation. Arterioscler Thromb Vasc Biol. 2015;35(11):2307–2315. [DOI] [PubMed] [Google Scholar]
- [5].Amarenco P, Albers GW, Denison H, et al. Efficacy and safety of ticagrelor versus aspirin in acute stroke or transient ischaemic attack of atherosclerotic origin: a subgroup analysis of SOCRATES, a randomised, double-blind, controlled trial. Lancet Neurol. 2017;16(4):301–310. [DOI] [PubMed] [Google Scholar]
- [6].CAPRIE Steering Committee. A randomised, blinded, trial of clopidogrel versus aspirin in patients at risk of ischaemic events (CAPRIE). Lancet. 1996;348(9038):1329–1339. [DOI] [PubMed] [Google Scholar]
- [7].Ringleb PA, Bhatt DL, Hirsch AT, et al. Benefit of clopidogrel over aspirin is amplified in patients with a history of ischemic events. Stroke. 2004;35(2):528–532. [DOI] [PubMed] [Google Scholar]
- [8].Bhatt DL, Flather MD, Hacke W, et al. Patients with prior myocardial infarction, stroke, or symptomatic peripheral arterial disease in the CHARISMA trial. J Am Coll Cardiol. 2007. May 15;49(19):1982–1988. [DOI] [PubMed] [Google Scholar]
- [9].West LE, Steiner T, Judge HM, et al. Vessel wall, not platelet, P2Y12 potentiates early atherogenesis. Cardiovasc Res. 2014;102(3):429–435. [DOI] [PubMed] [Google Scholar]
- [10].Lee CW, Hwang I, Park C-S, et al. Comparison of differential expression of P2Y12 receptor in culprit coronary plaques in patients with acute myocardial infarction versus stable angina pectoris. Am J Cardiol. 2011;108(6):799–803. [DOI] [PubMed] [Google Scholar]
- [11].Rauch BH, Rosenkranz AC, Ermler S, et al. Regulation of functionally active P2Y12 ADP receptors by thrombin in human smooth muscle cells and the presence of P2Y12 in carotid artery lesions. Arterioscler Thromb Vasc Biol. 2010. December;30(12):2434–2442. [DOI] [PubMed] [Google Scholar]
- [12].Niu X, Pi SL, Baral S, et al. P2Y12 promotes migration of vascular smooth muscle cells through cofilin dephosphorylation during atherogenesis. Arterioscler Thromb Vasc Biol. 2017. March;37(3):515–524. [DOI] [PubMed] [Google Scholar]
- [13].Shanker G, Kontos JL, Eckman DM, et al. Nicotine upregulates the expression of P2Y12 on vascular cells and megakaryoblasts. J Thromb Thrombolysis. 2006;22(3):213–220. [DOI] [PubMed] [Google Scholar]
- [14].Bartels ED, Christoffersen C, Lindholm MW, et al. Altered metabolism of LDL in the arterial wall precedes atherosclerosis regression. Circ Res. 2015. November 6;117(11):933–942. [DOI] [PubMed] [Google Scholar]
- [15].Allahverdian S, Chehroudi AC, McManus BM, et al. Contribution of intimal smooth muscle cells to cholesterol accumulation and macrophage-like cells in human atherosclerosis. Circulation. 2014. April 15;129(15):1551–1559. [DOI] [PubMed] [Google Scholar]
- [16].Klionsky DJ. Autophagy: from phenomenology to molecular understanding in less than a decade. Nat Rev Mol Cell Biol. 2007. November;8(11):931–937. [DOI] [PubMed] [Google Scholar]
- [17].Ouimet M, Franklin V, Mak E, et al. Autophagy regulates cholesterol efflux from macrophage foam cells via lysosomal acid lipase. Cell Metab. 2011. June 8;13(6):655–667. [DOI] [PMC free article] [PubMed] [Google Scholar]
- [18].Martinet W, De Meyer GRY. Autophagy in Atherosclerosis. Circ Res. 2009;104(3):304–317. [DOI] [PubMed] [Google Scholar]
- [19].Shchors K, Massaras A, Hanahan D. Dual targeting of the autophagic regulatory circuitry in gliomas with repurposed drugs elicits cell-lethal autophagy and therapeutic benefit. Cancer Cell. 2015;28(4):456–471. [DOI] [PubMed] [Google Scholar]
- [20].Amato M, Veglia F, de Faire U, et al. Carotid plaque-thickness and common carotid IMT show additive value in cardiovascular risk prediction and reclassification. Atherosclerosis. 2017. August;263:412–419. [DOI] [PMC free article] [PubMed] [Google Scholar]
- [21].Rubin MR, Rundek T, McMahon DJ, et al. Carotid artery plaque thickness is associated with increased serum calcium levels: the Northern Manhattan study. Atherosclerosis. 2007. October;194(2):426–432. [DOI] [PMC free article] [PubMed] [Google Scholar]
- [22].Shankman LS, Gomez D, Cherepanova OA, et al. KLF4-dependent phenotypic modulation of smooth muscle cells has a key role in atherosclerotic plaque pathogenesis. Nat Med. 2015. June;21(6):628–637. [DOI] [PMC free article] [PubMed] [Google Scholar]
- [23].She ZG, Chang Y, Pang HB, et al. NG2 proteoglycan ablation reduces foam cell formation and atherogenesis via decreased low-density lipoprotein retention by synthetic smooth muscle cells. Arterioscler Thromb Vasc Biol. 2016. January;36(1):49–59. [DOI] [PMC free article] [PubMed] [Google Scholar]
- [24].Gachet C. P2Y(12) receptors in platelets and other hematopoietic and non-hematopoietic cells. Purinergic Signal. 2012. September;8(3):609–619. [DOI] [PMC free article] [PubMed] [Google Scholar]
- [25].Gao Y, Yu C, Pi S, et al. The role of P2Y12 receptor in ischemic stroke of atherosclerotic origin. Cell Mol Life Sci. 2018;76(2):341–354. [DOI] [PMC free article] [PubMed] [Google Scholar]
- [26].Li BH, Yin YW, Liu Y, et al. TRPV1 activation impedes foam cell formation by inducing autophagy in oxLDL-treated vascular smooth muscle cells. Cell Death Dis. 2014. April 17;5(4):e1182. [DOI] [PMC free article] [PubMed] [Google Scholar]
- [27].Singh R, Kaushik S, Wang Y, et al. Autophagy regulates lipid metabolism. Nature. 2009;458(7242):1131–1135. [DOI] [PMC free article] [PubMed] [Google Scholar]
- [28].Jia J, Abudu YP, Claude-Taupin A, et al. Galectins control MTOR and AMPK in response to lysosomal damage to induce autophagy. Autophagy. 2019. January;15(1):169–171. [DOI] [PMC free article] [PubMed] [Google Scholar]
- [29].Martinet W, Verheye S, De Meyer GRY. Everolimus-induced mTOR inhibition selectively depletes macrophages in atherosclerotic plaques by autophagy. Autophagy. 2014;3(3):241–244. [DOI] [PubMed] [Google Scholar]
- [30].Schwarz JB, Langwieser N, Langwieser NN, et al. Novel role of the CXC chemokine receptor 3 in inflammatory response to arterial injury: involvement of mTORC1. Circ Res. 2009. January 30;104(2):189–200. [DOI] [PubMed] [Google Scholar]
- [31].Wirka RC, Wagh D, Paik DT, et al. Atheroprotective roles of smooth muscle cell phenotypic modulation and the TCF21 disease gene as revealed by single-cell analysis. Nat Med. 2019. August;25(8):1280–1289. [DOI] [PMC free article] [PubMed] [Google Scholar]
- [32].Basatemur GL, Jorgensen HF, Clarke MCH, et al. Vascular smooth muscle cells in atherosclerosis. Nat Rev Cardiol. 2019. December;16(12):727–744. [DOI] [PubMed] [Google Scholar]
- [33].Allahverdian S, Chaabane C, Boukais K, et al. Smooth muscle cell fate and plasticity in atherosclerosis. Cardiovasc Res. 2018. March 15;114(4):540–550. [DOI] [PMC free article] [PubMed] [Google Scholar]
- [34].Ouimet M, Marcel YL. Regulation of lipid droplet cholesterol efflux from macrophage foam cells. Arterioscler Thromb Vasc Biol. 2012;32(3):575–581. [DOI] [PubMed] [Google Scholar]
- [35].Randolph GJ. Mechanisms that regulate macrophage burden in atherosclerosis. Circ Res. 2014. May 23;114(11):1757–1771. [DOI] [PMC free article] [PubMed] [Google Scholar]
- [36].De Meyer GRY, Grootaert MOJ, Michiels CF, et al. Autophagy in vascular disease. Circ Res. 2015;116(3):468–479. [DOI] [PubMed] [Google Scholar]
- [37].Kim J, Kundu M, Viollet B, et al. AMPK and mTOR regulate autophagy through direct phosphorylation of Ulk1. Nat Cell Biol. 2011;13(2):132–141. [DOI] [PMC free article] [PubMed] [Google Scholar]
- [38].Rundek T, Arif H, Boden-Albala B, et al. Carotid plaque, a subclinical precursor of vascular events: the Northern Manhattan Study. Neurology. 2008. April 1;70(14):1200–1207. [DOI] [PMC free article] [PubMed] [Google Scholar]
- [39].Carrelli AL, Walker MD, Lowe H, et al. Vitamin D deficiency is associated with subclinical carotid atherosclerosis: the Northern Manhattan study. Stroke. 2011. August;42(8):2240–2245. [DOI] [PMC free article] [PubMed] [Google Scholar]
- [40].Chung KW, Kim KM, Choi YJ, et al. The critical role played by endotoxin-induced liver autophagy in the maintenance of lipid metabolism during sepsis. Autophagy. 2017. July 3;13(7):1113–1129. [DOI] [PMC free article] [PubMed] [Google Scholar]
- [41].Yu Y, Wang L, Delguste F, et al. Advanced glycation end products receptor RAGE controls myocardial dysfunction and oxidative stress in high-fat fed mice by sustaining mitochondrial dynamics and autophagy-lysosome pathway. Free Radic Biol Med. 2017. November;112:397–410. [DOI] [PubMed] [Google Scholar]
- [42].Xu J, Cui X, Li J, et al. Chloroquine improves the response to ischemic muscle injury and increases HMGB1 after arterial ligation. J Vasc Surg. 2018;67(3):910–921. [DOI] [PMC free article] [PubMed] [Google Scholar]
- [43].Hamczyk MR, Villa‐Bellosta R, Quesada V, et al. Progerin accelerates atherosclerosis by inducing endoplasmic reticulum stress in vascular smooth muscle cells. EMBO Mol Med. 2019;11(4):4. [DOI] [PMC free article] [PubMed] [Google Scholar]
- [44].Suzanne M, Eken HJ, Ekaterina C, et al. MicroRNA-210 enhances fibrous cap stability in advanced atherosclerotic lesions. Circ Res. 2017;120(4):633–644. [DOI] [PubMed] [Google Scholar]
- [45].Wu JH, Zhou YF, Hong CD, et al. Semaphorin-3A protects against neointimal hyperplasia after vascular injury. EBioMedicine. 2019. January;39:95–108. [DOI] [PMC free article] [PubMed] [Google Scholar]
- [46].Jeong S-J, Kim S, Park J-G, et al. Prdx1 (peroxiredoxin 1) deficiency reduces cholesterol efflux via impaired macrophage lipophagic flux. Autophagy. 2017;14(1):120–133. [DOI] [PMC free article] [PubMed] [Google Scholar]
- [47].Li Z, Martin M, Zhang J, et al. Kruppel-like factor 4 regulation of cholesterol-25-hydroxylase and liver X receptor mitigates atherosclerosis susceptibility. Circulation. 2017. October 3;136(14):1315–1330. [DOI] [PMC free article] [PubMed] [Google Scholar]
- [48].Le Guezennec X, Brichkina A, Huang YF, et al. Wip1-dependent regulation of autophagy, obesity, and atherosclerosis. Cell Metab. 2012. July 3;16(1):68–80. [DOI] [PubMed] [Google Scholar]
- [49].Liu Y, Zhong Y, Chen H, et al. Retinol-binding protein-dependent cholesterol uptake regulates macrophage foam cell formation and promotes atherosclerosis. Circulation. 2017. April 4;135(14):1339–1354. [DOI] [PubMed] [Google Scholar]
- [50].Rousselle A, Qadri F, Leukel L, et al. CXCL5 limits macrophage foam cell formation in atherosclerosis. J Clin Invest. 2013. March;123(3):1343–1347. [DOI] [PMC free article] [PubMed] [Google Scholar]
- [51].Yoshii SR, Mizushima N. Monitoring and measuring autophagy. Int J Mol Sci. 2017. August 28;18(9):9. [DOI] [PMC free article] [PubMed] [Google Scholar]
- [52].Klionsky DJ, Abdelmohsen K, Abe A, et al. Guidelines for the use and interpretation of assays for monitoring autophagy. Autophagy. 2016;12(1):1–222. 3rd edition. [DOI] [PMC free article] [PubMed] [Google Scholar]
- [53].Tanida I, Ueno T, Kominami E. LC3 and autophagy. Methods Mol Biol. 2008;445:77–88. [DOI] [PubMed] [Google Scholar]
- [54].Chu CT, Plowey ED, Dagda RK, et al. Autophagy in neurite injury and neurodegeneration: in vitro and in vivo models. Methods Enzymol. 2009;453:217–249. [DOI] [PMC free article] [PubMed] [Google Scholar]
- [55].Martinez-Lopez N, Garcia-Macia M, Sahu S, et al. Autophagy in the CNS and periphery coordinate lipophagy and lipolysis in the brown adipose tissue and liver. Cell Metab. 2016. January 12;23(1):113–127. [DOI] [PMC free article] [PubMed] [Google Scholar]
- [56].Kaushik S, Arias E, Kwon H, et al. Loss of autophagy in hypothalamic POMC neurons impairs lipolysis. EMBO Rep. 2012. March 1;13(3):258–265. [DOI] [PMC free article] [PubMed] [Google Scholar]
- [57].Livak KJ, Schmittgen TD. Analysis of relative gene expression data using real-time quantitative PCR and the 2(-Delta Delta C(T)) method. Methods. 2001. December;25(4):402–408. [DOI] [PubMed] [Google Scholar]
- [58].Huang K-L, Li S, Mertins P, et al. Proteogenomic integration reveals therapeutic targets in breast cancer xenografts. Nat Commun. 2017;8(1):14864. [DOI] [PMC free article] [PubMed] [Google Scholar]
- [59].Moriya Y, Itoh M, Okuda S, et al. KAAS: an automatic genome annotation and pathway reconstruction server. Nucleic Acids Res. 2007;35(WebServer):W182–W185. [DOI] [PMC free article] [PubMed] [Google Scholar]
Associated Data
This section collects any data citations, data availability statements, or supplementary materials included in this article.