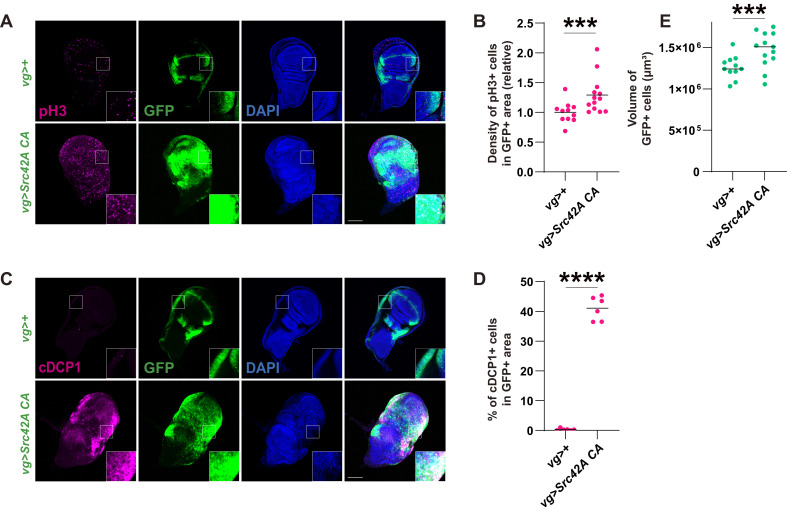
Figure 1. Src activation induces both cell proliferation and death, resulting in a mild tissue overgrowth.
(A) Src42A constitutively active (CA) expression induces cell proliferation, which was detected by phospho-histone 3 (pH3) staining. (B) Quantification of pH3 staining. The number of pH3+ cells was normalized by the area of GFP+ cells. Two-tailed unpaired t-test. (C) Src42A CA expression induces caspase activation, which was detected by cleaved DCP1 staining. (D) Quantification of percentage of cDCP1+ cells in GFP+ cells. Two-tailed unpaired t-test. (E) Quantification of the total volume of GFP+ cells (µm³). Two-tailed unpaired t-test. Scale bars, 100 µm.

