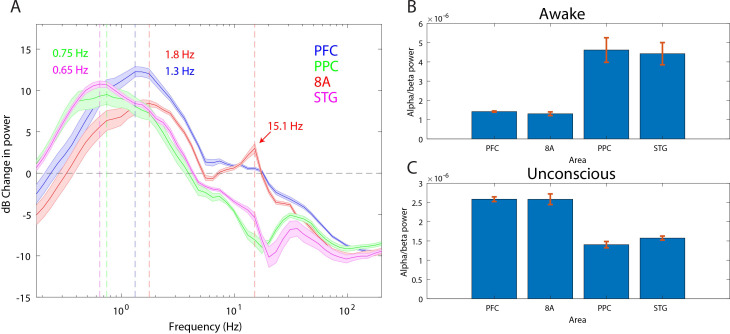
Figure 3. Power asymmetries between areas.
(A) dB change in power of Unconscious vs. Awake. Positive values indicate power Unconscious > Awake. For each area, the mean power difference is shown 1 SEM. Peak power modulation in the slow frequency range is highlighted for each area, and a secondary peak in the beta range (15.1 Hz) is present in area 8A. (B) Power in the beta frequency range (8–25 Hz) during the Awake state. (C) Same as B, but during the Unconscious state. Mean ±/- 1 SEM. PFC: ventrolateral prefrontal cortex; 8A: caudal lateral PFC; PPC: posterior parietal cortex area 7A/7B; STG: superior temporal gyrus.

