Abstract
Objective
123I metaiodobenzylguanidine (MIBG) scintigraphy is a useful tool for the diagnosis of neuroblastoma (NB). MIBG uptake is correlated with norepinephrine transporter expression; hence, it is expected that high-MIBG tumors would be more highly differentiated and have a better prognosis than those with lower expression. We have introduced a method of assessing MIBG accumulation semi-quantitatively using SPECT/CT fusion images. The purpose of this study was to evaluate the relationship of 123I MIBG uptake measured by semi-quantitative values of SPECT/CT and early relapse of NB.
Methods
We studied the cases of 11 patients (5 males and 6 females, age 5–65 months, median age 20 months) with histopathologically proven NB between April 2010 and March 2015. The early-relapse group was defined as patients who had relapsed within 3 years after the first 123I MIBG SPECT/CT exam. Other patients were classified as the delay-relapse group. Uptake of MIBG was evaluated using the count ratio of tumor and muscles. T/Mmax and T/Mmean were defined as follows: T/Mmax = max count of tumor/max count of muscle, T/Mmean = mean count of tumor/mean count of muscle.
Results
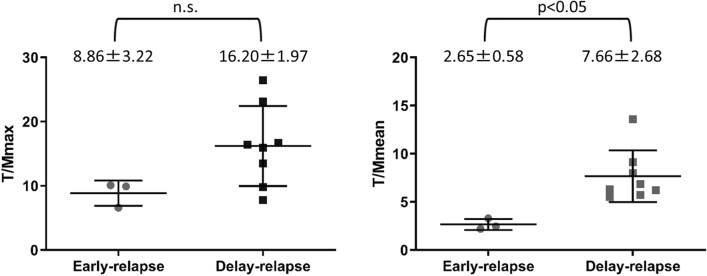
The average T/Mmean values of the early-relapse group and delay-relapse group were 2.65 ± 0.58 and 7.66 ± 2.68, respectively. The T/Mmean values of the early-relapse group were significantly lower than those of delay-relapse group (p < 0.05). The average T/Mmax of the early-relapse group and delay-relapse group were 8.86 ± 3.22 and 16.20 ± 1.97, respectively. There was no significant difference in T/Mmax values between the two groups.
Conclusions
Low 123I MIBG uptake using semi-quantitative SPECT/CT analysis was correlated with early relapse of NB.
Keywords: 123I MIBG, SPECT/CT, Semi-quantitative analysis, Neuroblastoma, Pediatric
Introduction
Neuroblastoma (NB) is one of the most common but very rare solid malignant tumors of early childhood and occurs in approximately 150 children each year in Japan [1]. NB is derived from primitive neural crest cells found in several areas of the body and is the most common extracranial solid tumor in children age 5 or younger [2].
123I metaiodobenzylguanidine (MIBG) scintigraphy is a useful tool for the diagnosis of NB [3]. Hybrid single-photon emission computed tomography/computed tomography (SPECT/CT) is expected to provide additional anatomical information, and more efficient diagnostic capability [4].
The scoring method due to the distribution of bone metastases has been proposed and used as a prognostic method for predicting prognosis using 123I MIBG planar image of NB [5, 6]. On the other hand, it is considered that it is difficult to predict prognosis from visual evaluation of planar images or SPECT images of 123I MIBG examination [7, 8].
Interpretation of 123I MIBG planar images and SPECT images is usually qualitative. Several semi-quantitative scoring systems for 123I MIBG examination of NB have been proposed and explored; however, systems based on planar imaging findings and SPECT findings are not typically included [5, 9–15]. Fred et al. [8] reported that the liver-to-tumor count ratio of 123I MIBG SPECT images was useful for differentiating NB from other neuroblastic tumors. Although the liver is commonly used as reference organ, MIBG tends to accumulate in the liver because it is metabolized there. In addition, liver uptake of MIBG is not homogeneous; large differences between the right and left lobes have been reported [16], and it is difficult to designate an appropriate region of interest (ROI) or volume of interest (VOI) as the reference. For these reasons, the liver is not an appropriate reference site for analysis when using MIBG.
In the present study, we introduced a new index that uses muscle as a reference. 123I MIBG accumulation of muscle is higher than the background, but relatively small because it is not metabolized in muscle. Because of this relatively low accumulation in the muscle, it is difficult to analyze using conventional planar images; not until the more recent development of SPECT/CT fusion images was this technique feasible.
The purpose of this study is to evaluate the ability of the new semi-quantitative values of 123I MIBG SPECT/CT to predict early-relapse lesions of NB.
Materials and methods
Patients
Inclusion criteria were histopathologically proven neuroblastoma, a maximum interval of 50 days between 123I MIBG SPECT/CT examination and surgical intervention and no tumor-specific treatment before the time of scintigraphy. 123I MIBG SPECT/CT examinations were performed between April 2010 and March 2015 in 11 consecutive pediatric patients meeting our criteria (Table1). The group consisted of 5 males and 6 females (age 5–65 months, median age 20 months). At the time of diagnosis patients were staged according to the International Neuroblastoma Staging System (INSS) [17] and International Neuroblastoma Risk Group (INRG) risk classification [5]. According to the International Neuroblastoma Pathological Classification (INPC) of NBs, almost all NBs in our study were subtypes of poor differentiation. MYCN amplification was proven by histopathological study. Vanillyl mandelic acid (VMA), homovanillic acid (HVA) and neuron-specific enolase (NSE) before treatment were also measured. Patients were followed up after MIBG examination (270–3016 days, median 1749 days). Treatments for patients were selected based on the clinical staging (surgical resection: 6, chemotherapy: 10, auto peripheral blood stem cell transplantation: 5, radiotherapy: 3). We defined the early-relapse group as patients who had relapsed within 3 years after the first 123I MIBG SPECT/CT exam. We defined the date of relapse as when the pediatrician comprehensively diagnosed recurrence based on clinical findings, histological examination, imaging studies and other information. Other patients were classified as the delay-relapse group. This study was approved by the Institutional Review Board of our hospital.
Table 1.
Patient characteristics
| No. | Age (month) | Sex | Body weight (kg) | BSA (m2) | Dose (MBq) | MYCN amplification | INSS grade | INRG risk classification | Metastatic lesion | Treatments |
|---|---|---|---|---|---|---|---|---|---|---|
| 1 | 13 | M | 7.5 | 0.37 | 63 | (−) | 1 | High | Op | |
| 2 | 4 | F | 6.8 | 0.32 | 56 | (−) | 4 s | Low | CTx | |
| 3 | 18 | F | 10.9 | 0.47 | 81 | (−) | 3 | Med | CTx | |
| 4 | 35 | M | 15.0 | 0.62 | 107 | (+) | 4 | High | Op, CTx, PBSCT | |
| 5 | 22 | M | 12.0 | 0.51 | 88 | (+) | 4 | High | Op, CTx, PBSCT, RTx | |
| 6 | 65 | F | 13.5 | 0.61 | 106 | (+) | 4 | High | CTx, PBSCT | |
| 7 | 56 | F | 15.6 | 0.67 | 116 | (−) | 3 | High | Liver, bone | CTx, PBSCT, RTx |
| 8 | 11 | F | 9.2 | 0.41 | 72 | (−) | 4 | Med | Op, CTx | |
| 9 | 8 | F | 6.8 | 0.32 | 55 | (−) | 4 | Med | Liver, bone | CTx |
| 10 | 31 | M | 11.3 | 0.49 | 86 | (−) | 4 | High | Liver, bone | Op, CTx, PBSCT, RTx |
| 11 | 20 | M | 10.7 | 0.47 | 81 | (−) | 4s | Low | Bone | Op, CTx |
BW body weight, BSA body surface area, INSS International Neuroblastoma Staging System, INRG International Neuroblastoma Risk Group, Op surgical treatment, CTx chemotherapy, RTx radiotherapy, PBSCT peripheral blood stem cell transplantation
Acquisition protocol
123I MIBG SPECT/CT examinations were performed under thyroid blockade with sodium perchlorate over 3 days at 5 ml per day before administration. 123I MIBG was injected intravenously with a body-weight-appropriate dose (55–116 MBq). A SPECT/CT system (Symbia T6, Siemens Medical Solutions, Knoxville, TN, USA) was used for imaging, which was started 24 h after administration of 123I MIBG.
The whole-body imaging protocol consisted of spot images of the whole-body dorsal/ventral view in a matrix of 256 × 256 pixels. The whole-body scan was obtained at a table feed rate of 7 cm/min.
SPECT images of the abdomen were available in all patients, with acquisitions in 50 views (40 s/view) and iterative reconstruction by OSEM in 8 iterations, with 10 subsets for a final matrix of 128 × 128 pixels. Scatter correction with using triple energy window (TEW) method and CT-based attenuation correction was also used for SPECT image reconstruction. To avoid motion artifacts, light sedation was necessary in all patients. CT scans were also performed with a 5-mm section thickness (130 keV, 30 mAs).
Image analysis
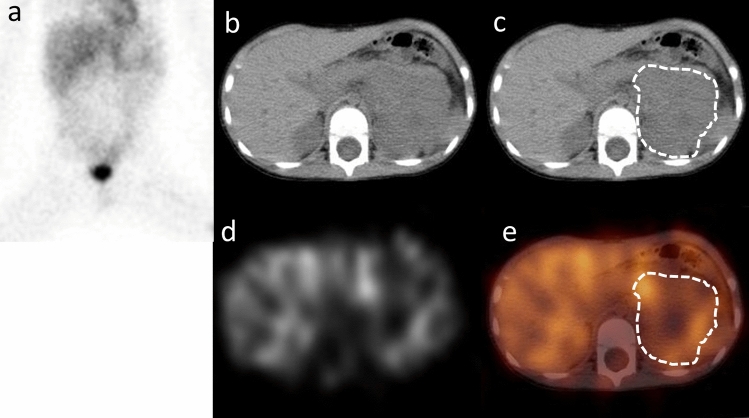
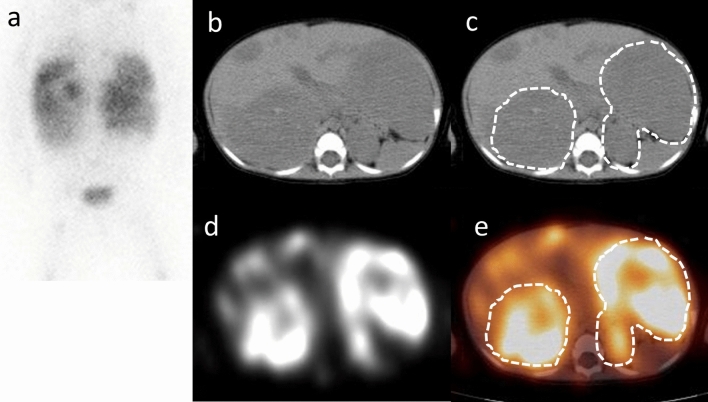
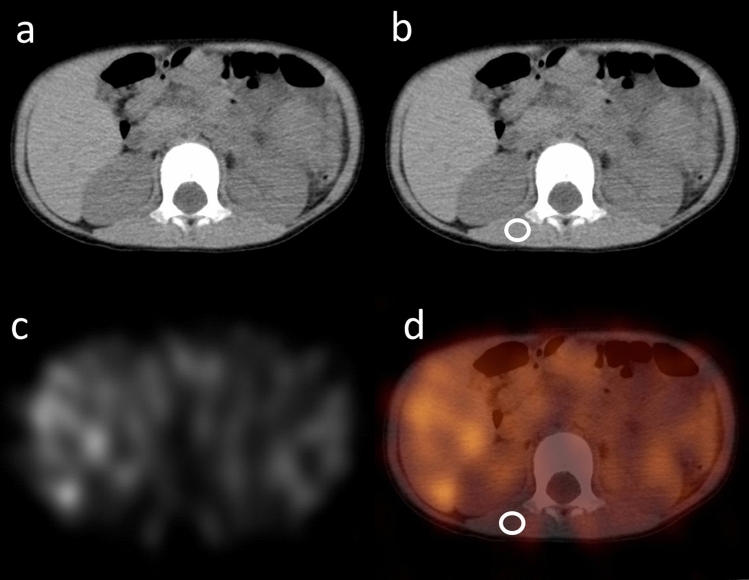
Individual data analyses were performed by two experienced observers (Y.K. and S.B.). 123I MIBG SPECT/CT images were reviewed on a SYNAPSE workstation (FUJIFILM Medical, Tokyo, Japan). To assess the anatomical site and the exact extent of disease, all patients underwent CT or MRI before or after 123I MIBG SPECT/CT with a mean interval of 5 days. The VOI of the primary tumor lesion was determined by consensus of two observers (Figs. 1, 2). VOI of muscle was designated individually in each patient using a 1-cm-diameter sphere of the latissimus dorsi muscle (Fig. 3). These VOIs were designated using an IntelliSpace Portal 6.0 workstation (Koninklijke Philips N.V., Amsterdam, The Netherland). The maximum and mean counts of both tumor and muscle VOIs were noted. The mean CT Hounsfield unit value of each tumor was also measured. The tumor-to-muscle ratios using the max counts and mean counts of VOIs (T/Mmax and T/Mmean) were calculated as semi-quantitative parameters using the following formulas:
Fig. 1.
Planar (a), CT (b, c), SPECT (d) and SPECT/CT fusion image (e) of 35-month-old male (case No. 4). Planar image was anterior image of body lesion. The region surrounded with a dotted line of the CT image (c) and the SPECT/CT fusion image (e) is designated primary tumor lesion. Approximate T/Mmean was 3.30. MYCN amplification was positive in the histopathological study. He had surgical treatment, chemotherapy and autologous peripheral blood stem cell transplantation; unfortunately, he relapsed 398 days after this scintigraphy examination and died on day 454
Fig. 2.
Planar (a), CT (b, c), SPECT (d) and SPECT/CT fusion image (e) of an 11-month-old female (case No. 8). Planar image was anterior image of body lesion. The region surrounded with a dotted line of the CT image (c) and the SPECT/CT fusion image (e) is designated the primary tumor lesion. The T/Mmean was approximated as 6.85. There was no MYCN amplification in the histopathological study. She received surgical resection after chemotherapy and remained relapse-free for 5 years after this scintigraphy examination
Fig. 3.
CT (a, b), SPECT (c) and SPECT/CT fusion image (d) of case No. 4. For the VOI of muscle in this case, 1-cm-diameter sphere of VOI was settled in the second vertebrae level of the right latissimus dorsi muscle (b, d; circled area)
Statistical analysis
Data are presented as single values or as means ± standard errors of the mean unless otherwise specified. Semi-quantitative parameters were compared between the early-relapse and delay-relapse group using Mann–Whitney’s U test. Relapse-free survival analysis was performed using cut-off values of the semi-quantitative parameters as determined by ROC analysis. If value of two groups was clearly separated by ROC analysis, cut-off value was settled as minimal integer between two groups. Correlation between semi-quantitative parameter and each other conditions as MYCN amplification, existence of metastases, VMA and HMA was evaluated using Chi-square test or correlation coefficient. p values < 0.05 were considered to indicate statistical significance.
All statistical analysis was performed using JMP 12 (SAS Institute Inc., Cary, NC, USA).
Results
The results of measurements of all 11 patients are given in Table 2. All patients but one survived the entire follow-up period.
Table 2.
Results of patients
| No. | Age (month) | Sex | VMA (mg/g Cr) | HVA (mg/g Cr) | NSE (ng/mL) | Tumor volume (cm3) | Mean HU | T/M max | T/M mean | RFS (day) |
|---|---|---|---|---|---|---|---|---|---|---|
| 1 | 13 | M | 32.9 | 20.8 | 25.5 | 3.9 | 50 | 6.73 | 6.21 | 3016 |
| 2 | 4 | F | 860 | 650 | 112.1 | 816.3 | 32.9 | 12.48 | 9.13 | 3013 |
| 3 | 18 | F | 207.4 | 147 | 80 | 151.9 | 40.5 | 14.73 | 13.57 | 2499 |
| 4 | 35 | M | 29.7 | 14.7 | 152 | 127.0 | 38 | 6.40 | 3.30 | 398 |
| 5 | 22 | M | 7.9 | 33.6 | 584.2 | 357.4 | 33.8 | 6.79 | 2.46 | 762 |
| 6 | 65 | F | 14.2 | 8.1 | 173.6 | 27.9 | 34.5 | 3.71 | 2.19 | 236 |
| 7 | 56 | F | 93.9 | 117.3 | 353.9 | 645.7 | 35.6 | 15.42 | 6.86 | 1945 |
| 8 | 11 | F | 1725 | 1728 | 303.5 | 658.7 | 36.1 | 6.25 | 8.00 | 1903 |
| 9 | 8 | F | 621.3 | 555.6 | 430.5 | 1070.4 | 36.7 | 6.75 | 5.50 | 1749 |
| 10 | 31 | M | 431.4 | 165.9 | 304.3 | 137.1 | 40.3 | 7.95 | 6.30 | 1630 |
| 11 | 20 | M | 72.2 | 36.5 | 19.7 | 28.9 | 35.3 | 5.71 | 5.71 | 1396 |
VMA vanillyl mandelic acid, HVA homovanillic acid, NSE neuron-specific enolase, HU Hounsfield unit, RFS relapse-free survival
T/Mmax values for the early-relapse and delay-relapse groups were 8.86 ± 3.22 and 16.20 ± 1.97, respectively. There was no significant difference in the T/Mmax between the two groups. T/Mmean values for the early-relapse group and delay-relapse group were 2.65 ± 0.58 and 7.66 ± 2.68, respectively. The T/Mmean value of the early-relapse group was significantly lower than that of the delay-relapse group (p < 0.05) (Fig. 4).
Fig. 4.
T/Mmax and T/Mmean of the early-relapse and delay-relapse groups. The T/Mmean of the early-relapse group was significantly lower than that of delay-relapse group (p < 0.05). There was no significant difference in the T/Mmax values of the two groups
Relapse-free survival analysis of T/Mmean is shown in Fig. 5. The survivals of the early-relapse and delay-relapse groups were clearly separated using the cut-off value of 4.0. The log-rank test showed a statistically significant difference between the high- and low-T/Mmean groups (p < 0.01).
Fig. 5.
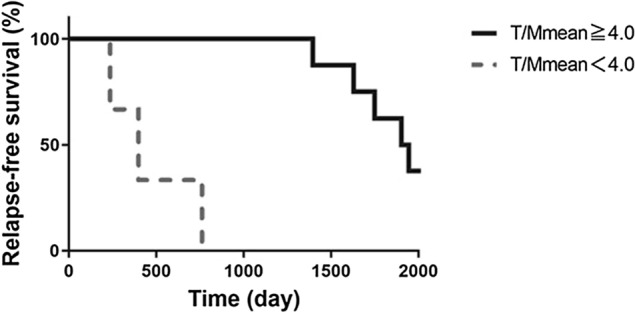
Relapse-free survival analysis of T/Mmean. The survivals of the early-relapse and delay-relapse groups were clearly separated by T/Mmean using a cut-off value of 4.0. The log-rank test showed a statistically significant difference in relapse-free survival between the high- and low-T/Mmean groups, at p < 0.01
There was a statistically significant relationship between T/Mmean and MYCN amplification using Chi-square test (Table 3; p < 0.01). T/Mmean values of all patients with positive MYCN amplification were lower than 4.0.
Table 3.
2 × 2 table between T/Mmean and MYCN amplification
| MYCN amplification | ||
|---|---|---|
| (+) | (−) | |
| T/Mmean | ||
| ≧ 4.0 | 0 | 8 |
| < 4.0 | 3 | 0 |
There was no significant relationship between T/Mmean and the presence of distant metastases (Table 4). All cases of the early-relapse group appeared to be free of distant metastases at the time of the MIBG examination.
Table 4.
2 × 2 table between T/Mmean and distant metastases
| Distant metastases | ||
|---|---|---|
| (+) | (−) | |
| T/Mmean | ||
| ≧ 4.0 | 4 | 4 |
| < 4.0 | 0 | 3 |
There was weak positive correlation between VMA and T/Mmean, but it was not statistically significant (R2 = 0.130, p = 0.28). Also, correlation between HVA and T/Mmean was weak with no statistical significance (R2 = 0.097, p = 0.35) (Fig. 6).
Fig. 6.
Correlation between T/Mmean and VMA and between T/Mmean and HVA. There was weak positive correlation between VMA and T/Mmean (R2 = 0.130, p = 0.28) and also there was weak positive correlation between VMA and T/Mmean (R2 = 0.097, p = 0.35) with no statistical significance
Discussion
Our study introduces the tumor-to-muscle count ratios of T/Mmax and T/Mmean as new semi-quantitative values for 123I MIBG SPECT/CT; they represent the ratios of the maximum and mean values of MIBG count, respectively. As a result of our analysis, the T/Mmean ratio of the delay-relapse group was found to be significantly higher than that of early-relapse group. This result may relate with the expression of the MIBG transporter of the tumor. It is thought that the expression of the norepinephrine transporter (NET) and vesicular monoamine transporters 1 and 2 (VMAT1 and VMAT2) are correlated with MIBG avidity in neuroblastoma [18, 19]. Temple et al. [19] reported that the expression of VMAT2 is significantly lower in MYCN-amplified neuroblastomas. All patients of the early-relapsed group had MYCN amplification in this study, which contributed to their low-T/Mmean values.
Tumor necrosis also seemed to be correlated with low T/Mmean, but we did not investigate the exact volume of the necrotic lesion in the tumor. Though CT Hounsfield units may be related with the degree of necrosis in the tumor, there was no statistical difference between the CT Hounsfield units of the tumor of the early-relapse group and those of delay-relapse group (result not shown).
The VMA and HVA of early-relapse group were lower than those of the delay-relapse group and there was weak positive correlation between T/Mmean and VMA or between T/Mmean and HVA. It is known that both VMA and HVA reflect tumor volume and catecholamine metabolism in NB [20]. Especially at VMA, Strenger et al. [21] showed that VMA was lower in the MIBG-negative group than in the MIBG-positive group and Verly et al. [22] reported that VMA was lower in MYCN amplification group than non-amplification group. These reports suggest that weak MIBG accumulation results in low VMA and MYCN amplification, which we believe is consistent with the results of our study.
In this study, we calculated T/Mmax or T/Mmean only for the primary tumor lesion and not for the distant metastatic lesions. We did not measure uptake in distant metastatic lesions because we believe that we may not be able to accurately detect all metastases and that the MIBG avidity and distribution may be different for primary tumors and metastatic lesions. Although the results of this study did not include cases with metastases in the early-relapse group, T/Mmean was lower in the early-relapse group than in the delay-relapse group, regardless of the presence or absence of distant metastases. This suggests that T/Mmean may be a prognostic tool for patients with unknown distant metastasis, even if the presence or absence of distant metastases is unknown. The usefulness of T/Mmax and T/Mmean in distant metastatic lesions remains uncertain.
T/Mmax values of the delay-relapse group tended to be higher than those of early-relapse group, but the difference was not significant. Although T/Mmax may also reflect the catecholamine metabolic activity of the tumor, it overestimates the uptake of MIBG when tumors have a heterogeneous MIBG distribution. This may be the reason why no significant difference was found in the results using T/Mmax. On the other hand, the measurement of T/Mmax has the advantage that the margin of VOI does not have to be carefully considered and is more easily measured. Although not as accurate a predictor as T/Mmean, T/Mmax may have some use in prognostic evaluation.
We decide to use 123I MIBG count of muscle for reference lesion. While the accumulation of 123I MIBG in the muscle lesions is low, it is higher than the background count and more homogenous than liver lesions. Determining the VOI of a tumor or muscle is difficult with SPECT images alone because the boundaries of the organs are unknown or unclear. It is also difficult to apply the positional information from CT or MRI performed at different examinations. On the other hand, with SPECT/CT, SPECT and CT images are taken almost simultaneously, and the location information of the tumor and muscles are identical. This makes it possible to determine the VOI relatively accurately with SPECT/CT.
This study did not include patients treated with 131I MIBG therapy and the usefulness of T/Mmean for predicting the effect of 131I MIBG therapy is unclear. It has been reported that the accumulation of 131I MIBG is stronger than that of 123I MIBG [23], 131I MIBG may show good accumulation and therapeutic effect when the T/Mmean is high, but it needs further study.
There were several limitations in this study. First, this study was retrospective. A prospective study is needed to confirm the effectiveness of 123I MIBG T/Mmean values at predicting relapse. Second, the small number of patients limited our analysis. This is due to the fact that NB is a very rare tumor. However, our results show a clear difference in T/Mmean between the early-relapse group and the delay-relapse group. Therefore, we can strongly expect T/Mmean to be a good prognostic indicator for treatment prognosis and we think if the 123I MIBG T/Mmean of pre-treatment NB is low, more careful post-treatment follow-up of the disease may be required, whether or not metastatic lesions are present.
Conclusions
In conclusion, we found that a low level of 123I MIBG uptake using semi-quantitative analysis of SPECT/CT was correlated with early relapse of neuroblastoma. This parameter shows promise as a predictor of treatment response in patients with neuroblastoma.
Acknowledgements
No potential conflicts of interest were disclosed.
Footnotes
Publisher's Note
Springer Nature remains neutral with regard to jurisdictional claims in published maps and institutional affiliations.
References
- 1.Nakagawara A, Li Y, Izumi H, Muramori K, Inada H, Nishi M. Neuroblastoma. Jpn J Clin Oncol. 2018;48(3):214–241. doi: 10.1093/jjco/hyx176. [DOI] [PubMed] [Google Scholar]
- 2.Matthay KK, Maris JM, Schleiermacher G, Nakagawara A, Mackall CL, Diller L, Weiss WA. Neuroblastoma. Nat Rev Dis Primers. 2016;10(2):16078. doi: 10.1038/nrdp.2016.78. [DOI] [PubMed] [Google Scholar]
- 3.Sharp SE, Shulkin BL, Gelfand MJ, Salisbury S, Furman WL. 123I-MIBG scintigraphy and 18F-FDG PET in neuroblastoma. J Nucl Med. 2009;50(8):1237–1243. doi: 10.2967/jnumed.108.060467. [DOI] [PubMed] [Google Scholar]
- 4.Sharp SE, Trout AT, Weiss BD, Gelfand MJ. MIBG in neuroblastoma diagnostic imaging and therapy. Radiographics. 2016;36(1):258–278. doi: 10.1148/rg.2016150099. [DOI] [PubMed] [Google Scholar]
- 5.Matthay KK, Shulkin B, Ladenstein R, et al. Criteria for evaluation of disease extent by 123I-metaiodobenzylguanidine scans in neuroblastoma: a report for the International Neuroblastoma Risk Group (INRG) Task Force. Br J Cancer. 2010;102:1319–1326. doi: 10.1038/sj.bjc.6605621. [DOI] [PMC free article] [PubMed] [Google Scholar]
- 6.Biasotti S, Garaventa A, Villavecchia G, Cabria M, Nantron M, De Bernardi B. False-negative metaiodobenzylguanidine scintigraphy at diagnosis of neuroblastoma. Med Pediatr Oncol. 2000;35(2):153–155. doi: 10.1002/1096-911X(200008)35:2<153::AID-MPO18>3.0.CO;2-7. [DOI] [PubMed] [Google Scholar]
- 7.Yanik GA, Parisi MT, Shulkin BL, Naranjo A, Kreissman SG, London WB, Villablanca JG, et al. Semiquantitative mIBG scoring as a prognostic indicator in patients with stage 4 neuroblastoma: a report from the children’s oncology group. J Nucl Med. 2013;54(4):541–548. doi: 10.2967/jnumed.112.112334. [DOI] [PMC free article] [PubMed] [Google Scholar]
- 8.Fendler WP, Melzer HI, Walz C, Schweinitz D, Coppenrath E, Schmid I, et al. High 123I-MIBG uptake in neuroblastic tumours indicates unfavourable histopathology. Eur J Nucl Med Mol Imaging. 2013;40:1701–1710. doi: 10.1007/s00259-013-2491-y. [DOI] [PubMed] [Google Scholar]
- 9.Ady N, Zucker JM, Asselain B, Edeline V, Bonnin F, Michon J, et al. A new 123I-MIBG whole body scan scoring method—application to the prediction of the response of metastases to induction chemotherapy in stage IV neuroblastoma. Eur J Cancer. 1995;31A:256–261. doi: 10.1016/0959-8049(94)00509-4. [DOI] [PubMed] [Google Scholar]
- 10.Perel Y, Conway J, Kletzel M, Goldman J, Weiss S, Fleyler A, et al. Clinical impact and prognostic value of metaiodobenzylguanidine imaging in children with metastatic neuroblastoma. J Pediatr Hematol Oncol. 1999;21:13–18. doi: 10.1097/00043426-199901000-00004. [DOI] [PubMed] [Google Scholar]
- 11.Katzenstein HM, Cohn SL, Shore RM, Bardo DME, Haut PR, Olszewski M, et al. Scintigraphic response by 123I-metaiodobenzylguanidine scan correlates with event-free survival in high-risk neuroblastoma. J Clin Oncol. 2004;22:3909–3915. doi: 10.1200/JCO.2004.07.144. [DOI] [PubMed] [Google Scholar]
- 12.Messina JA, Cheng SC, Franc BL, Charron M, Shulkin B, To B, et al. Evaluation of semi-quantitative scoring system for metaiodobenzylguanidine (mIBG) scans in patients with relapsed neuroblastoma. Pediatr Blood Cancer. 2006;47:865–874. doi: 10.1002/pbc.20777. [DOI] [PubMed] [Google Scholar]
- 13.Boubaker A, Delaloye AB. MIBG scintigraphy for the diagnosis and follow-up of children with neuroblastoma. Q J Nucl Med Mol Imaging. 2008;52:388–402. [PubMed] [Google Scholar]
- 14.Schmidt M, Simon T, Hero B, Schicha H, Berthold F. The prognostic impact of functional imaging with 123I-mIBG in patients with stage 4 neuroblastoma > 1 year of age on a high-risk treatment protocol: results of the German Neuroblastoma Trial NB97. Eur J Cancer. 2008;44:1552–1558. doi: 10.1016/j.ejca.2008.03.013. [DOI] [PubMed] [Google Scholar]
- 15.Matthay KK, Edeline V, Lumbroso J, Tanguy ML, Asselain B, Zucker JM, et al. Correlation of early metastatic response by 123I-metaiodobenzylguanidine scintigraphy with overall response and event-free survival in stage IV neuroblastoma. J Clin Oncol. 2003;21:2486–2491. doi: 10.1200/JCO.2003.09.122. [DOI] [PubMed] [Google Scholar]
- 16.Jacobsson H, Johansson L, Kimiaei S, Larsson SA. Concentration of 123I-metaiodobenzylguanidine in left and right liver lobes. Findings indicate regional differences in function in the normal liver. Acta Radiol. 1999;40(2):224–228. doi: 10.3109/02841859909177744. [DOI] [PubMed] [Google Scholar]
- 17.Brodeur GM, Pritchard J, Berthold F, Carlsen NL, Castel V, Castelberry RP, et al. Revisions of the international criteria for neuroblastoma diagnosis, staging, and response to treatment. J Clin Oncol. 1993;11:1466–1477. doi: 10.1200/JCO.1993.11.8.1466. [DOI] [PubMed] [Google Scholar]
- 18.Smets LA, Loesberg C, Janssen M, Metwally EA, Huiskamp R. Active uptake and extravesicular storage of M-iodobenzylguanidine in human neuroblastoma SK-N-SH cells. Cancer Res. 1989;49(11):2941–2944. [PubMed] [Google Scholar]
- 19.Temple W, Mendelsohn L, Kim GE, Nekritz E, Gustafson WC, Lin L, et al. Vesicular monoamine transporter protein expression correlates with clinical features, tumor biology, and MIBG avidity in neuroblastoma: a report from the children's oncology group. Eur J Nucl Med Mol Imaging. 2016;43(3):474–481. doi: 10.1007/s00259-015-3179-2. [DOI] [PMC free article] [PubMed] [Google Scholar]
- 20.Hanai J, Kawai T, Sato Y, Takasugi N, Nishi M, Takeda T. Simple liquid-chromatographic measurement of vanillylmandelic acid and homovanillic acid in urine on filter paper for mass screening of neuroblastoma in infants. Clin Chem. 1987;33(11):2043–2046. doi: 10.1093/clinchem/33.11.2043. [DOI] [PubMed] [Google Scholar]
- 21.Strenger V, Kerbl R, Dornbusch HJ, Ladenstein R, Ambros PF, Ambros IM, et al. Diagnostic and prognostic impact of urinary catecholamines in neuroblastoma patients. Pediatr Blood Cancer. 2007;48(5):504–509. doi: 10.1002/pbc.20888. [DOI] [PubMed] [Google Scholar]
- 22.Verly I, Kuilenburg A, Abeling N, Goorden S, Fiocco M, Vaz FM, et al. Catecholamines profiles at diagnosis: Increased diagnostic sensitivity and correlation with biological and clinical features in neuroblastoma patients. Eur J Cancer. 2017;72:235–243. doi: 10.1016/j.ejca.2016.12.002. [DOI] [PubMed] [Google Scholar]
- 23.Fukuoka M, Taki J, Mochizuki T, Kinuya S. Comparison of diagnostic value of I-123 MIBG and high-dose I-131 MIBG scintigraphy including incremental value of SPECT/CT over planar image in patients with malignant pheochromocytoma/paraganglioma and neuroblastoma. Clin Nucl Med. 2011;36:1–7. doi: 10.1097/RLU.0b013e3181feeb5e. [DOI] [PubMed] [Google Scholar]


