

Abstract
Background
To optimize medication use in older adults, the Centers for Medicare & Medicaid Services (CMS) launched Medication Therapy Management (MTM) services as part of Medicare Part D policy; however, strategies for achieving high quality MTM outcomes are not well understood.
Objective
The objective of this study was to generate hypotheses for strategies contributing to community pharmacies’ high performance on policy-relevant MTM quality measures.
Methods
This mixed-methods comparative case study was guided by the Positive Deviance approach and Chronic Care Model. The study population consisted of pharmacy staff employed by a national supermarket-community pharmacy chain Midwestern division. Data consisted of demographics and qualitative data from semi-structured interviews. Qualitative and quantitative data were analyzed deductively and inductively or using descriptive statistics, respectively. MTM quality measures used to evaluate participant pharmacies’ MTM performance mirrored select 2017 Medicare Part D Plans’ Star Rating measures.
Results
Thirteen of 18 selected case pharmacies (72.2%) participated in this study, of which 5 were categorized as high performers, 4 moderate performers, and 4 low performers. 11 pharmacists, 11 technicians, and 3 student interns participated in interviews. Eight strategies were hypothesized as contributing to MTM performance: Strong pharmacy staff-provider relationships and trust, Inability to address patients’ social determinants of health (negatively contributing), Technician involvement in MTM, Providing comprehensive medication reviews in person vs. phone alone, Placing high priority on MTM, Using available clinical information systems to identify eligible patients, Technicians using clinical information systems to collect/document information for pharmacists, Faxing prescribers adherence medication therapy problems (MTPs) and calling on indication MTPs.
Conclusions
Eight strategies were hypothesized as contributing to community pharmacies’ performance on MTM quality measures. Findings from this work can inform MTM practice and Medicare Part D MTM policy changes to positively influence patient outcomes. Future research should test hypotheses in a larger representative sample of pharmacies.
Keywords: community pharmacy services, mixed-methods, positive deviance approach, medication therapy management
Introduction
In the United States, more than 90% of individuals aged 65 years or older take at least 1 prescription medication, and more than 40% take 5 or more prescription medications, increasing the risk of medication therapy problems (MTPs).1 Preventable MTPs affect more than 7 million Americans, generating costs of nearly $21 billion annually.2 In response, the Centers for Medicare & Medicaid Services (CMS) launched the Medication Therapy Management (MTM) program as part of Medicare Prescription Drug (Part D) policy in 2006.3 The MTM program includes, at minimum, an annual comprehensive medication review (CMR) and quarterly targeted medication reviews (TMRs). Pharmacists are the most common MTM providers, utilized by 100% of plans.4
In the US, the CMS measures the quality of Medicare Part D plans in four domains using a 5-star rating system.5 The fourth domain, “Drug safety and accuracy of drug pricing,” includes a range of MTM quality measures endorsed by the Pharmacy Quality Alliance (PQA).5, 6 Historically, this domain has included quality measures, including those based on the percent of beneficiaries adherent to medications used to treat select disease states, receipt of a CMR, and safer medication use based on risk factors. Performance on each quality measure is awarded a star rating that ranges from 1 (lowest) to 5 (highest). Medicare Part D plans incentivize community pharmacy performance on Star Ratings measures through Direct and Indirect Remuneration rebate incentives and their inclusion in preferred pharmacy networks, providing a steady access to patients.7 However, staffing, training, and documentation requirements present challenges for community pharmacy MTM service implementation, negatively impacting opportunities for incentives.8
A recent comparative effectiveness review of outpatient MTM intervention studies concluded that applying the Positive Deviance approach--which can be used as a guiding framework for exploring reasons for deviations in performance among healthcare organizations in similar environments--could improve the rigor of evaluations of real-world MTM implementation.9 Despite these findings, to the authors’ knowledge, no published studies have applied this approach to evaluate MTM services.
Published research further supports opportunities for application of the Positive Deviance approach in evaluating MTM.10–12 First, the “external environment” (e.g., geographic location and payer mix) was identified as an influencing factor in MTM provision variation.12 Further, variation in pharmacy and staff characteristics associated with pharmacies’ MTM performance were identified, even among community pharmacies functioning in similar environments.10 However, specific MTM delivery strategies contributing to varying performance on MTM quality measures in community pharmacies remain largely unexplored. Knowledge and implementation of evidence-based strategies could improve efficiency and equitability of MTM services among older adults. Thus, the objective of this study was to generate hypotheses for strategies contributing to community pharmacies’ high performance on policy-relevant MTM quality measures.
Methods
Design Overview
The research team applied an exploratory comparative mixed-methods case study design enabling comparisons within and across contexts conducive to understanding the factors influential to the success of a service.13, 14 Qualitative methods served as the primary mechanism for data collection and analysis. Quantitative methods were utilized for sampling pharmacy sites and to contextualize qualitative findings.15 Qualitative and quantitative data were independently analyzed concurrently and subsequently triangulated via comparative analysis. Study procedures were approved by the [institution removed for blinding] Institutional Review Board. Reporting is in accordance with the Good Reporting of a Mixed Methods Study (GRAMMS) criteria.16
Theoretical Framework
The study design was guided by the Positive Deviance approach and the Chronic Care Model. First, specific steps of the Positive Deviance approach, adapted for MTM, were applied to identify 1) community pharmacies exhibiting varying performance on MTM quality measures and 2) the MTM delivery strategies used.17 Secondly, Wagner’s Chronic Care Model 18, 19 was adapted and applied to frame data collection and analysis. This model consists of 6 core elements: community resources and policy, decision support, patient self-management support, clinical information systems, delivery system design, and health system organization. Because MTM services focus primarily on optimizing chronic disease health outcomes among older adults, the Chronic Care Model serves as a useful framework for examining MTM delivery strategies.
Study Population
The study population consisted of pharmacists, pharmacy technicians, and student interns employed by a Midwestern division of a national supermarket-community pharmacy chain. To examine community pharmacies within similar contexts (e.g., state legislation and health insurance),17, 20 only pharmacies located in Indiana (N=94) were considered for this study.
Component and Composite Scores to Determine Pharmacy Performance
Pharmacies were ranked based on a 6-month (July – December 2017) MTM quality performance composite score, which was calculated by taking the mean of the 5 summated component scores. Component score definitions and data sources are listed in Figure (Box) 1. Component measures mirrored the Pharmacy Quality Alliance-endorsed MTM quality measures used by CMS, specifically, select quality measures under Domain 4 (Drug Safety and Accuracy of Drug Pricing) of the 2017 CMS Medicare Part D Plans’ Star Rating measures.5, 6 These are quantifiable, widely utilized, policy-relevant measures of MTM performance.6, 17
Figure (Box) 1.
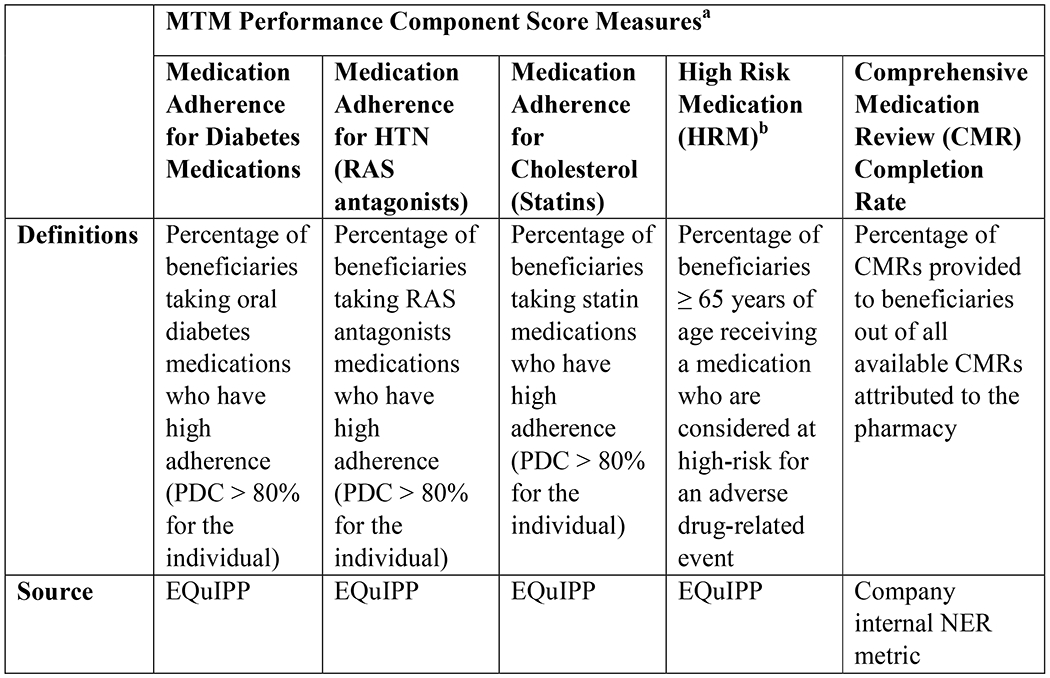
Definitions and sources for Medication Therapy Management (MTM) quality measures used to report the 5 component measure scores and subsequently compute composite scores for ranking pharmacies’ performance.
a Component and composite scores were reported as a percentage ranging from 0% to 100%.
b The HRM core was reverse-coded to reflect a positive association with higher values
Abbreviations: EQuIPP=Electronic Quality Improvement Platform for Plans and Pharmacies; HTN=hypertension; NER=net effective rate; PDC=proportion of days covered; RAS=renin angiotensin system.
Sample and Case Selection
Two levels of purposive sampling of pharmacies were used. The initial level included stratification of pharmacies into first (n=19), third (n=18) and fifth (n=19) quintiles representing low, moderate, and high performing pharmacy quality categories based on composite scores. Pharmacies within these 3 categories were eligible for case selection (N=56).
An additional level of purposive sampling was used for case pharmacy selection. To maximize contrast between pharmacies in different performance categories,20 extreme cases were selected using a bottom-up approach for choosing from the low performance category, middle-out approach for moderate, and top-down approach for the high-performance category. An iterative sampling process was applied until theoretical saturation of qualitative data was achieved.21
Participant Recruitment within Selected Case Pharmacies
All pharmacists were notified of this study via an email sent on behalf of researchers by upper-level pharmacy administration. To be eligible, participants at selected case pharmacies had to have completed and/or supported the completion of 2 or more MTM cases (CMR or TMR) within the past year. To inquire about interest in participation and to verify a list of eligible pharmacy staff, researchers first called pharmacy managers. Informed consent and data collection occurred with willing eligible participants outside of working hours. Only case pharmacies having at least 1 pharmacy staff member participate in qualitative data collection were included in subsequent analyses.
Qualitative Data Collection and Analysis
Prior to conducting semi-structured interviews with pharmacy staff at the case pharmacies, pilot interviews with 1 pharmacist, pharmacy technician, and student intern employed at an ineligible pharmacy location were conducted and minor edits (i.e., adding examples for clarity) resulted in the final semi-structured interview guide (Appendix A). Audio-recorded telephone interviews were conducted between July and December 2018 lasting approximately 20 to 60 minutes each. Pharmacist participants received a $40 gift card, and technicians/student intern participants received a $20 gift card. To minimize potential bias, researchers were blinded to pharmacies’ performance categorization during interviews and initial qualitative data analysis.
Interviews were transcribed verbatim, and all transcripts were reviewed. Prior to data analysis, 3 researchers received training by the first author. Analyses occurred through an iterative process, with interviews and early stages of analysis occurring concurrently. Two pairs of analysts independently coded an equal number of transcripts using NVivo 12 Pro.22 Analysts first deductively categorized data at a broad-code level mirroring the Chronic Care Model elements then, inductively created sub-codes as they emerged from interview data. Key decisions were logged via an audit trail and codebook, and researchers met to discuss discrepancies on a weekly to biweekly basis.
Midway through sub-code analysis, Krippendorff s alpha (k-alpha) was calculated to estimate inter-coder reliability and identify areas for further discussion.23, 24 To accomplish this, 10 lines of data were used from 1 transcript chosen at random via the Excel RANDBETWEEN function. K-alpha is essentially a ratio calculated as the observed disagreement/expected disagreement. K-alpha estimates a range from 0 (indicating absence of reliability) to 1.0 (indicating perfect reliability).24 A minimum k-alpha of 0.41 was selected because the study objective was addressed at the thematic level, upon which all coders agreed.24, 25
Finally, preliminary themes categorized by elements of the Chronic Care Model were derived using a two-phase approach. First, using the NVivo Cluster Analysis Wizard,22 sub-codes were clustered by word similarity using Pearson’s correlation coefficients. Then, analysts created and reached consensus on preliminary themes guided by cluster analysis findings and supporting interview data.
Quantitative Data Collection and Analysis
Quantitative data collection occurred both prior and after qualitative data collection. For quantitative analysis, the first author was unblinded to pharmacy performance status allowing for quantitative results to be stratified when appropriate. Percent variation of performance scores was calculated as the difference between the highest and lowest component and composite scores across the sample of eligible pharmacies (N=56).
To characterize and compare characteristics of participating case pharmacies to eligible non-participatory pharmacies, descriptive statistics were compared across the 3 performance categories. To characterize pharmacy staff participants, closed-ended self-reported demographic information (Appendix A) was collected verbally at the end of interviews and recorded in Qualtrics software (Qualtrics LLC, Provo, UT). This portion of the interview was not audio recorded. SPSS26 was used to compute descriptive statistics.
Finally, upon completion of qualitative data collection, performance data during the data collection period (July 2018 – Dec 2018) were extracted to identify changes in performance that might have occurred between pharmacy site identification (July 2017 – Dec 2017) and data collection periods. To inform comparative analysis, pharmacies were then grouped into 1 of 3 broad change-in-performance categories: consistent, improved, worsened. The 3 broad categories were further delineated into 7 subcategories, which are later described in results (Figure 3).
Figure 3.
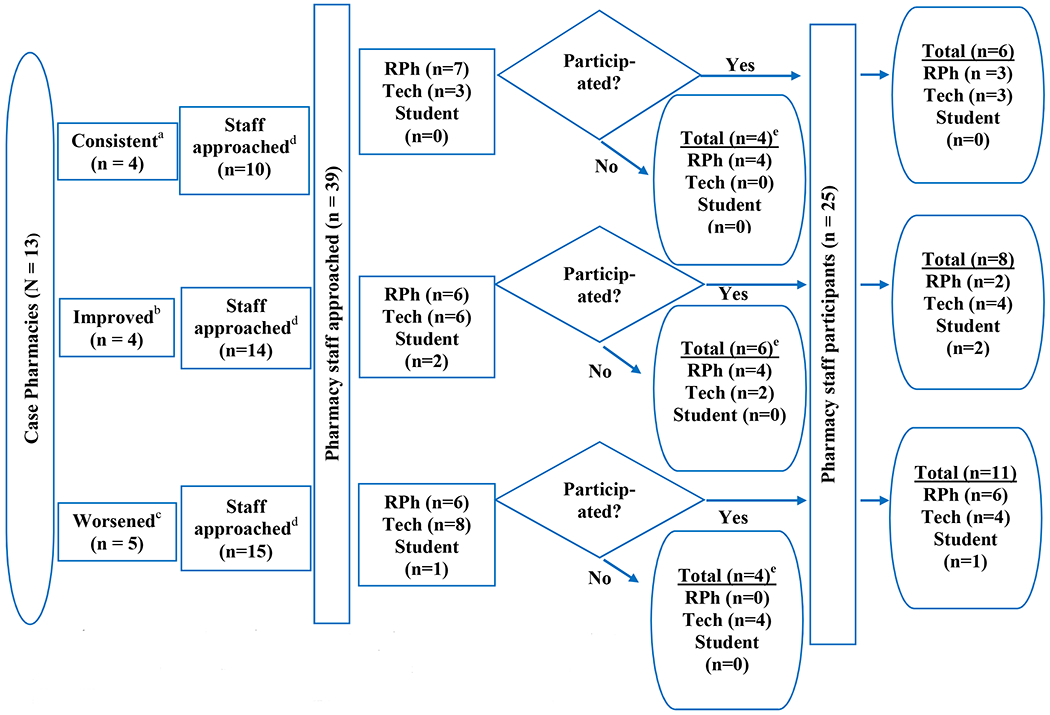
Flow diagram of pharmacy staff participants (25 participated of 39 approached; 64.1%), at case pharmacy sites participating in qualitative data collection; grouped by change-in-performance category.a-c Upon completion of qualitative data collection, performance data during the data collection period (July 2018 – Dec 2018) were extracted to inform pharmacies’ change-in-performance categories.
a Consistent: pharmacy locations categorized as a 1. high, 2. moderate, or 3. low performing during sample-identification period (July – Dec 2017) AND data collection (July – Dec 2018) period.
b Improved: pharmacy locations categorized as a 4. moderate or 5. low performing during sample-identification period AND performance ranking IMPROVED by ≥ 1 quintile during data collection period.
c Worsened: pharmacy locations categorized as a 6. high or 7. moderate performing during sample-identification period AND performance ranking worsened by ≥ 1 quintile during data collection period.
a–c Note: numbers (1-7) are nominal categories to label change-in performance categories and DO NOT represent an ordinal scale.
d Number of pharmacy staff confirmed to be eligible and approached by a researcher.
e Non-participants either declined (n=11) or were unreachable (n=3).
Abbreviations: RPh=registered pharmacist; tech=pharmacy technician
Comparative Analysis
To further refine preliminary themes, sub-coded data were cross-tabulated with change-in-performance categories. To accomplish this, the Framework Method was applied using the framework matrices function within NVivo.27 Final major themes were identified through consensus across all 4 analysts. From the final major themes, hypotheses were generated for strategies contributing to community pharmacies’ performance on MTM quality measures.
Advisory panel meetings were held to perform member-checking with a select number of participants representing unique change-in-performance categories. As compensation for participation in the panel, pharmacists were offered a $100 gift card, and technicians were offered a $50 gift card.
Results
Variation in Eligible Pharmacies’ Performance
Across the sample of eligible pharmacies (N=56), the range from highest to lowest composite scores was 21.3%. Of the 5 component scores, the Comprehensive Medication Review component score had the widest range (88.3%), whereas the High-Risk Medication component score had the narrowest range (6.9%). The ranges for Diabetes, Hypertension, and Cholesterol adherence component scores were 17.9%, 13.2%, and 12.5%, respectively.
Case Pharmacies
Of the 18 case pharmacies, 13 participated in qualitative data collection, yielding a 72.2% pharmacy participation rate (Figure 2). Of these, 4 exhibited consistent performance, 4improved, and 5worsened (Figure 3). Participating case pharmacy (n=13) characteristics compared to non-case pharmacies and non-participatory case pharmacies (n=43) are listed in Table 1. Due to variable skew, the median and interquartile range (IQR) are reported for applicable pharmacy characteristics. Results for participating case pharmacies (n=13) compared to non-participatory case pharmacies (n=5) are available in Appendix B.
Figure 2.
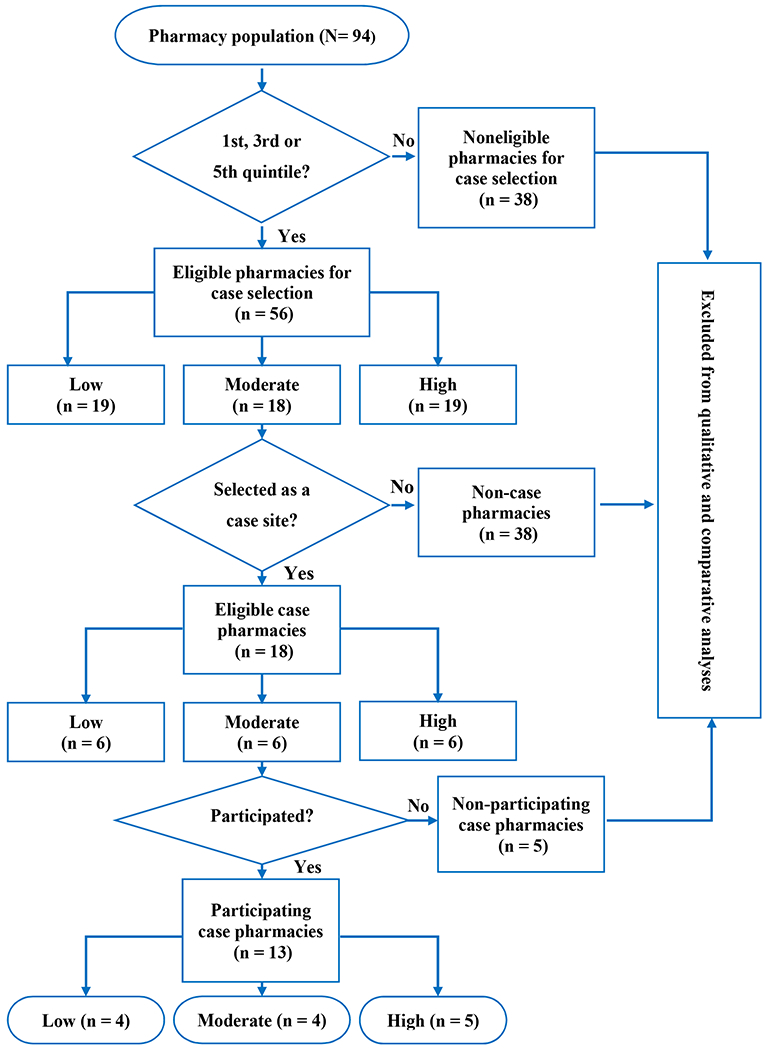
Flow diagram of eligible case pharmacies participating in qualitative data collection (13 participated of 18 selected case pharmacies; 72.2%). Pharmacies were excluded from analysis if the pharmacy did not have at least 1 pharmacy staff member participate in qualitative data collection.
Table 1.
Comparison of Participating Case Pharmacy to Non-Case Pharmacy and Non-Particpatory Case Pharmacy Characteristics by Performance Category
| Case pharmacies that participated in qualitative data collection (n=13) | Eligible pharmacies that were NOT selected as a case pharmacy OR pharmacies that were selected as a case pharmacy but did NOT participate in qualitative data collection (n=43)* | |||||
|---|---|---|---|---|---|---|
| Low performance (n=4) | Moderate performance (n=4) | High performance (n=5) | Low performance (n=15) | Moderate performance (n=14) | High performance (n=14) | |
| Number of FTE pharmacistsa median (IQR) | 2.0 (0) | 2.0 (1.0) | 2.0 (1.0) | 2.0 (0) | 2.0 (0) | 2.0 (0) |
| Weekly pharmacist overlap hoursb median (IQR) | 19.7 (12.8) | 5.5 (28.4) | 6.9 (5.6) | 4.7 (13.5) | 5.8 (15.9) | 4.0 (10.6) |
| Number of store-assigned techniciansc median (IQR) | 11.0 (2.0) | 8.0 (2.0) | 7.0 (4.0) | 6.0 (5.0) | 8.5 (5.0) | 7.0 (6.0) |
| Weekly total technician hours workedd median (IQR) | 279.1 (78.1) | 173.2 (125.4) | 166.1 (64.1) | 175.2 (147.2) | 190.6 (106.3) | 140.6 (124.5) |
| Level of technician traininge | ||||||
| Number of level 1 trained technicians median (IQR) | 1.0 (2.0) | 1.5 (1.0) | 1.0 (3.0) | 1.0 (4.0) | 1.0 (3.0) | 1.0 (2.0) |
| Number of level 2 trained technicians median (IQR) | 2.0 (3.0) | 0.5 (1.0) | 0 (1.0) | 0 (1.0) | 1.0 (1.0) | 1.0 (2.0) |
| Number of level 3 trained technicians median (IQR) | 7.5 (5.0) | 6.0 (4.0) | 4.0 (3.0) | 4.0 (2.0) | 5.5 (4.0) | 3.5 (4.0) |
| Number of store-assigned student interns median (IQR) | 0.5 (1.0) | 1.0 (1.0) | 1.0 (1.0) | 0 (1.0) | 1.0 (1.0) | 0.5 (2.0) |
| IPPE student(s)f n (%) | 0 (0) | 1.0 (25.0) | 2.0 (40.0) | 4.0 (26.7) | 4.0 (28.6) | 2 (14.3) |
| APPE student(s)g n (%) | 0 (0) | 1.0 (25.0) | 2.0 (40.0) | 3.0 (20.0) | 3.0 (21.4) | 4.0 (28.6) |
(n = 43) includes eligible pharmacies that were NOT selected as a case pharmacy (n=38) and pharmacies selected as a case pharmacy site but did NOT participate in qualitative data collection (n=5).
Note: data are presented for each performance category during the 6-month sampling period (July – Dec 2017)
Median number of FTE pharmacists = median number of FTE (≥ 36 hours/week) pharmacists at each pharmacy within each performance category
Weekly pharmacist overlap = median weekly overlap (when more than 1 pharmacist is working) hours at each pharmacy within each performance category
Median number of store-assigned technicians = median number of store-assigned technicians at each pharmacy within each performance category
Median weekly total amount of technician hours worked at each pharmacy within each performance category
The pharmacy company has 3levels of internal technician certificate training ranging from level 1, being entry level and level 3, which includes more advanced clinical services training.
Median number of pharmacy sites hosting at least 1IPPE student within each performance category
Median number of pharmacy sites hosting at least 1APPE student within each performance category
Abbreviations: APPE=Advanced Pharmacy Practice Experiences; FTE=full time equivalent; IPPE=Introductory Pharmacy Practice Experiences; IQR=interquartile range.
Staff Participant Characteristics
Of the 39 pharmacy staff confirmed as eligible and approached, 25 pharmacy staff participated in an interview, yielding a participation rate of 64.1% (Figure 3). Interviews were conducted with 1 to 3 staff members at each case pharmacy site. Across all sites, 11 pharmacists, 11 pharmacy technicians, and 3 student interns were interviewed. Six, 8, and 11 participants represented the consistent, improved, and worsened change-in-performance categories, respectively.
Participant mean age was 34 [SD=10.0] and the majority were female (n=19, 76.0%), non-Hispanic (n=25, 100.0%), and white (n =23, 92.0%). Furthermore, a majority of participants (n=14, 56.0%) reported providing MTM services for 2 or more years and spending a minimum of 3 hours on MTM tasks per week. The majority of pharmacists (n=11) were managers (n=8, 72.7%) and held a PharmD degree (n=7, 63.6%). Among pharmacists and student interns (n=14), 28.6% (n=4) had obtained an American Pharmacists Association (APhA) MTM Certificate and 50.0% (n=7) had obtained an APhA Patient-Centered Diabetes Care Certificate.
Preliminary Themes
Inter-coder reliability (k-alpha) was 0.54, suggesting acceptable agreement among coders.24, 25 Theoretical saturation was presumed to be met as there were no new codes created at the midpoint of coding.21 Blinded initial analysis revealed 10 preliminary themes to be considered in subsequent comparative analysis.
Data Integration and Comparison: Major Themes and Generated Hypotheses
Unblinded Framework Matrices analyses facilitated further refinement of the 10 preliminary themes into 8 emergent major themes producing 8 hypothesized strategies contributing to community pharmacies’ MTM performance. Major themes, hypotheses, and example quotes, categorized by Chronic Care Model element, are described in Table 2.
Table 2.
Major themes, generated hypotheses, and associated representative quotes by element of the Chronic Care Model. Operational definitions for each Chronic Care Model element are included for transparency. For brevity, pharmacies in the moderate-improved and/or high-consistent change-in-performance categories are referred to as “higher performing pharmacies” and all other change-in-performance categories as “lower performing pharmacies.”
| Major Theme | Generated Hypotheses | Representative Quotes from Interviews |
|---|---|---|
| Health System Organization: create a culture, organization, and mechanisms that promote effective provision of medication therapy management (MTM) services* | ||
| Extent of pharmacy staff-provider relationships |
1. Strong pharmacy staff-provider relationships and trust positively contribute to MTM performance. Higher performing pharmacies attributed success of MTM provision to the strong pharmacy staff-provider relationships they had built, while lower performing pharmacies described the current absence of these relationships but the desire to have them. |
“… we have a pretty close network of providers and pharmacies… we communicate pretty frequently with the same people. We know the doctors, we know the nurses…we know the nurse practitioners…because we know each other so well, there is a trust there between ourselves…probably the most common [MTM service] here over the last six months to a year is identifying statin use for diabetic patients…we had to…work with the providers and explain to them, we are probably going to send you a lot of requests for things like this, and…we had a lot of success with it…But we are fortunate to have a good team we all work together…to make sure we are filling in the gaps of care…” |
| Delivery System Design: assure the delivery of effective and efficient MTM services to diverse patients* | ||
| Addressing patients’ social determinants of health (SDOH) |
2. Inability to address patients’ SDOH negatively contributes to MTM performance. Participants at lower performing pharmacies described difficulties in providing MTM services due to challenges with addressing SDOH such as patients’ socioeconomic conditions, transportation options, and cultural and linguistic needs. They also expressed a desire and need for additional resources to address patient needs related to SDOH when providing MTM services. |
“To be honest, I need to have a Burmese technician because I have…a larger Burmese population in my store, and…we can only do so much, and that is very difficult (to provide MTM services) because it is not easy to find resources on as far as learning even small bits of the language.” “Like I said before, we have a lot of homebound people. Demographically it is a lower income area, so a lot of people don’t have cars, a lot of people don’t have the money to come to the pharmacy…” |
| Degree of technician involvement with MTM services |
3. High degree of technician involvement with MTM services positively contributes to MTM performance. Participants at higher performing pharmacies indicated having technicians being more involved with scheduling/preparing paperwork for CMRs and communicating 30- to 90-day prescription conversions to patients/providers; whereas, participants at lower pharmacies mentioned minimal technician involvement with MTM activities. |
“I would say, hey, [patient name] has an MTM, will you please…[put a] medication list together…if [the technicians] are slow and I am swamped, they do know how to print a [medication list] or…the other CMR worksheet from [MTM platform B] and give it to me if need be…So anything that they do are workups…for the CMRs…” |
| Conducting CMRs in person vs. phone alone |
4. Sufficient capacity to provide CMRs in person vs. phone alone positively contributes to MTM performance. Participants at higher performing pharmacies indicated having more success with completing CMRs in person and participants at lower performing pharmacies typically conducted CMRs via phone with minimal success, and also expressed concern with inadequate capacity (e.g., time) to complete CMRs when the patient comes into the pharmacy. |
“…we certainly try calling patients from time to time too, but sometimes you get a hold of people, sometimes you don’t…so you never really know what you are going to get…but when they are [at the pharmacy], we just ask, hey, do you have some time to sit down with us and go through your medication list [CMR], I would like to kind of talk with you, see how things are going, are you having issues, anything you would like to change…all those kinds of questions… they are generally really receptive to that… We have had pretty decent success with that…” |
| Priority level of MTM services |
5. Placing a high priority on MTM services positively contributes to MTM performance. Participants at higher performing pharmacies made a concerted effort to prioritize addressing MTM services daily; whereas participants at lower performing pharmacies placed lower priority on MTM services. |
“…our mission kind of from the start is to try [address MTM tasks] daily when we can. So, we do our best to start with it in the morning, but unfortunately…sometimes it is just not practical to have that approach, so you really just try to make room for it when you can…you know, assess the situation of your queues, your prescriptions and work flow…once you get to the point where you’ve got everything covered for the next couple of hours…okay, I am caught up well enough right now, I am going to try to get some MTM work done. Usually if you are looking…you can find a point in the day where you are fairly well caught up and you can get some of it done.” |
| Clinical Information Systems: use of systems to organize patient and population data and to facilitate efficient and effective MTM delivery* | ||
| Proportion of available clinical information systems (CISs) used to identify patients eligible for MTM services |
6. Using maximum number of available CISs to identify patients eligible for MTM services positively contributes to MTM performance. Most pharmacist participants reported having access to 3different clinical information systems (CISs): 2 MTM vendor platforms and the pharmacy’s proprietary prescription software system. The system allows for partial integration with MTM platforms and communication of MTM opportunities directly from Medicare Part D plans. Participants at higher performing pharmacies used all CISs; in contrast, participants at lower performing pharmacies preferred 1CIS over the other and thus, primarily only used 1to identify patients eligible for MTM |
“…so our computer [prescription software] systems that we use in our pharmacy are designed to flag eligible patients who are eligible for MTM services, be those CMR or TMR…there is information that is loaded in from [MTM platform B] and [MTM platform A]… and it will tell us to go to one of those respective platforms to take care of the [CMR or TMR]…those are definitely our primary sources for identifying eligible patients…” |
| Technicians’ use of CISs to collect and/or document information for pharmacists to assess medication adherence |
7. Technician using CISs to collect and/or document patient information positively contributes to MTM performance. Technicians at higher performing pharmacies mentioned leveraging the prescription software system and MTM platforms to collect and/or document information (e.g., current medications) necessary for pharmacists to assess patients’ adherence to medications and conduct CMRs. |
“[as a technician] I can go on [MTM platform B] and it says this person is…late to refill, so I will… switch back to [prescriptions software system], and see when the last time they got their prescription refilled… so then…the pharmacist usually puts like a…counseling note in there to [speak with the patient]… then [when documenting in MTM platform B]… you pick the pharmacist that you are working with and they will come over and okay for me to bill it.” |
| Methods used to communicate adherence vs. indication MTPs to providers |
8. Faxing prescriber recommendations for adherence MTPs and calling on indication MTPs positively contributes to MTM performance. Participants at higher performing pharmacies mentioned having most success with faxing (electronically or via fax machine) adherence related MTPs (e.g., 30- to 90-day prescriptions) and calling providers on indication related MTPs (e.g., initiating therapy). |
“We actually have a section on the computer in the program that we can print off… the 90-day conversion… I will print that request off and generally it has all of the information on it. Sometimes I will put a note on there that insurance pays 90 days for the same price and would you please send over a new prescription. Luckily all of our prescribers are very good at doing that… I think most commonly [indication related recommendations to providers] is going to be a phone call. They are pretty reliable about… if we leave them a voicemail, they usually get back to us by the end of the day or early the next morning and that is always good enough for what we are doing. So, I think the most success we have had is by phone call.” |
| Patient Self-Management Support: empower and prepare chronically-ill patients to manage their health and health care* | ||
|
No discrete strategies identified. Most participants, regardless of pharmacy performance, discussed the value of strong pharmacy staff-patient relationships and utilizing a range of strategies to promote medication adherence (e.g., pill boxes, 90-day prescriptions, medication synchronization). Generally, participants perceived high risk medication use to be the most challenging MTP to address because most patients/physicians are unwilling to change therapy. The primary post CMR self-management support tool used was the mandated “patient takeaway,” which is drafted in MTM platforms after the CMR is completed. | ||
| Decision Support: promote MTM practices that are consistent with scientific evidence and patient preferences* | ||
|
No discrete strategies identified. The extent to which decision support resources were used by staff varied across pharmacy performance; however, if tertiary resources were used it was typically company-provided. | ||
| Community Resources and Policy: mobilize community resources (e.g., programs, partnerships, policy) to meet needs of chronically ill patients* | ||
|
No discrete strategies identified. Generally, participants reported feeling referrals to community resources were not a component of MTM services; however, if community resources were mentioned it typically pertained to medication disposal sites, coupons/discount cards, and company-sponsored health screenings and immunization clinics. Some participants mentioned they would find value in having more resources to refer patients to (e.g., mental health resources). Most participants agreed the adherence measure is a good policy-relevant quality measure but desired a better way to measure the quality of a CMR. | ||
Operational definition for Chronic Care Model elements adapted from Improving Chronic Illness Care. The chronic care model: Model elements. http://www.improvingchroniccare.org/index.php?p=Model_Elements&s=18. Published 1998. Accessed May 14, 2020.
Abbreviations: CMRs=comprehensive medication reviews; MTPs=medication therapy problems; TMRs=targeted medication reviews.
Advisory Panel
Four pharmacists and 1 technician, representing unique change-in-performance categories, participated in advisory panel meetings. Upon performing a member check of findings, all participants agreed the 8 strategies provided a well-balanced, appropriate summary of strategies contributing to MTM performance. Across participants, there was consensus around ranking strategies pertaining to high degree of technician involvement with MTM (Hypothesis 3) and staff placing high priority on addressing MTM (Hypothesis 5) the most important for future research/intervention development to optimize MTM performance. Although addressing patients’ social determinants of health (SDOH), such as socioeconomic conditions, transportation options, cultural and linguistic needs, was not a challenge specific to all participant pharmacies (Hypothesis 2), participants indicated if it was, it would negatively contribute to their MTM performance and would also rank it high in importance.
Discussion
Through the systematic application of the Positive Deviance approach and Chronic Care Model, distinct strategies were hypothesized as contributing to community pharmacies’ performance on an MTM quality measure composite score. These findings inform attempts for sustainability of national health care efforts to optimize medication use among older adults. Below the 8 hypotheses generated from this study, authors’ interpretation of relationships between generated hypotheses, and proposed practice and policy implications are discussed.
First, the 2 hypotheses pertaining to pharmacy staff-provider relationships/trust (Hypothesis 1) and methods used for provider communication (Hypothesis 8) were interrelated. As anticipated, results suggested strong pharmacy staff-provider relationships and trust positively contribute to community pharmacies’ MTM performance. A recent review of physician-community pharmacist collaboration (PCPC) models concluded there were key elements persisting across models, including trust and communication.28 However, effective communication can be difficult to achieve in larger cities with numerous providers and community pharmacies’ lack of co-location with providers’ offices.29 In such settings, it is important to be strategic in methods used to communicate provider recommendations. The authors propose faxing (electronically or via fax machine) adherence-related MTP recommendations and calling providers on indication-related MTP recommendations (Hypothesis 8).
Second, 3 hypotheses pertaining to technician involvement with MTM (Hypothesis 3) and pharmacy staff use of clinical information systems (Hypotheses 6 & 7) were interrelated. Technician involvement with MTM has been studied extensively.10, 30–36 In a recent systematic review of literature, medication reconciliation was described as the most commonly (70.0%) reported technician driven MTM activity.30 This study findings extend upon these review findings by postulating specific activities that contribute to performance on MTM quality measures. For example, technician involvement with generating patient medication lists was found to positively contribute to MTM performance measures; however, this was least likely (5.0%) to be described in the systematic review.30 This points to the importance of having clinical information systems available to support technicians in performing MTM activities. Furthermore, findings from this study indicated pharmacists at lower performing pharmacies preferred using certain clinical information systems over others due to usability challenges. This aligns with previous work on MTM vendor platform generated alerts for CMRs, in which challenges with display/interface designs were commonly noted.37 Nevertheless, limiting clinical information systems used could lead to missed opportunities, negatively affecting MTM performance.
Third, lower performing pharmacies faced challenges with addressing patients’ SDOH (Hypothesis 2). Likewise, prior nationally representative MTM research indicated among beneficiaries receiving comprehensive medication reviews, racial and economic disparities exist.38 The PQA recently focused efforts to address challenges with patients’ access to medication due to SDOH subsequently developing a “Medication Access Framework for Quality Measurement.”39 Future research should apply this framework to evaluate and/or implement MTM and other community-based pharmacy services. Lastly, to help mitigate cultural and linguistic barriers, mobile/web-based applications can potentially be a resource for pharmacist to use with patients. A recent evaluation of 15 iPad-compatible language translations found some applications were potentially suitable for conversations in healthcare settings.40 Future research should evaluate use of similar applications in the context of MTM and other community-based pharmacy services.
Fourth, conducting CMRs while the patient is already at the pharmacy reduces inefficiencies (e.g., inability to reach patient, inconvenient timing etc.) with attempting to reach patients by telephone (Hypothesis 4). Community pharmacists are uniquely positioned to provide CMRs in-person compared to other types of MTM pharmacist providers. Results from previous research indicated nearly 50% of CMRs provided by community pharmacists in the United States were provided in person.41 This suggests there are substantial missed opportunities when pharmacies resort to solely providing CMRs via telephone. Future research should examine the role of telepharmacy and other virtual modalities for CMR provision and if CMR effectiveness varies by method of CMR delivery.
Lastly, study findings suggest placing high priority on addressing MTM services positively contributes to pharmacy MTM performance (Hypothesis 5). Similarly, results from prior quantitative research indicated pharmacists’ attitudes towards providing MTM services was associated with MTM completion rates.10 Likewise, Bacci et al. found pharmacy staff were more motivated to deliver adherence-related services when they understood the importance of the service to the patient and organization.42 Pharmacies interested in improving MTM performance should foster a culture conducive to making MTM services a priority among pharmacy staff.
No hypotheses were generated pertaining to patient self-management, decision support, or community resources and policy, which suggests strategies related to these 3 Chronic Care Model elements are a minimum standard (e.g., patient self-management support) for MTM provision or minimally influence performance on MTM quality measures (e.g., community resources and policy). Nevertheless, policy considerations exist. For example, many participants felt community resources were not a component of MTM services, and this aligns with previous work.12 This could be due to the lack of pharmacy incentive to refer patients to community resources, not understanding the role for community resources in helping patients manage chronic conditions, and/or lack of awareness of available resources. The Chronic Care Model specifies how “community programs can support a health system’s care for patients, but systems often don’t make the most of such resources.”18 MTM policy should provide incentives and guidance on effective incorporation of community resources in MTM services.
Limitations
Although the quality measures used in this study are policy-relevant, these measures require assumptions to be made, which is a limitation. For example, for the CMR component measure, it is assumed when a pharmacist indicates completion of a CMR that they followed the systematic process as defined by CMS; however, CMS does not require validation of this process. Likewise, the instability of MTM quality measures was a limitation. A year-to-date measurement period compared to the rolling 6-month performance period could result in more stable measures; however, year-to-date data were not readily available to the pharmacy partner in the EQuIPP dashboard. Future studies should identify ways to reliably validate pharmacists’ CMR process and measure pharmacy MTM performance using a year-to-date measure.
Due to scientific, pragmatic, and ethical considerations, researchers chose to alter the comparative analysis approach to evaluate strategies relative to change-in-performance categories (i.e., “longitudinal” approach) rather than the initial performance categories alone (i.e., cross-sectional approach). This post-hoc change-in-performance analysis approach limited the number of participants represented by each category. However, advisory panel participants’ agreement with generated hypotheses lends credibility to the study findings.
Another limitation of this study lies within the unknown transferability, because the sample includes a specific supermarket-community pharmacy chain in a single state; however, this sampling method was based on the methods used (i.e., Positive Deviance approach). Additionally, the Positive Deviance approach prioritizes qualitative methods to explore variations in the provision of health services20; hence, data analyses were biased towards prioritizing qualitative data analysis. Additionally, there is little consensus regarding minimal acceptable k-alpha (0.41 to 0.67).24 However, Krippendorff proposed researchers should use more or less conservative thresholds depending on the study objective/methods.24, 43 Lastly, this study design applied the Chronic Care Model to guide data collection and analysis, choice of a different framework might have resulted in different findings.
Conclusions
A total of 8 strategies were hypothesized as contributing to community pharmacies’ performance on MTM quality measures. Notable strategies were related to 3 of the 6 Chronic Care Model elements. Findings from this work can inform MTM practice and Medicare Prescription Drug (Part D) MTM policy changes to positively influence patient outcomes. Future research should test hypotheses in a larger representative sample of pharmacies.
Supplementary Material
Acknowledgements
The authors acknowledge the contributions of Drs. Benjamin Y. Urick and Lourdes G. Planas, external quantitative/content and mixed-methods experts respectively, for reviewing and providing valuable feedback on this manuscript. Dr. Karen S. Hudmon provided assistance with site selection.
Statement of funding source
This work was supported, in part, by the Indiana Clinical and Translational Sciences Institute, which is partly funded by the National Institutes of Health, National Center for Advancing Translational Sciences, Clinical and Translational Sciences [TL1TR001107]; and endowments established through the generosity of the Lilly Endowment, Inc. and the Hook Drug Foundation.
Conflict of interests and disclosures
Drs. Gourley and Zillich have nothing to disclose. At the time of the study, Drs. Adeoye-Olatunde, Lake, and Ray were employees at the Midwestern division, national supermarket-community pharmacy chain, where study procedures were conducted; Dr. Strohmier is a current employee at the pharmacy chain but was not at the time of the study. Dr. Snyder reports serving as a paid consultant (outside the submitted work) to Westat, Inc., for an evaluation of the Centers for Medicare and Medicaid Services (CMS) Part D Enhanced Medication Therapy Management program. Dr. Adeoye-Olatunde was supported by the Indiana Clinical and Translational Sciences Institute funded in part by award number TL1TR001107 (A. Shekhar, PI) from the National Institutes of Health, National Center for Advancing Translational Sciences, Clinical and Translational Sciences Award. The content is solely the responsibility of the authors and does not necessarily represent the official views of the National Institutes of Health.
Appendix B. Pharmacy Characteristic Comparisons
Table B.1.
Comparison of participating case pharmacy and non-particpating case pharmacy characteristics by performance category.
| Case pharmacies that participated in qualitative data collection (n=13) | Pharmacies selected as a case pharmacy but did not participate in qualitative data collection (n=5) | |||||
|---|---|---|---|---|---|---|
| Low performance (n=4) | Moderate performance (n=4) | High performance (n=5) | Low performance (n=2) | Moderate performance (n=2) | High performance (n=1) | |
| Number of FTE pharmacistsa median (IQR) | 2.0 (0) | 2.0 (1.0) | 2.0 (1.0) | 2.0 (0) | 2.0 (0) | 2.0 (N/C) |
| Weekly pharmacist overlap hoursb median (IQR) | 19.7 (12.8) | 5.5 (28.4) | 19.7 (12.8) | 7.5 (N/C) | 6.3 (N/C) | 7.3 (N/C) |
| Number of store-assigned techniciansc median (IQR) | 11.0 (2.0) | 8.0 (2.0) | 11.0 (2.0) | 6.5 (N/C) | 6.0 (0) | 8.0 (N/C) |
| Weekly total technician hours workedd mean (SD) | 279.1 (78.1) | 173.2 (125.4) | 279.1 (78.1) | 197.8 (N/C) | 166.5 (N/C) | 181.8 (N/C) |
| Level of technician traininge | ||||||
| Number of level 1 trained technicians median (IQR) | 1.0 (2.0) | 1.5 (1.0) | 1.0 (2.0) | 3.0 (N/C) | 0.5 (N/C) | 0 (N/C) |
| Number of level 2 trained technicians median (IQR) | 2.0 (3.0) | 0.5 (1.0) | 2.0 (3.0) | 0 (0) | 1.0 (0) | 2.0 (N/C) |
| Number of level 3 trained technicians median (IQR) | 7.5 (5.0) | 6.0 (4.0) | 7.5 (5.0) | 3.5 (N/C) | 4.5 (N/C) | 6.0 (N/C) |
| Number of store-assigned student interns median (IQR) | 0.5 (1.0) | 1.0 (1.0) | 0.5 (1.0) | 0.5 (N/C) | 0.5 (N/C) | 1 (N/C) |
| IPPE student(s)f n (%) | 0 (0) | 1.0 (25.0) | 0 (0) | 1.0 (50.0) | 1.0 (50.0) | 0 (0) |
| APPE student(s)g n (%) | 0 (0) | 1.0 (25.0) | 0 (0) | 0 (0) | 1.0 (50.0) | 0 (0) |
Note: data are presented for each performance category during the 6-month sampling period (July – Dec 2017)
Median number of FTE pharmacists = median number of FTE (≥ 36 hours/week) pharmacists at each pharmacy within each performance category
Weekly pharmacist overlap = median weekly overlap (when more than 1 pharmacist is working) hours at each pharmacy within each performance category
Median number of store-assigned technicians = median number of store-assigned technicians at each pharmacy within each performance category
Median weekly total amount of technician hours worked at each pharmacy within each performance category
The pharmacy company has 3levels of internal technician certificate training ranging from level 1, being entry level and level 3, which includes more advanced clinical services training.
Median number of pharmacy sites hosting at least 1 IPPE student within each performance category
Median number of pharmacy sites hosting at least 1 APPE student within each performance category
Abbreviations: APPE=Advanced Pharmacy Practice Experiences; FTE=full time equivalent; IPPE=Introductory Pharmacy Practice Experiences; IQR=interquartile range.
Footnotes
Publisher's Disclaimer: This is a PDF file of an unedited manuscript that has been accepted for publication. As a service to our customers we are providing this early version of the manuscript. The manuscript will undergo copyediting, typesetting, and review of the resulting proof before it is published in its final form. Please note that during the production process errors may be discovered which could affect the content, and all legal disclaimers that apply to the journal pertain.
Previous peer-reviewed presentations
Poster presentations at the 2019 American Association of Colleges of Pharmacy (AACP) Annual Meeting in Chicago, IL and the 2019 Indiana Clinical and Translational Sciences (CTSI) Annual Meeting in Indianapolis, IN. Podium presentation at the 2018 Midwest Social and Administrative Pharmacy Conference in Madison, WI.
References
- 1.National Center for Health, Statistics. Health, United States, 2016: With Chartbook on Long-term Trends in Health. National Center for Health Statistics (US); 2017. [PubMed] [Google Scholar]
- 2.Lahue BJ, Pyenson B, Iwasaki K, Blumen HE, Forray S, Rothschild JM. National burden of preventable adverse drug events associated with inpatient injectable medications: healthcare and medical professional liability costs. Am Health Drug Benefits. November 2012;5(7):1–10. [PMC free article] [PubMed] [Google Scholar]
- 3.Medicare Program; Medicare Prescription Drug Benefit, Fed. Reg. January 28, 2005. (42 CFR Parts 400, 403, 411, 417, 423). [PubMed]
- 4.Centers for Medicare and Medicaid Services (CMS). 2018 Medicare Part D Medication Therapy Management (MTM) Programs Fact Sheet. Accessed October 09, 2020. https://www.cms.gov/Medicare/Prescription-Drug-Coverage/PrescriptionDrugCovContra/Downloads/CY2018-MTM-Fact-Sheet.pdf
- 5.Centers for Medicare and Medicaid Services (CMS). Medicare 2017 Part C & D Star Rating Technical Notes. Accessed September 01, 2020. https://www.cms.gov/medicare/prescription-drug-coverage/prescriptiondrugcovgenin/performancedata.html
- 6.Pharmacy Quality Alliance. PQA measures used by CMS in the star ratings. Accessed September 01, 2020. https://www.pqaalliance.org/medicare-part-d
- 7.American Pharmacies. How CMS Star Ratings Will Affect Your Revenue. Accessed October 09, 2020. https://www.aprx.org/-advocacy/star-ratings-overview
- 8.Ferreri SP, Hughes TD, Snyder ME. Medication Therapy Management: Current Challenges. Integr Pharm Res Pract 2020;9:71–81. doi: 10.2147/iprp.s179628 [DOI] [PMC free article] [PubMed] [Google Scholar]
- 9.Viswanathan M, Kahwati LC, Golin CE, et al. Medication therapy management interventions in outpatient settings: a systematic review and meta-analysis. JAMA Intern Med January 2015;175(1):76–87. doi: 10.1001/jamainternmed.2014.5841 [DOI] [PubMed] [Google Scholar]
- 10.Adeoye OA, Lake LM, Lourens SG, Morris RE, Snyder ME. What predicts medication therapy management completion rates? The role of community pharmacy staff characteristics and beliefs about medication therapy management. J Am Pharm Assoc (2003). 2018;58(4s):S7–S15.e5. doi: 10.1016/j.japh.2018.03.001 [DOI] [PubMed] [Google Scholar]
- 11.Chang AC, Lincoln J, Lantaff WM, et al. Characterization of actions taken during the delivery of medication therapy management: A time-and-motion approach. J Am Pharm Assoc (2003). 2018;58(1):61–66 e7. doi: 10.1016/j.japh.2017.09.059 [DOI] [PMC free article] [PubMed] [Google Scholar]
- 12.Snyder ME, Jaynes HA, Gernant SA, Lantaff WM, Hudmon KS, Doucette WR. Variation in Medication Therapy Management Delivery: Implications for Health Care Policy. J Manag Care Spec Pharm. 2018;24(9):896–902. doi: 10.18553/jmcp.2018.24.9.896 [DOI] [PMC free article] [PubMed] [Google Scholar]
- 13.Morgan DL. Practical strategies for combining qualitative and quantitative methods: applications to health research. Qual Health Res. 1998;8(3):362–76. doi: 10.1177/104973239800800307 [DOI] [PubMed] [Google Scholar]
- 14.Goodrick D Comparative Case Studies: Methodological Briefs - Impact Evaluation No. 9. Methodological Briefs. 2014. Accessed October 09, 2020. https://ideas.repec.org/p/ucf/metbri/innpub754.html
- 15.Greene JC, Caracelli VJ, Graham WF. Toward a Conceptual Framework for Mixed-Method Evaluation Designs. Educ Eval Policy Anal. 1989;11(3):255–274. doi: 10.3102/01623737011003255 [DOI] [Google Scholar]
- 16.O’Cathain A, Murphy E, Nicholl J. The Quality of Mixed Methods Studies in Health Services Research. J Health Serv Res Policy. 2008;13:92–8. doi: 10.1258/jhsrp.2007.007074 [DOI] [PubMed] [Google Scholar]
- 17.Bradley EH, Curry LA, Ramanadhan S, Rowe L, Nembhard IM, Krumholz HM. Research in action: using positive deviance to improve quality of health care. Implement Sci. May 08 2009;4:25. doi: 10.1186/1748-5908-4-25 [DOI] [PMC free article] [PubMed] [Google Scholar]
- 18.Improving Chronic Illness Care. The chronic care model. Accessed Octobe 09, 2020. http://www.improvingchroniccare.org/index.php?p=The_Chronic_Care_Model&s=2
- 19.Wagner EH. Chronic disease management: What will it take to improve care for chronic illness? Eff Clin Pract. Aug-Sep 1998;1(1):2–4. [PubMed] [Google Scholar]
- 20.Rose AJ, McCullough MB. A Practical Guide to Using the Positive Deviance Method in Health Services Research. Health Serv Res. June 2017;52(3):1207–1222. doi: 10.1111/1475-6773.12524 [DOI] [PMC free article] [PubMed] [Google Scholar]
- 21.Bradley EH, Curry LA, Devers KJ. Qualitative data analysis for health services research: developing taxonomy, themes, and theory. Health Serv Res. 2007;42(4):1758–72. doi: 10.1111/j.1475-6773.2006.00684.x [DOI] [PMC free article] [PubMed] [Google Scholar]
- 22.NVivo qualitative data analysis software. Version 12. QSR International Pty Ltd; 2018. [Google Scholar]
- 23.Hayes AF, Krippendorff K. Answering the Call for a Standard Reliability Measure for Coding Data. Communication Methods and Measures. 2007;1(1):77–89. doi: 10.1080/19312450709336664 [DOI] [Google Scholar]
- 24.Hallgren KA. Computing Inter-Rater Reliability for Observational Data: An Overview and Tutorial. Tutorials in quantitative methods for psychology. 2012;8(1):23–34. [DOI] [PMC free article] [PubMed] [Google Scholar]
- 25.Landis JR, Koch GG. The measurement of observer agreement for categorical data. Biometrics. March 1977;33(1):159–74. [PubMed] [Google Scholar]
- 26.IBM SPSS Statistics for Windows. Version 26. IBM Corp; 2019. [Google Scholar]
- 27.Gale NK, Heath G, Cameron E, Rashid S, Redwood S. Using the framework method for the analysis of qualitative data in multi-disciplinary health research. BMC Med Res Methodol. 2013;13(1):117. doi: 10.1186/1471-2288-13-117 [DOI] [PMC free article] [PubMed] [Google Scholar]
- 28.Bardet JD, Vo TH, Bedouch P, Allenet B. Physicians and community pharmacists collaboration in primary care: A review of specific models. Res Social Adm Pharm. 2015;11 (5):602–22. doi: 10.1016/j.sapharm.2014.12.003 [DOI] [PubMed] [Google Scholar]
- 29.Snyder ME, Zillich AJ, Primack BA, et al. Exploring successful community pharmacist-physician collaborative working relationships using mixed methods. Res Social Adm Pharm. 2010;6(4):307–23. doi: 10.1016/j.saphaim.2009.11.008 [DOI] [PMC free article] [PubMed] [Google Scholar]
- 30.Gernant SA, Nguyen MO, Siddiqui S, Schneller M. Use of pharmacy technicians in elements of medication therapy management delivery: A systematic review. Res Social Adm Pharm. 2018;14(10):883–890. doi: 10.1016/j.sapharm.2017.11.012 [DOI] [PubMed] [Google Scholar]
- 31.Justis L, Crain J, Marchetti ML, Hohmeier KC. The Effect of Community Pharmacy Technicians on Industry Standard Adherence Performance Measures After Cognitive Pharmaceutical Services Training. J Pharm Technol. 2016;32(6):230–233. doi: 10.1177/8755122516669379 [DOI] [Google Scholar]
- 32.D’Epiro G, Chui M, Jensen B, Moore M, Kieser M. Effectively incorporating a technician into the medication therapy management workflow in a community pharmacy [abstract]. J Am Pharm Assoc (2003). 51(2):258. doi: 10.1331/JAPhA.2011.11517 [DOI] [Google Scholar]
- 33.Bright DR, Lengel AJ, Powers MF. Pharmacists’ Perceptions of Barriers to Implementing Medication Therapy Management and the Role of Pharmacy Technicians in Overcoming the Barriers. J Pharm Technol. 2009;25(6):361–367. doi: 10.1177/875512250902500603 [DOI] [Google Scholar]
- 34.Powers MF, Bright DR. Pharmacy Technicians and Medication Therapy Management. J Pharm Technol. 2008;24(6):336–339. doi: 10.1177/875512250802400604 [DOI] [Google Scholar]
- 35.Burnside TPT, Scott NJ, Smith MG. Implementation of technician-driven medication therapy management program in community pharmacies. J Am Pharm Assoc (2003). 2019;59(4s):S156–S160.e2. doi: 10.1016/j.japh.2019.06.014 [DOI] [PubMed] [Google Scholar]
- 36.Hohmeier KC, McDonough SLK, Rein LJ, Brookhart AL, Gibson ML, Powers MF. Exploring the expanded role of the pharmacy technician in medication therapy management service implementation in the community pharmacy. J Am Pharm Assoc (2003). 2019;59(2):187–194. doi: 10.1016/j.japh.2018.11.006 [DOI] [PubMed] [Google Scholar]
- 37.Snyder ME, Jaynes H, Gernant SA, et al. Alerts for community pharmacist-provided medication therapy management: recommendations from a heuristic evaluation. BMC Med Inform Decis Mak. 2019;19(1):135. doi: 10.1186/s12911-019-0866-0 [DOI] [PMC free article] [PubMed] [Google Scholar]
- 38.Coe AB, Adeoye-Olatunde OA, Pestka DL, et al. Patterns and predictors of older adult Medicare Part D beneficiaries’ receipt of medication therapy management. Res Social Adm Pharm. 2020;16(9):1208–1214. doi: 10.1016/j.sapharm.2019.12.007 [DOI] [PMC free article] [PubMed] [Google Scholar]
- 39.Pharmacy Quality Alliance. Access to Care: Development of a Medication Access Framework for Quality Measurement. Accessed October 09, 2020. https://www.pqaalliance.org/assets/Research/PQA-Access-to-Care-Report.pdf
- 40.Panayiotou A, Gardner A, Williams S, et al. Language Translation Apps in Health Care Settings: Expert Opinion. JMIR mHealth and uHealth. 2019;7(4):e11316–e11316. doi: 10.2196/11316 [DOI] [PMC free article] [PubMed] [Google Scholar]
- 41.Adeoye OA, Farley JF, Coe AB, et al. Medication Therapy Management Delivery by Community Pharmacists: Insights from a National Sample of Medicare Part D Beneficiaries. J Am Coll Clin Pharm. 2019;2(4):373–382. doi: 10.1002/jac5.1160 [DOI] [PMC free article] [PubMed] [Google Scholar]
- 42.Bacci JL, McGrath SH, Pringle JL, Maguire MA, McGivney MS. Implementation of targeted medication adherence interventions within a community chain pharmacy practice: The Pennsylvania Project. J Am Pharm Assoc (2003). 54(6):584–593. doi: 10.1331/JAPhA.2014.14034 [DOI] [PubMed] [Google Scholar]
- 43.Krippendorff K Content Analysis. An Introduction to Its Methodology (3rd ed). Sage Publications; 2013. [Google Scholar]
Associated Data
This section collects any data citations, data availability statements, or supplementary materials included in this article.