

Abstract
Background:
Fetal growth is predictive of health later in life. Both toxic and essential metals influence fetal growth, but most studies have focused on these elements individually and used birth weight as an indicator of fetal growth. The objective of the current study was to investigate the impact of a mixture of metals on fetal size in mid-pregnancy in a predominately lower income Hispanic pregnancy cohort in Los Angeles.
Methods:
For our primary analysis, we focused on six elements that have previously been associated individually with fetal size, including arsenic (As), barium (Ba), cadmium (Cd), mercury (Hg), molybdenum (Mo), and tin (Sn), measured in maternal urine samples collected in early pregnancy (median: 12.4 weeks gestation). In an exploratory analysis, we additionally included cobalt (Co), nickel (Ni), antimony (Sb), and thallium (Tl). Using covariate-adjusted Bayesian Kernel Machine Regression (BKMR) as our main mixture modeling approach, we examined the impact of these metals on fetal biometry measures obtained between 18 and 22 weeks gestation, with a focus on estimated fetal weight (EFW).
Results:
BKMR identified Mo and Ba as the mixture components that contributed most to associations with EFW. Linear associations were observed for both metals. An increase in Mo from the 25th to 75th percentile was associated with a 0.114 (95% credible interval (CI): −0.019, 0.247) SD higher EFW, equivalent to a 7.4 g difference. Similar associations were observed between Mo and the other fetal measures evaluated. In contrast, an increase in Ba from the 25th to 75th percentile was associated with a −0.076 (95% CI: −0.217, 0.066) SD lower EFW, equivalent to a 4.9 g difference. Similar inverse associations were observed for Ba in relation to abdominal circumference and biparietal diameter. BKMR also identified a possible interaction between Ba and Mo in relation to head circumference, suggesting that the positive associations between Mo and this outcome may be attenuated at high levels of Ba, which was consistent with findings from linear regression (Pinteraction=0.03). In an exploratory analysis accounting for a larger mixture of metals, Mo and Ba consistently contributed most to associations with EFW. An inverse association was also identified between Sb and EFW.
Conclusions:
Our results suggest that Mo may promote fetal growth, while Ba and Sb may reduce fetal growth, in this population.
Keywords: mixtures, toxic metals, essential elements, fetal growth, fetal biometry, pregnancy
1. Introduction
Fetal growth is an important determinant of health later in life.1 In particular, reduced fetal growth has been associated with numerous adverse health outcomes, including increased risk for morbidity and mortality in infancy, cardiovascular disease and metabolic dysfunction, and cognitive deficits.2–4 Traditionally, fetal growth has been evaluated using birth weight (BW),5,6 an indicator of cumulative fetal growth that correlates most strongly with growth in the third trimester.7 Yet, fetal growth in earlier stages of pregnancy can also impact postnatal physiology and may be differentially impacted by disturbances to the in utero environment.5,6,8,9
A growing number of studies have reported associations between maternal exposure to toxic metals and metalloids (hereafter, referred to as “metals” for simplicity) and reduced fetal growth.9–21 Protective and complex non-linear relationships have also been observed for certain essential elements and fetal growth.21–23 Although the majority of studies have focused on the impacts of individual metals, several recent studies have reported adverse impacts of metal mixtures, which are more representative of human exposures, on fetal growth.21,24–27 However, the majority of these studies focused on BW.24–27 Several recent studies have also begun investigating relationships between metals and fetal ultrasound measurements, but most of these studies evaluated elements individually using traditional regression approaches.9,19–21 Much less is known about the impacts of complex metal mixtures on fetal size, and this has been particularly understudied among lower income and minority populations, which may be more susceptible to multipollutant burdens.28,29
For the current study, we utilized fetal biometry measurements obtained during routine anatomy ultrasounds to investigate the impact of a complex mixture of metals on fetal size in mid-pregnancy in the Maternal and Developmental Risks from Environmental and Social Stressors (MADRES) study, a predominately lower income Hispanic pregnancy cohort in Los Angeles.30 Our objectives were to identify 1) toxic and essential elements that are associated with fetal size in mid-pregnancy after accounting for metal co-exposures, 2) potential inflection points for essential elements, and 3) possible synergistic and antagonistic interactions between metal pairs. We therefore used Bayesian Kernel Machine Regression (BKMR), a flexible mixture modeling approach that can rank the importance of correlated mixture components, investigate non-linear associations, and identify potential interactions between mixture components.31
2. Methods
2.1. Study Population
MADRES is an ongoing, prospective pregnancy cohort, which began enrolling participants in November 2015 and has been described previously.30 Briefly, participants are recruited from four prenatal care providers in Los Angeles, California, which include two community health clinics, one county hospital prenatal clinic, and one private obstetrics and gynecology practice. Most of the participating clinics serve predominately lower income Hispanic populations. Women are eligible to participate in MADRES if their pregnancy is at <30 weeks gestation at the time of recruitment, they are ≥18 years of age, and they can speak English or Spanish fluently. Exclusion criteria include: 1) HIV positive status; 2) having a physical, mental, or cognitive disability that would prevent participation in the study or the ability to provide informed consent; 3) current incarceration; and 4) multiple gestation. Informed consent was obtained from each participant at study entry, and the study protocol was approved by the University of Southern California’s Institutional Review Board. Given the objectives of the study, analyses were restricted to participants who 1) enrolled prior to 20 weeks gestation; 2) provided a urine sample at their first study visit, prior to urine metals analysis (Fall 2019); and 3) provided a urine sample that was collected prior to a routine anatomy ultrasound scan falling between 18 and 22 weeks gestation. A total of 195 participants met these criteria and had complete covariate information. Two of these participants were excluded from the current study because they had unusually low Mo concentrations. Characteristics of the remaining 193 participants were generally similar to all MADRES participants who enrolled prior to 20 weeks gestation and prior to Fall 2019 when urinary metals assessment occurred (Table S1).
2.2. Urine Metals Analysis
Spot urine samples were collected by participants during their first study visit in a 90 mL sterile specimen container (VWR, catalog number: A11A2181). The median (range) gestational age (GA) at collection was 12.4 (6.4–21.6) weeks. Samples were transported on ice to the laboratory within one hour for processing. 1.5 mL aliquots were then stored at −80 °C in sterile cryovials (VWR, catalog number: 89092–260).
Urine metals analysis was performed by NSF International in collaboration with the Children’s Health Exposure Analysis Resource (CHEAR). Metals were measured using inductively coupled plasma mass spectrometry (ICP-MS) based on the Centers for Disease Control method 3018.3, with modifications for the expanded metals panel and the Thermo Scientific iCAP RQ instrument (serial number RQ0029). The elements measured for this panel include: antimony (Sb), arsenic (As), barium (Ba), beryllium, cadmium (Cd), cesium, cobalt (Co), copper, chromium, mercury (Hg), manganese, molybdenum (Mo), nickel (Ni), lead, platinum, tin (Sn), thallium (Tl), tungsten, uranium, vanadium, and zinc. All quality control samples, blanks, and urine samples were diluted 10-fold in a diluent consisting of 2% HNO3 solution containing the internal standards and gold. Standards were prepared in 1% trace metal grade nitric acid and diluted 10-fold with a diluent consisting of 2% HNO3 solution containing the internal standards to minimize any matrix effect. The rinse solution for the instrument was 1% trace metal grade nitric acid. The samples were analyzed in two analysis modes: 1) standard (default) for the majority of metals and 2) kinetic energy discrimination for vanadium, chromium, As, Cd, and Mo. %CVs were between 0.8% and 7.0% for all elements. Five empty cryovials were also sent to NSF International for testing to evaluate possible metal contamination; 96% of all metal measures were below the limits of detection (LOD). The CHEAR Lab Hub reviewed all measures to ensure that they conformed to acceptable quality standards.
For the current study, we focused on six metals (As, Ba, Cd, Hg, Mo, Sn), which were selected because they met three criteria: 1) they were above the LOD for ≥60% of participants, 2) there is evidence that urine is an acceptable matrix for assessing their exposure,32–37 and 3) they have previously been associated with fetal ultrasound measures.9,19–21 Beryllium, chromium, platinum, uranium, vanadium, and tungsten were excluded because they did not meet criterion 1 (above the LOD for ≥60% of participants), while cesium, copper, lead, manganese, and zinc were excluded because they did not meet criterion 2 (urine as an acceptable matrix). Co, Ni, Sb, and Tl were excluded from the primary analysis because they did not meet criterion 3 (prior associations with fetal biometry). However, in an exploratory analysis we investigated associations including these four additional metals. Importantly, the As measure from the CHEAR panel is total As, which is comprised of many different As species and metabolites, including arsenobetaine (AsB), which is a non-toxic form of As derived from fish and seafood.38 We therefore replaced the total As measure from this panel with speciated urinary As data, described in more detail below. LOD ranges for metals retained from the CHEAR panel were: 0.121–0.200 μg/L for Ba, 0.0656–0.1200 μg/L for Cd, 0.0606–0.1000 μg/L for Co, 0.0606–0.1000 μg/L for Hg, 0.328–0.600 μg/L for Mo, 0.969–1.600 μg/L for Ni, 0.0485–0.0800 μg/L for Sb, 0.121–0.200 μg/L for Sn, and 0.0242–0.0400 μg/L for Tl. The number (%) of samples below the LOD for these 9 elements were as follows: Ba: 0 (0%), Cd: 57 (30.3%), Co: 4 (2.2%), Hg: 3 (1.6%), Mo: 0 (0%), Ni: 20 (10.9%), Sb: 67 (36.4%), Sn: 30 (16.0%), Tl: 40 (21.7%). Values below the LOD were replaced with the LOD/√2.
2.3. Speciated Urinary Arsenic
Speciated urinary As was measured by the Arizona Laboratory for Emerging Contaminants, using methods previously described by the Centers for Disease Control and Prevention.39 Briefly, arsenite (AsIII), arsenate (AsV), monomethyl arsenic (MMA), dimethyl arsenic (DMA), and AsB were measured by High Performance Liquid Chromatography, using the Hamilton PRP-X100 column, coupled to ICP-MS. Working calibration standards were prepared daily for each As species at concentrations ranging from 0.2 to 10 μg/L. For quality control, a mid-range calibration check sample was prepared using 2 μg/L mixed species standard. For each batch of 30 samples, at least three samples were spiked with a low-to-mid range standard to monitor As recovery for each species. Evaluation of recovery was calculated by comparing the sum of the individual species to the reported total As measure. Measures were considered acceptable if they were within ±10% of the total As concentration. LODs across four analytical runs ranged from: 0.011 to 0.040 μg/L for AsIII, 0.020 to 0.143 μg/L for AsV, 0.020 to 0.086 μg/L for MMA, and 0.014 to 0.169 μg/L for DMA. The number (%) of values below the LOD were 111 (59.0%) for AsIII, 79 (42.0%) for AsV, 44 (23.4%) for MMA, and 2 (1.1%) for DMA. Values below the LOD were set to the LOD/√2. Total speciated urinary arsenic, excluding AsB, was calculated by summing the inorganic As metabolites (AsIII + AsV), MMA, and DMA. This variable was used as the primary As measure for all statistical analyses.
2.4. Specific Gravity
Urine specific gravity (SG) was measured by a refractometer (Itago), and urinary metal concentrations were adjusted for SG to account for urine dilution in primary analyses, using the formula: Ac = A × [(SGmean−1)/(SG−1)], where Ac = the SG-adjusted metal concentration, SGmean = the mean SG value for the study sample, and SG = the SG value of the participant.40
2.5. Fetal Biometry Measures
Fetal biometry measurements, including estimated fetal weight (EFW), abdominal circumference (AC), head circumference (HC), biparietal diameter (BPD), and femur length (FL) were abstracted from maternal medical records. Analyses were restricted to fetal measurements obtained between 18 and 22 weeks gestation, as this is the recommended window for routine anatomic scans. If more than one ultrasound record was available for a participant during this window, the ultrasound closest to 20 weeks was selected. However, in one case, the ultrasound closest to 20 weeks gestation preceded the participant’s urine collection. To ensure that all analyses were prospective, we selected a later ultrasound record for this participant from the 18–22 week window (21.6 weeks gestation) which occurred after her first visit urine sample had been collected (20.1 weeks gestation). The median (range) GA at ultrasound for the study sample was 20.4 (18.1–22.0) weeks. Distributions of each fetal measure were inspected using histograms, both on their original scale and after mean-centering and standard deviation scaling the measures, as was performed for statistical analyses. These distributions were relatively normal (Figure S1), and no extreme outliers were identified on either scale (p-value>0.05 for Rosner’s test41). To determine if the fetal measures were appropriate for their GA, they were compared with GA-specific fetal measures previously published for the Brigham and Women’s Hospital Standard Population.42 The fetal measures were very similar across the two populations (Table S2).
2.6. Covariates
Questionnaires were verbally administered to participants during the first study visit in either English or Spanish, depending on the preferred language, to obtain information on pre-pregnancy weight, race, ethnicity, birth country, smoking status during the pregnancy, education level, and prenatal vitamin use. Participants were also asked if they resided with a smoker during their pregnancy. Maternal standing height was measured twice by stadiometer (Perspectives Enterprises Model PE-AIM190 101). Maternal pre-pregnancy BMI was calculated using the self-reported pre-pregnancy weight and measured height values (kg/m2). Each participant’s age was determined using the date that she consented and her birth date. A combined variable indicating race by ethnicity and birthplace was created based on the participant’s self-reported race (white, Asian, black or African American, Native Hawaiian or other Pacific Islander, American Indian or Alaska Native, more than one race), ethnicity (Hispanic or non-Hispanic), and birth country (U.S. or other). This variable was collapsed into five categories: non-Hispanic white, non-Hispanic black, non-Hispanic other, Hispanic born in the U.S., and Hispanic born outside the U.S. and was compared with a variable that was further collapsed into three categories: Hispanic born in the U.S., Hispanic born outside the U.S., and non-Hispanic. A combined variable was also created for any tobacco smoke exposure during the pregnancy, which was based on self-reported maternal smoking or the participant reporting that she shared a residence with a smoker. Information on newborn sex was abstracted from medical records. If this information was missing from the maternal medical records, it was obtained from a questionnaire administered to the mothers 7–14 days after birth. Maternal hemoglobin and hematocrit measures were also abstracted from medical records for the pregnancy period. Using GA-specific cutoffs for these measures,43 participants were classified as ever versus never being anemic prior to the fetal ultrasound date. The GA at the ultrasound and the GA at urine collection were calculated using the best estimate of GA at birth, which has been described previously.11
2.7. Statistical Analyses
Statistical analyses were conducted in R (version 3.6.2)44. A priori, we hypothesized that toxic (e.g., As, Ba, Cd, Hg, Sn) and essential (Mo) elements would act in opposing directions. We therefore used Bayesian Kernel Machine Regression (BKMR) for our mixture approach, because it is a flexible method that does not constrain associations to a single direction.31 It can also rank the importance of correlated mixture components, accommodate non-linear associations between exposures and outcomes, and evaluate all possible synergistic and antagonistic relationships between mixture components without specifying these a priori. Using the “bkmr” R package,31 we chose the variable selection option and ran 200,000 Markov chain Monte Carlo iterations. The first half of iterations was used as burn-in. To reduce potential autocorrelation, we thinned the chains, selecting every 10th iteration. Model convergence was inspected visually using trace plots.
For our primary analysis, we collectively evaluated the six selected urinary elements (As, Ba, Cd, Hg, Mo, Sn) in relation to each fetal measure, using the following model: Yi=h(Asi, Bai, Cdi, Hgi, Moi, Sni) + βTCi + εi, where h(·) represents the exposure-response surface estimated using the Gaussian kernel function, coefficients βT represent effect estimates for the Cth covariate for the ith individual, and εi represents the model residuals. Our primary outcome of interest was EFW. In secondary analyses, we additionally evaluated AC, FL, HC, and BPD. Fetal measures were mean-centered and standard deviation scaled prior to their inclusion in BKMR. In an exploratory analysis, we additionally included Co, Ni, Sb, and Tl in the kernel function for the EFW model.
Metals were right-skewed and therefore log2-transformed. Extreme metal outliers were identified on the log-scale using Rosner’s test41 and were excluded from the primary model (N=1 for As, N=4 for Sn) and also from the exploratory analysis (N=1 for As, N=1 for Co, N=1 for Ni, N=2 for Sb, N=4 for Sn). Hypothesized confounders and precision variables were identified using directed acyclic graphs45 (Figure S2). These included GA at ultrasound, recruitment site, maternal age, pre-pregnancy BMI, maternal race by ethnicity and birthplace, maternal education, infant sex, maternal anemia, prenatal vitamin use prior to and during the pregnancy, parity, in utero tobacco smoke exposure (maternal or other), and urinary AsB, a biomarker of fish and seafood consumption.46 In preliminary analyses, using generalized additive models, associations were visually similar with and without additional adjustment for maternal anemia, parity, prenatal vitamin use, and in utero tobacco smoke exposure. These covariates were therefore excluded from the final BKMR models. Furthermore, results were similar when the five-category maternal race by ethnicity and birthplace variable was collapsed into a three-category ethnicity by birthplace variable. The final BKMR models therefore included this collapsed variable. Because urinary AsB was right-skewed, it was log2-transformed to reduce the influence of extreme values. All metals and continuous covariates were mean-centered and scaled prior to being entered into the BKMR.
In a sensitivity analysis, we re-ran the BKMR model replacing the abstracted EFW measure with an EFW measure that we calculated based on the abstracted HC, AC, and FL measures using the Hadlock Formula 3.47 We also ran a sensitivity analysis for the BKMR model to address residual confounding from fish/seafood consumption by replacing the total speciated As measure with a calibrated As measure. We created this calibrated measure using residual regression to remove variance in the individual As species (iAs, MMA, and DMA) explained by AsB and then summing the residuals from each model to create a new biomarker reflecting As exposure not derived from fish/seafood intake, as described previously.48
The default BKMR prior specifications were used for the primary model (EFW)31. The default specifications were also used for AC, HC, and BPD. However, for FL there was evidence of overfitting for some of the metals when using the default specifications. We therefore specified a higher degree of smoothness (b=200) for this outcome. In sensitivity analyses, we also investigated the influence of prior specification for the primary model (EFW) by fitting the BKMR with two alternative prior assumptions, which allowed for different degrees of smoothness (b=50 and b=1000, compared with the default b=100). Additionally, results from the primary model (N=188) were compared with a model that included the extreme metal outliers for As and Sn (N=193).
Metals that ranked highly based on their BKMR posterior inclusion probabilities (PIPs) were further investigated using traditional linear regression models, adjusting for the same set of covariates. We also used linear regression models to determine if the main findings identified by BKMR were robust after 1) additionally adjusting for the GA at urine collection, 2) adjusting for SG as a covariate rather than directly correcting the urinary metal concentrations for SG, and 3) using machine values for metal concentrations falling below the LOD rather than setting these values to the LOD/√2. Additionally, we further investigated pairwise interactions identified by BKMR, which were confirmed by linear regression models, using a third method (NLinteraction). Similar to BKMR, NLinteraction is a flexible mixture modeling approach. However, an advantage of this novel method is that it can generate PIPs for interactions between mixture components in addition to main effect PIPs.49 To conduct this analysis, we used the “NLinteraction” R package49, using the default threshold and prior specifications. We ran 200,000 MCMC iterations (half of which were removed for burn-in). Unlike BKMR, which uses a Gaussian kernel, the NLinteraction approach models exposure-response relationships using natural cubic splines. We selected 1 degree of freedom for these splines based on the Watanabe-Akaike information criterion. Importantly, the NLinteraction results are sensitive to a threshold parameter (τh), which influences the likelihood of an exposure being included in the function. We therefore compared results after varying this parameter from the default value of 0.10 to a smaller (more conservative) value of 0.05 and to a larger (less conservative) value of 0.25.
3. Results
3.1. Participant Characteristics and Urinary Metal Concentrations
Participant characteristics are shown in Table 1. Participants were between 18–45 years of age, with a median pre-pregnancy BMI of 27.1 kg/m2. The majority (76.6%) of participants were Hispanic, and 41.5% of participants were Hispanic and born outside of the U.S. Approximately one quarter of the participants (26.6%) did not complete high school. Urinary AsB concentrations ranged from <LOD to 483.7 μg/L with a median of 0.7 μg/L. The EFW measures abstracted from the medical records were highly correlated with the EFW measures that we calculated using the Hadlock 3 formula (rho>0.99, P<2.2 × 10⁻¹⁶) (Figure S3). Maternal urinary metal concentrations are shown in Table 2, and Pearson correlations between urinary metals are shown in Figure 1. Correlations between metal pairs were weak to moderate, ranging from ±0.03 to ±0.36.
Table 1.
Participant Characteristics (N=188)
| Characteristic | Median (Range) or N (%) |
|---|---|
| Maternal Age, years | 29 (18–45) |
| Maternal Pre-Pregnancy BMI, kg/m2 | 27.1 (15.7–53.6) |
| Estimated Fetal Weight, g | 375 (231–570) |
| Abdominal Circumference, cm | 15.6 (13.0–18.3) |
| Femur Length, cm | 3.4 (2.6–4.1) |
| Biparietal Diameter, cm | 4.8 (3.8–5.7) |
| Head Circumference, cm | 17.9 (14.8–22.0) |
| Gestational Age at Ultrasound, weeks | 20.4 (18.1–22.0) |
| Maternal Urinary AsB, μg/L | 0.7 (<LOD-483.7) |
| Recruitment Site | |
| Clinic Site A | 42 (22.3) |
| Clinic Site B | 112 (59.6) |
| Clinic Site C | 26 (13.8) |
| Clinic Site D | 8 (4.3) |
| Maternal Ethnicity by Birth Place | |
| Non-Hispanic | 44 (23.4) |
| Hispanic Born in the U.S. | 66 (35.1) |
| Hispanic Born Outside the U.S. | 78 (41.5) |
| Maternal Education | |
| Did Not Complete High School | 50 (26.6) |
| Completed High School | 48 (25.5) |
| Completed Some College or Technical School | 51 (27.1) |
| Completed College | 39 (20.7) |
| Maternal Parity | |
| Primiparous | 59 (31.4) |
| Multiparous | 129 (68.6) |
| Infant Sex | |
| Male | 100 (53.2) |
| Female | 88 (46.8) |
| In Utero Tobacco Smoke Exposure | |
| Any | 16 (8.5) |
| None | 172 (91.5) |
Table 2.
Maternal Urinary Metal Concentrationsa
| Metal | Mean ± SD | Min | 5th | 25th | 50th | 75th | 95th | Max |
|---|---|---|---|---|---|---|---|---|
| Metals Included in Primary Analysis | ||||||||
| As, μg/L | 7.2 ± 4.1 | 1.8 | 3.2 | 4.5 | 5.9 | 8.3 | 16.0 | 27.7 |
| Ba, μg/L | 7.7 ± 10.3 | 0.1 | 0.7 | 1.9 | 4.3 | 9.0 | 25.5 | 70.0 |
| Cd, μg/L | 0.21 ± 0.16 | <LOD | <LOD | <LOD | 0.16 | 0.28 | 0.56 | 0.87 |
| Hg, μg/L | 1.83 ± 2.6 | <LOD | 0.13 | 0.47 | 0.91 | 2.07 | 6.50 | 16.10 |
| Mo, μg/L | 70.3 ± 47.0 | 14.9 | 27.9 | 44.3 | 57.4 | 81.1 | 156.8 | 359.3 |
| Sn, μg/L | 0.90 ± 1.51 | <LOD | <LOD | 0.28 | 0.47 | 0.92 | 2.50 | 11.16 |
| Metals Additionally Included in Exploratory Analysis | ||||||||
| Co, μg/L | 0.77 ± 0.52 | <LOD | 0.27 | 0.39 | 0.64 | 0.92 | 1.77 | 3.61 |
| Ni, μg/L | 3.57 ± 2.05 | <LOD | <LOD | 2.05 | 3.11 | 4.64 | 7.03 | 11.11 |
| Sb, μg/L | 0.10 ± 0.07 | <LOD | <LOD | <LOD | 0.09 | 0.12 | 0.20 | 0.67 |
| Tl, μg/L | 0.12 ± 0.10 | <LOD | <LOD | 0.04 | 0.08 | 0.16 | 0.30 | 0.49 |
Abbreviations used: As, arsenic; Ba, barium; Cd, cadmium; Co, cobalt; Hg, mercury; Mo, molybdenum; Ni, nickel; Sb, antimony; Sn, tin; Tl, thallium
Urinary metals were adjusted for specific gravity. Metals concentrations <LOD were set to the LOD/√2 for all statistical analyses.
Figure 1.
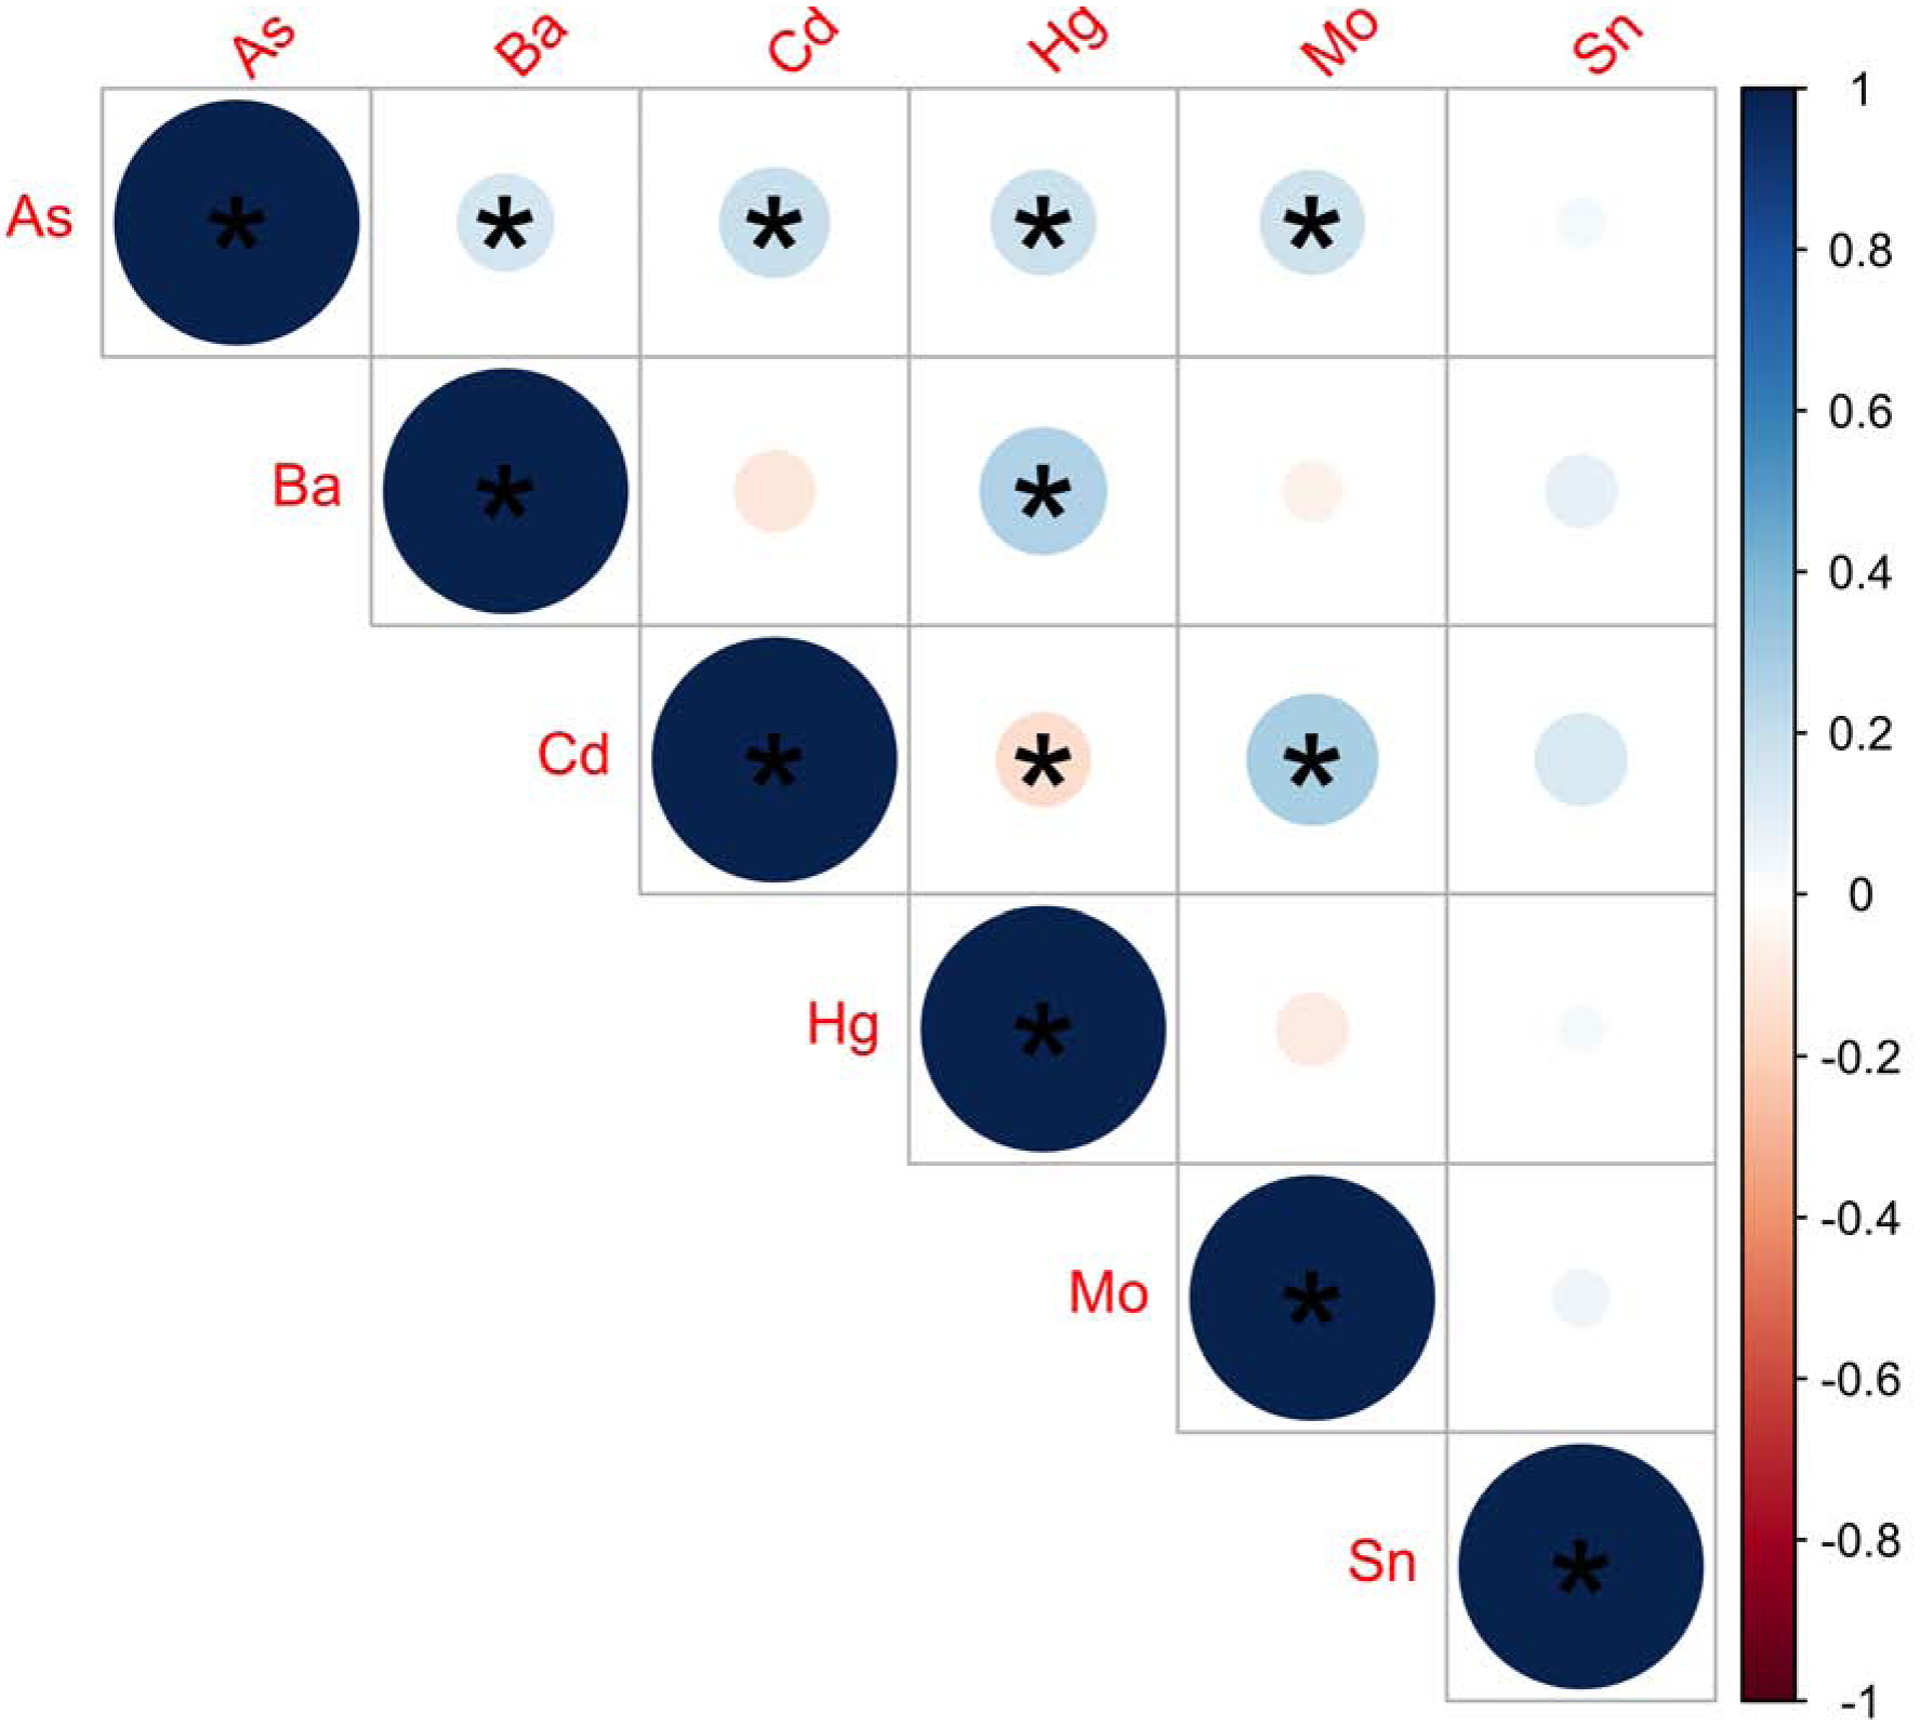
Pearson Correlations between Urinary Metals included in Primary Analysis (N=188). Stronger correlations are indicated by darker shades and larger circles. Positive correlations are indicated in blue shades and negative correlations are indicated in red shades. *p-value < 0.05. Metals were log2-transformed, mean-centered, and standard deviation scaled. Abbreviations Used: As, arsenic; Ba, barium; Cd, cadmium; Hg, mercury; Mo, molybdenum; Sn, tin.
3.2. BKMR Results
PIPs for each metal are shown for the primary EFW model in Table 3. Of the six metals evaluated, Mo ranked most highly as a predictor of EFW followed by Ba. A positive linear association was observed between Mo and EFW (Figure 2). Setting other metals to their median, an increase in Mo from the 25th to 75th percentile was associated with a 0.114 (95% CI: −0.019, 0.247) SD higher EFW, equivalent to an approximately 7.4 g higher EFW. In contrast, an inverse linear association was observed between Ba and EFW (Figure 2). Setting other metals to their median, an increase in Ba from the 25th to 75th percentile was associated with a −0.076 (95% CI: −0.217, 0.066) SD lower EFW, equivalent to an approximately 4.9 g lower EFW. Results were similar for the EFW measure calculated using the Hadlock 3 formula (Table S3, Figure S4, Figure S5) and when using the calibrated As measure derived using residual regression to remove variance from AsB (Table S4, Figure S6). Results were also similar after evaluating alternative prior assumptions for the BKMR, allowing for different degrees of smoothness, and when we included the five extreme metal outliers (data not shown).
Table 3.
EFW PIPsa
| Primary Analysis | Exploratory Analysis | |
|---|---|---|
| Metal | PIP | PIP |
| As | 0.362 | 0.247 |
| Ba | 0.512 | 0.413 |
| Cd | 0.437 | 0.328 |
| Hg | 0.358 | 0.255 |
| Mo | 0.631 | 0.485 |
| Sn | 0.334 | 0.221 |
| Co | 0.232 | |
| Ni | 0.247 | |
| Sb | 0.287 | |
| Tl | 0.230 | |
PIPs were estimated using Bayesian Kernel Machine Regression. Models were adjusted for GA at ultrasound, recruitment site, maternal age, pre-pregnancy BMI, maternal ethnicity by birthplace, maternal education, infant sex, and urinary arsenobetaine. Urinary metal and arsenobetaine concentrations were log2-transformed. Metals, EFW, and continuous covariates were also mean-centered and scaled. The top two ranking metals are bolded.
Abbreviations used: As, arsenic;Ba, barium; Cd, cadmium; Co, cobalt; EFW, estimated fetal weight; Hg, mercury; Mo, molybdenum; Ni, nickel; PIP, posterior inclusion probability; Sb, antimony; Sn, tin; Tl, thallium
Figure 2.
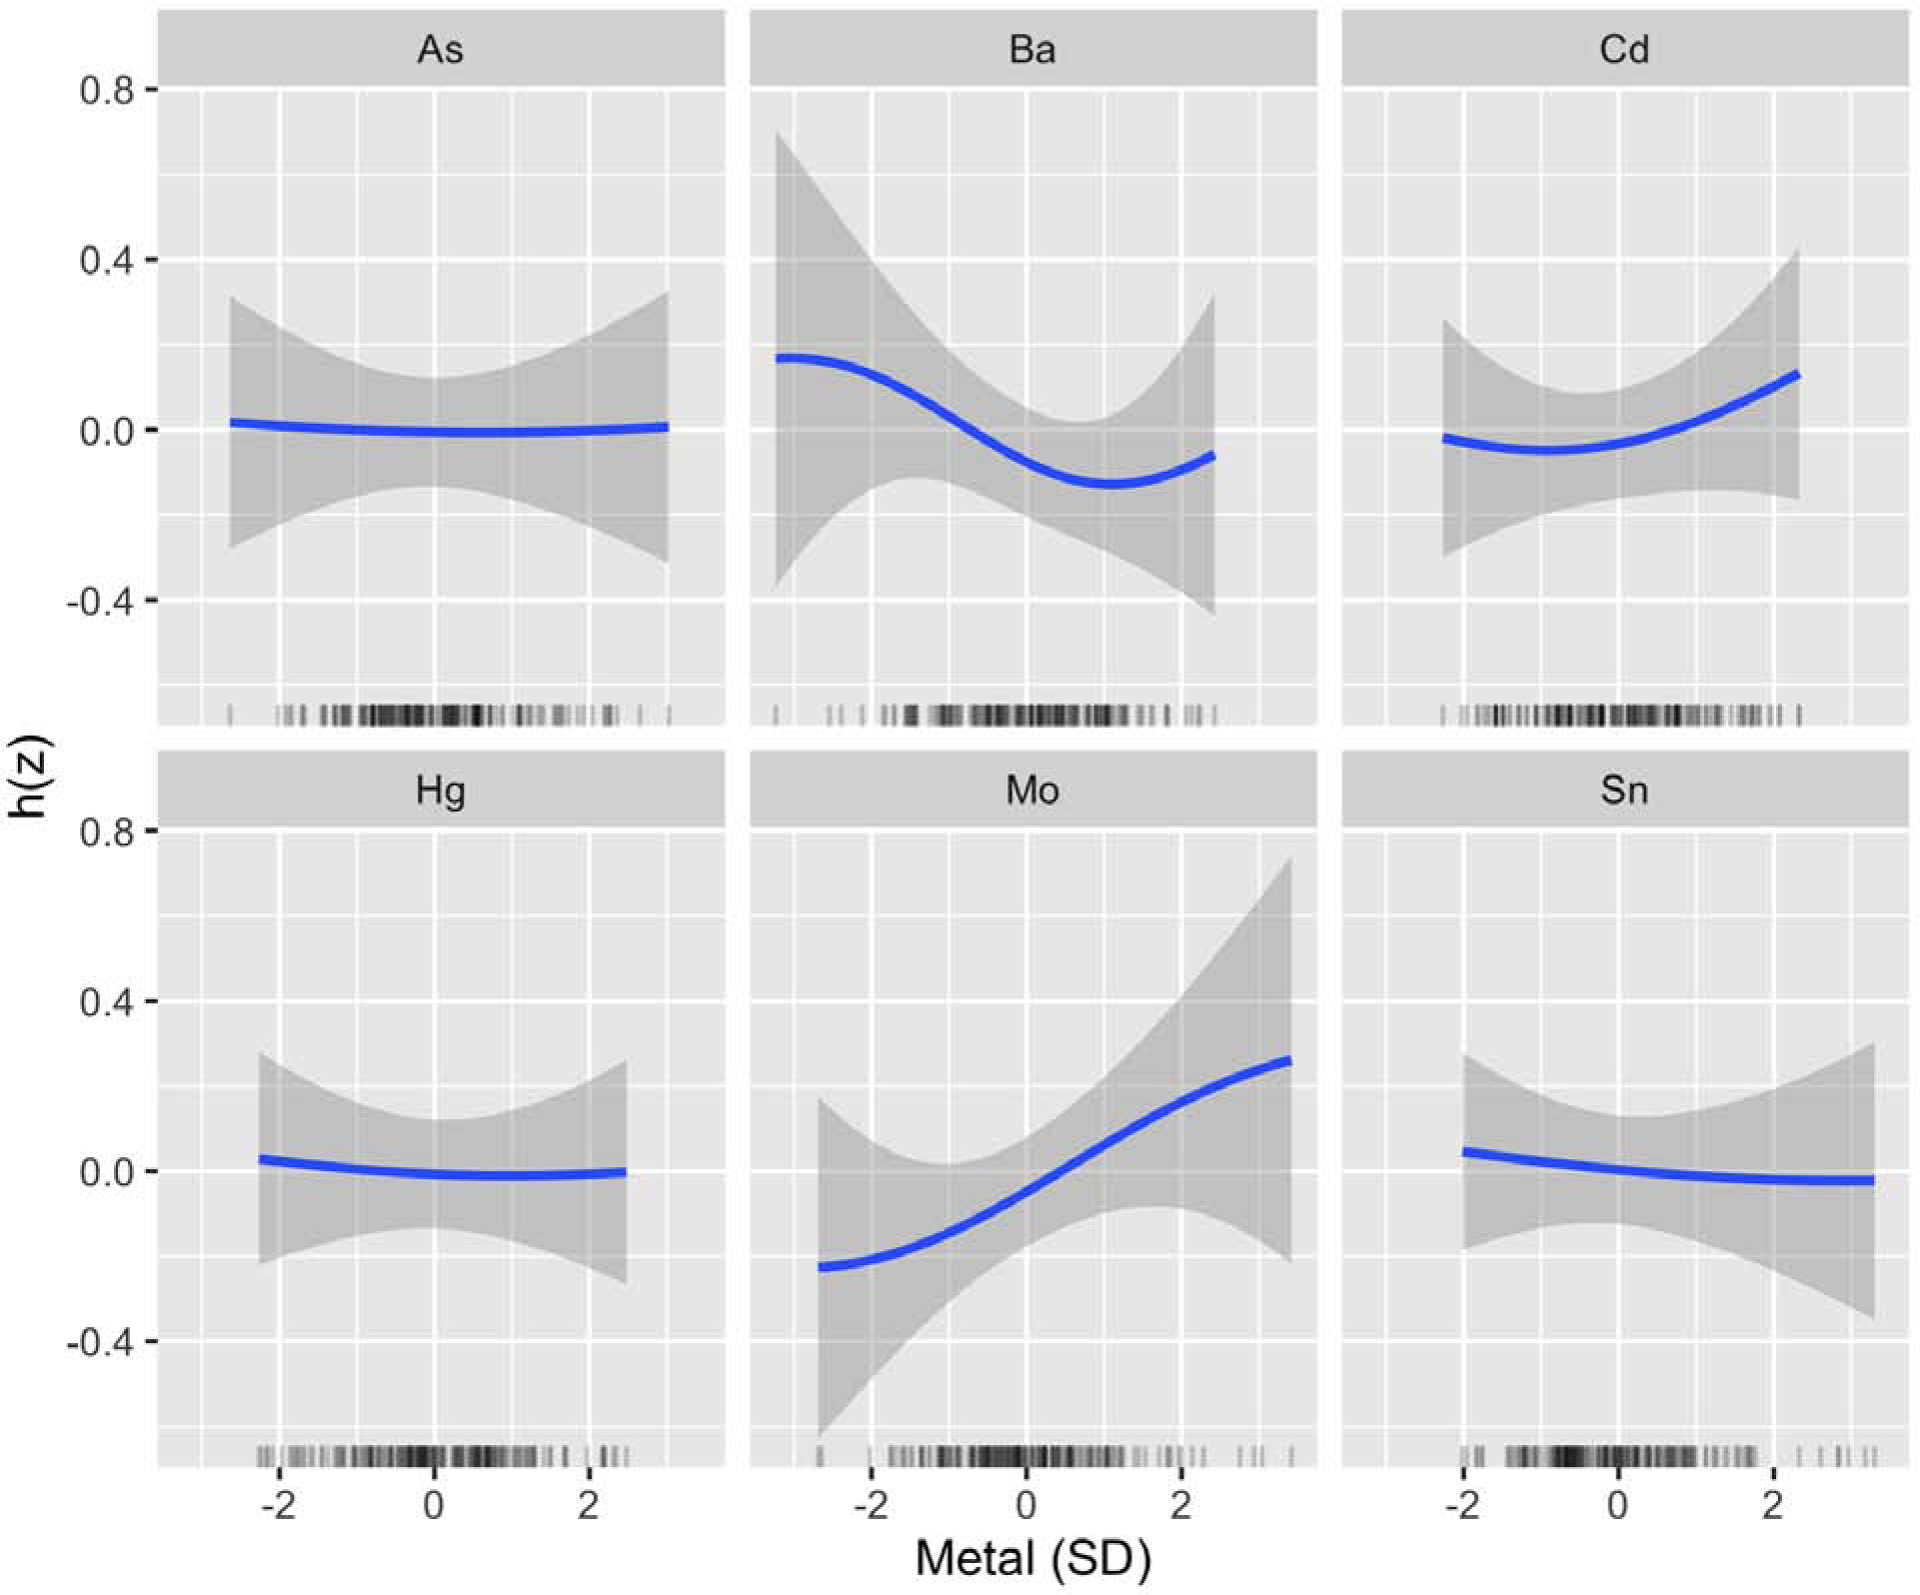
BKMR Univariate Exposure–Response Functions for Primary Analysis of EFW (N=188). Associations between each metal and EFW (with corresponding 95% credible intervals) are shown setting all other metals to their median, adjusting for GA at ultrasound, recruitment site, maternal age, pre-pregnancy BMI, maternal ethnicity by birthplace, maternal education, infant sex, and urinary arsenobetaine. Urinary metal and arsenobetaine concentrations were log2-transformed. Metals, EFW, and continuous covariates were also mean-centered and standard deviation scaled. Abbreviations Used: As, arsenic; Ba, barium; Cd, cadmium; EFW, estimated fetal weight; Hg, mercury; Mo, molybdenum; Sn, tin.
Mo consistently contributed most to the associations with other fetal measures evaluated (AC, FL, HC, BPD), based on PIPs, while Ba contributed most to associations with AC and BPD only (Table S5, Figure S7). Although Hg did not rank highly as a predictor of EFW, it ranked highly as a predictor of reduced HC. Additionally, while Cd did not rank highly as a predictor of EFW, it ranked highly as a predictor of increased FL (Table S5, Figure S7). As and Sn did not rank highly for any of the fetal measures (Table S5).
Examining bivariate relationships between the mixture components using BKMR, a possible pairwise interaction was identified visually between Mo and Ba in relation to EFW, such that the positive association between Mo and EFW appeared to be attenuated at higher levels of Ba (Figure 3). A similar interaction was also identified visually between Mo and Ba in relation to HC (Figure S8).
Figure 3.
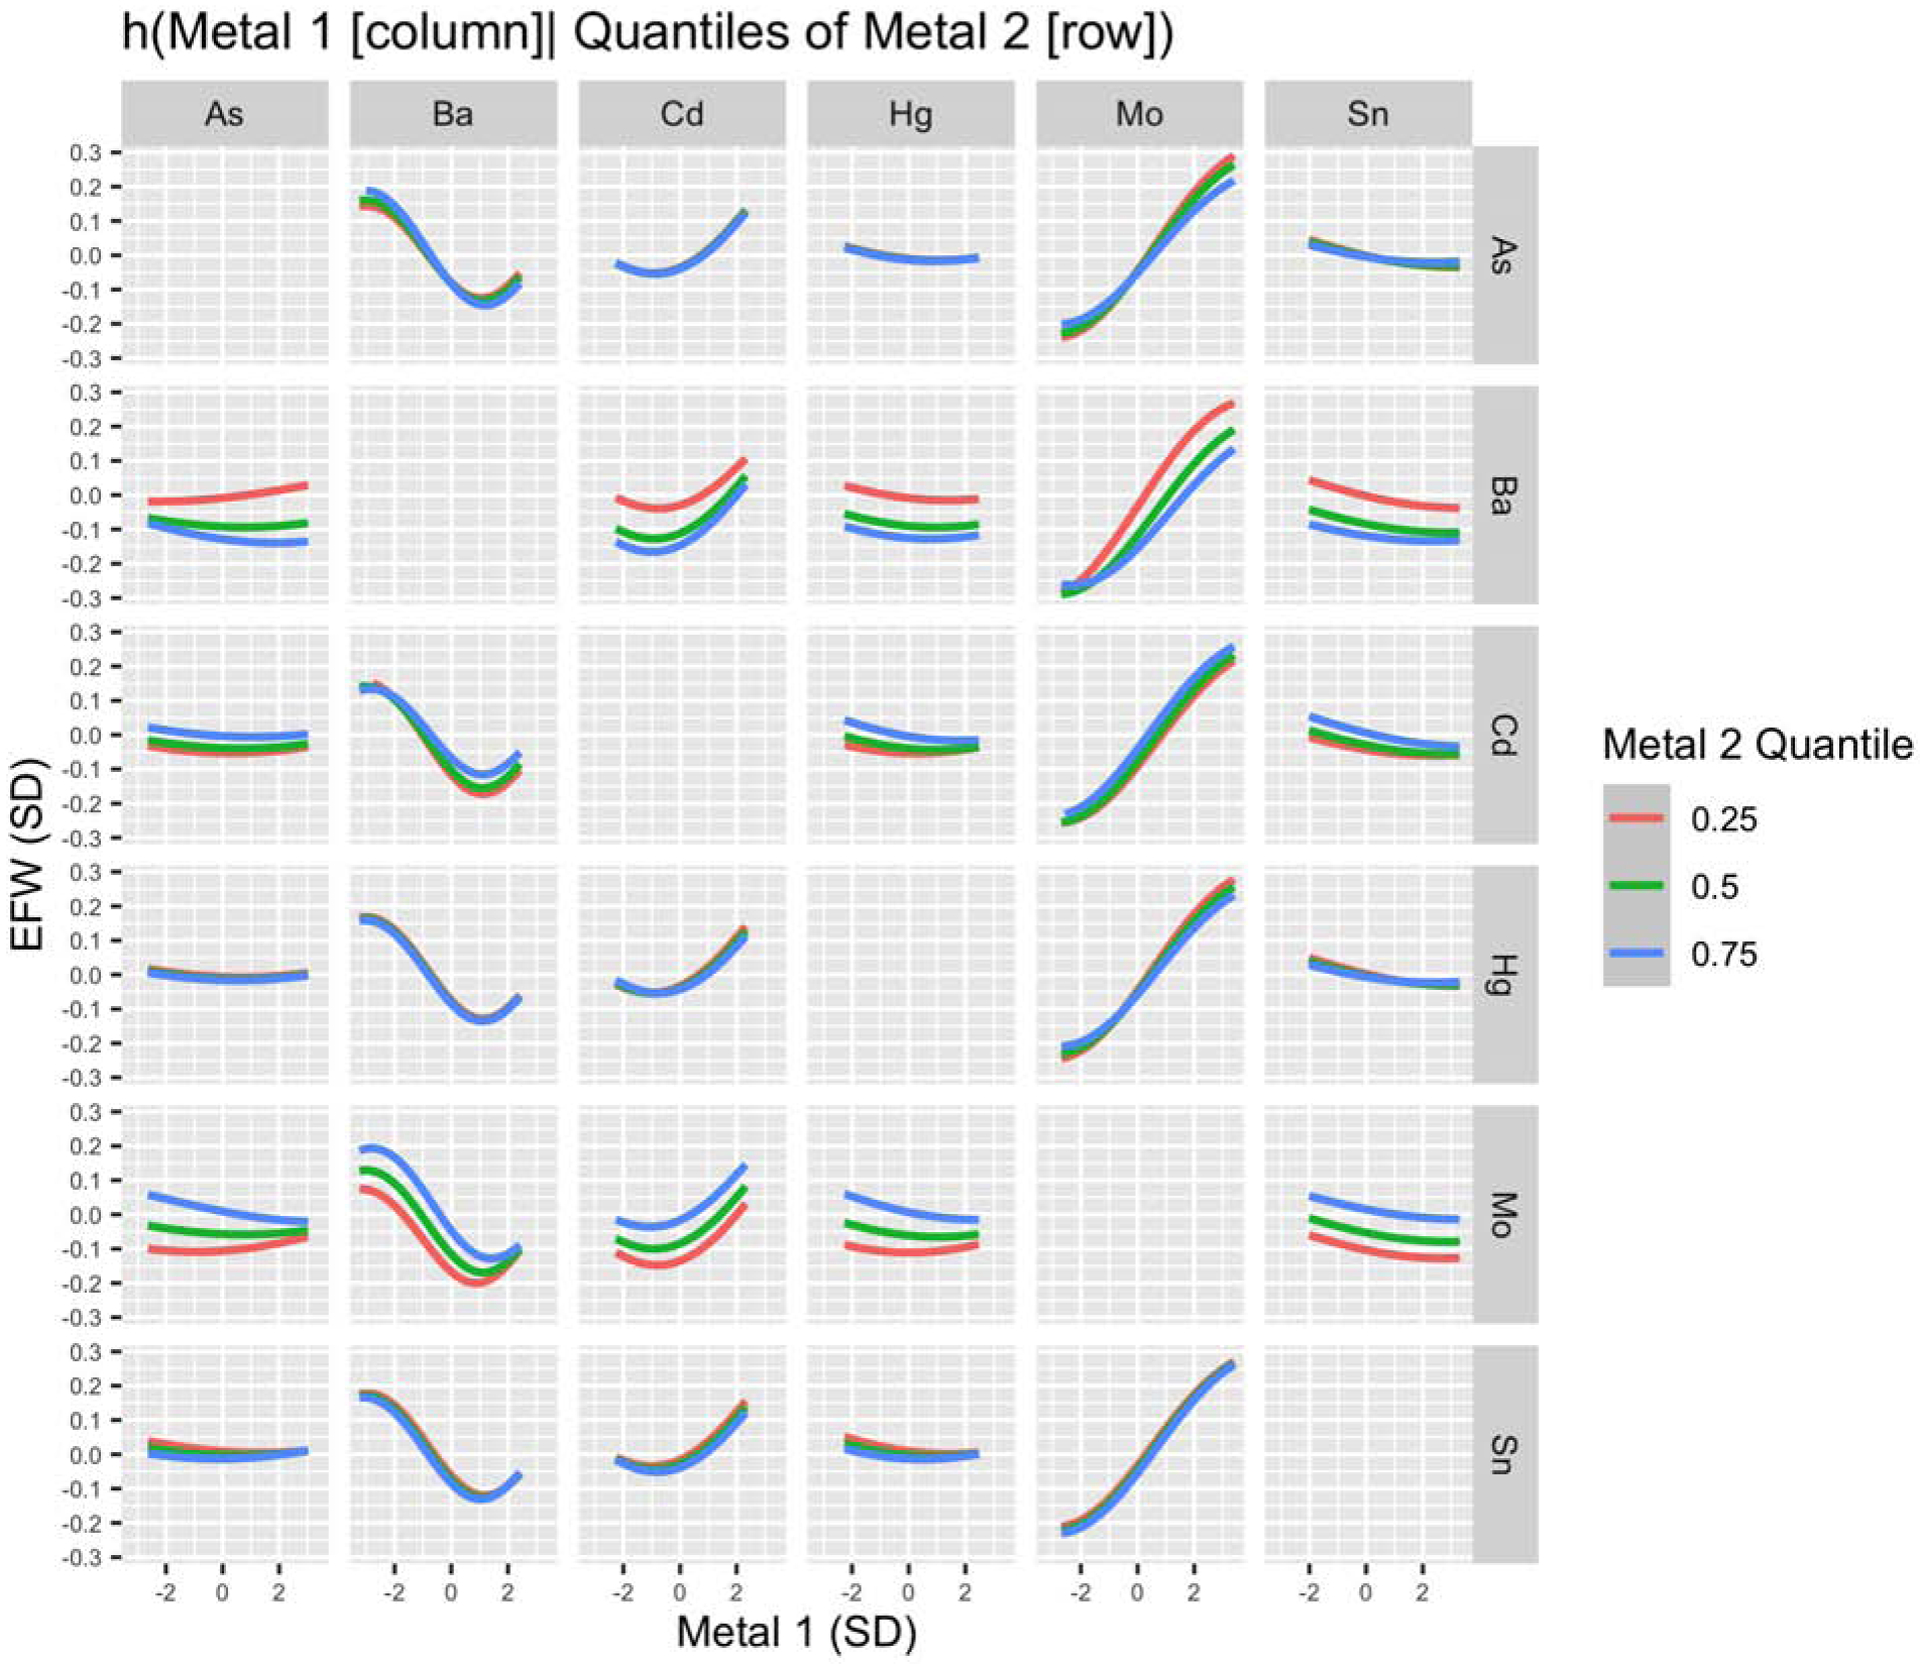
BKMR Bivariate Exposure–Response Functions for Primary Analysis of EFW (N=188). Associations between each metal (columns) and EFW are shown setting a second metal (rows) to its 25th, 50th, and 75th percentile and all other elements to their median, adjusting for GA at ultrasound, recruitment site, maternal age, pre-pregnancy BMI, maternal ethnicity by birthplace, maternal education, infant sex, and urinary arsenobetaine. Urinary metal and arsenobetaine concentrations were log2-transformed. Metals, EFW, and continuous covariates were also mean-centered and standard deviation scaled. Abbreviations Used: As, arsenic; Ba, barium; Cd, cadmium; EFW, estimated fetal weight; Hg, mercury; Mo, molybdenum; Sn, tin.
3.3. Confirmatory and Sensitivity Analyses
Given that Mo and Ba were identified as the mixture components most strongly associated with EFW, we subsequently examined the associations between each of these metals and EFW using traditional linear regression models and investigated whether the results were robust to a series of sensitivity analyses. Similar to the BKMR results, a positive association was identified between Mo and EFW and a negative association was identified between Ba and EFW (Table S6). An interquartile range increase in Mo was associated with a 0.118 (95% CI: 0.017, 0.219; P=0.02) SD higher EFW, equivalent to a 7.7 g difference, and an interquartile range increase in Ba was associated with a −0.106 (95% CI: −0.226, 0.014; P=0.08) SD lower EFW, equivalent to a 6.9 g difference (Table S6). Results were similar after 1) additionally adjusting for the GA at urine collection, 2) including SG as a covariate in the model rather than correcting the metal concentrations for SG, and 3) using the machine values for metal concentrations falling below the LOD.
The pairwise interaction identified visually between Ba and Mo by BKMR for EFW and HC was also evident for HC using traditional linear regression (Pinteraction=0.03) but was not statistically significant for EFW (Pinteraction=0.22). The association between Mo and HC was strongest and only statistically significant (P=0.02) among those in the lowest tertile for Ba (Table S7); an interquartile range change in Mo was associated with a 0.30 (95% CI: 0.05, 0.56) SD difference in HC (Table S6). For HC, the interaction between Mo and Ba also ranked highest of all possible pairwise interactions when using the NLinteraction approach (Table S8). This ranking was stable after varying the threshold parameter τh from the default of 0.10 to a less conservative value of 0.25 (Table S9) and also to a more conservative value of 0.05 (Tables S10).
3.4. Exploratory Analysis
In an exploratory BKMR analysis, which additionally included Co, Ni, Sb, and Tl in the kernel function, Mo and Ba consistently ranked highest in relative importance for EFW (Table 3). Among the four new metals included in this analysis, Sb ranked highest for its association with EFW. Although this metalloid only ranked fourth overall, an inverse and linear association was observed with EFW (Figure 4). Associations for Co, Ni, and Tl appeared null. The bivariate relationships for Ba and Mo were also consistent after accounting for these additional metal co-exposures (Figures S9 and S10), and potential interactions were identified visually between each of these metals and Sb (Figure S9).
Figure 4.
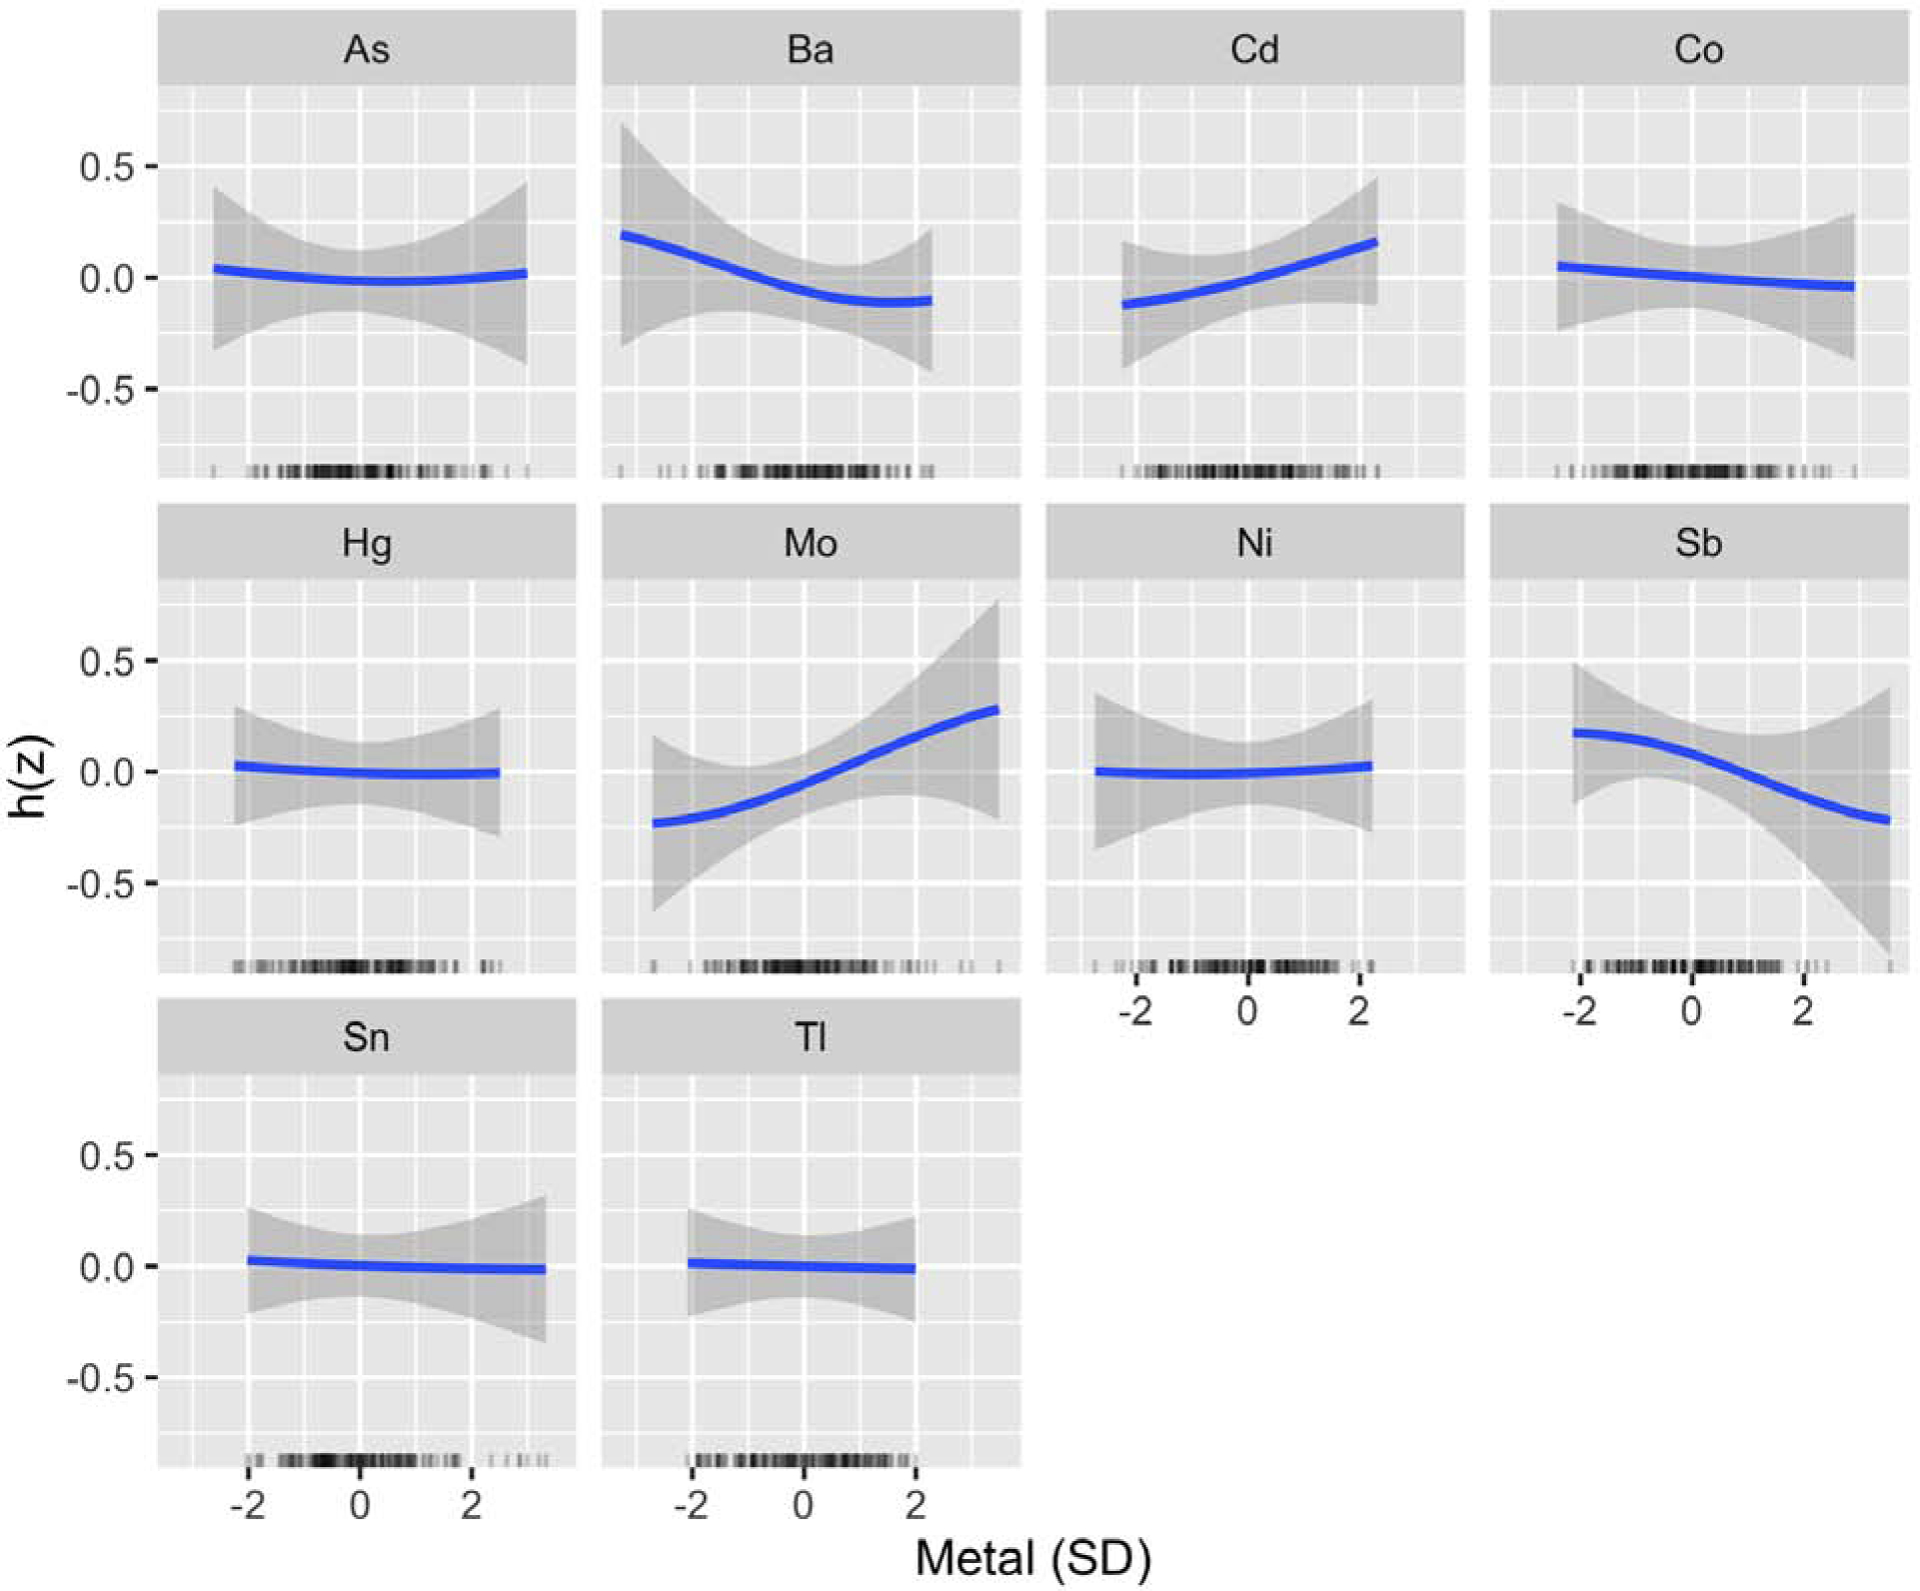
BKMR Univariate Exposure–Response Functions for Exploratory Analysis of EFW (N=184). Associations between each metal and EFW (with corresponding 95% credible intervals) are shown setting all other metals to their median, adjusting for GA at ultrasound, recruitment site, maternal age, pre-pregnancy BMI, maternal ethnicity by birthplace, maternal education, infant sex, and urinary arsenobetaine. Urinary metal and arsenobetaine concentrations were log2-transformed. Metals, EFW, and continuous covariates were also mean-centered and standard deviation scaled. Abbreviations Used: As, arsenic; Ba, barium; Cd, cadmium; Co, cobalt; EFW, estimated fetal weight; Hg, mercury; Mo, molybdenum; Ni, nickel; Sb, antimony; Sn, tin; Tl, thallium
4. Discussion
Using a novel mixture modeling method, we investigated the impact of a complex mixture of metals on fetal size in mid-pregnancy. Our objectives were to identify 1) toxic and essential elements that are associated with fetal size in mid-pregnancy, accounting for metal co-exposures; 2) potential inflection points for essential elements; and 3) possible synergistic and antagonistic interactions between metal pairs. In our primary BKMR analysis, we identified Mo and Ba as the mixture components most strongly associated with EFW, accounting for co-exposure to As, Cd, Hg, and Sn. We did not observe strong evidence of non-linearity for any of the metal-fetal biometry associations. Mo was positively associated with EFW, and similar associations were observed for AC, FL, BPD, and HC. In contrast, Ba was inversely associated with EFW, and similar associations were observed for AC and BPD. A possible interaction was also identified visually between Ba and Mo in relation to EFW and HC when using BKMR, suggesting that the positive association between Mo and these outcomes may be attenuated at high levels of Ba. For HC, the interaction between this metal pair was also statistically significant in a linear regression model and ranked highest of all possible pairwise interactions when using a novel mixture modeling approach (NLinteraction). In an exploratory analysis which investigated a larger set of metals, findings for Mo and Ba were robust, and we additionally identified an inverse association between Sb and EFW.
Few studies have examined associations between Mo and fetal biometry measures. However, a recent study in the LIFECODES birth cohort reported a positive association between urinary Mo and FL,21 consistent with our results. This study similarly evaluated Mo as part of a complex metal mixture. However, they used principal component analysis, which unlike BKMR cannot explicitly investigate interactions between mixture components. Bivariate relationships for metal pairs were therefore not reported. A pilot study in the Michigan Mother-Infant Pairs (MMIP) study has also examined urinary Mo in relation to fetal biometry measures but using traditional regression approaches. While positive associations were observed between Mo and most of the fetal measures evaluated, these associations were not statistically significant, possibly due to the small sample size (N=56).20 The positive associations observed between Mo and fetal size are consistent with Mo’s role as an essential element.50 Although the major sources of Mo exposure in MADRES are currently unknown, diet is the main contributor for most populations.36,50 Legumes are a particularly rich source of this element.36 However, a recent study also identified chili pepper consumption as an important predictor of urinary Mo among pregnant women in Mexico.51 Mo exposure can also occur from anthropogenic sources, such as fossil fuel combustion, and there is evidence that Mo may be toxic at high concentrations.36,50 However, we did not observe evidence of this in MADRES, as we did not identify any inflection points for this metal. The positive associations between Mo and fetal size were linear across the full range of exposures, despite Mo levels being higher than concentrations reported for pregnant women in the National Health and Nutrition Examination Survey (NHANES) and other pregnancy cohorts in the U.S.20,21,52 Importantly, the magnitude of the BKMR effect estimate for Mo and EFW (a 7.4 g difference for an increase from 25th to 75th percentile in Mo) was very similar to the linear regression effect estimate (a 7.7 g difference for an interquartile range change in Mo), indicating minimal confounding from metal co-exposures for this particular association.
In contrast, the BKMR effect estimate for Ba and EFW (a 4.9 g lower EFW for an increase from 25th to 75th percentile in Ba) was smaller in magnitude than that from linear regression (a 6.9 g lower EFW for an interquartile range increase in Ba). This suggests that BKMR was better able to account for potential confounding by metal co-exposures when estimating associations between Ba and fetal size. The health effects of Ba at environmentally relevant exposures have been largely understudied.53 To our knowledge, only two studies have investigated relationships between Ba exposure and fetal biometry.20 Similar to our findings, the MMIP pilot study reported inverse associations between urinary Ba and multiple fetal biometry measures.20 However, only the Ba-FL association was found to be statistically significant,20 whereas FL was one of the fetal measures for which Ba did not rank highly as a predictor in MADRES. Given that urinary Ba concentrations were similar for these two populations (geometric mean: 5 μg/L in the MMIP, compared with 4 μg/L in MADRES), this discrepancy is likely due to other population differences.20 The LIFECODES study also investigated urinary Ba in relation to fetal biometry, but results were null for all measures.21 Prior studies have also investigated Ba in relation to birth size, but findings have been mixed.16,54 Additional studies are therefore needed to better understand the potential impact of this understudied metal on fetal growth. Importantly, the urinary Ba concentrations in MADRES were higher (geometric mean (95% CI): 3.5 (3.0–4.1) μg/L) than concentrations reported for pregnant women in NHANES (geometric mean (95% CI): 2.0 (1.7–2.4) μg/L).52 Although the main sources of Ba exposure are currently unknown for MADRES, possible sources to investigate in future studies include traffic-related pollution and pollution related to oil drilling.53
Urinary Hg concentrations were also higher in MADRES (geometric mean (95% CI): 0.84 (0.71–0.98) μg/L) compared with levels reported for pregnant women in NHANES (geometric mean (95% CI): 0.49 (0.41–0.58) μg/L). Although Hg did not rank highly as a predictor of EFW, it did rank highly as a predictor of HC and was inversely associated with this outcome. We are aware of two previous studies which also examined urinary Hg in relation to fetal biometry: the LIFECODES birth cohort and the MMIP pilot study.20,21 The LIFECODES birth cohort similarly observed an inverse association between urinary Hg and HC. However, associations were null in the MMIP pilot study, potentially due to lower urinary Hg concentrations in this population (median: 0.06 μg/L, compared with a median of 0.91 μg/L in MADRES and a median of 0.51 μg/L in LIFECODES). Results for Cd were also generally null in MADRES, although this metal did rank highly as a contributor to the association with FL. A positive and linear association was observed between Cd and FL. While this finding is surprising, given the established toxicity of Cd,33 it is consistent with a previous study of a more highly exposed population in Bangladesh,9 which reported an inverse u-shaped relationship between Cd and fetal size. They identified an inflection point at 1.5 ug/L,9 which exceeds the highest urinary Cd concentration observed in MADRES (0.87 ug/L). One potential explanation for the positive associations observed at low levels of exposure may be unmeasured confounding from vegetable intake, which is the predominant source of Cd exposure among non-smokers.33
Although prior evidence suggests that Sn and As may adversely affect fetal growth,10,11,18,19,21 results for these metals were consistently null in MADRES. For Sn, the low concentrations in MADRES may be one explanation, as levels were comparable with concentrations reported for adult participants in NHANES.55 In contrast, higher Sn concentrations were observed in LIFECODES (median: 0.62 μg/L, compared with 0.47 μg/L in MADRES), which reported an inverse association between this metal and fetal HC.21 Although speciated urinary As concentrations were also relatively low among MADRES participants, several studies, including the LIFECODES birth cohort, the MMIP, and the New Hampshire Birth Cohort have reported inverse associations between urinary As and fetal size, despite As concentrations being in the low-to-moderate range.19–21 An alternative explanation for the null As results may be confounding from diet. Fish/seafood consumption is a particularly important potential confounder, as some As species may reflect metabolized arsenosugars or arsenolipids derived from fish/seafood in addition to metabolized iAs.56 However, most MADRES participants do not report consuming fish/seafood regularly,57 which is reflected by the relatively low urinary AsB concentrations in this population (median: 0.7 μg/L). Models were also adjusted for AsB to account for recent fish/seafood consumption. Furthermore, results were similarly null after using residual regression to remove any variance in the speciated urinary As measure that could be explained by AsB.48 Confounding from fish/seafood is therefore unlikely to explain these null results. Nevertheless, we cannot rule out the possibility of confounding from another dietary source, such as rice.58
Importantly, the associations for Mo and Ba were robust in an exploratory analysis, which included four additional metals (Co, Ni, Sb, and Tl) in the BKMR model. While results for Co, Ni, and Tl were null, a potential inverse association was identified between Sb and EFW. Urinary Sb concentrations in MADRES were comparable (geometric mean (95% CI): 0.072 (0.066–0.080) μg/L) to concentrations reported for pregnant women in NHANES (geometric mean (95% CI): 0.079 (0.070–0.089) μg/L).52 Thus, even at relatively low levels of exposure, we observed evidence that this metalloid may adversely impact fetal growth. Very little is known about the impacts of Sb on fetal growth, especially in early or mid-pregnancy, and associations with birth anthropometry have been mixed.18,59 For example, a small study in Japan (N=78), which reported very low urinary Sb concentrations (geometric mean < LOD), did not find Sb to be a significant predictor of birth size.18 However, a larger study (N=471) in the Canary Islands reported an association between cord blood Sb and low birth weight.59 While the major sources of Sb exposure are currently unknown for MADRES, traffic-related air pollution has been identified as a possible source of exposure for pregnant women in urban areas,60 which merits future investigation for this population.
The current study has many strengths, including the prospective design; the measurement of a multi-metals panel to evaluate complex metal mixture exposures in early pregnancy; focusing on an understudied population at higher risk for multipollutant burdens;28,29 the use of a mixture modeling approach that simultaneously accounts for non-linear relationships and synergistic and antagonistic relationships;31 and the application of a novel method that formally investigates interactions between mixture components.49 This was also among the first studies to examine the impact of a complex metal mixture on fetal size in mid-pregnancy. Most prior studies of metals and fetal growth have focused on BW and evaluated metals individually. Understanding metal impacts on fetal size in mid-pregnancy is important, as growing evidence suggests that certain in utero exposures may differentially impact fetal growth in early versus late pregnancy.5,8 Thus, studies focusing on BW may not capture important effects of environmental exposures that occur in earlier stages of pregnancy, which can also influence subsequent health6. Investigating metals in the context of a mixture is also critical, as humans are exposed simultaneously to multiple metals, which are often correlated and may be interact in complex ways to impact health.
Our study also had several important limitations, including the small sample size, which precluded our ability to evaluate possible differences by fetal sex or potential mediators, such as hypertensive disorders, which merit investigation in future studies. The current findings may have also been impacted by unmeasured or residual confounding, particularly from diet, as detailed dietary information was not obtained for MADRES participants in early pregnancy. Finally, it is important to note that fetal biometry measures are susceptible to measurement error.61 Although we did adjust for recruitment site to account for possible clinic-associated differences in fetal measurements, we were unable to adjust for differences in the ultrasound machine used, as this information was not available in the medical records. We also lacked information on the technician who performed the ultrasound. However, a previous study reported high inter-observer reproducibility for fetal biometry measurements.61
Identifying modifiable factors that influence fetal growth is essential, as reduced fetal growth has been associated with a broad range of health consequences later in life.1 Of the six elements that we focused on in the current study, urinary Mo was the most predictive of fetal size after accounting for metal co-exposures. Our results therefore suggest that Mo may be important for promoting fetal growth in mid-pregnancy. In contrast, Ba was predictive of reduced fetal size in mid-pregnancy after accounting for metal co-exposures. We also identified a possible antagonistic relationship between Ba and Mo which merits additional investigation. Although the health consequences of Ba exposure have been largely understudied, our results suggest that this metal may adversely impact fetal growth at environmentally relevant concentrations. In an exploratory analysis, we also identified Sb as a potential element of concern due to its inverse association with EFW. These findings highlight the need for future studies, focused on identifying major sources of Ba and Sb exposures for this population.
Supplementary Material
Highlights:
Molybdenum was associated with a larger fetal size in mid-pregnancy
Barium was associated with a smaller fetal size in mid-pregnancy
A potential interaction was identified between molybdenum and barium
In exploratory analyses, antimony was inversely associated with fetal size
Acknowledgements:
We would like to thank the MADRES participants, the study staff, and our community clinic partners for their many contributions to this work. We would also like to thank the Arizona Laboratory for Emerging Contaminants (ALEC) at the University of Arizona, Tucson, AZ, which performed the speciated urinary As analyses, and Moira Bixby (Department of Environmental Medicine and Public Health, Icahn School of Medicine at Mount Sinai) from the CHEAR Data Center.
Funding: This work was supported by NIH grants P50 ES026086, 4UH3OD023287-04, P30ES007048, K99 ES030400, and EPA grant 83615801-0. Dr. Claus Henn and Dr. Farzan are supported by Pathway to Independence Awards from the National Institute of Environmental Health Sciences (NIEHS) (R00 ES022986, and R00 ES024144). Dr. Farzan is also supported by a USC Provost’s Fellowship. This work was additionally supported by grants U2CES026555 and U2CES026553 from the NIEHS as part of CHEAR. A portion of the data used for this study were generated through grants supported by the NIEHS as part of CHEAR and are publicly available (DOI: 10.36043/1945_177, 10.36043/1945_159). The content of this paper is solely the responsibility of the authors and does not necessarily represent the official views of these funding organizations.
Abbreviations:
- As
arsenic
- AsIII
arsenite
- AsV
arsenate
- AsB
arsenobetaine
- AC
abdominal circumference
- Ba
barium
- BKMR
Bayesian Kernel Machine Regression
- BPD
biparietal diameter
- BW
birth weight
- Cd
cadmium
- Co
cobalt
- CHEAR
Children’s Health Exposure Analysis Resource
- DMA
dimethyl arsenicals
- EFW
estimated fetal weight
- FL
femur length
- GA
gestational age
- HC
head circumference
- Hg
mercury
- ICP-MS
inductively coupled plasma mass spectrometry
- LOD
limit of detection
- MADRES
Maternal and Developmental Risks from Environmental and Social Stressors
- MMA
monomethyl arsenicals
- MMIP
Michigan Mother-Infant Pairs
- Mo
molybdenum
- Ni
nickel
- Pb
lead
- PIP
posterior inclusion probability
- Sb
antimony
- SG
specific gravity
- Sn
tin
- Tl
thallium
Footnotes
Publisher's Disclaimer: This is a PDF file of an unedited manuscript that has been accepted for publication. As a service to our customers we are providing this early version of the manuscript. The manuscript will undergo copyediting, typesetting, and review of the resulting proof before it is published in its final form. Please note that during the production process errors may be discovered which could affect the content, and all legal disclaimers that apply to the journal pertain.
Declaration of interests
The authors declare that they have no known competing financial interests or personal relationships that could have appeared to influence the work reported in this paper.
References
- 1.Barker DJ, Thornburg KL. The obstetric origins of health for a lifetime. Clin Obstet Gynecol. 2013;56(3):511–519. [DOI] [PubMed] [Google Scholar]
- 2.McCormick MC. The contribution of low birth weight to infant mortality and childhood morbidity. N Engl J Med. 1985;312(2):82–90. [DOI] [PubMed] [Google Scholar]
- 3.Oudgenoeg-Paz O, Mulder H, Jongmans MJ, van der Ham IJM, Van der Stigchel S. The link between motor and cognitive development in children born preterm and/or with low birth weight: A review of current evidence. Neurosci Biobehav Rev. 2017;80:382–393. [DOI] [PubMed] [Google Scholar]
- 4.Visentin S, Grumolato F, Nardelli GB, Di Camillo B, Grisan E, Cosmi E. Early origins of adult disease: low birth weight and vascular remodeling. Atherosclerosis. 2014;237(2):391–399. [DOI] [PubMed] [Google Scholar]
- 5.Roland MCP, Friis CM, Voldner N, et al. Fetal growth versus birthweight: the role of placenta versus other determinants. PLoS one. 2012;7(6):e39324. [DOI] [PMC free article] [PubMed] [Google Scholar]
- 6.Bloomfield F, Oliver M, Harding J. The late effects of fetal growth patterns. Archives of Disease in Childhood-Fetal and Neonatal Edition. 2006;91(4):F299–F304. [DOI] [PMC free article] [PubMed] [Google Scholar]
- 7.Gaillard R, Steegers EA, de Jongste JC, Hofman A, Jaddoe VW. Tracking of fetal growth characteristics during different trimesters and the risks of adverse birth outcomes. International journal of epidemiology. 2014;43(4):1140–1153. [DOI] [PMC free article] [PubMed] [Google Scholar]
- 8.Schaefer-Graf UM, Kjos SL, Kilavuz Ö, et al. Determinants of fetal growth at different periods of pregnancies complicated by gestational diabetes mellitus or impaired glucose tolerance. Diabetes care. 2003;26(1):193–198. [DOI] [PubMed] [Google Scholar]
- 9.Kippler M, Wagatsuma Y, Rahman A, et al. Environmental exposure to arsenic and cadmium during pregnancy and fetal size: a longitudinal study in rural Bangladesh. Reproductive toxicology. 2012;34(4):504–511. [DOI] [PubMed] [Google Scholar]
- 10.Milton AH, Hussain S, Akter S, Rahman M, Mouly TA, Mitchell K. A Review of the Effects of Chronic Arsenic Exposure on Adverse Pregnancy Outcomes. Int J Environ Res Public Health. 2017;14(6). [DOI] [PMC free article] [PubMed] [Google Scholar]
- 11.Howe CG, Farzan SF, Garcia E, et al. Arsenic and birth outcomes in a predominately lower income Hispanic pregnancy cohort in Los Angeles. Environmental Research. 2020:109294. [DOI] [PMC free article] [PubMed] [Google Scholar]
- 12.Huang S, Kuang J, Zhou F, et al. The association between prenatal cadmium exposure and birth weight: A systematic review and meta-analysis of available evidence. Environmental Pollution. 2019;251:699–707. [DOI] [PubMed] [Google Scholar]
- 13.Vigeh M, Nishioka E, Ohtani K, et al. Prenatal mercury exposure and birth weight. Reprod Toxicol. 2018;76:78–83. [DOI] [PubMed] [Google Scholar]
- 14.Freire C, Amaya E, Gil F, et al. Placental metal concentrations and birth outcomes: The Environment and Childhood (INMA) project. Int J Hyg Environ Health. 2019;222(3):468–478. [DOI] [PubMed] [Google Scholar]
- 15.Vejrup K, Brantsæter AL, Knutsen HK, et al. Prenatal mercury exposure and infant birth weight in the Norwegian Mother and Child Cohort Study. Public Health Nutr. 2014;17(9):2071–2080. [DOI] [PMC free article] [PubMed] [Google Scholar]
- 16.Bermúdez L, García-Vicent C, López J, Torró MI, Lurbe E. Assessment of ten trace elements in umbilical cord blood and maternal blood: association with birth weight. Journal of translational medicine. 2015;13(1):291. [DOI] [PMC free article] [PubMed] [Google Scholar]
- 17.Xie X, Ding G, Cui C, et al. The effects of low-level prenatal lead exposure on birth outcomes. Environmental pollution. 2013;175:30–34. [DOI] [PubMed] [Google Scholar]
- 18.Shirai S, Suzuki Y, Yoshinaga J, Mizumoto Y. Maternal exposure to low-level heavy metals during pregnancy and birth size. Journal of Environmental Science and Health Part A. 2010;45(11):1468–1474. [DOI] [PubMed] [Google Scholar]
- 19.Davis MA, Higgins J, Li Z, et al. Preliminary analysis of in utero low-level arsenic exposure and fetal growth using biometric measurements extracted from fetal ultrasound reports. Environmental Health. 2015;14(1):12. [DOI] [PMC free article] [PubMed] [Google Scholar]
- 20.Goodrich JM, Ingle ME, Domino SE, et al. First trimester maternal exposures to endocrine disrupting chemicals and metals and fetal size in the Michigan Mother Infant Pairs Study. Journal of developmental origins of health and disease. 2019;10(4):447. [DOI] [PMC free article] [PubMed] [Google Scholar]
- 21.Kim SS, Meeker JD, Aung MT, et al. Urinary trace metals in association with fetal ultrasound measures during pregnancy. Environmental Epidemiology (Philadelphia, Pa.) 2020;4(2). [DOI] [PMC free article] [PubMed] [Google Scholar]
- 22.Zota AR, Ettinger AS, Bouchard M, et al. Maternal blood manganese levels and infant birth weight. Epidemiology (Cambridge, Mass.) 2009;20(3):367. [DOI] [PMC free article] [PubMed] [Google Scholar]
- 23.Mikelson CK, Troisi J, LaLonde A, et al. Placental concentrations of essential, toxic, and understudied metals and relationships with birth outcomes in Chattanooga, TN. Environmental research. 2019;168:118–129. [DOI] [PMC free article] [PubMed] [Google Scholar]
- 24.Signes-Pastor AJ, Doherty BT, Romano ME, et al. Prenatal exposure to metal mixture and sex-specific birth outcomes in the New Hampshire Birth Cohort Study. Environmental epidemiology (Philadelphia, Pa.) 2019;3(5). [DOI] [PMC free article] [PubMed] [Google Scholar]
- 25.Ashrap P, Watkins DJ, Mukherjee B, et al. Maternal blood metal and metalloid concentrations in association with birth outcomes in Northern Puerto Rico. Environment International. 2020;138:105606. [DOI] [PMC free article] [PubMed] [Google Scholar]
- 26.Cassidy-Bushrow AE, Wu K-HH, Sitarik AR, et al. In utero metal exposures measured in deciduous teeth and birth outcomes in a racially-diverse urban cohort. Environmental research. 2019;171:444–451. [DOI] [PMC free article] [PubMed] [Google Scholar]
- 27.Yang X, Li Y, Li J, et al. Associations between exposure to metal mixtures and birth weight. Environmental Pollution. 2020:114537. [Google Scholar]
- 28.Cushing L, Faust J, August LM, Cendak R, Wieland W, Alexeeff G. Racial/Ethnic Disparities in Cumulative Environmental Health Impacts in California: Evidence From a Statewide Environmental Justice Screening Tool (CalEnviroScreen 1.1). Am J Public Health. 2015;105(11):2341–2348. [DOI] [PMC free article] [PubMed] [Google Scholar]
- 29.Shim YK, Lewin MD, Ruiz P, Eichner JE, Mumtaz MM. Prevalence and associated demographic characteristics of exposure to multiple metals and their species in human populations: The United States NHANES, 2007–2012. Journal of Toxicology and Environmental Health, Part A. 2017;80(9):502–512. [DOI] [PMC free article] [PubMed] [Google Scholar]
- 30.Bastain TM, Chavez T, Habre R, et al. Study Design, Protocol and Profile of the Maternal And Developmental Risks from Environmental and Social Stressors (MADRES) Pregnancy Cohort: a Prospective Cohort Study in Predominantly Low-Income Hispanic Women in Urban Los Angeles. BMC pregnancy and childbirth. 2019;19(1):189. [DOI] [PMC free article] [PubMed] [Google Scholar]
- 31.Bobb JF, Henn BC, Valeri L, Coull BA. Statistical software for analyzing the health effects of multiple concurrent exposures via Bayesian kernel machine regression. Environmental Health. 2018;17(1):1–10. [DOI] [PMC free article] [PubMed] [Google Scholar]
- 32.Chou C-H, Harper C. Toxicological profile for arsenic. 2007.
- 33.Faroon O, Ashizawa A, Wright S, et al. Toxicological profile for cadmium. 2012. [PubMed]
- 34.Risher J Toxicological profile for mercury. 1999. [DOI] [PubMed]
- 35.Moffett D, Smith-Simon C, Stevens Y-W. Toxicological profile for barium and barium compounds. 2007.
- 36.Todd GD, Keith S, Faroon O, et al. Toxicological profile for molybdenum: draft for public comment. 2017.
- 37.Harper C Toxicological profile for tin and tin compounds. Agency for Toxic Substances and Disease Registry; 2005. [PubMed] [Google Scholar]
- 38.Tseng C-H. A review on environmental factors regulating arsenic methylation in humans. Toxicology and applied pharmacology. 2009;235(3):338–350. [DOI] [PubMed] [Google Scholar]
- 39.Branch N, Jones RL. Laboratory Procedure Manual. 2004.
- 40.Boeniger MF, Lowry LK, Rosenberg J. Interpretation of urine results used to assess chemical exposure with emphasis on creatinine adjustments: a review. American Industrial Hygiene Association Journal. 1993;54(10):615–627. [DOI] [PubMed] [Google Scholar]
- 41.Rosner B Percentage points for a generalized ESD many-outlier procedure. Technometrics. 1983;25(2):165–172. [Google Scholar]
- 42.Cantonwine DE, Ferguson KK, Mukherjee B, et al. Utilizing longitudinal measures of fetal growth to create a standard method to assess the impacts of maternal disease and environmental exposure. PloS one. 2016;11(1):e0146532. [DOI] [PMC free article] [PubMed] [Google Scholar]
- 43.ACOG. ACOG Practice Bulletin No. 95: anemia in pregnancy. Obstet Gynecol. 2008;112(1):201–207. [DOI] [PubMed] [Google Scholar]
- 44.Team RC. R: A language and environment for statistical computing. R Foundation foor Statistical Computing. 2017. [Google Scholar]
- 45.Shrier I, Platt RW. Reducing bias through directed acyclic graphs. BMC Med Res Methodol. 2008;8:70. [DOI] [PMC free article] [PubMed] [Google Scholar]
- 46.Navas-Acien A, Francesconi KA, Silbergeld EK, Guallar E. Seafood intake and urine concentrations of total arsenic, dimethylarsinate and arsenobetaine in the US population. Environ Res. 2011;111(1):110–118. [DOI] [PMC free article] [PubMed] [Google Scholar]
- 47.Hadlock FP, Harrist R, Sharman RS, Deter RL, Park SK. Estimation of fetal weight with the use of head, body, and femur measurements—a prospective study. American journal of obstetrics and gynecology. 1985;151(3):333–337. [DOI] [PubMed] [Google Scholar]
- 48.Jones MR, Tellez-Plaza M, Vaidya D, et al. Estimation of inorganic arsenic exposure in populations with frequent seafood intake: evidence from MESA and NHANES. American journal of epidemiology. 2016;184(8):590–602. [DOI] [PMC free article] [PubMed] [Google Scholar]
- 49.Antonelli J, Mazumdar M, Bellinger D, Christiani D, Wright R, Coull B. Estimating the health effects of environmental mixtures using Bayesian semiparametric regression and sparsity inducing priors. Annals of Applied Statistics. 2020;14(1):257–275. [Google Scholar]
- 50.Barceloux DG, Barceloux D. Molybdenum. Journal of Toxicology: Clinical Toxicology. 1999;37(2):231–237. [DOI] [PubMed] [Google Scholar]
- 51.Barrios PL, Vázquez-Salas RA, López-Carrillo L, Menezes-Filho JA, Torres-Sánchez L. Dietary determinants of urinary molybdenum levels in Mexican women: a pilot study. salud pública de méxico. 2017;59:548–555. [DOI] [PubMed] [Google Scholar]
- 52.Watson CV, Lewin M, Ragin-Wilson A, et al. Characterization of trace elements exposure in pregnant women in the United States, NHANES 1999–2016. Environmental Research. 2020;183:109208. [DOI] [PMC free article] [PubMed] [Google Scholar]
- 53.Kravchenko J, Darrah TH, Miller RK, Lyerly HK, Vengosh A. A review of the health impacts of barium from natural and anthropogenic exposure. Environmental geochemistry and health. 2014;36(4):797–814. [DOI] [PubMed] [Google Scholar]
- 54.Callan AC, Hinwood AL, Heyworth J, Phi DT, Odland JØ. Sex specific influence on the relationship between maternal exposures to persistent chemicals and birth outcomes. International journal of hygiene and environmental health. 2016;219(8):734–741. [DOI] [PubMed] [Google Scholar]
- 55.Lehmler H-J, Gadogbe M, Liu B, Bao W. Environmental tin exposure in a nationally representative sample of US adults and children: The National Health and Nutrition Examination Survey 2011–2014. Environmental Pollution. 2018;240:599–606. [DOI] [PMC free article] [PubMed] [Google Scholar]
- 56.Molin M, Ulven SM, Meltzer HM, Alexander J. Arsenic in the human food chain, biotransformation and toxicology–Review focusing on seafood arsenic. Journal of trace elements in medicine and biology. 2015;31:249–259. [DOI] [PubMed] [Google Scholar]
- 57.Farzan SF, Howe CG, Chavez TA, et al. Demographic predictors of urinary arsenic in a low-income predominantly Hispanic pregnancy cohort in Los Angeles. Journal of exposure science & environmental epidemiology. 2020:1–14. [DOI] [PMC free article] [PubMed] [Google Scholar]
- 58.Gilbert-Diamond D, Cottingham KL, Gruber JF, et al. Rice consumption contributes to arsenic exposure in US women. Proceedings of the National Academy of Sciences. 2011;108(51):20656–20660. [DOI] [PMC free article] [PubMed] [Google Scholar]
- 59.Cabrera-Rodriguez R, Luzardo OP, Gonzalez-Antuna A, et al. Occurrence of 44 elements in human cord blood and their association with growth indicators in newborns. Environment international. 2018;116:43–51. [DOI] [PubMed] [Google Scholar]
- 60.Fort M, Grimalt JO, Querol X, Casas M, Sunyer J. Evaluation of atmospheric inputs as possible sources of antimony in pregnant women from urban areas. Science of the Total Environment. 2016;544:391–399. [DOI] [PubMed] [Google Scholar]
- 61.Perni S, Chervenak F, Kalish R, et al. Intraobserver and interobserver reproducibility of fetal biometry. Ultrasound in obstetrics & gynecology. 2004;24(6):654–658. [DOI] [PubMed] [Google Scholar]
Associated Data
This section collects any data citations, data availability statements, or supplementary materials included in this article.