

Abstract
Objective:
To assess the relationship of constipation and diarrhea severity during the menopausal transition (MT) with age, MT stage, reproductive biomarkers, stress-related biomarkers, and stress-related perceptions.
Methods:
From 1990-1992, women ages 35-55 were recruited from the greater Seattle area; 291 of them consented to ongoing (1990 to 2013) annual data collection by daily menstrual calendar, health diary, and annual health questionnaire. A subset (n = 131) provided a first morning voided urine specimen (1997 to 2013). These were assayed for levels of estrone glucuronide, follicle stimulating hormone, testosterone, cortisol, norepinephrine, and epinephrine. Mixed effects modeling was used to identify how changes in constipation and diarrhea severity over time related to age, MT stage, reproductive biomarkers, stress-related biomarkers, and stress-related perceptions.
Results:
In a univariate model, age, Late Reproductive (LR) stage, tension, and anxiety were all significantly and positively related to constipation severity, while cortisol was significantly and negatively associated. In a multivariate model, only tension and cortisol remained significant predictors of constipation severity (p < 0.05). In a univariate model, age, LR stage, and E1G were significantly and negatively associated with diarrhea severity, while tension, anxiety, and perceived stress were significantly and positively related. In a multivariate model, only tension and age remained significant predictors of diarrhea severity.
Conclusions:
Key reproductive hormones do not play a significant role in constipation or diarrhea severity in the MT. In contrast, stress perception, tension, anxiety, and cortisol do. These factors should be evaluated in further research involving constipation and diarrhea.
Keywords: menopause, constipation, diarrhea, gastrointestinal, stress, tension
INTRODUCTION
An estimated 3 million women in the U.S. enter into the menopausal transition (MT) each year.1 Some women will experience a variety of symptoms, such as hot flashes, depressed mood, vaginal dryness, and sleep disturbances, commonly attributed to the fluctuating hormone levels that accompany the MT. 2-4 Some women in the MT also report various gastrointestinal (GI) symptoms, such as constipation, diarrhea, gastroesophageal reflux, abdominal pain, and bloating. Very little research has been devoted to understanding these symptoms in an MT population, yet this is a crucial first step towards understanding the relationship between such symptoms and the complex interplay of changes that occur in the MT. This study will explore such relationships, with a focus on the symptoms of constipation and diarrhea in the MT.
While there is a paucity of research that is focused on GI symptoms in the menopausal transition (MT), there has been research done on GI symptoms in women of varying ages, including age ranges that fall in the MT years. The results of such studies suggest a possible correlation between the MT and GI symptoms. In a study comparing gastroesophageal reflux and other GI symptoms in a representative cross-section of 497 women in the U.S. between the ages of 25 and 60, 42% of the participants from the “perimenopausal” group, and 47% of the participants from the “menopausal” group complained of upper GI symptoms (p < .001), compared to only 26% of the “premenopausal” group. A demographic questionnaire was used to determine menopausal status, and while the terminology used is now out-of-date, the groupings designated in the study are helpful in distinguishing between women in the MT (“perimenopausal”) or early post-menopause (PM; “menopausal”) and those that are not (“premenopausal”). Eighty percent of the perimenopausal and menopausal women had never previously been diagnosed with an upper GI disorder. The investigators concluded that women in the perimenopausal group were 2.9 times more likely to have upper GI symptoms than the other two groups. 5 Another recent study, conducted in China, had statistically significant results concluding that in women ages 50 and older, the prevalence of chronic constipation was shown to increase with advancing age. 6 In another study involving women ages 25 to 60 diagnosed with Irritable Bowel Syndrome (IBS), older women reported greater GI symptom severity. The findings revealed a steady increase in severity with increasing age, followed by a sharp spike in symptom severity in women aged 50 and above (in particular, constipation and abdominal pain), compared to the women younger than 50 years of age. 7 This spike in severity is consistent with the average age of menopause in the U.S. (i.e. 50-52 years old). 8-10 In contrast, the same study found that symptom severity in men with IBS remained relatively consistent throughout their lifespans. These gender-related differences in GI symptom severity, combined with the known fluctuating hormone levels experienced throughout the MT, suggest a possible role for hormones in the etiology and severity of GI symptoms among women. 11
The role of reproductive and stress-related hormones in the development of constipation and diarrhea in MT women is unknown. Research has focused on reproductive aged women with these symptoms, and mostly in IBS populations. One study, assessing the role of sex hormones in reproductive-aged women experiencing severe idiopathic constipation, revealed that decreasing blood levels of endogenous oestradiol, testosterone, and cortisol were correlated with the condition (p < 0.015, p < 0.003, and p < 0.047, respectively).12 In contrast, one recent in vivo study revealed that the administration of exogenous estrogen alone into male and female mice resulted in decreased gut motility in both sexes, suggesting that an increase in the sex hormone—not a decrease, as reported in previous studies—may be responsible for constipation. 13 Adding to these conflicting results is a study of the effects of exogenous oestradiol and micronized progesterone on the gastric emptying, small bowel transit, and colonic transit in postmenopausal women. 14 Gonenne and colleagues found that while micronized progesterone had a statistically significant overall effect on decreasing colonic transit time, none of the transit endpoints were altered by oestradiol or combined hormonal intervention, suggesting that progesterone and not oestradiol is responsible for bowel symptoms. Some of these results suggest a primary role of sex-specific hormones in GI symptom development and progression, especially given that severe idiopathic constipation occurs almost exclusively in reproductive-aged women. 12 However, with such disparate study results, it is apparent that the role of reproductive hormones in the gut is unclear.
Stress is a known trigger in many GI disorders, often exacerbating symptoms such as altered bowel movement habits, abdominal pain, slowed gastric emptying, increased colonic motility, and accelerated intestinal transit. 15-19 Several studies point to stress and the resulting release of cortisol—the primary stress-related hormone—as etiological in the development of constipation and diarrhea, revealing a possible role for cortisol in the development of gut symptoms. 20-23 Catecholamines have been shown to decrease colonic motility in IBS patients, and in patients with slow transit constipation, epinephrine has been found to increase colonic relaxation, indicating a possible role for the hormones in GI symptoms. 24-25 Despite these research efforts, the role of stress-related perceptions and hormones in constipation and diarrhea throughout the MT is unstudied. Thus, with previous research suggesting a relationship between increasing age and bowel symptoms, as well as a relationship between reproductive hormones, stress-related hormones, and GI motility symptoms—mixed though these results may be—it is clear that research on these relationships in the MT is necessary.
The current study was conducted to begin filling the gap in knowledge regarding GI physiology and pathophysiology in MT women. This was done by assessing the severity of constipation and diarrhea in women in the MT, as they were affected by age and several covariates. Covariates included the menopausal transition stage (Late reproductive, Early MT, Late MT, and Early Postmenopause), reproductive hormone biomarkers (estrone, FSH, testosterone), stress-related biomarkers (cortisol, epinephrine, and norepinephrine), and stress-related perceptions (anxiety, tension, and daily stress level).
METHODS
Design and Sampling
The data used in this study were gathered throughout the SMWHS, a prospective, repeated measures study occurring from 1990 to 2013 in the greater Seattle area, comprising up to 23 years of data collection. The study focused primarily on the symptoms, hormones, and stresses associated with the natural menopausal transition and is described in greater detail elsewhere. 26 Briefly, recruitment from a population-based sample took place between 1990 and 1992. Women recruited to the study were 35-55 years of age; were in the late reproductive stage, or early or late menopause transition stages; had a period within the previous 12 months; were not pregnant or lactating; had at least one ovary and an intact uterus; and could read and speak English. Of the original 820 eligible recruits, 508 began the study and provided initial cross-sectional data, and 390 entered the longitudinal component of the study, which included annual data collection by daily menstrual calendar and annual health questionnaire. An additional data collection tool—a health diary—was used, but was not a requirement for entering the longitudinal component of the study, and only a subset of the women agreed to do it. The health diary was collected on days five through seven of the menstrual cycle, each month from the beginning of the study until the year 2000, and quarterly from that time on (2001—2013). Questions in the health diary included a symptom checklist with severity scale, indicators of health behaviors, and perceptions of stress.
In 1996, a subset of participating women (n = 170) agreed to also provide a monthly first-void urine specimen for biomarker analysis. This occurred on day six of their menstrual cycle, coinciding with the health diary, until 2005. 27-28
Participants remained in the study up to five years post-menopausal. Over the course of the study, the original 508 study participants left or finished the study for the following reasons: 173 became ineligible, 173 dropped out due to personal reasons, and 162 were lost to contact.
This current analysis includes a subset (291 participants) of the original cohort of 508 women. This subset of participants was included in the current analysis because they contributed health diary data, and could be classified into LR stage or one of the MT stages (see MT Stages below). In addition, these women did not use hormone therapy, have incomplete daily diary entries, have a hysterectomy, have inadequate calendar data, or receive chemotherapy or radiation therapy. See Table 1 for characteristics of participants that did (n = 291) and did not (n = 208) meet the above-mentioned eligibility criteria. Of the 291 women meeting the above criteria, 131 also provided urine samples to be assayed for reproductive and stress-related biomarkers.
Table 1.
Sample Characteristics at Start of Study (1990–1991) of the Eligible and Ineligible Women in the Mixed Effects Modeling Analyses of GI Symptom Severity.
|
Eligible Women (n=291) |
Ineligible Women (n=217) |
||
|---|---|---|---|
| Characteristic | Mean (SD) | Mean (SD) | p-value* |
| Age (years) | 41.5 (4.3) | 42.0 (5.0) | 0.18 |
| Years of education | 15.9 (2.8) | 15.3 (3.0) | 0.03 |
| Family income ($) | 38,200 (15,000) 18.6 (7.0) |
35,200 (17,600) 17.1 (8.3) |
0.04 |
| Characteristic | N (Percent) | N (Percent) | p-value** |
| Currently employed | 0.40 | ||
| Yes | 254 (87.3) | 184 (84.8) | 0.40 |
| No | 37 (12.7) | 33 (15.2) | |
| Race/ethnicity | 0.001 | ||
| African American | 20 (6.9) | 38 (17.5) | |
| Asian /Pacific Islander | 27 (9.3) | 16 (7.4) | |
| White | 238 (81.8) | 153 (70.5) | |
| Other (Hispanic, Mixed) | 6 (2.1) | 10 (4.6) | |
| Marital Status | 0.42 | ||
| Married/partnered | 278 (71.1) | 141 (65.0) | |
| Divorced/widowed/not partnered | 63 (21.7) | 62 (28.6) | |
| Never married/partnered | 21 (7.2) | 14 (6.5) | |
Independent t-test
Chi-square test
Measures
The following measures were analyzed (see Figure 1): MT stages, urinary assays (reproductive biomarkers and stress-related biomarkers), health diary data (stress-related perceptions), and the outcome measures of constipation and diarrhea severity, respectively.
Figure 1.
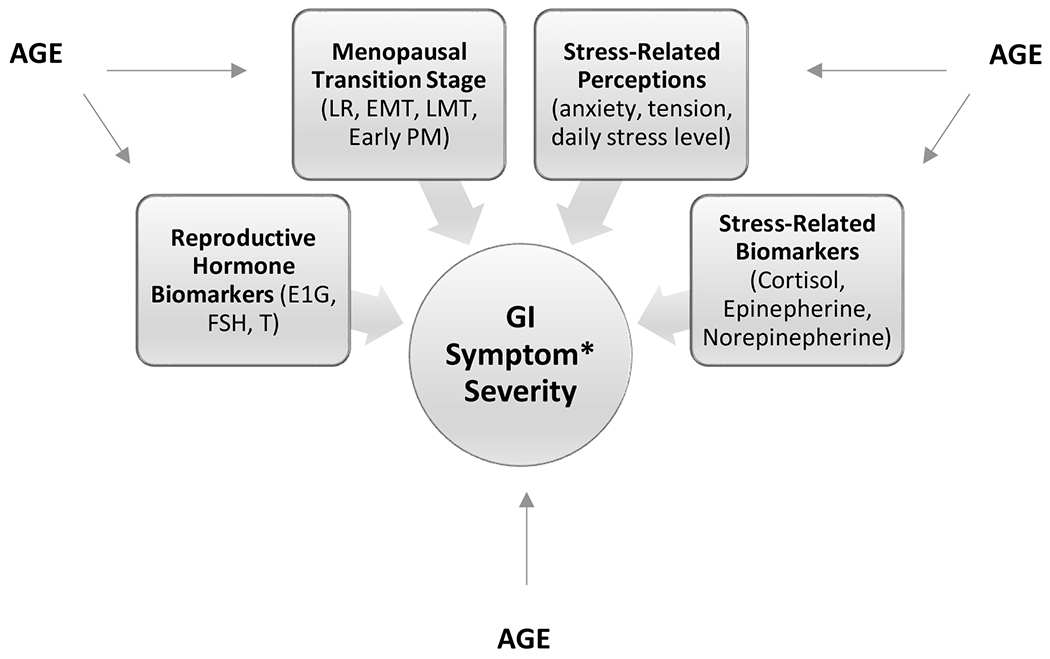
Model of the hypothesized relationships between predictor (Age), covariates, and outcome measure (GI symptom severity).
*GI symptoms include constipation and diarrhea.
MT Stages
Using menstrual calendar data, women were classified into reproductive aging stages throughout their involvement in the study, and as they went through the MT. These stages were defined using the staging criteria developed for the SMWHS by Mitchell, Woods, and Mariella. 8, 29 Validation of the stages came from the ReSTAGE collaboration. 30-32 The names for each stage match those recommended at the Stages of Reproductive Aging Workshop (STRAW): late reproductive, early MT, late MT, and early PM. 33 The late reproductive stage was defined as the time during midlife when cycles were regular. Early MT was defined as persistent irregularity of more than six days’ absolute difference between any two consecutive menstrual cycles in a calendar year, as well as no skipped periods. Late MT was defined as the persistent skipping of one or more menstrual periods. Amenorrhea for 60 or more days in the calendar year constituted a skipped period, and ‘persistence’ was defined as a skipped period, irregular cycle, or event occurring one or more times in the 12 months subsequent to the initial occurrence of any one of those events. Early PM was defined as the five years after the final menstrual period (FMP). FMP was retrospectively identified after one year of unexplained amenorrhea and was considered synonymous with the onset of menopause.
Urine Sample Collection and Biomarker Analysis
First-voided morning urine specimens were collected on day 6 of the menstrual cycle, and in the event that menstrual periods were unidentifiable or erratic, or had completely ceased, urine specimens were collected on a consistent monthly date. Prior to urine collection, women abstained from exercise, smoking, and caffeine use. Sodium metabisulfite and sodium ethylenediaminetetraacectic acid were used to preserve the urine samples, which were then frozen at −70°C.
All biomarkers were analyzed using urinary assays performed in our laboratories. All assays included a pooled in-house urine control, as well as a Bio-Rad Quantitative Urine control. To monitor assay performance, a urine sample on the standard curve was repeated after every ten unknowns. Controls, specimens, and standards were tested in duplicate, and those with a coefficient of variance greater than 15% were repeated. Samples from a calendar year were generally assayed during the following calendar year, and multiple samples from each participant were assayed in the same batch, batched per the year of collection. Endocrine concentrations were expressed as a ratio to the concentration of urine in the sample from which they were taken, in order to correct for variations in urine concentration.
Urinary estrone glucuronide
Urinary estrone glucuronide (E1G) was chosen as a measure of estrogen because of its stability, because it requires no special preparation for a reliable measurement, and because it is highly correlated with serum estradiol levels. 34-41 A competitive enzyme immunoassay, developed by O’Connor and colleagues, was used to measure E1G; cross-reactivity is 100% with E1G, 83% with estradiol glucuronide, and less than 10% with free estrone, estriol glucuronide, estrone sulfate, estriol, and estradiol. 36 Additional details of this assay have been described previously. 36 In this immunoassay, there was a high correlation between urinary E1G concentrations and serum estradiol (Pearson’s r = 0.95, based on 30 averaged cycles). 36 Average recovery from a urine matrix of low, medium, and high standard doses of E1G was 101%, and the lower limit of detection for the assay was 3.1 nmol/L. 36 The method of Robard was used to determine inter- and intra-assay coefficients, from 20 randomly selected plates. 40 Inter- (run to run) and intra-assay (within run) coefficients of variation were 9.6% and 2.1%, respectively, for an external (Bio-Rad) urine control (mean concentration = 2.1 ng/mL), and 14.5% and 2.8%, respectively, for an internal urine control (mean concentration = 1.59 ng/mL). E1G concentrations were corrected for slight assay nonparallelism; all samples were standardized to a dilution ratio of 1:5. 36
Urinary FSH
A radioimmunoassay specifically designed to measure follicle stimulating hormone (FSH) in urine and serum was used (Diagnostic Products Corporation, Double Antibody FSH Kit). The details of the procedure are described elsewhere. 41 FSH was reported using a range of 2.0 to 100 mIU/mL, with a minimum detectable concentration of 1.6 mIU/mL. FSH levels used in the analyses were reported as mIU/mg creatinine. The inter- and intra-assay coefficients of variation were 7.1% and 3.7%, respectively (n = 205).
Urinary testosterone
Urinary testosterone was measured by a solid-phase radioimmunoassay (Diagnostic Products Corporation, Total Testosterone Kit) that used a testosterone-specific antibody immobilized to the wall of a polypropylene tube. 42–44 Details of the assay are described elsewhere. 27 Standards ranging from 25 to 400 ng/dL were used to calculate recovery, the average of which was 92.7% with a range of 86.1% to 106%. Levels used in analyses were reported in ng/mg of creatinine. The inter- and intra-assay coefficients of variation were 12.38% and 8.65%, respectively (n = 791).
Urinary cortisol
Urinary free cortisol was measured as a biomarker of stress. A radioimmunoassay was used (Diagnostics Products Corporation, Coat-A-Count), the details of which are described elsewhere. 40 Cortisol was reported using a range of 1.0 to 50.0 μg/dL, with a minimum detectable concentration of 0.2 μg/dL. Each of the three samples from the results of 20 extractions each was used to calculate intra-assay precision, expressed by the coefficients of variation, which ranged from 8.2% to 12.5% for samples ranging from 0.9 to 8.3 μg/dL. A pooled in-house control of 3.6 μg/dL was used to calculate the inter-assay coefficient of variation, which was 4.6% (n = 376). Dichloromethane was used to extract the cortisol, the values of which were compared to the values obtained from an additional chromatographic purification step of the dichloromethane extract—no significant differences in cortisol values between the two methods were found. To check recovery rate, samples were spiked with three cortisol solutions (5, 10, and 20 μg/dL, respectively), and recovery rates were found to range from 88.4% to 96.5%. Dichloromethane extraction average recovery rate was 97%.
Urinary catecholamines
Urinary epinephrine and norepinephrine were measured by HPLC. Prior to assaying, both catecholamines were extracted on Bio-Rex cation exchange resin (Bio-Rad), followed by aluminum oxide (Bio-Rad) precipitation using a modification of the LCEC Application Note No. 15 (Bioanal.Syst., 1982). The inter- and intra-assay coefficients of variation were 7.85% and 4.7%, respectively.
Health Diary Data
Stress-Related Perceptions
Stress-related perceptions included anxiety, tension, and perceived stress, which were assessed by questions asked in the health diary. The symptoms of anxiety and tension were assessed (separately) by two questions asking women how anxious or tense they felt, respectively, within the past 24 hours, using a scale of 0-4, where 0 was ‘absent’ and 4 was ‘extreme’. Perceived stress was assessed by the question: ‘How stressful was your day?’. Answers ranged between 1 and 6, where 1 was ‘not at all’ and 6 was ‘extremely, a lot’. A study done by Brantley et al found that there was a significant correlation (r = 0.35, p < 0.01) between a global stress rating and the sum of stress ratings across multiple dimensions. 45
Outcome Variables: Symptom Severity
The outcome variables were constipation and diarrhea, as reported in the health diary. Symptom severity was assessed (separately) by two questions asking women to rate the severity of constipation or diarrhea, respectively, within the past 24 hours, according to the 0-4 scale described above.
Analysis
To investigate whether the predictor of age, and the covariates of MT stage, reproductive and stress biomarkers, and reported levels of tension, anxiety, and stress were significantly associated with symptom severity (constipation and diarrhea), a univariate analysis, followed by a multi-variate analysis, with mixed-effects and multi-level modelling (MLM) using the R library was used. This model is briefly described below and is described in detail elsewhere. 26, 46 MLM was used because data were collected at multiple time points for each woman, over several years throughout the duration of the study. In the preliminary and final analytical models, MT stages were considered categorical variables, while all reproductive and stress-related biomarkers, as well as all stress-related perceptions, were considered continuous. The outcome variables (constipation and diarrhea severity, respectively) were considered continuous.
Initially, two models were tested to see which was the best fit for the data; age (the measure of time) was used as the predictor of symptom severity in both, and the mean age—calculated to be 47.6 years—was used to improve the interpretability of the results (i.e. the results were centered on age). The first model assumed that constipation and diarrhea severity (respectively) would change at the same rate for all woman, each year (fixed effect, or, a single rate of change). The second model assumed that constipation and diarrhea severity would change at a different rate for each woman, each year (random effect, or, individual rate of change). The maximum likelihood estimation, according to the Akaike Information Criterion (AIC), was then used to assess the best fitting model. 47 If the AIC p-value was significant (p < 0.05), this would indicate that an individual rate of change in symptom severity for each woman was more appropriate than assuming the same rate of change for all women. Analyses revealed that an individual rate of change (the random effects model) was the best fit for the data (p < 0.001). Thus, the random effects model was used for analysis of the data.
Each covariate was then placed into the best fitting model independently, to test whether adding each was an improvement (significance set at p < 0.1) on the model (i.e. univariate analyses; see Tables 2 and 4). The covariates that revealed an improved model fit to the data when entered individually were then simultaneously entered into and tested by the final model (i.e. multivariate analysis; see Tables 3 and 5). Model assumptions were satisfied.
Table 2.
Univariate Random Effects Models for Constipation Severity (β1) with Age as Predictor (β2) and with Covariates (β3) Individually Entered
|
Mean Values (standard error, p-value) |
Standard Deviations | Number | ||||||
|---|---|---|---|---|---|---|---|---|
| Predictor | β1* (Intercept) |
β2* (Age Slope) |
β3* (Covariate) |
σ1** (Intercept) |
σ2** (Slope) |
σ3** (Residual Error) |
Women | Observations |
| Age (47.6) | 0.27 (0.026, <0.001) |
.007 (0.003, 0.04) |
- | 0.36 | 0.03 | 0.45 | 291 | 6977 |
| Reproductive Aging Markers | ||||||||
| Late Reproductive*** |
0.27 (0.03, <0.001) |
0.008 (0.004, 0.04) |
0.37 | 0.03 | 0.45 | 291 | 6977 | |
| Early MT | 0.001 (0.02, 0.94) |
|||||||
| Late MT | −0.02 (0.03, 0.55) |
|||||||
| Early PM | −0.02 (0.04, 0.54) |
|||||||
| Urinary Estrone (Log10) | 0.30 (0.04, <0.001) |
0.007 (0.006, 0.21) |
0.02 (0.025, 0.49) |
0.43 | 0.05 | 0.45 | 131 | 4908 |
| Urinary FSH (Log10) | 0.29 (0.04, <0.001) |
0.007 (0.006, 0.21) |
0.006 (0.02, 0.68) |
0.43 | 0.05 | 0.45 | 131 | 4996 |
| Urinary Testosterone (Log10) | 0.30 (0.04, <0.001) |
0.008 (0.006, 0.19) |
−0.004 (0.02, 0.81) |
0.43 | 0.05 | 0.45 | 131 | 4975 |
| Stress-related Biomarkers | ||||||||
| Urinary Cortisol (Log10) | 0.30 (0.04, <0.001) |
0.008 (0.006, 0.19) |
−0.05 (0.02, 0.005) |
0.42 | 0.05 | 0.45 | 131 | 4993 |
| Urinary Epinephrine (Log10) | 0.30 (0.04, <0.001) |
0.008 (0.006, 0.21) |
−0.002 (0.008, 0.78) |
0.42 | 0.04 | 0.45 | 130 | 3325 |
| Urinary Norepinephrine (Log10) | 0.30 (0.04, <0.001) |
0.007 (0.006, 0.23) |
0.04 (0.03, 0.16) |
0.42 | 0.04 | 0.45 | 130 | 3329 |
| Stress-related Perceptions | ||||||||
| Perceived Stress | 0.26 (0.03, <0.001) |
0.007 (0.003, 0.04) |
0.002 (0.006, 0.70) |
0.36 | 0.03 | 0.45 | 291 | 6977 |
| Tension | 0.25 (0.03, <0.001) |
0.007 (0.003, 0.04) |
0.03 (0.01, 0.008) |
0.36 | 0.03 | 0.45 | 291 | 6977 |
| Anxiety | 0.25 (0.03, <0.001) |
0.007 (0.003, 0.04) |
0.02 (0.009, 0.01) |
0.36 | 0.03 | 0.45 | 291 | 6977 |
β1, β2, β3 are the fixed effects (group averages) for the intercept, age slope and covariate, respectively. β1 represents the mean value in constipation severity for all women in the sample at the mean centered age (47.6 years); β2 represents the rate and direction (− or +) of change in constipation severity per year; and β3 represents the change in mean constipation severity score for every unit of change in covariate score, when the covariate is added to the model.
σ1, σ2, σ3 are the random effects (variability) for the intercept, slope and residual error, respectively.
Reference group for this categorical variable.
Table 4.
Univariate Random Effects Models for Diarrhea Severity (β1) with Age as Predictor (β2) and with Covariates (β3) Individually Entered
|
Mean Values (standard error, p-value) |
Standard Deviations | Number | ||||||
|---|---|---|---|---|---|---|---|---|
| Predictor | β1* (Intercept) |
β2* (Age Slope) |
β3* (Covariate) |
σ1** (Intercept) |
σ2** (Slope) |
σ3** (Residual Error) |
Women | Observations |
| Age (47.6) | 0.14 (0.02, <0.001) |
-.004 (0.002, 0.02) |
- | 0.22 | 0.01 | 0.33 | 291 | 6977 |
| Reproductive Aging Markers | ||||||||
| Late Reproductive*** |
0.13 (0.02, <0.001) |
−0.005 (0.002, 0.04) |
0.22 | 0.01 | 0.33 | 291 | 6977 | |
| Early MT | 0.01 (0.02, 0.52) |
|||||||
| Late MT | 0.03 (0.02, 0.12) |
|||||||
| Early PM | 0.005 (0.03, 0.86) |
|||||||
| Urinary Estrone (Log10) | 0.17 (0.02, <0.001) |
−0.01 (0.002, <0.001) |
−0.04 (0.02, 0.04) |
0.22 | 0.01 | 0.33 | 131 | 4908 |
| Urinary FSH (Log10) | 0.17 (0.02, <0.001) |
−0.01 (0.002, <0.001) |
−0.004 (0.01, 0.75) |
0.22 | 0.01 | 0.33 | 131 | 4996 |
| Urinary Testosterone (Log10) | 0.17 (0.02, <0.001) |
−0.01 (0.002, <0.001) |
−0.01 (0.01, 0.32) |
0.21 | 0.01 | 0.33 | 131 | 4975 |
| Stress-related Biomarkers | ||||||||
| Urinary Cortisol (Log10) | 0.17 (0.02, <0.001) |
−0.01 (0.002, <0.001) |
0.001 (0.02, 0.95) |
0.22 | 0.01 | 0.33 | 131 | 4993 |
| Urinary Epinephrine (Log10) | 0.17 (0.02, <0.001) |
−0.01 (0.003, <0.001) |
0.01 (0.006, 0.06) |
0.22 | 0.01 | 0.34 | 130 | 3325 |
| Urinary Norepinephrine (Log10) | 0.18 (0.02, <0.001) |
−0.01 (0.003, <0.001) |
0.01 (0.02, 0.57) |
0.22 | 0.01 | 0.33 | 130 | 3329 |
| Stress-related Perceptions | ||||||||
| Perceived Stress | 0.11 (0.02, <0.001) |
−0.003 (0.002, 0.04) |
0.01 (0.005, 0.003) |
0.22 | 0.01 | 0.33 | 291 | 6977 |
| Tension | 0.12 (0.02, <0.001) |
−0.004 (0.002, 0.02) |
0.04 (0.007, <0.001) |
0.21 | 0.01 | 0.33 | 291 | 6977 |
| Anxiety | 0.11 (0.02, <0.001) |
−0.004 (0.002, 0.02) |
0.04 (0.006, <0.001) |
0.21 | 0.01 | 0.33 | 291 | 6977 |
β1, β2, β3 are the fixed effects (group averages) for the intercept, age slope and covariate, respectively. β1 represents the mean value in diarrhea severity for all women in the sample at the mean centered age (47.6 years); β2 represents the rate and direction (- or +) of change in diarrhea severity per year; and β3 represents the change in mean diarrhea severity score for every unit of change in covariate score, when the covariate is added to the model.
σ1, σ2, σ3 are the random effects (variability) for the intercept, slope and residual error, respectively.
Reference group for this categorical variable.
Table 3.
Final Multivariate Mixed Effects Model for Constipation Severity with Age as Predictor and Significant Covariates Simultaneously Entered (N = 131; observations = 4993)
| Predictor | Beta Coefficient* | Standard Error/Standard Deviation | p-value | 95% Confidence Intervals |
|---|---|---|---|---|
| Fixed effects | ||||
| β1 Intercept | 0.27 | 0.04 | <0.001 | 0.19, 0.35 |
| β2 Age (−47.6) years | 0.01 | 0.006 | 0.14 | −0.003, 0.02 |
| β3 Urinary Cortisol (Log10) | −0.05 | 0.02 | 0.007 | −0.08, −0.01 |
| β4 Tension | 0.04 | 0.01 | 0.008 | 0.01, 0.07 |
| β 5 Anxiety | 0.0003 | 0.01 | 0.98 | −0.02, 0.03 |
| Random effects | ||||
| b1 Intercept σ1 | 0.42 | 0.37, 0.48 | ||
| b2 Age (−47.6) years σ2 | 0.05 | 0.04, 0.06 | ||
| b3 Residual σ3 | 0.45 | −0.12, 0.10 | ||
The Beta Coefficient is a measure of the change in constipation severity for every one unit of change in each respective predictor variable.
Table 5.
Final Multivariate Mixed Effects Model for Diarrhea Severity with Age as Predictor and Significant Covariates Simultaneously Entered (N = 130; observations = 3255)
| Predictor | Beta Coefficient* | Standard Error/Standard Deviation | p-value | 95% Confidence Intervals |
|---|---|---|---|---|
| Fixed effects | ||||
| β1 Intercept | 0.13 | 0.03 | < 0.001 | 0.08, 0.19 |
| β2 Age (-47.6) years | −0.01 | 0.003 | < 0.001 | −0.02, −0.006 |
| β3 Perceived Stress | 0.006 | 0.008 | 0.46 | −0.009, 0.02 |
| β 4 Urinary Estrone (Log10) | −0.04 | 0.02 | 0.09 | −0.08, 0.005 |
| β 5 Urinary Epinephrine (Log10) | 0.01 | 0.006 | 0.08 | −0.001, 0.02 |
| β 6 Tension | 0.03 | 0.01 | 0.04 | 0.001, 0.06 |
| β 7 Anxiety | 0.01 | 0.01 | 0.40 | −0.01, 0.03 |
| Random effects | ||||
| b1 Intercept σ1 |
0.22 | 0.18, 0.26 | ||
| b2 Age (−47.6) years σ2 | 0.01 | 0.004, 0.02 | ||
| b3 Residual σ3 | 0.34 | −1.00, 1.00 | ||
The Beta Coefficient is a measure of the change in diarrhea severity for every one unit of change in each respective predictor variable.
The number of observations for each covariate used in the models ranged from n=3,325 to n=6,977, and the number of women represented in each covariate analysis ranged from n=130 to n=291. Such variability in sample sizes reflect the fact that urine samples were not collected until year six of the study. This limited the number of women and observations available for the biomarker analyses to those women still involved in the study after six years who were willing to give regular urine samples. In addition, there was missing data for some of the covariates.
RESULTS
At baseline, study participants reported a mean age of 41.5 years (SD=4.3 years), a median family income of $38,200 (SD= $15,000), and 15.9 years of education (SD=2.8 years). Most participants were married or partnered (71%), with 22% being divorced or widowed and 7% never having been married or partnered, and most were currently employed (87%). The majority of participants described themselves as White (82%), with 9% describing themselves as Asian-American and 7% as African-American. Sample characteristics are displayed in Table 1. Significant differences were seen between eligible and ineligible women in income, race/ethnicity, and years of education. Women with data included in the analyses had more formal education and higher income, and were more likely to be White, than those who were not eligible for inclusion.
Constipation
Age was a predictor for constipation, being associated with a slight increase in severity (0.007, p < 0.04) per year. None of the MT stages were associated with constipation severity. None of the reproductive aging biomarkers (E1G, FSH, testosterone) had statistically significant associations with constipation. Of the stress-related biomarkers, only cortisol showed a statistically significant association with a decrease in severity (-0.05, p < 0.005). Of the stress-related perceptions, tension and anxiety were significantly related to an increase in constipation severity (0.03, p < 0.007; 0.02, p < 0.01). These results can be found in Table 2.
The statistically significant covariates from the univariate effects analysis were then included in a multi-variate random effects model. As seen in Table 3, age and anxiety were no longer significantly associated with an increase in constipation severity, cortisol was associated with a decrease in severity (-0.05, p=0.02), and tension was associated with an increase in severity (0.04, p=0.01).
Diarrhea
Age was a predictor for diarrhea, being associated with a slight decrease in severity (-0.004, p < 0.02) per year. None of the MT stages were associated with diarrhea severity. E1G was associated with a decrease in severity (-0.04, p < 0.04). None of the stress-related biomarkers were significantly related to diarrhea, with the exception of epinephrine (0.01, p < 0.06), which demonstrated a trend to be associated with more severe diarrhea. All of the stress-related perceptions showed statistically significant associations with an increase in severity (see Table 4): perceived stress (0.01, p < 0.003), tension (0.03, p < 0.001), and anxiety (0.04, p < 0.001).
The statistically significant covariates from the univariate effects analysis were then included in a multi-variate random effects mixed model. As seen in Table 5, age was associated with a decrease in severity (-0.01, p < 001), while tension was associated with an increase (0.03, p < 0.04). Neither perceived stress, E1G, epinephrine, nor anxiety showed a significant association with diarrhea severity in this model.
DISCUSSION
The results presented here are from the first longitudinal study to examine women’s experiences of constipation and diarrhea symptoms during the MT and early PM, using multiple repeated measures of symptom severity and indicators of the menopausal transition, stress-related perceptions, stress-related biomarkers, and reproductive hormone biomarkers. Analyses reported here reveal that factors associated with constipation and diarrhea are not the same during this part of a woman’s lifespan.
Constipation
Age and being in Late Reproductive stage were both significant predictors of an increase in constipation severity. Neither early nor late MT, nor early PM, were associated with it. Surprisingly, none of the reproductive biomarkers (E1G, FSH, testosterone) showed a statistically significant association with constipation severity. Instead, the stress-related biomarker, cortisol, was associated with lower constipation severity. Tension and anxiety were each associated with an increase in constipation severity, but perceived stress showed no such association. In a multivariate model, the association of cortisol with a decrease in severity found in the univariate model remained significant, as did the association of tension with an increase in severity.
It is well-documented that the incidence and severity of constipation increases with age. 48–53 The associations of age and Late Reproductive stage with severity found in this study are consistent with the current literature. Also consistent with the current literature is the increase in constipation severity associated with tension and anxiety. Many studies suggest an association between stress, of which tension and anxiety would be manifestations, and constipation, though most of these studies include constipation as a symptom of a disease entity—such as Irritable Bowel Syndrome (IBS)—rather than as an entity unto itself. 54–55 Despite similar findings, none of the previous research has focused specifically on women in the MT. Any mechanisms and predictors of constipation previously found must be applied to women in the MT cautiously, as gut physiology during the MT is not well understood and could thus have unknown consequences on symptoms. Such a caution is substantiated when we take into account the study done by Heitkemper et al, where constipation severity in an IBS population was found to increase in women at an age consistent with the MT. 7 These findings are indicative of an association with the gut mediated by an MT-specific factor, not an IBS-specific factor.
While tension and anxiety were associated with an increase in constipation severity, cortisol showed an opposite association. There is nothing in the literature that supports this finding. Generally, cortisol is increased by HPA axis activation in response to stress. 56–57 In addition, cortisol has been shown to increase, rather than decrease, constipation severity in an IBS population. 58–59 With the increase in constipation severity being associated with tension and anxiety, why was cortisol found to be associated with a decrease in severity? Due to a lack of research on gastrointestinal symptoms in women during the MT and early PM, we do not yet know what a “normal” physiological response to cortisol in the gut throughout the MT looks like, and the results of the current study could reflect the “normal” response to cortisol in the MT. This study was a first step towards understanding these complex relationships.
That E1G was not significantly associated with constipation severity reflects the findings of a study done by Gonenne et al, in which 49 postmenopausal women with no history of GI symptoms—particularly no constipation, diarrhea, or IBS—were randomized into one of four treatment groups: 400 mg per day of micronized progesterone, 0.2 mg per day of oestradiol, a combination of the two, or placebo. 60 Baseline whole gut transit times were assessed, and treatment lasted for 7 days, at the end of which transit times were assessed again. The investigators concluded that micronized progesterone increased colonic transit time, but that oestradiol did not. Taken together with the findings from the Gonenne et al results, the current study provides evidence to suggest that estrogen may not be associated with colonic transit time—and thus, constipation—in MT and PM populations.
Diarrhea
Age and Late Reproductive stage were both significantly associated with decreasing diarrhea severity. Of the reproductive biomarkers, a statistically significant relationship was found with E1G only, where higher levels were associated with a decrease in severity. None of the stress-related biomarkers showed a statistically significant association with diarrhea severity, though epinephrine showed an associative trend with increasing severity when entered into the model individually. All three stress-related perceptions (tension, anxiety, and perceived stress) showed a statistically significant association with increased diarrhea severity. In a multivariate model, age was found to be associated with decreasing severity, while tension was found to be associated with increasing severity. E1G was associated marginally with a decrease in diarrhea severity (-0.04, p < 0.09), and epinephrine with an increase (0.01, p < 0.08).
Literature on the effects of the aging process on diarrhea is limited—there are no studies directly demonstrating that the aging process is related to an increase in the prevalence of diarrhea, nor in increasing diarrhea severity. In fact, the prevalence of chronic diarrhea in the elderly is purportedly the same as that in the general population (3-5%). 61 However, no research has been done on diarrhea in women in the MT. The results of the current study are the first to show that diarrhea severity decreases with age in an MT population.
This study is also the first to show that stress is associated with an increase in diarrhea severity in MT women. This result is in keeping with the literature regarding stress and diarrhea in other populations, where stress has been shown to increase GI permeability, a process that is associated with diarrhea. 62–63 Similarly, as outlined elsewhere in this paper, stress is a common trigger for increased symptom severity—including diarrhea—in IBS and other gut pathologies. It was not surprising, then, that women in the MT and early PM stage who were experiencing more of the stress-related symptoms of tension and anxiety had more severe diarrhea.
In contrast to what was found with constipation severity, E1G levels were associated with lower diarrhea severity. When put into the multivariate model, the association with E1G did not meet our criteria for significance (p < 0.05); however, a trend was evident (p < 0.09) for decreased diarrhea severity (-0.04). No research has been done on estrogen and diarrhea in an MT population, but several in vitro and in vivo studies on the subject have. The results from these studies suggest that loss of estrogen increases intestinal permeability, thereby encouraging diarrhea. 64–66 A recent study by Collins et al demonstrated, in vivo and ex vivo, that estrogen deficiency results in changes in permeability, tight junction gene expression, and pro- and anti-inflammatory cytokine gene expression, all of which are temporal- and regional-specific in the intestine. 66 Such changes encourage the development of intestinal dysfunction symptoms, such as diarrhea. The results from the current study support this growing body of research on estrogen’s role in maintaining the integrity of intestinal epithelium, and are the first to be reported on a MT population.
Limitations
Three limitations should be taken into consideration when interpreting the results of this study. First, the participants in this study differed significantly in years of education, family income, and race/ethnicity (see Table 1). Over the course of the longitudinal study, women from a lower socioeconomic status, as well as non-white ethnic groups, were more likely to exit the study, compared to the study population at the time of recruitment (see Table 1). This may limit the generalizability of these findings to some women. Secondly, the small sample size could have masked associations between hormone levels and symptom severity. It may be the case that a larger sample size would reveal associations with these covariates otherwise hidden by the relatively small sample size used in this study. Nonetheless, the large number of repeated measures from an albeit modest sample size contributed to understanding the relationships studied over the MT and early PM. Thirdly, while only healthy participants were recruited, new diagnoses of IBS or other gut-related diseases throughout the study were not cause for discontinuation of study participation. The development of such diagnoses was not tracked during the follow-up period of the current study.
CONCLUSION
The role of E1G in the development and worsening of constipation experienced in the MT is questionable, as results from this and previous studies remain conflicted. 64–66 Continued research on the mechanisms of action, metabolism, and levels of reproductive hormones in relation to GI symptoms throughout the MT is necessary. The same holds true for stress and stress-related hormones. The perception of daily stress, as indicated by manifestations of stress (tension and anxiety), increases diarrhea and constipation severity, though the role of stress-related hormones remains unclear. As the first reported longitudinal study of constipation and diarrhea experienced by women during the MT and early PM to be published, the findings reported here suggest provocative relationships among reproductive biomarkers, stress-related biomarkers, stress-related perceptions, and symptom severity of constipation and diarrhea that warrant further exploration.
SOURCE OF FUNDING:
NIH NINR R01-NR 004141; NIH NINR P30 NR 04001.
FINANCIAL SUPPORT: The salary/stipend for the principal author (Nini G.L. Callan) came from the Department of Health and Human Services, Public Health Service, Ruth L. Kirchstein National Research Service Award, PHS grant number 5 T90 AT 008544–03.
Footnotes
CONFLICT OF INTEREST: The authors report no conflict of interest. The authors alone are responsible for the content and writing of this paper.
REFERENCES
- 1.Manson JE. Overview of Menopause. North American Menopause Society. Online: http://www.menopause.org/docs/2012/cg_a.pdf?sfvrsn=2 [Google Scholar]
- 2.Gallicchio L, Schilling C, Romani WA, Miller S, Zacur H, et al. Endogenous hormones, participant characteristics, and symptoms among midlife women. Maturitas 2008; 59(2): 114–127. [DOI] [PMC free article] [PubMed] [Google Scholar]
- 3.Randolph JF Jr., Sowers MF, Bondarenko I, Gold EB, Greendale GA, et al. The Relationship of Longitudinal Change in Reproductive Hormones and Vasomotor Symptoms during the Menopausal Transition. J Clin Endocrinol Metab 2005; 90(11): 6106–12. [DOI] [PubMed] [Google Scholar]
- 4.Cray L, Woods NF, and Mitchell ES Symptom clusters during the late menopausal transition stage: Observations from the Seattle Midlife Women’s Health Study. Menopause 2010; 17:972–977. [DOI] [PubMed] [Google Scholar]
- 5.Infantino M The Prevalence and pattern of gastroesophageal reflux symptoms in perimenopausal and menopausal women. J Am Acad Nurse Pract 2010; 20(5):266–72. [DOI] [PubMed] [Google Scholar]
- 6.Huang L, Jiang H, Zhu M, Want B, Tong M, et al. Prevalence and Risk Factors of Chronic Constipation Among Women Aged 50 Years and Older in Shanghai, China. Med Sci Monit 2017; 23:2660–67. [DOI] [PMC free article] [PubMed] [Google Scholar]
- 7.Heitkemper M (2016) Gender/Sex and Functional Gastrointestinal Disorders. Powerpoint presented at: National Institutes of Health. Bethesda, MD. [Google Scholar]
- 8.Mitchell ES, Woods NF. Hot flush severity during the menopausal transition and early postmenopause: beyond hormones. Climacteri 2015; 18:1–9. [DOI] [PMC free article] [PubMed] [Google Scholar]
- 9.Paramsothy P, Harlow SD, Greendale GA, Gold EB, Crawford SL, et al. Bleeding patterns during the menopausal transition in the multi-ethnic Study of Women’s Health Across the Nation (SWAN): A prospective cohort study. BJOG 2014; 121(12):1564–73. [DOI] [PMC free article] [PubMed] [Google Scholar]
- 10.Burger H The menopausal transition—endocrinology. J Sex Med 2008; 5(10):2266–73. [DOI] [PubMed] [Google Scholar]
- 11.Burger HG, Dudley EC, Hopper JL, Groome N, Guthrie JR, et al. Prospectively Measured Levels of Serum Follicle-Stimulating Hormone, Estradiol, and the Dimeric Inhibins during the Menopausal Transition in a Population-Based Cohort of Women. J Clin Endocrinol Metab 1999; 84(11):4025–30. [DOI] [PubMed] [Google Scholar]
- 12.Kamm MA, Farthing MJ, Lennard-Jones JE, Perry LA, Chard T. Steroid hormone abnormalities in women with severe idiopathic constipation. Gut 1991; 32(1):80–4. [DOI] [PMC free article] [PubMed] [Google Scholar]
- 13.Oh JE, Kim YW, Park SY, Kim JY. Estrogen Rather Than Progesterone Cause Constipation in Female and Male Mice. Korean J Physiol Pharmacol 2013; 17:423–26. [DOI] [PMC free article] [PubMed] [Google Scholar]
- 14.Gonenne J, Esfandyari T, Camilleri M, Burton DD, Stephens DA, et al. Effect of female sex hormone supplementation and withdrawal on gastrointestinal and colonic transit in postmenopausal women. Neurogastroenterol Motil 2006; 18(10): 911–18. [DOI] [PubMed] [Google Scholar]
- 15.Martinez V, Rivier J, Tache Y. Central injection of a new corticotropinreleasing factor (CRF) antagonist, astressin, blocks CRF- and stress-related alterations of gastric and colonic motor function. J Pharmacol Exp Ther 1997; 280:754–60. [PubMed] [Google Scholar]
- 16.Malagelada J-R. Tache Y, Wingate D, eds. Brain-gut interactions, vol 26. Boston: CRC Press, 1991; 297–305. [Google Scholar]
- 17.Welgan P, Meshkinpour H, Beeler M. The effect of anger on colon motor and myoelectric activity in irritable bowel syndrome. Gastroenterology 1988; 94:1150–6. [DOI] [PubMed] [Google Scholar]
- 18.Welgan P, Meshkinpour H, Hoehler F. The effect of stress on colon motor and electrical activity in irritable bowel syndrome. Psychosom Med 1985; 47:139–49. [DOI] [PubMed] [Google Scholar]
- 19.Ditto B, Miller SB, Barr RG. A one-hour active coping stressor reduces small bowel transit time in healthy young adults. Psychosom Med 1998; 60:7–10. [DOI] [PubMed] [Google Scholar]
- 20.Santos J, Yang PC, Soderholm JD, Benjamin M, Perdue MH. Role of mast cells in chronic stress induced colonic epithelial barrier dysfunction in the rat. Gut 2001; 48:630–36. [DOI] [PMC free article] [PubMed] [Google Scholar]
- 21.Bhatia V, Tandon RK. Stress and the gastrointestinal tract. J of Gastroentero and Hepato 2005; 20:332–39. [DOI] [PubMed] [Google Scholar]
- 22.Meddings JB, Swain MG. Environmental stress-induced gastrointestinal permeability is mediated by endogenous glucocorticoids in the rat. Gastroenterology 2000; 119(4):1019–28. [DOI] [PubMed] [Google Scholar]
- 23.Soderholm JD, Perdue MH. Stress and the Gastrointestinal Tract II. Stress and intestinal barrier function. Am J Physiol Gastrointest Liver Physiol 2001; 280:G7–G13. [DOI] [PubMed] [Google Scholar]
- 24.Fukudo S, Suzuki J. Colonic Motility, Autonomic Function, and Gastrointestinal Hormones under Psychological Stress on Irritable Bowel Syndrome. Tohoku J Exp Med 1987; 151:373–85. [DOI] [PubMed] [Google Scholar]
- 25.Tomita R, Tanjoh K, Fujisaki S, Ikeda T, Fukuzawa M. Regulation of the enteric nervous system in the colon of patients with slow transit constipation. Hepatogastroenterology 2002; 49(48): 1540–44. [PubMed] [Google Scholar]
- 26.Woods NF, Mitchell ES. The Seattle Midlife Women’s Health Study: a longitudinal prospective study of women during the menopausal transition and early postmenopause. Women’s Midlife Health 2016; 2:6. DOI 10.1186/s40695-016-001. [DOI] [PMC free article] [PubMed] [Google Scholar]
- 27.Woods NF, Smith-DiJulio K, Percival DB, Tao EY, Taylor HJ, Mitchell ES. Symptoms during the menopausal transition and early post menopause and their relation to endocrine levels over time: Observations from the Seattle Midlife Women’s Health Study. J Womens Health 2007; 16:667–77. [DOI] [PubMed] [Google Scholar]
- 28.Woods NF, Mitchell ES, Smith-Dijulio K. Cortisol levels during the menopausal transition and early postmenopause: observations from the Seattle Midlife Women’s Health Study. Menopause 2009; 16(4):708–18. [DOI] [PMC free article] [PubMed] [Google Scholar]
- 29.Mitchell ES, Woods NF, Mariella A. Three stages of the menopausal transition from the Seattle Midlife Women’s Health Study: toward a more precise definition. Menopause 2000; 7:334–349. [DOI] [PubMed] [Google Scholar]
- 30.Harlow SD, Cain K, Crawford S, et al. Evaluation of four proposed bleeding criteria for the onset of late menopausal transition. J Clin Endocrinol Metab 2006; 91:3432–38. [DOI] [PMC free article] [PubMed] [Google Scholar]
- 31.Harlow SD, Mitchell ES, Crawford S, Nan B, Little R, Taffe J; ReSTAGE Collaboration. The ReSTAGE Collaboration: defining optimal bleeding criteria for onset of early menopausal transition. Fertil Steril 2008; 89:129–40. [DOI] [PMC free article] [PubMed] [Google Scholar]
- 32.Harlow SD, Crawford S, Dennerstein L, Burger HG, Mitchell ES, Sowers MF; ReSTAGE Collaboration. Recommendations from a multi-study evaluation of proposed criteria for staging reproductive aging. Climacteric 2007; 10:112–19. [DOI] [PubMed] [Google Scholar]
- 33.Soules MR, Sherman S, Parrott E, et al. Executive summary: Stages of Reproductive Aging Workshop (STRAW). Climacteric 2001; 4:267–72. [PubMed] [Google Scholar]
- 34.Denari JH, Farinati Z, Casas PR, Oliva A. Determination of ovarian function using first morning urine steroid assays. Obstet Gynecol 1981; 58:5–9. [PubMed] [Google Scholar]
- 35.Stanczyk FZ, Miyakawa I, Goebelsmann U. Direct radioimmunoassay of urinary estrogen and pregnanediol glucuronides during the menstrual cycle. Am J Obstet Gynecol 1980; 137:443–50. [DOI] [PubMed] [Google Scholar]
- 36.O’Connor KA, Brindle E, Shofer JB, et al. Statistical correction for non-parallelism in a urinary enzyme immunoassay. J Immunoassay Immunochem 2004; 25:259–78. [DOI] [PubMed] [Google Scholar]
- 37.Lasley BL, Shideler SE. Methods for evaluating reproductive health of women. Occup Med 1994; 9:423–33. [PubMed] [Google Scholar]
- 38.Wilcox AJ, Baird DD, Weinberg CR, et al. The use of biochemical assays in epidemiologic studies of reproduction. Environ Health Perspect 1987; 75:29–35. [DOI] [PMC free article] [PubMed] [Google Scholar]
- 39.Munro CJ, Stabenfeldt GH, Cragun JR, Addiego LA, Overstreet JW, Lasley BL. Relationship of serum estradiol and progesterone concentrations to the excretion profiles of their major urinary metabolites as measured by enzyme immunoassay and radioimmunoassay. Clin Chem 1991; 37:838–44. [PubMed] [Google Scholar]
- 40.Robard D Statistical quality control and routine data processing for radioimmunoassays and immunoradiometric assays. Clin Chem 1974; 20:1255–70. [PubMed] [Google Scholar]
- 41.Woods N, Carr MC, Tao EY, Taylor HJ, Mitchell ES. Increased urinary cortisol levels during the menopausal transition. Menopause 2006; 13:212–21. [DOI] [PubMed] [Google Scholar]
- 42.Tijssen P. Practice and Theory of Enzyme Immunoassays. Amsterdam, Netherlands: Elsevier, 1985. [Google Scholar]
- 43.Chad T An Introduction to RIA and Related Technologies, 4th ed. Amsterdam, Netherlands: Elsevier, 1990. [Google Scholar]
- 44.Dufau ML, Winters CA, Hattori M, et al. Hormonal regulation of androgen production by the Leydig cell. J Steroid Biochem 1984; 20:161–73. [DOI] [PubMed] [Google Scholar]
- 45.Brantley PJ, Waggoner CD, Jones GN, Rappaport NB. A Daily Stress Inventory: development, reliability, and validity. J Behav Med 1987; 10:61–74. [DOI] [PubMed] [Google Scholar]
- 46.Woods NF, Smith-DiJulio K, Percival DB, Tao EY, Mariella A, et al. Depressed mood during the menopausal transition and early postmenopause: observations from the Seattle Midlife Women’s Health Study. Menopause 2008; 15(2):223–32. [DOI] [PubMed] [Google Scholar]
- 47.Hox J Multilevel Analysis: Techniques and Applications. Mahwah, NJ: Lawrence Erlbaum Associates, 2002. [Google Scholar]
- 48.Gallegos-Orozco JF, Foxx-Orenstein AE, Sterler SM, Stoa JM. Chronic constipation in the elderly. Am J Gastroenterol 2012; 107(1):18–25. [DOI] [PubMed] [Google Scholar]
- 49.Spinzi G, Amato A, Imperiali G, Lenoci N, Mandelli G, Paggi S, et al. Constipation in the elderly: management strategies. Drugs Aging 2009; 26(6):469–74. [DOI] [PubMed] [Google Scholar]
- 50.Hammond EC. Some preliminary findings on physical complaints from a prospective study of 1,064,004 men and women. Am J Public Health Nations Health 1964; 54:11–23. [DOI] [PMC free article] [PubMed] [Google Scholar]
- 51.Harari D, Gurwitz JH, Avorn J, Bohn R, Minaker KL. Bowel habit in relation to age and gender. Findings from the National Health Interview Survey and clinical implications. Arch Intern Med 1996; 156:315–20. [PubMed] [Google Scholar]
- 52.Everhart JE, Go VL, Johannes RS, Fitzsimmons SC, Roth HP, White LR. A longitudinal survey of self-reported bowel habits in the United States. Dig Dis Sci 1989; 34:1153–62. [DOI] [PubMed] [Google Scholar]
- 53.McCrea GL, Miaskowski C, Stotts NA, Macera L, Varma MG. Review of the Literature on Gender and Age Differences in the Prevalence and Characteristics of Constipation in North America. J of Pain and Sympt Manage 2009; 37(4):737–45. [DOI] [PubMed] [Google Scholar]
- 54.Mayer EA. Review: The neurobiology of stress and gastrointestinal disease. Gut 2000; 47:861–69. [DOI] [PMC free article] [PubMed] [Google Scholar]
- 55.Konturek PC, Brzozowski T, Konturek SJ. Stress and the gut: pathophysiology, clinical consequences, diagnostic approach and treatment options. J of Phys and Pharmaco 2011; 62(6):591–99. [PubMed] [Google Scholar]
- 56.Munck A, Guyre PM, Holbrook NJ. Physiological functions of glucocorticoids in stress and their relation to pharmacological actions. Endocr Rev 1984; 5:25–44. [DOI] [PubMed] [Google Scholar]
- 57.Elsenbruch S, Orr WC. Diarrhea- and Constipation-Predominant IBS Patients Differ in Postprandial Autonomic and Cortisol Responses. Am J of Gastroentero 2001; 96(2):460–66. [DOI] [PubMed] [Google Scholar]
- 58.Heitkemper M, Jarrett M, Cain K et al. Increased urine catecholamines and cortisol in women with irritable bowel syndrome. Am J Gastroenterol 1996; 91:906–13. [PubMed] [Google Scholar]
- 59.Patacchioli FR, Anagelucci L, Deblerba G, Monnazzi P, Leri O. Actual stress, psychopathology and salivary cortisol levels in the irritable bowel syndrome. J Endocrinol Invest 2001; 24:173–77. [DOI] [PubMed] [Google Scholar]
- 60.Gonenne J, Esfandyari T, Camilleri M, Burton DD, Stephens DA, et al. Effect of female sex hormone supplementation and withdrawal on gastrointestinal and colonic transit in postmenopausal women. Neurogastroenterol Motil 2006; 18:911–18. [DOI] [PubMed] [Google Scholar]
- 61.Schiller LR. Diarrhea and malabsorption in the elderly. Gastroenterol Clin North Am 2009; 38(3):481–502. [DOI] [PubMed] [Google Scholar]
- 62.Meddings JB, Swain MG. Environmental stress-induced gastrointestinal permeability is mediated by endogenous glucocorticoids in the rat. Gastroentero 2000; 119(4):1019–28. [DOI] [PubMed] [Google Scholar]
- 63.Dunlop SP, Hebden J, Campbell E, Naesdal J, Olbe L, et al. Abnormal Intestinal Permeability in Subgroups of Diarrhea-Predominant Irritable Bowel Syndromes. Am J Gastroentero 2006; 101:1288–94. [DOI] [PubMed] [Google Scholar]
- 64.Braniste V, Leveque M, Buisson-Brenac C, Bueno L, Fioramonti J, Houdeau E. Oestradiol decreases colonic permeability through oestrogen receptor beta-mediated up-regulation of occludin and junctional adhesion molecule-A in epithelial cells. J Physiol 2009; 587(13):3317–28. [DOI] [PMC free article] [PubMed] [Google Scholar]
- 65.Li JY, Chassaing B, Tyagi AM, Vaccaro C, Luo T, Adams J, et al. Sex steroid deficiency-associated bone loss is microbiota dependent and prevented by probiotics. J Clin Investig 2016; 126:2049–63. [DOI] [PMC free article] [PubMed] [Google Scholar]
- 66.Collins FL, Rios-Arce ND, Atkinson S, Bierhalter H, Schoenherr D, et al. Temporal and regional intestinal changes in permeability, tight junction, and cytokine gene expression following ovariectomy-induced estrogen deficiency. Physiol Rep 2017; 5(9): e13263, 10.14814/phy2.13263. [DOI] [PMC free article] [PubMed] [Google Scholar]