

Abstract
Objective
To estimate second stage duration and its effects on labor outcomes in obese versus nonobese nulliparous women.
Study Design
This was a secondary analysis of a cohort of nulliparous women who presented for labor at term and reached complete cervical dilation. Adjusted relative risks (aRR) were used to estimate the association between obesity and second stage characteristics, composite neonatal morbidity, and composite maternal morbidity. Effect modification of prolonged second stage on the association between obesity and morbidity was assessed by including an interaction term in the regression model.
Results
Compared with nonobese, obese women were more likely to have a prolonged second stage (aRR: 1.48, 95% CI: 1.18–1.85 for ≥3 hours; aRR: 1.65, 95% CI: 1.18–2.30 for ≥4 hours). Obesity was associated with a higher rate of second stage cesarean (aRR: 1.78, 95% CI: 1.34–2.34) and cesarean delivery for fetal distress (aRR: 2.67, 95% CI: 1.18–3.58). Obesity was also associated with increased rates of neonatal (aRR: 1.38, 95% CI: 1.05–1.80), but not maternal morbidity (aRR: 1.06, 95% CI:0.90–1.25). Neonatal morbidity risk was not modified by prolonged second stage.
Conclusion
Obesity is associated with increased risk of neonatal morbidity, which is not modified by prolonged second stage of labor.
Keywords: labor, obesity, second stage, second stage cesarean, second stage duration
Obesity is a growing public health concern in the United States as its prevalence continues to rise. According to the 2014 National Health and Nutrition Examination Survey, 37% of reproductive aged women (20–39 years old) are obese.1 The effect of obesity on reproductive health outcomes is concerning. Obesity increases maternal and neonatal complications throughout pregnancy, labor and delivery, and the postpartum period.2–5
Women who are obese are at increased risk of labor induction, prolonged labor, and cesarean delivery.2–8 There are several studies supporting prolonged duration of the first stage of labor among obese women. However, there is limited and conflicting data on the impact of obesity on second stage duration.6–8 Previously, two cohort studies did not show an association between body mass index (BMI) and second stage duration, while an additional study showed a shorter second stage duration among obese women compared with nonobese women.6,9,10
Second stage of labor duration greater than 3 hours has been associated with increased neonatal and maternal morbidity.11–15 Neonatal complications include low 5-minute Apgar scores, intensive care unit admissions, need for resuscitation at delivery, and sepsis. Maternal complications include infectious morbidities (e.g., endomyometritis, fever), uterine atony, hemorrhage, and perineal lacerations. Since obesity is also a risk factor for neonatal and maternal morbidity during labor, we hypothesized that obese women may have a disproportionate increase in neonatal and maternal morbidity when second stage of labor is prolonged.
The objective of this study was to compare second stage duration between obese and nonobese nulliparous women and assess neonatal and maternal morbidity in these two groups stratified by duration of the second stage.
Materials and Methods
This is a secondary analysis of a prospective cohort of nulliparous women who delivered at ≥37 weeks of gestation at Washington University Medical Center in St. Louis from 2010 to 2014. Washington University in St. Louis Human Research Protection Office approved this study. Multiple gestations and women who did not reach full cervical dilation prior to delivery were excluded. Women who did not have height or weight data were also excluded from the analysis (n = 20, 0.67% of cohort).
Trained obstetric research nurses abstracted detailed demographic information, obstetric, prenatal history and ante-partum history, labor and delivery course, and maternal and neonatal outcomes. Gestational age was based on the woman’s last menstrual period or first ultrasound.16 BMI was calculated using patient weight and height at the time of admission for delivery. Based on the Center for Disease Control definition, obese womenwere thosewith a BMI ≥30 kg/m2, and nonobese women were those with a BMI < 30 kg/m2.
The primary outcomes were prolonged second stage duration and second stage cesarean delivery. Prolonged second stage duration was defined as ≥3 hours and ≥4 hours based on current recommendations from the American College of Obstetrics and Gynecology.17 Secondary outcomes were composite neonatal and maternal morbidity. Composite neonatal morbidity included hypoxic ischemic encephalopathy, therapeutic hypothermia, intubation, respiratory distress, culture-proven sepsis, and umbilical cord pH < 7.10. Composite maternal morbidity included peripartum fever (≥38.0°C), chorioamnionitis, postpartum hemorrhage (blood loss >500 mL after vaginal delivery or >1,000 mL after cesarean delivery), blood product transfusion, and endomyometritis. Chorioamnionitis and endomyometritis variables were assigned based on clinical diagnosis recorded in the chart by peripartum physician and treatment with appropriate antibiotics. In general, our institutional protocol is presence of fever (either persistent temperature of > 38.0–38.9°C or 39.0°C on one occasion), exclusion of other potential sources and presence of fundal tenderness in the case of endomyometritis or presence of additional clinical criteria as outline by American College of Obstetricians and Gynecologists.18 When more than one neonatal or maternal morbidity was present, only one per patient was counted toward each composite. Second stage of labor was defined as the time between full cervical dilation and delivery of the neonate. Delayed pushing was present if the time between complete cervical dilation and initiation of pushing was ≥60 minutes. Primary and secondary outcomes were compared between obese and nonobese patients. An associa tion between second stage duration and cesarean delivery rates was also calculated among the two cohorts.
Baseline and labor characteristics were estimated for the entire cohort and compared between obese and nonobese women using X2 for categorical variables and the student t-test or Mann–Whitney U-test for continuous variables, as appropriate. Normality was tested using the Shapiro–Francia test. Multivariable logistic regression was used to compare primary and secondary outcomes and to adjust for confounders. The variables initially included in the models were selected if they were identified as significant in the univariate analyses and had prior evidence of effect.19–23 A backward step-wise selection was then performed, keeping only covariates that remained significant in the model looking at our primary outcome of prolonged second stage, which were neonatal birthweight and black race. Initial models also included induction and maternal comorbidities (hypertensive disease and diabetes). Delayed pushing was not included in the models as it is on the causal pathway in the relationship between obesity and labor duration. Adjusted relative risks (aRR) were estimated using a method proposed by Zhang et al24 Model fit was assessed with the Hosmer–Lemeshow goodness of fit test.25 An interaction term was included in the logistic regression models to test whether the relationship between obesity and neonatal or maternal morbidity was modified by prolonged second stage duration.
All patients meeting inclusion criteria were included and, therefore, no a priori sample size estimation was performed. STATA Version 12.1 (STATA Corp., College Station, TX) was used to perform all analyses.
Results
There were 2,948 women who met inclusion criteria. Of these, 1,552 (52.6%) had a BMI < 30 kg/m2 and 1,396 (47.4%) had a BMI ≥30 kg/m2. On average, women who were obese were more likely to deliver beyond 40 weeks gestation and have infants weighing ≥4,000 grams. Obese women were also more likely to have maternal comorbidities including hypertensive disorders and pregestational diabetes, an induction of labor and undergo delayed pushing in the second stage of labor (Table 1).
Table 1.
Baseline characteristics
| BMI < 30 kg/m2 N = 1552 | BMI ≥30 kg/m2 N = 1396 | p-Value | |
|---|---|---|---|
| Maternal age | 23.1 ± 5.8 | 23.5 ± 5.7 | 0.14 |
| Advanced maternal age | 63 (4.1) | 72 (5.2) | 0.15 |
| Hypertensive disordera | 242 (15.6) | 367 (23.6) | <0.001 |
| Chronic hypertension | 20 (1.3) | 60 (4.3) | <0.001 |
| Hypertensive disorder of pregnancy | 227 (14.6) | 329 (23.6) | <0.001 |
| Diabetesb | 49 (3.2) | 70 (5.0) | 0.01 |
| Pregestational diabetes | 9 (0.6) | 26 (1.9) | 0.001 |
| Gestational diabetes | 40 (2.6) | 44 (3.2) | 0.35 |
| Mean gestational age (weeks) | 39.3 ± 1.19 | 39.5 ± 1.22 | <0.001 |
| Gestational age | |||
| 37°−386 | 557 (35.9) | 447 (32.0) | 0.001 |
| 39°−406 | 877 (56.5) | 790 (56.6) | |
| ≥ 40°c | 118 (7.6) | 159 (11.4) | |
| Ethnicity | |||
| Black | 852 (54.9) | 915 (65.5) | <0.001 |
| Caucasian | 444 (28.6) | 366 (26.2) | |
| Other | 256 (16.5) | 115 (8.2) | |
| Infant weight (g) | 3122 ± 435 | 3253 ± 451 | <0.001 |
| Macrosomia | 37 (2.4) | 74 (5.3) | <0.001 |
| SGA | 302 (19.5) | 176 (12.6) | <0.001 |
| Labor type | |||
| Spontaneous | 442 (28.5) | 264 (18.9) | <0.001 |
| Augmented | 478 (30.8) | 429 (30.7) | |
| Induced | 632 (40.7) | 703 (50.4) | |
| Epidural | 1442 (92.9) | 1318 (94.4) | 0.10 |
| Delayed pushing | 159 (10.2) | 182 (13.0) | 0.02 |
| Prolonged 1st stagec | 84 (6.0) | 62 (4.0) | 0.01 |
Abbreviations: BMI, body mass index; SGA, small for gestational age infant.
Note: Values are n (%) or mean SD. p-values based on X2 for categorical variables and the student t-test or Mann–Whitney U-test for continuous variables.
Includes chronic hypertension, gestational hypertensive disorders;
includes pregestational and gestational diabetes;
1st stage duration > 95th percentile within the cohort (> 15.3 h in nulliparous women).
The median duration of second stage of labor was longer among obese women than nonobese women (61 vs. 55 min, p < 0.01; Table 2). Additionally, the 90th, 95th, and 99th percentiles of second stage duration were longer in obese relative to nonobese women (Table 2). Obese women were more likely to have a second stage duration lasting ≥3 hours (aRR: 1.48, 95% CI: 1.18–1.85) or 4 hours (aRR: 1.65, 95% CI: 1.18–2.30) compared with nonobese women. Obese women were also more likely to have a cesarean delivery in the second stage of labor when compared with nonobese women (aRR: 1.78, 95% CI: 1.34–2.34). Arrest of descent was the most common indication for cesarean and was not statistically different between the two groups (Table 3). However, obese women were two and a half times more likely to undergo cesarean delivery for fetal distress in the second stage. There was no difference in proportion of operative vaginal deliveries between the two groups.
Table 2.
Second stage of labor characteristics by BMI
| Cohort N = 2948 | BMI < 30 kg/m2 N = 1552 | BMI >30 kg/m2 N = 1396 | p-Value | RR (95%CI) | aRR (95% CI) | |
|---|---|---|---|---|---|---|
| Median 2nd stage durationa | 57 (31–107) | 55 (30–99.5) | 61 (33–116) | 0.01 | ||
| 90th percentile | 178 | 169 | 195 | - | ||
| 95th percentile | 236 | 211 | 246 | - | ||
| 99th percentile | 320 | 306 | 371 | - | ||
| 2nd stage ≥3h | 286 (9.7) | 125 (8.1) | 161 (11.5) | <0.01 | 1.43 (1.15–1.79) | 1.48 (1.18–1.85) |
| 2nd stage ≥4h | 138 (4.7) | 58 (3.7) | 80 (5.7) | 0.01 | 1.53 (1.10–2.13) | 1.65 (1.18–2.30) |
| Mode of delivery | ||||||
| Vaginal delivery | 2,483 (84.2) | 1,338 (86.2) | 1,145 (82.0) | <0.01 | 0.95 (0.92–0.98) | 0.96 (0.93–0.99) |
| Operative vaginal delivery | 256 (8.7) | 137 (8.8) | 119 (8.5) | 0.77 | ||
| Cesarean | 209 (7.1) | 77 (5.0) | 132 (9.5) | <0.01 | 1.91 (1.45–2.50) | 1.78 (1.34–2.34) |
Abbreviations: BMI, body mass index; CI, confidence interval.
Note: Values are n (%) or median (IQR), unless otherwise specified.
Second stage duration presented in minutes. p-Value based on Wilcoxon rank-sum test or X2; RR adjusted for black race and neonatal birthweight.
Table 3.
Indication for cesarean delivery by BMI
| BMI < 30 kg/m2 N = 77 | BMI ≥30 kg/m2 N = 132 | p-Value | RR (95% CI) | aRR (95% CI) | |
|---|---|---|---|---|---|
| Arrest of descent | 50 (64.9) | 76 (57.6) | 0.29 | 0.89 (0.71–1.10) | 0.95 (0.71–1.15) |
| Nonreassuring fetal status | 6 (7.8) | 29 (22.0) | <0.01 | 2.82 (1.23–6.48) | 2.67 (1.18–3.58) |
| Arrest of descent and nonreassuring fetal status | 19 (24.7) | 25 (18.9) | 0.33 | 0.77 (0.4501.30) | 0.66 (0.35–1.15) |
Abbreviations: BMI, body mass index; CI, confidence interval.
Note: Values are n (%), unless otherwise specified. RR adjusted for black race and neonatal birthweight.
We stratified duration of the second stage into <2 hours, 2 to 3 hours, 3 to 4 hours, and ≥4 hours to further understand whether the timing of second stage cesarean deliveries differed in obese versus nonobese women (Fig. 1). Cesarean delivery was significantly higher among obese women at all time points less than 4 hours (<2 hours, 2–3 hours, and 3–4 hours) compared with nonobese women. Cesarean delivery rates were highest when the second stage duration was ≥4 hours and were not statistically different between obese and nonobese women in this group.
Fig. 1.
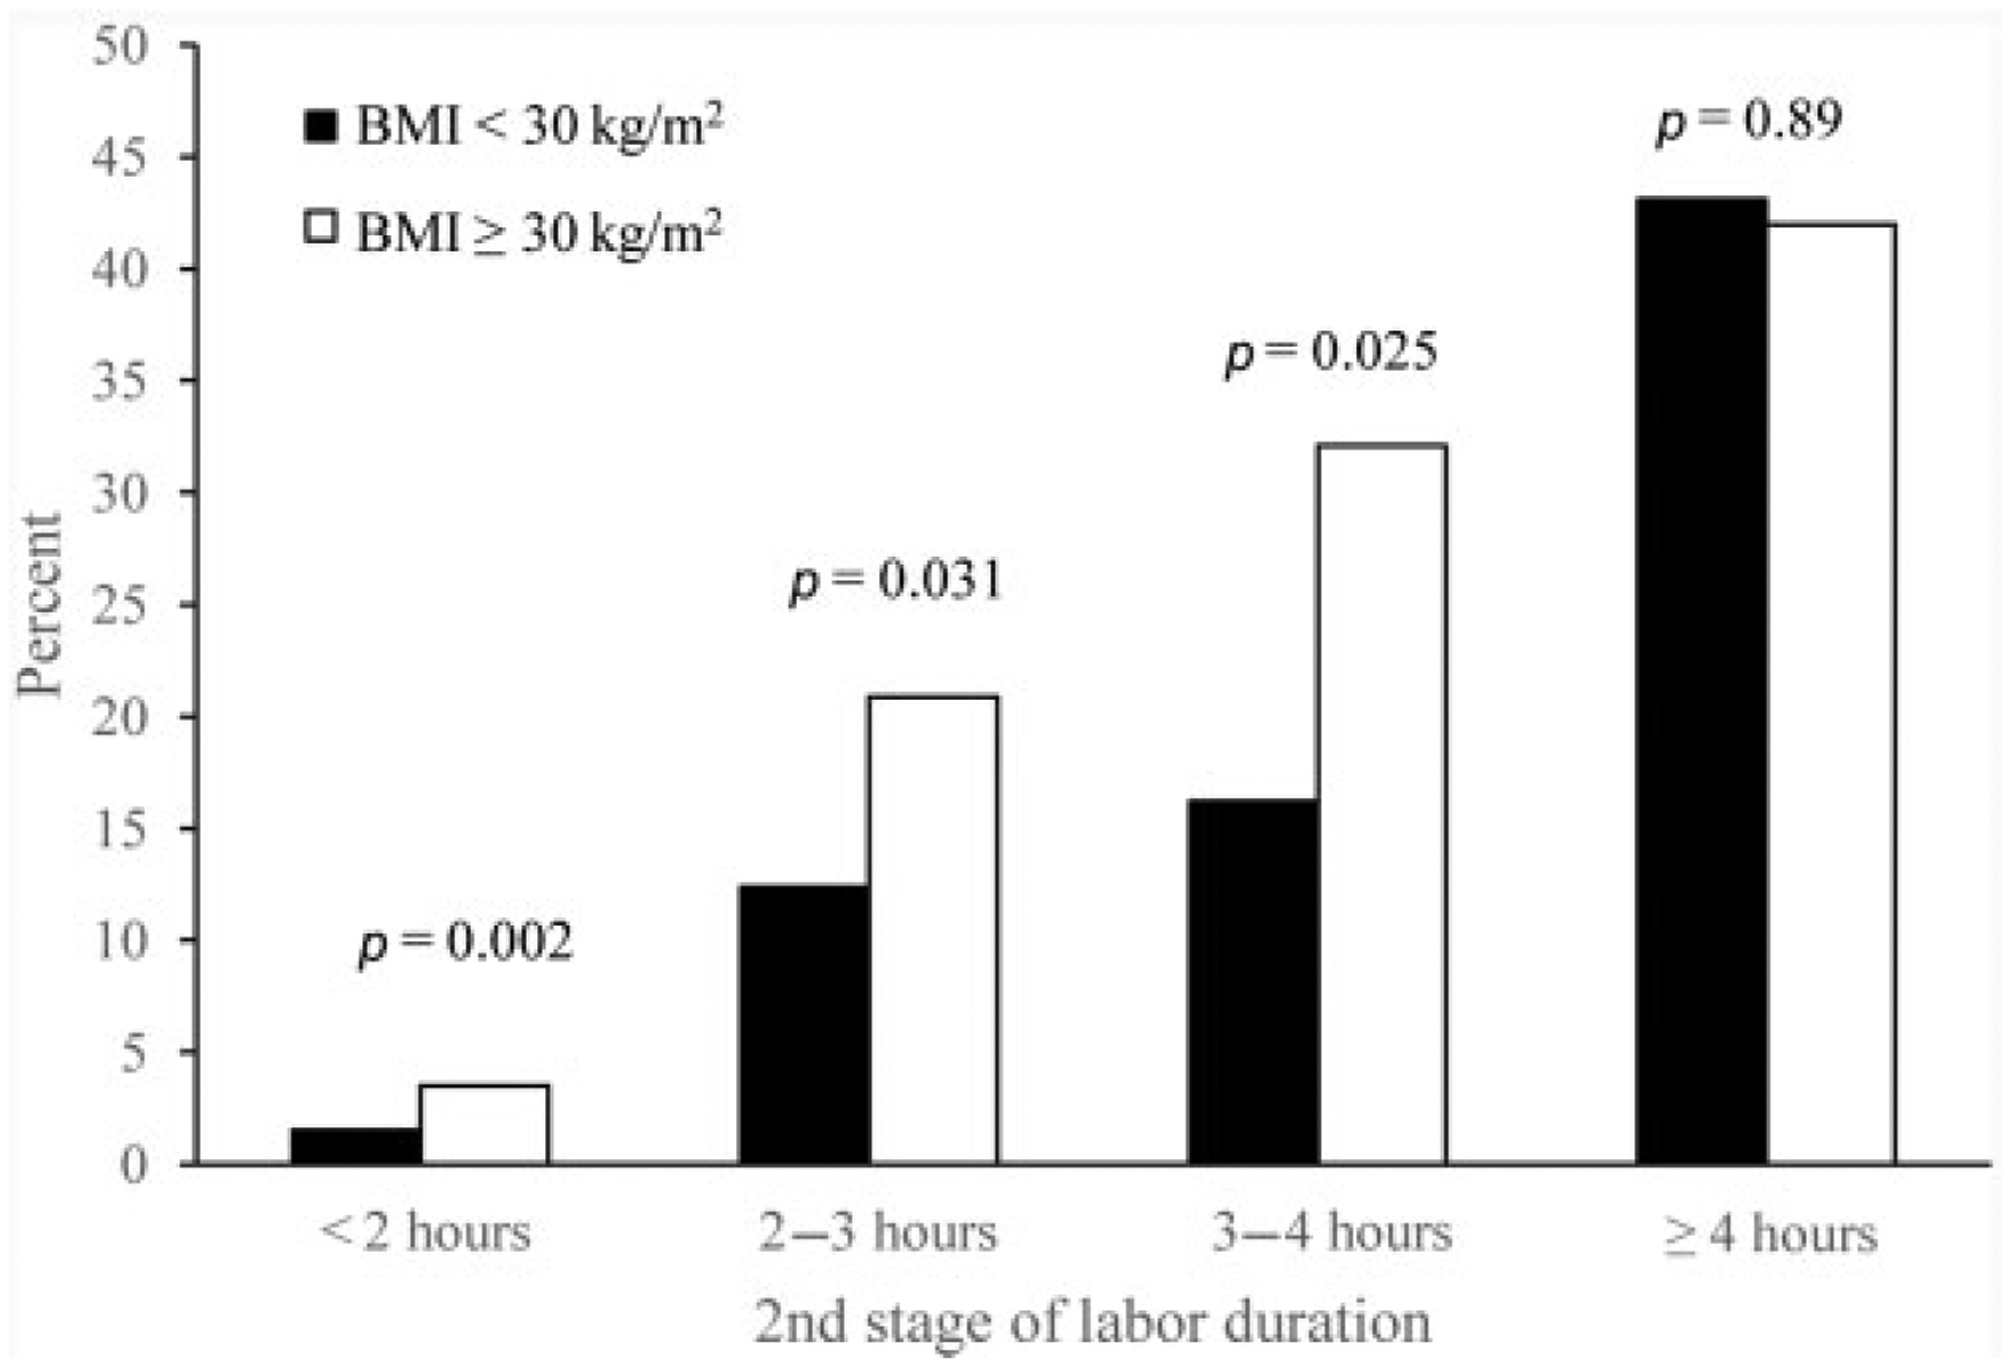
Cesarean rate by second stage of labor. Rate of cesarean deliveries within each strata of second stage duration for obese and nonobese women. Represented as percent of total deliveries during each time point.
Neonates born to obese women had a significantly higher risk of composite neonatal morbidity compared with those born to nonobese women after adjusting for birthweight and black race (8.6 vs. 5.7%, aRR: 1.38, 95% CI: 1.05–−1.80; Table 4). When the cohort was stratified by duration of second stage, obesity was only associated with a higher rate of neonatal morbidity among women with a second stage of labor 0 to 3 hours, with no evidence of interaction (p for interaction 0.24 and 0.27). Maternal composite morbidity was not different between obese and nonobese women after adjusting for confounders (18.5 vs. 15.5%, aRR: 1.06, 95% CI: 0.90–1.25; Table 4). All adverse neonatal outcomes except neonatal acidemia, umbilical artery pH < 7.10, and culture-proven sepsis were significantly higher in neonates born to obese women when compared with nonobese women (Table 5).
Table 4.
Neonatal and maternal morbidity by BMI
| BMI < 30kg/m2 N = 1552 | BMI ≥30 kg/m2 N = 1396 | RR (95% CI) | aRR (95% CI) | |
|---|---|---|---|---|
| Neonatal composite | 89 (5.7) | 118 (8.6) | 1.47 (1.13–1.92) | 1.38 (1.05–1.80) |
| 2nd stage < 3h | 81 (5.7) | 102 (8.3) | 1.46 (1.10–1.93) | 1.38 (1.04–1.83) |
| 2nd stage 3–4h | 5 (7.5) | 4 (4.9) | 0.66 (0.19–2.37) | 0.63 (0.16–2.20) |
| 2nd stage ≥4h | 3 (5.2) | 12 (15.0) | 2.90 (0.86–9.81) | 1.92 (0.50–6.07) |
| Maternal composite | 241 (15.5) | 258 (18.5) | 1.19 (1.01–1.40) | 1.06 (0.90–1.25) |
| 2nd stage < 3h | 208 (14.6) | 211 (17.1) | 1.16 (0.98–1.40) | 1.05 (0.87–1.25) |
| 2nd stage 3–4h | 19 (28.4) | 22 (27.2) | 0.96 (0.57–1.61) | 0.99 (0.43–1.40) |
| 2nd stage ≥4h | 14 (24.1) | 25 (31.3) | 1.29 (0.74–2.27) | 1.26 (0.67–2.04) |
Abbreviations: BMI, body mass index; CI, confidence interval.
Note: Values are n (%), unless otherwise specified. RR adjusted for black race and neonatal birthweight.
Table 5.
Individual neonatal morbidity outcomes
| BMI < 30 kg/m2 N = 1552 | BMI ≥30 kg/m2 N = 1396 | p-Value | |
|---|---|---|---|
| Composite components | |||
| Hypoxic ischemic encephalopathy | 2 (0.1) | 14 (1.0) | 0.001 |
| Therapeutic hypothermia | 2 (0.1) | 16 (1.2) | <0.001 |
| Intubation | 8 (0.5) | 19 (1.4) | 0.02 |
| Respiratory distress | 69 (4.5) | 95 (6.8) | 0.005 |
| pH < 7.10 | 20 (1.3) | 30 (2.2) | 0.71 |
| Sepsis | 2 (0.1) | 0 | – |
| 5-minute APGAR < 7 | 37 (2.4) | 59 (4.2) | 0.005 |
| NICU admission | 173 (11.2) | 216 (15.5) | 0.001 |
Abbreviations: BMI, body mass index; CI, confidence interval; NICU, neonatal intensive care unit.
Note: Values are n (%), unless otherwise specified.
Discussion
In this large cohort of nulliparous women, we found that obese patients have an increased risk of prolonged second stage of labor and cesarean delivery in the second stage compared with nonobese women. Neonatal morbidity was significantly higher among obese women compared with nonobese women, and this risk was not modified by duration of the second stage of labor.
Our findings differ from those of the few prior studies, which showed either no increase or a decrease in second stage duration among obese women.6,9,10 The prior studies characterized second stage of labor duration as a continuous variable, which shows only a slight, likely clinically insignificant, difference in our study as well. We propose that the distribution of second stage duration may be more relevant and more able to detect significant differences than comparison of a median duration alone. Analyzing the second stage of labor as dichotomous variables of increasing duration in our study highlights that a larger proportion of obese women have a second stage lasting ≥3 and ≥4 hours. Our overall incidence of prolonged second stage of 9.7% is comparable to prior publications.26 Second stage of labor duration greater than 3 hours has previously been shown to increase both maternal and neonatal complications.11,14,27 In a population that is known to have increased morbidity associated with labor, this increase in second stage duration may be a contributing factor.
The difference in second stage duration between patients with and without obesity may be attributed to several factors. In clinical practice, providers may alter their labor management in the setting of obesity. Some providers may have more leniencies during the labor process in an attempt to avoid the morbidity of cesarean delivery in obese women. On the other hand, the concern for abnormal labor progression and the potential for an emergency cesarean delivery may prompt other providers toward more expeditious intervention in the labor process. There is also evidence that incision to delivery times are longer in the setting of cesarean deliveries in obese women, which may translate into increased second stage duration despite timely decisions to deliver via cesarean.28 Additionally, mechanistic studies in vitro and using animal models have suggested a dysfunction in myometrial contractility in the setting of obesity.29,30 Uterine contractions increase in intensity until fetal expulsion occurs and play an important role in the second stage of labor, suggesting that any myometrial dysfunction, such as that seen in obesity, could be reflected during this phase of the labor process by a prolonged duration.
We found that the rate of cesarean delivery during the second stage of labor is two times higher among obese women than nonobese women. Givenwhat we know about the morbidity of cesarean delivery among obese women, including higher infection and wound complication rates, this is an important finding to take under consideration.31 Second stage cesarean deliveries are associated with significantly increased maternal morbidity, including intraoperative complications, hemorrhage, and endomyometritis.32–34 The increased maternal morbidity seen among obese women undergoing cesarean deliveries may be further compounded by increased rates of cesarean deliveries in the second stage of labor. The increased rate of cesarean deliveries among obese women was seen only prior to second stage duration reaching 4 hours, suggesting that the incidence of prolonged second stage is not solely the result of provider-delayed initiation of cesarean delivery in obese women. However, the higher incidence of cesarean among obese women early in the second stage may be a reflection of provider inability to monitor the fetus for distress since electronic fetal monitoring can be challenging in this population.35 Additionally, if there is a behavioral tendency for provider intervention earlier in obese women, the natural history of the duration of the second stage may be even longer than what we observed. Since we also sawan increase in cesarean delivery for nonreassuring fetal status, we suspect that this increase in cesarean delivery may be related to fetal compromise seen earlier in the second stage among obese women.
Two prior studies showed no association between BMI and rates of second stage cesareans; however, these studies had considerably higher rates of operative vaginal deliveries (18–30% compared with 8.7% among our cohort).9,36 National trends over recent years show a consistent drop in operative vaginal delivery rates,17 which may partially explain the decline in operative vaginal deliveries in our study. Since prior data suggest that obesity is a risk factor for operative delivery, this population may be at a disproportionate risk of cesarean delivery as rates of operative vaginal delivery decline.37
Increased morbidity among neonates born to obese women has previously been reported.2,38,39 While we hypothesized that prolonged duration of second stage may lead to a disproportionately higher rate of neonatal morbidity specifically among obese women, our data do not support this. Instead, our data demonstrate the risk of neonatal morbidity in obese women is elevated in second stage <3 hours, but not in the cases of prolonged second stage. The effect modification analysis, additionally, did not show a significant interaction between obesity and second stage duration in assessing the effects of obesity on neonatal morbidity. This suggests that the effect of obesity on neonatal morbidity is not significantly different between women with normal and prolonged second stage durations. However, the number of women with second stage duration > 4 hours was low (n = 138) and there may be an interaction we are underpowered to detect. Alternatively, we did not examine the effects of prolonged first stage or cesarean delivery on the interaction of obesity and prolonged second stage. It is possible that prolonged first stage differentially affects neonates of obese women, resulting in higher cesarean rates in the second stage and lower proportion of susceptible neonates reaching prolonged second stage durations. Lastly, our finding of a significantly higher risk of cesarean delivery due to nonreassuring fetal status in obese women, particularly prior to reaching 4 hours of second stage duration, suggests that the relationship between maternal obesity and neonatal morbidity in the second stage of labor warrants further investigation.
We did not detect a statistically significant difference in maternal morbidity between obese and nonobese women at any durationof second stage. This suggests that while maternal morbidity is increased among women with prolonged second stage, obese and nonobese women are equally susceptible. However, obese women do experience higher rates of surgical complications and we did not stratify our cohort by delivery mode to look at rates of maternal morbidity following second stage cesarean. Since the cesarean rate was only 9.5%, we would be underpowered to detect a difference, but this is an important question to address in future studies.
The large sample size and high proportion of obese women (47%), which allowed us to perform stratified analyses, are strengths of this study. However, despite our large cohort, the number of nulliparous women with a prolonged second stage, especially ≥4 hours, was small and may have prevented us from detecting significant interactions. The use of composite outcomes may be viewed as a weakness, but was necessary to detect differences in rare outcomes. Additionally, we selected the components of the composite carefully to include morbidities that are plausibly linked to obesity and prolonged second stage duration. Variation in physician labor management can be a source of bias as second stage management was not standardized in this study. Our institution has a variety of providers who manage the laboring patient including several private practitioners, residents, laborists, Maternal–fetal medicine physicians, and providers from federally-qualified health centers. As part of the nature of a tertiary-care center, the patient population is higher-risk than average and thus may require more intervention than normal deliveries. This is likely reflected in our high induction rate and should be taken into account when interpreting the results. Lastly, this study only examined short-term outcomes and there may be undetected effects on longer outcomes such as maternal wound complications, pelvic floor support, incontinence and neonatal neurologic morbidity.
In conclusion, among nulliparous women, obesity is associated with higher rates of prolonged second stage of labor and second stage cesarean delivery. While neonatal composite morbidity was higher among obese women, this was not differentially affected by duration of second stage.
Funding
A.G.C. is supported by the Eunice Kennedy Shriver National Institute of Child Health and Human Development (R01HD061619, PI Cahill), which partially supported this work.
Footnotes
Conflict of Interest
None declared.
References
- 1.Flegal KM, Kruszon-Moran D, Carroll MD, Fryar CD, Ogden CL. Trends in obesity among adults in the United States, 2005 to 2014. JAMA 2016;315(21):2284–2291 [DOI] [PMC free article] [PubMed] [Google Scholar]
- 2.Usha Kiran TS, Hemmadi S, Bethel J, Evans J. Outcome of pregnancy in a woman with an increased body mass index. BJOG 2005;112(06):768–772 [DOI] [PubMed] [Google Scholar]
- 3.Sebire NJ, Jolly M, Harris JP, et al. Maternal obesity and pregnancy outcome: a study of 287,213 pregnancies in London. Int J Obes Relat Metab Disord 2001;25(08):1175–1182 [DOI] [PubMed] [Google Scholar]
- 4.Lu GC, Rouse DJ, DuBard M, Cliver S, Kimberlin D, Hauth JC. The effect of the increasing prevalence of maternal obesity on perinatal morbidity. Am J Obstet Gynecol 2001;185(04):845–849 [DOI] [PubMed] [Google Scholar]
- 5.Heslehurst N, Simpson H, Ells LJ, et al. The impact of maternal BMI status on pregnancy outcomes with immediate short-term obstetric resource implications: a meta-analysis. Obes Rev 2008;9(06):635–683 [DOI] [PubMed] [Google Scholar]
- 6.Kominiarek MA, Zhang J, Vanveldhuisen P, Troendle J, Beaver J, Hibbard JU. Contemporary labor patterns: the impact of maternal body mass index. Am J Obstet Gynecol 2011;205(03):244.e1–244.e8 [DOI] [PMC free article] [PubMed] [Google Scholar]
- 7.Norman SM, Tuuli MG, Odibo AO, Caughey AB, Roehl KA, Cahill AG. The effects of obesity on the first stage of labor. Obstet Gynecol 2012;120(01):130–135 [DOI] [PMC free article] [PubMed] [Google Scholar]
- 8.Nuthalapaty FS, Rouse DJ, Owen J. The association of maternal weight with cesarean risk, labor duration, and cervical dilation rate during labor induction. Obstet Gynecol 2004;103(03): 452–456 [DOI] [PubMed] [Google Scholar]
- 9.Robinson BK, Mapp DC, Bloom SL, et al. ; Eunice Kennedy Shriver National Institute of Child Health and Human Development (NICHD) of the Maternal-Fetal Medicine Units Network (MFMU). Increasing maternal body mass index and characteristics of the second stage of labor. Obstet Gynecol 2011;118(06): 1309–1313 [DOI] [PMC free article] [PubMed] [Google Scholar]
- 10.Vahratian A, Zhang J, Troendle JF, Savitz DA, Siega-Riz AM. Maternal prepregnancy overweight and obesity and the pattern of labor progression in term nulliparous women. Obstet Gynecol 2004;104(5 Pt 1):943–951 [DOI] [PubMed] [Google Scholar]
- 11.Leveno KJ, Nelson DB, McIntire DD. Second-stage labor: how long is too long? Am J Obstet Gynecol 2016;214(04):484–489 [DOI] [PubMed] [Google Scholar]
- 12.Cheng YW, Hopkins LM, Caughey AB. How long is too long: does a prolonged second stage of labor in nulliparous women affect maternal and neonatal outcomes? Am J Obstet Gynecol 2004;191(03):933–938 [DOI] [PubMed] [Google Scholar]
- 13.Le Ray C, Audibert F, Goffinet F, Fraser W. When to stop pushing: effects of duration of second-stage expulsion efforts on maternal and neonatal outcomes in nulliparous women with epidural analgesia. Am J Obstet Gynecol 2009;201(04):361.e1–361.e7 [DOI] [PubMed] [Google Scholar]
- 14.Allen VM, Baskett TF, O’Connell CM, McKeen D, Allen AC. Maternal and perinatal outcomes with increasing duration of the second stage of labor. Obstet Gynecol 2009;113(06):1248–1258 [DOI] [PubMed] [Google Scholar]
- 15.Rouse DJ, Weiner SJ, Bloom SL, et al. ; Eunice Kennedy Shriver National Institute of Child Health and Human Development Maternal-Fetal Medicine Units Network. Second-stage labor duration in nulliparous women: relationship to maternal and perinatal outcomes. Am J Obstet Gynecol 2009;201(04):357.e1–357.e7 [DOI] [PMC free article] [PubMed] [Google Scholar]
- 16.Committee on Practice Bulletins—Obstetrics and the American Institute of Ultrasound in Medicine. Practice Bulletin No. 175: ultrasound in pregnancy. Obstet Gynecol 2016;128(06):e241–e256 [DOI] [PubMed] [Google Scholar]
- 17.American College of Obstetricians and Gynecologists; Society for Maternal-Fetal Medicine. Gynecologists, Society for Maternal-Fetal M. Obstetric care consensus no. 1: safe prevention of the primary cesarean delivery. Obstet Gynecol 2014;123(03): 693–711 [DOI] [PubMed] [Google Scholar]
- 18.Committee on Obstetric Practice. Committee Opinion No. 712: Intrapartum Management of Intraamniotic Infection. Obstet Gynecol 2017;130(02):e95–e101 [DOI] [PubMed] [Google Scholar]
- 19.Schiessl B, Janni W, Jundt K, Rammel G, Peschers U, Kainer F. Obstetrical parameters influencing the duration of the second stage of labor. Eur J Obstet Gynecol Reprod Biol 2005;118(01): 17–20 [DOI] [PubMed] [Google Scholar]
- 20.Piper JM, Bolling DR, Newton ER. The second stage of labor: factors influencing duration. Am J Obstet Gynecol 1991;165(4 Pt 1):976–979 [DOI] [PubMed] [Google Scholar]
- 21.Siggelkow W, Boehm D, Skala C, Grosslercher M, Schmidt M, Koelbl H. The influence of macrosomia on the duration of labor, the mode of delivery and intrapartum complications. Arch Gynecol Obstet 2008;278(06):547–553 [DOI] [PubMed] [Google Scholar]
- 22.Diegmann EK, Andrews CM, Niemczura CA. The length of the second stage of labor in uncomplicated, nulliparous African American and Puerto Rican women. J Midwifery Womens Health 2000;45(01):67–71 [DOI] [PubMed] [Google Scholar]
- 23.Bregand-White JM, Kominiarek MA, Hibbard JU. Hypertension and patterns of induced labor at term. Pregnancy Hypertens 2017;10:57–63 [DOI] [PMC free article] [PubMed] [Google Scholar]
- 24.Zhang J, Yu KF. What’s the relative risk? A method of correcting the odds ratio in cohort studies of common outcomes. JAMA 1998;280(19):1690–1691 [DOI] [PubMed] [Google Scholar]
- 25.Hosmer DW, Lemeshow S, Sturdivant R. Applied Logistic Regression 3rd ed. New York: Wiley; 2013 [Google Scholar]
- 26.Gimovsky AC, Guarente J, Berghella V. Prolonged second stage in nulliparous with epidurals: a systematic review. J Matern Fetal Neonatal Med 2017;30(04):461–465 [DOI] [PubMed] [Google Scholar]
- 27.Bleich AT, Alexander JM, McIntire DD, Leveno KJ. An analysis of second-stage labor beyond 3 hours in nulliparous women. Am J Perinatol 2012;29(09):717–722 [DOI] [PubMed] [Google Scholar]
- 28.Conner SN, Tuuli MG, Longman RE, Odibo AO, Macones GA, Cahill AG. Impact of obesity on incision-to-delivery interval and neonatal outcomes at cesarean delivery. Am J Obstet Gynecol 2013;209(04):386.e1–386.e6 [DOI] [PMC free article] [PubMed] [Google Scholar]
- 29.Zhang J, Bricker L, Wray S, Quenby S. Poor uterine contractility in obese women. BJOG 2007;114(03):343–348 [DOI] [PubMed] [Google Scholar]
- 30.Muir R, Ballan J, Clifford B, et al. Modelling maternal obesity: the effects of a chronic high-fat, high-cholesterol diet on uterine expression of contractile-associated proteins and ex vivo contrac-tile activity during labour in the rat. Clin Sci (Lond) 2016;130(03): 183–192 [DOI] [PMC free article] [PubMed] [Google Scholar]
- 31.Conner SN, Verticchio JC, Tuuli MG, Odibo AO, Macones GA, Cahill AG. Maternal obesity and risk of postcesarean wound complications. Am J Perinatol 2014;31(04):299–304 [DOI] [PMC free article] [PubMed] [Google Scholar]
- 32.Selo-Ojeme D, Sathiyathasan S, Fayyaz M. Caesarean delivery at full cervical dilatation versus caesarean delivery in the first stage of labour: comparison of maternal and perinatal morbidity. Arch Gynecol Obstet 2008;278(03):245–249 [DOI] [PubMed] [Google Scholar]
- 33.Tuuli MG, Liu L, Longman RE, Odibo AO, Macones GA, Cahill AG. Infectious morbidity is higher after second-stage compared with first-stage cesareans. Am J Obstet Gynecol 2014;211(04):410. e1–410.e6 [DOI] [PMC free article] [PubMed] [Google Scholar]
- 34.Lurie S, Raz N, Boaz M, Sadan O, Golan A. Comparison of maternal outcomes from primary cesarean section during the second compared with first stage of labor by indication for the operation. Eur J Obstet Gynecol Reprod Biol 2014;182:43–47 [DOI] [PubMed] [Google Scholar]
- 35.Brocato B, Lewis D, Mulekar M, Baker S. Obesity’s impact on intrapartum electronic fetal monitoring. J Matern Fetal Neonatal Med 2019;32(01):92–94 [DOI] [PubMed] [Google Scholar]
- 36.Fyfe EM, Anderson NH, North RA, et al. ; Screening for Pregnancy Endpoints (SCOPE) Consortium. Riskof first-stage and second-stage cesarean delivery by maternal body mass index among nulliparous women in labor at term. Obstet Gynecol 2011;117(06):1315–1322 [DOI] [PubMed] [Google Scholar]
- 37.Weiss JL, Malone FD, Emig D, et al. ; FASTER Research Consortium. Obesity, obstetric complications and cesarean delivery rate–a population-based screening study. Am J Obstet Gynecol 2004;190(04):1091–1097 [DOI] [PubMed] [Google Scholar]
- 38.Rastogi S, Rojas M, Rastogi D, Haberman S. Neonatal morbidities among full-term infants born to obese mothers. J Matern Fetal Neonatal Med 2015;28(07):829–835 [DOI] [PMC free article] [PubMed] [Google Scholar]
- 39.Scott-Pillai R, Spence D, Cardwell CR, Hunter A, Holmes VA. The impact of body mass index on maternal and neonatal outcomes: a retrospective study in a UK obstetric population, 2004–2011. BJOG 2013;120(08):932–939 [DOI] [PubMed] [Google Scholar]