Abstract
Antigen stimulation (signal 1) triggers B cell proliferation, and primes B cells to recruit, engage, and respond to T cell help (signal 2). Failure to receive signal 2 within a defined time window results in B cell apoptosis, yet the mechanisms that enforce dependence upon co-stimulation are incompletely understood. Nr4a1-3 encode a small family of orphan nuclear receptors that are rapidly induced by B cell antigen receptor (BCR) stimulation. Here we showed that Nr4a1 and Nr4a3 play partially redundant roles to restrain B cell responses to antigen in the absence of co-stimulation, and do so in part by repressing expression of BATF and consequently MYC. The NR4A family also restrains B cell access to T cell help by repressing expression of the T cell chemokines CCL3 and CCL4, as well as CD86 and ICAM1. Such NR4A-mediated regulation plays a role specifically under conditions of competition for limiting T cell help.
Keywords: NUR77, NOR-1, Nr4a1, Nr4a3, B cell, BCR, apoptosis, BATF, MYC, CCL3, CCL4
INTRODUCTION
B cells are unable to mount productive immune responses if they encounter self-antigen (signal 1) in the absence of T cell co-stimulation (signal 2) and this serves to enforce self-tolerance1. Although antigen recognition is not sufficient, it is nevertheless essential for B cells to recruit, engage, and respond to T cell help2,3. In addition to driving cell cycle entry and the metabolic remodeling required to sustain an initial round of proliferation, antigen modulates expression of chemokines and chemokine receptors that position antigen-activated B cells in proximity to T cells in secondary lymphoid organs2,3. Antigen stimulation also upregulates cell surface molecules required for engagement of T cell help, such as ICAM1 and CD86, and primes B cells to respond to CD40L and cytokines supplied by T cells, in part by initiating transcription of Myc2,3. However, if B cells fail to recruit T cell help within a restricted window of time, they trigger apoptosis, become anergic, or revert to a “naïve-like” state, depending on the strength and duration of antigen stimulation4,5. Nevertheless, the mechanisms which normally restrain antigen-activated B cells and enforce their dependence upon co-stimulation are incompletely understood. Here we identified a role for the NR4A family in this process.
Nr4a1-3 encode a small family of orphan nuclear receptors (NUR77, NURR1, and NOR-1, respectively) that are induced by antigen stimulation in lymphocytes, and are thought to function as ligand-independent, constitutively active transcription factors (TFs)6. In addition, the NR4A family also trigger apoptosis via a cytosolic interaction with BCL-27,8. Structural homology and an overlapping expression pattern raise the possibility of functional redundancy among Nr4a gene products6. Indeed, the Nr4a genes are highly upregulated in thymocytes undergoing negative selection, in regulatory T (Treg) cells, and in anergic or exhausted T cells, where they play a collectively tolerogenic role, yet loss of multiple family members is necessary to fully reveal these functions9-14. Similarly, germline deletion of both Nr4a1 and Nr4a3 in mice (but neither one alone) leads to rapid development of a severe myeloproliferative disorder15.
We previously showed that Nr4a1 expression scales with the extent of antigen stimulation in vitro and in vivo, marks naturally occurring self-reactive B cells16-18, and imposes a novel layer of B cell tolerance by mediating competitive elimination of self-reactive B cells19. However, the function of Nr4a genes in response to acute BCR stimulation is unknown, and redundancy among the family members has never been explored in B cells.
Here we used germline and conditional mouse models to show that NUR77/Nr4a1 and NOR-1/Nr4a3 restrain B cells that receive signal 1 (antigen) in the absence of signal 2 (co-stimulation). By contrast, receipt of co-stimulatory signals bypasses inhibition by the NR4A family. Through unbiased gene expression profiling, we identified a novel set of transcriptional targets of the Nr4a family that are enriched for BCR-induced primary response genes (PRGs) and are cooperatively repressed by NUR77/Nr4a1 and NOR-1/Nr4a3, including the transcriptional co-factor BATF which in turn regulates MYC and B cell proliferation. Unexpectedly, we also identified a role for the NR4A family in restraining B cell access to T cell help by repressing expression of the T cell chemokines CCL3 and CCL4, as well as CD86 and ICAM1, and showed that this regulation is relevant under conditions of B cell competition for limiting amounts of T cell help.
RESULTS
NUR77/Nr4a1 expression scales with BCR stimulation
Nr4a1-3 are rapidly but transiently induced by BCR stimulation (Fig. 1a-c). Nr4a1 is the most highly expressed family member in B cells with or without BCR stimulation, Nr4a3 transcript is approximately 6-fold less abundant than Nr4a1, and Nr4a2 transcript is minimally detectable even after BCR stimulation (FPKM<10) (Fig. 1d). We previously characterized a BAC Tg reporter (NUR77-EGFP) in which EGFP is under the control of the regulatory region of Nr4a1, but does not perturb endogenous Nr4a1 expression (Fig. 1e; www.gensat.org)17. As with endogenous Nr4a1 transcript, endogenous NUR77 protein also exhibited rapid induction and a relatively short half-life, peaking between 2-4 h after BCR stimulation (Fig. 1f)20. Although the induction of NUR77-EGFP mirrors that of endogenous NUR77, EGFP protein has a relatively long half-life in vivo (approximately 20-24 h), and consequently accumulates over time (Fig. 1g).
Figure 1. NUR77/Nr4a1 expression scales with BCR stimulation in vitro and in vivo.
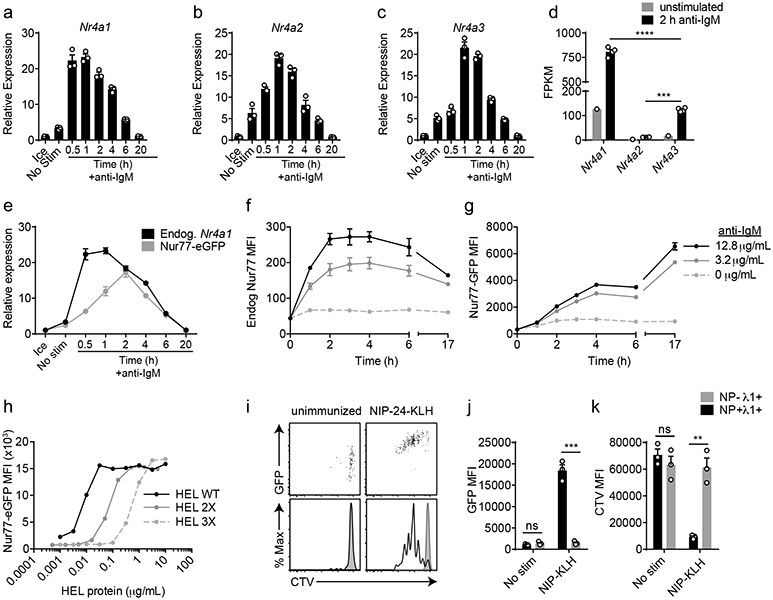
A-C, E. Lymphocytes from NUR77-EGFP BAC Tg mice were stimulated with 10 μg/mL anti-IgM for the indicated times. qPCR was performed to determine relative expression of Nr4a1, Nr4a2, Nr4a3, and EGFP transcript. These and all subsequent qPCR data were normalized within each sample to Gapdh and further normalized to the unstimulated ice sample in each graph using the ddCT method.
D. B cells from WT mice were purified by bench-top negative selection from pooled splenocytes and LNs, stimulated with 10 μg/mL anti-IgM for 2 h, flash frozen and sent to Q2 Solutions for RNA sequencing. Displayed is the FPKM of Nr4a1, Nr4a2 and Nr4a3. N=1 for the unstimulated conditions, and N=4 for the stimulated conditions. F-G. Splenocytes from NUR77-EGFP reporter mice were stimulated with the given doses of anti-IgM for the indicated times. Expression of endogenous NUR77 (F) and EGFP (G) in CD23+ B cells was assessed via flow cytometry. H. Lymphocytes from NUR77-EGFP reporter mice were incubated with soluble WT HEL, HEL 2X, and HEL 3X at serially diluted concentrations for 24 h. Expression of EGFP in B220+ B cells was assessed via flow cytometry. I-K. Splenocytes from B1-8i NUR77-EGFP mice were loaded with cell trace violet (CTV). 5x10⁶ cells were adoptively transferred into allotype marked CD45.1+ host mice that were subsequently immunized with 100μg NIP-KLH. Host splenocytes were harvested after 3 days, and CTV, EGFP, NP-binding and λ1 surface expression of donor B cells was assessed via flow cytometry. For I-K, black histogram and bars represent Ag-specific (NP+ λ1+) donor B cells; gray shaded histogram and bars represent non-Ag-specific (NP− + λ1+) control donor B cells. Data in this figure depict N=3 biological replicates for all panels except (D) as noted above. Mean +/− SEM displayed for all graphs. Statistical significance was assessed with one-way ANOVA with Tukey’s (D); two-tailed unpaired student’s t-test (J, K). **p<0.01, ***p<0.001, ****p<0.0001.
In order to assess regulation of NUR77 by bona fide antigen, we stimulated IgHEL BCR Tg reporter B cells with the cognate model antigen HEL (affinity=2x10¹⁰ M−1), as well as variants with much lower affinity (HEL2x: R73E, D101R; affinity = 8x10⁷ M−1 and HEL3x: R73E, D101R, R21Q; affinity = 1.5x10⁶ M−1)21. Induction of NUR77-EGFP and endogenous NUR77 scales not only with concentration, but also with affinity of antigen (Fig. 1h, Extended Data Fig. 1a,b).
To probe reporter induction in vivo, we took advantage of the B1-8i BCR model system in which the VH186.2 heavy chain is knocked into the heavy chain locus, and recognizes the hapten NP when paired with endogenous λ−1 light chains22. After adoptive transfer of vital dye-loaded B1-8i reporter splenocytes, hosts were immunized with NP-conjugated proteins. NP-binding λ−1+ donor B cells robustly upregulated EGFP and diluted vital dye after 72 h, while non-NP-binding λ−1+ B cells did not (Fig. 1i-k). These data confirm that EGFP is upregulated in Ag-specific B cells in response to immunization in vivo16.
NUR77/Nr4a1 restrains expansion of BCR-stimulated B cells
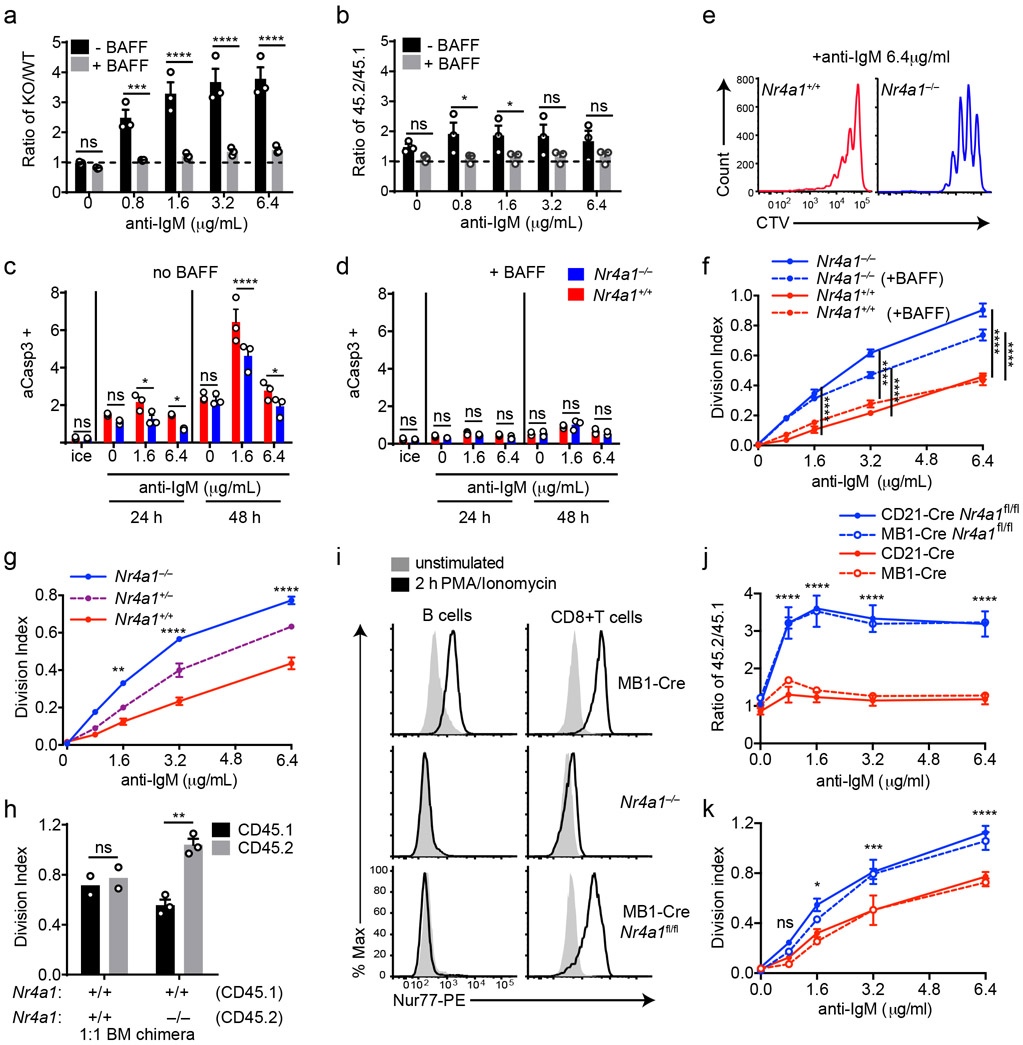
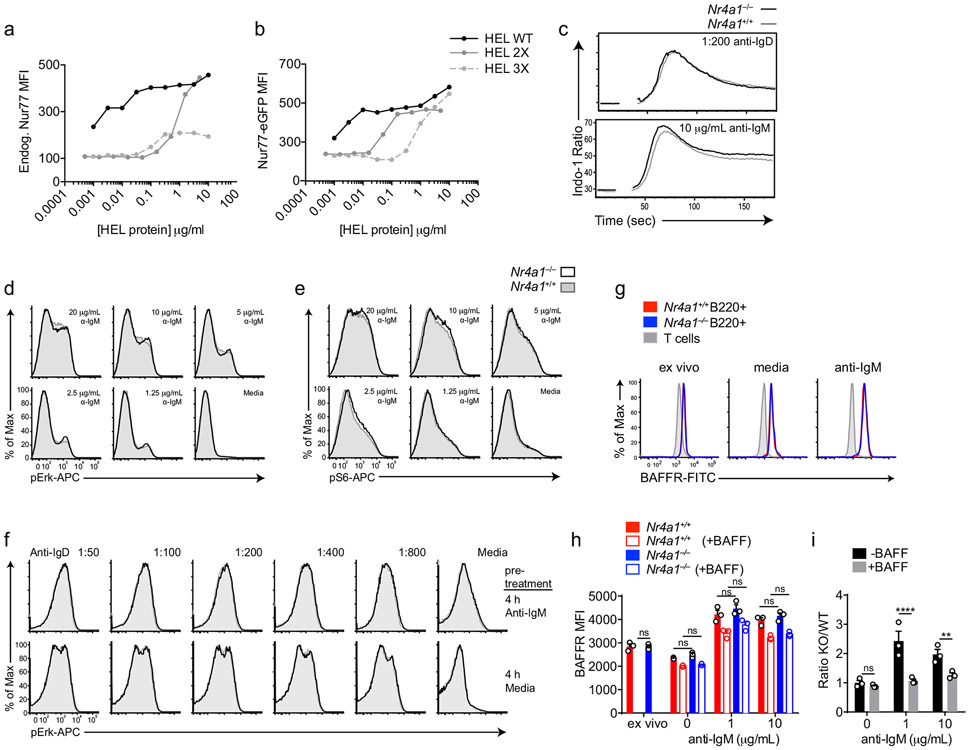
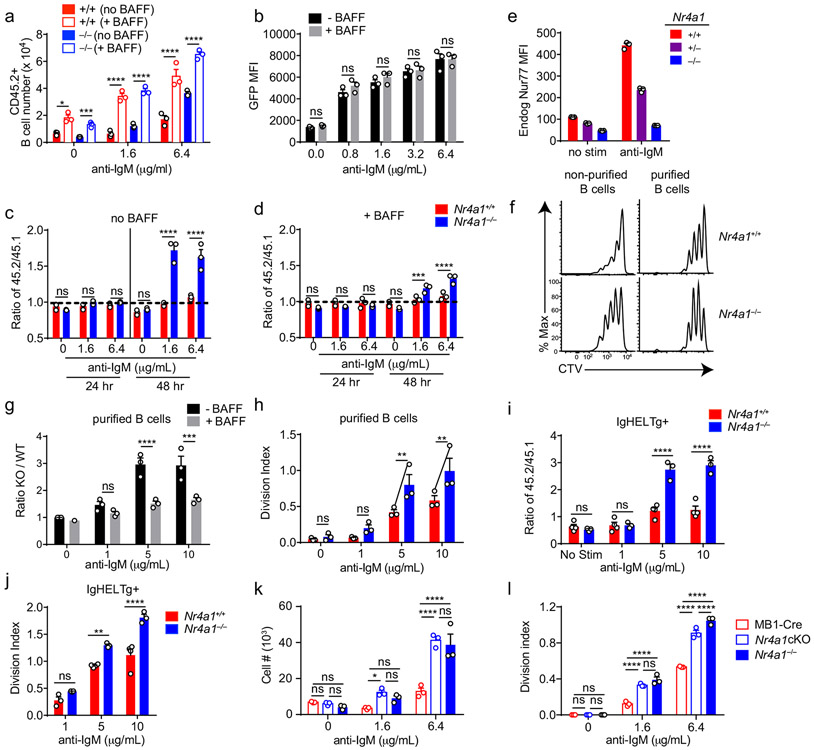
Since Nr4a1 is the most highly expressed family member in B cells, we used Nr4a1−/− mice to dissect the role of the NR4A family in acutely Ag-activated B cells23. We co-cultured either Nr4a1−/− or Nr4a1+/+ CD45.2+ lymphocytes with congenically marked wild-type CD45.1+ lymphocytes with anti-IgM. After 72 h Nr4a1-deficient B cells exhibit a competitive advantage in the presence (but not the absence) of BCR stimulation and this is not attributable to CD45 allotype (Fig. 2a,b)19. Early biochemical events triggered by BCR ligation, such as intra-cellular calcium entry and activation of the PI3K and ERK signaling cascades, were unchanged in Nr4a1−/− B cells, suggesting that altered BCR signal transduction does not account for this advantage (Extended Data Fig. 1c-f). This competitive advantage is suppressed in the presence of the B cell survival factor BAFF, strongly suggesting that it specifically reflects a survival advantage (Fig. 2a). Importantly, this advantage is not attributable to differences in BAFFR expression or BAFF sensitivity (Extended Data Fig. 1g-I, 2a,b). Although a competitive survival advantage is not evident until 48 h of co-culture, Nr4a1−/− B cells exhibit reduced activated Caspase-3 expression relative to wild-type by 24 h after BCR stimulation (Fig. 2c, Extended Data Fig. 2c). Both Caspase 3 activation and this competitive advantage are suppressed in the presence of BAFF at every time point assayed (Fig. 2d, Extended Data Fig. 2d). These data suggest that NUR77 mediates BCR-induced apoptosis of B cells beginning at early time points, and this translates into a competitive survival advantage at later time points.
Figure 2. NUR77/Nr4a1 promotes BCR-induced cell death and restrains BCR-induced proliferation of B cells in vitro in a cell-intrinsic manner.
A, B. Lymphocytes from either Nr4a1+/+ or Nr4a1−/− CD45.2+ mice were mixed in a 1:1 ratio with CD45.1+ lymphocytes, CTV loaded and co-cultured in the presence of indicated doses of anti-IgM +/− 20 ng/mL BAFF for 72 h. Cells were then stained to detect CD45.1, CD45.2, B220 and CTV via flow cytometry. A, B. Displayed is the ratio of CD45.2+ B cells [Nr4a1−/− (A) or Nr4a1+/+ (B)] relative to co-cultured CD45.1+ WT B cells, normalized to the input ratio. C, D. Lymphocytes were harvested from CD45.2+ Nr4a1+/+ or Nr4a1−/− mice, mixed 1:1 with CD45.1+ WT lymphocytes, and co-cultured with the given doses of anti-IgM +/− 20 ng/mL BAFF for either 24 or 48 h. C, D. Graphs depict the % of B cells expressing activated caspase-3 as assessed by intracellular staining via flow cytometry in samples without (C) or with (D) addition of BAFF. E, F. Lymphocytes were cultured as in A, B above. E. Representative histograms of CTV dilution in stimulated Nr4a1+/+ (red) and Nr4a1−/− (blue) B cells. F. Graph depicts division index of co-cultured Nr4a1−/− CD45.2+ and Nr4a1+/+ CD45.1+ B cells under all conditions assayed. G. Lymphocytes from Nr4a1+/+, Nr4a1+/− and Nr4a1−/− mice (littermate progeny of an intercross between Nr4a1+/− parents) were CTV loaded and independently cultured in the presence of indicated doses of anti-IgM for 72 h. Cells were then stained to detect B220 and CTV via flow cytometry. Graph depicts division index of each genotype. H. Competitive bone marrow chimeras were generated by reconstituting lethally irradiated CD45.1+ WT mice with 1:1 mixtures of either Nr4a1+/+ CD45.2+ or Nr4a1−/− CD45.2+ bone marrow mixed with WT CD45.1+ bone marrow. 8 weeks after reconstitution, lymphocytes were harvested, loaded with CTV and incubated for 72 h with 5 μg/mL anti-IgM. CTV dilution in B220+ B cells was determined via flow cytometry and graph depicts division index for N=2-3 biological replicates as plotted. I. Lymphocytes from mb1-cre, Nr4a1−/−, and mb1cre x Nr4a1 fl/fl mice were stimulated with PMA and ionomycin for 2 hours. Endogenous Nur77 expression was assessed in B220+ B cells and CD8+ T cells by intracellular staining via flow cytometry. Histograms are representative of > 3 biological replicates for each condition. J, K. Lymphocytes from mb1-cre, mb1cre x Nr4a1 fl/fl, CD21-cre, and CD21-cre x Nr4a1 fl/fl mice were mixed in a 1:1 ratio with WT CD45.1+ lymphocytes, CTV loaded, and co-cultured with the given doses of anti-IgM for 72 h. J. Displayed is the ratio of cre+ or cre+ Nr4a1fl/fl CD45.2+ B cells relative to co-cultured CD45.1+ WT B cells, normalized to the input ratio. K. Graph depicts division index of each genotype. Data in this figure depict N=3 biological replicates for all panels except (H) as noted above. Mean +/− SEM displayed for all graphs. Statistical significance was assessed with two-tailed unpaired student’s t-test with Holm-Sidak (A, B, C, D) or without (H); two-way ANOVA with Tukey’s (F, G, J, K). *p<0.05, **p<0.01, ***p<0.001, ****p<0.0001
We observed that NUR77 also restrains proliferation of BCR-stimulated B cells even in the presence of BAFF, suggesting this is independent of apoptosis (Fig. 2e,f). This phenotype was Nr4a1 gene dose-dependent and – as predicted for a negative feedback regulator – increasing NUR77 expression reduces the slope of the dose-response curve (Fig. 2f,g, Extended Data Fig. 2e). Importantly, this proliferative advantage was evident in both mixed and unmixed cultures of either purified B cells or total lymphocytes, suggesting that it reflects a cell-intrinsic function for NUR77 in B cells (Fig. 2f,g, Extended Data Fig. 2f-h). In addition, BCR repertoire does not account for these phenotypes (Extended Data Fig. 2I, j).
To further exclude a B cell-extrinsic contribution of NUR77 to these phenotypes, we generated competitive bone marrow chimeras by reconstituting lethally irradiated hosts with a 1:1 mixture of congenically marked CD45.1+ Nr4a1+/+ and CD45.2+ Nr4a1−/− bone marrow. Ex vivo cultures of lymphocytes from these chimeras recapitulate proliferative and survival advantage of Nr4a1−/− B cells (Fig. 2h)19.
Finally, we took advantage of a conditional allele of Nr4a1 (distinct from the germline-deficient Nr4a1 allele used above; Fig. 2i) to generate mice in which Nr4a1 was deleted either early or late during B cell development, with mb1-cre or CD21-cre respectively10,24,25. Competitive co-cultures of mb1-cre Nr4a1fl/fl, CD21-cre Nr4a1fl/fl lymphocytes, or cre controls (each mixed with congenically marked CD45.1+ lymphocytes) recapitulate the survival and proliferative advantage of Nr4a1-deficient B cells to a comparable extent (Fig. 2j,k, Extended Data Fig. 2k, l). Together, these data reveal a B cell-intrinsic role for Nur77/Nr4a1 in restraining both B cell survival and proliferation in response to BCR stimulation that is independent of development and repertoire.
NUR77 only limits B cell expansion in the absence of signal two
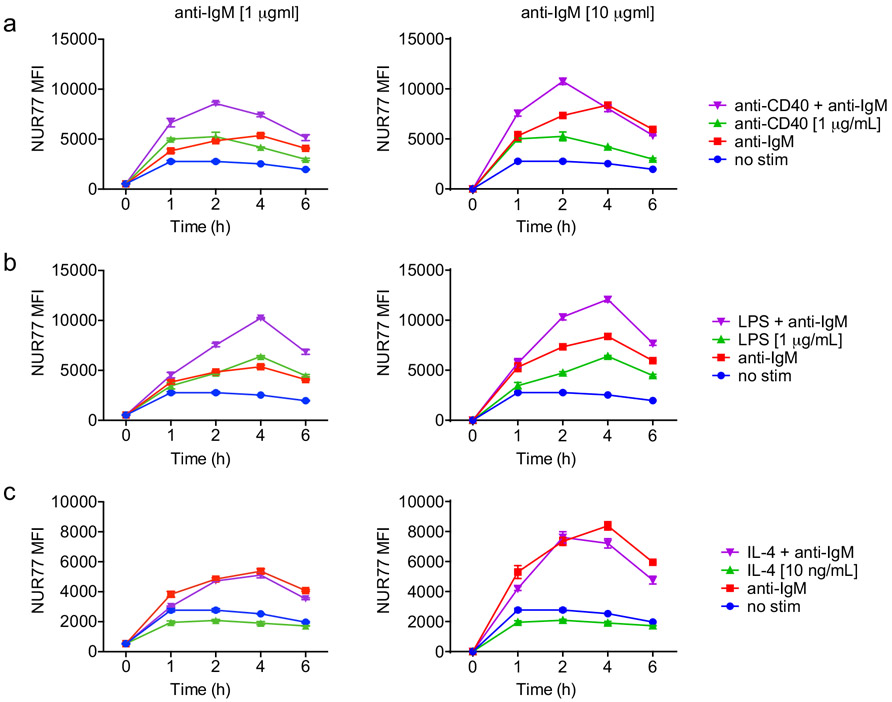
We next determined how co-stimulatory signals regulate NUR77 expression in B cells. Neither BAFF nor IL-4 could induce NUR77-EGFP expression, while both CD40 and the TLR4 ligand LPS could do so, suggesting the reporter is sensitive to canonical NF-κB signaling (Extended Data Fig. 2b, 3a-c)17. As with BCR stimulation alone, we found that NUR77 expression peaked at 2-4 h irrespective of co-stimulatory input (Extended Data Fig. 3a-c).
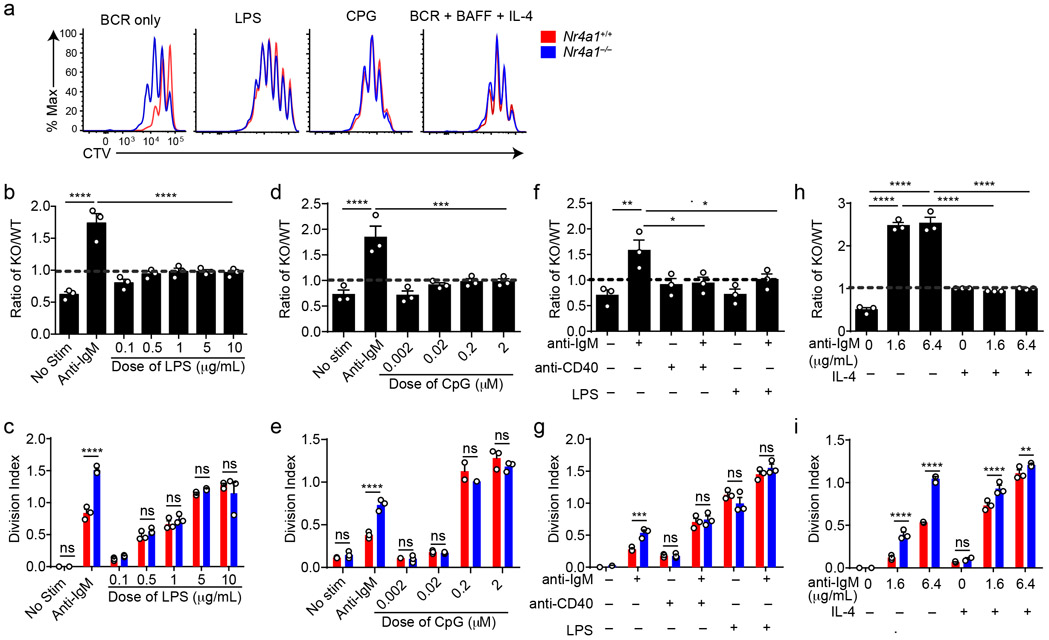
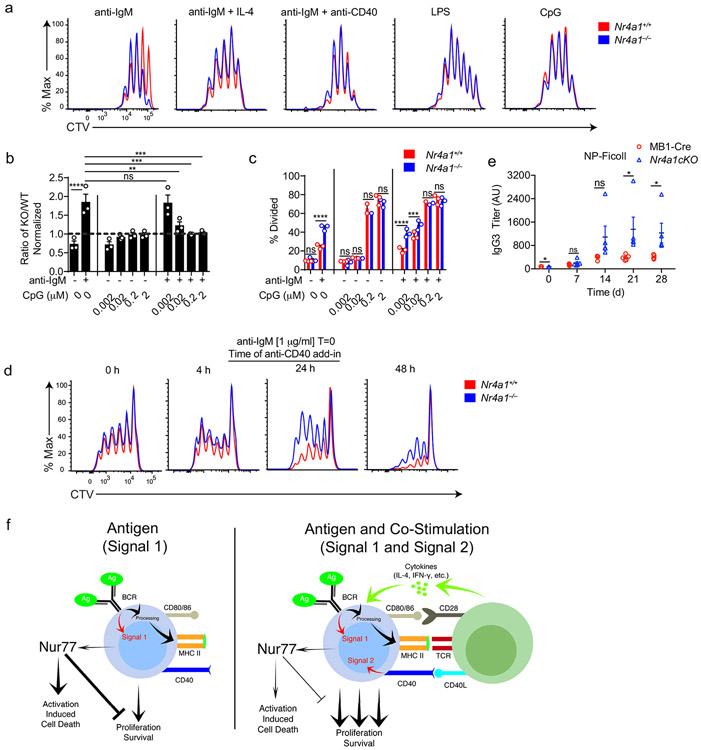
TLR ligands can serve as mitogenic stimuli for B cells either in isolation or together with BCR stimulation2. We found no survival or proliferative advantage for Nr4a1−/− B cells at any dose across a very broad titration of either LPS or CpG (Fig. 3a-e, Extended Data Fig. 4a). We further found that BCR-activated Nr4a1−/− B cells lose their advantage with superimposed high doses of LPS or CpG ( Fig. 3f,g, Extended Data Fig. 4b,c).
Figure 3. NUR77/Nr4a1 restrains survival and proliferation of B cells that receive signal one in the absence of signal two.
A-I. Lymphocytes from CD45.1+ Nr4a1+/+ and CD45.2+ Nr4a1−/− mice were mixed in a 1:1 ratio and loaded with CTV prior to co-culture for 72 h in the presence of various stimuli as described. Cells were then stained to detect CD45.1, CD45.2, B220 and CTV via flow cytometry. A. Histograms depict CTV dilution in B cells stimulated (from left to right) with either 10 μg/mL anti-IgM alone, 5 μg/mL LPS, 0.2 μM CpG, or anti-IgM + 20 ng/mL BAFF + 10 ng/mL IL-4, and are representative of > 3 biological replicates. B-I. Doses of stimuli as depicted, except 10 μg/mL anti-IgM (B-G), 1 μg/mL LPS and anti-CD40 (F, G), and 10ng/ml IL-4 (H, I). B, D, F, H. Displayed is the ratio of CD45.2+ Nr4a1−/− B cells relative to CD45.1+ Nr4a1+/+ B cells, normalized to the input ratio. C, E, G, I. Graphs depict division index of CD45.1+ Nr4a1+/+ (red) and CD45.2+ Nr4a1−/− (blue) B cells. Data in this figure depict N=3 biological replicates for all panels. Mean +/− SEM displayed for all graphs. Statistical significance was assessed with one-way ANOVA with Dunnett’s (B, D, F) or Sidak’s (H); two-tailed unpaired student’s t-test with Holm-Sidak (C, E, G, I). p-values in (B, D) represent comparison of anti-IgM treated condition compared to every other condition. *p<0.05, **p<0.01, ***p<0.001, ****p<0.0001
T cells deliver essential co-stimulatory signals to B cells that synergize with antigen to promote B cell survival and proliferation2. We found that both anti-CD40 and IL-4, when added to anti-IgM, eliminate the competitive advantage of BCR-activated Nr4a1−/− B cells (Fig. 3f-i). While TLR ligands are usually delivered in conjunction with antigen stimulation (e.g. bacteria, virus), B cells typically experience a physiologic time delay in vivo between antigen encounter and recruitment of T cell help. In order to mimic this delay, we systematically varied the time between initial BCR ligation and addition of anti-CD40. We found that addition of signal 2 at early time points eliminated the advantage of Nr4a1−/− B cells, but this advantage persisted if provision of signal 2 was substantially delayed (Extended Data Fig. 4d). These data collectively suggest that NUR77 selectively restrains survival and expansion of B cells that receive signal 1 (Ag) alone, and may help to render B cells dependent upon rapid receipt of signal 2 within a fixed time window following antigen encounter.
NUR77 limits antibody responses in the absence of co-stimulation
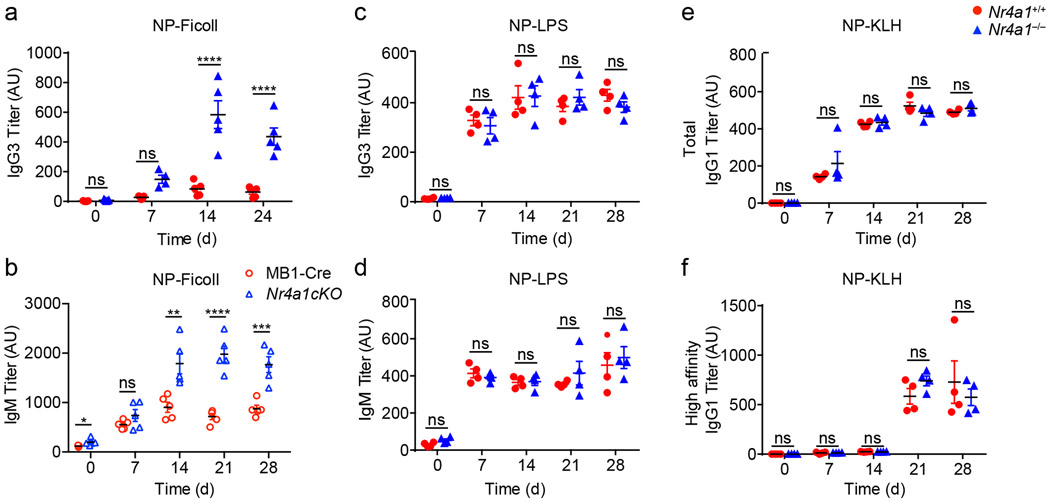
Next, to test in vivo relevance of these in vitro observations, we probed immune responses to a T-independent BCR stimulus, NP-Ficoll. We previously reported enhanced IgM responses to NP-Ficoll immunization of Nr4a1−/− hosts and here observe profoundly increased IgG3 responses to this immunogen across multiple time points (Fig. 4a)26. We reproduced this phenotype in mb1-cre Nr4a1fl/fl mice lacking NUR77 expression only in B cells (Fig. 4b, Extended Data Fig. 4e). By contrast, total NP-specific titers induced by NP-LPS or the T-dependent immunogen NP-KLH are comparable irrespective of NUR77 expression (Fig. 4c-e). Affinity maturation in response to NP-KLH is also unaffected (Fig. 4f). These data suggest that, similar to in vitro assays, NUR77 selectively restrains B cell responses to antigen in the absence of signal 2 and does so in a B cell-intrinsic manner in vivo (see model, Extended Data Fig. 4f).
Figure 4. NUR77/Nr4a1 selectively restrains humoral immune responses to T-independent II immunogens in vivo.
A. Nr4a1+/+ and Nr4a1−/− mice were immunized IP with 100 μg NP-Ficoll and anti-NP IgG3 titers were determined via ELISA at serial time points. Data in A are representative of N=5 biological replicates, and 3 independent experiments. B. MB1-Cre and Nr4a1cKO mice were immunized with 100 μg NP-Ficoll and anti-NP IgM titers were determined via ELISA at serial timepoints. Data in B are representative of N=5 biological replicates. C,D Nr4a1+/+ and Nr4a1−/− mice were immunized IP with 100 μg NP-LPS and anti-NP IgG3 (C) and IgM (D) titers were determined via ELISA at serial time points. Data in D, E are representative of N=4 biological replicates. E,F. Nr4a1+/+ and Nr4a1−/− mice were immunized IP with 100 μg NP-KLH admixed 1:1 with alum and anti-NP IgG1 were determined via ELISA at serial time points. ELISA plates were coated with either NP-24-BSA (E), or NP-1-RSA (F) in order to detect total and high affinity NP-specific Abs respectively. Data in E, F are representative of N=4 biological replicates and 2 independent experiments. Mean +/− SEM displayed for all graphs. Statistical significance was assessed with two-tailed unpaired student’s t-test with Holm-Sidak (A-F). *p<0.05, **p<0.01, ***p<0.001, ****p<0.0001
Compensation and redundancy among the NR4A family in B cells
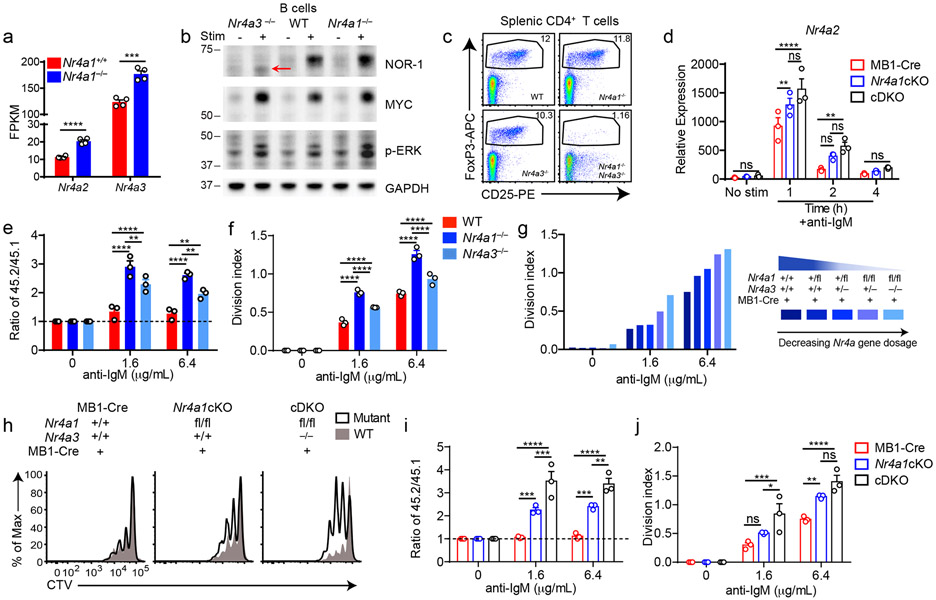
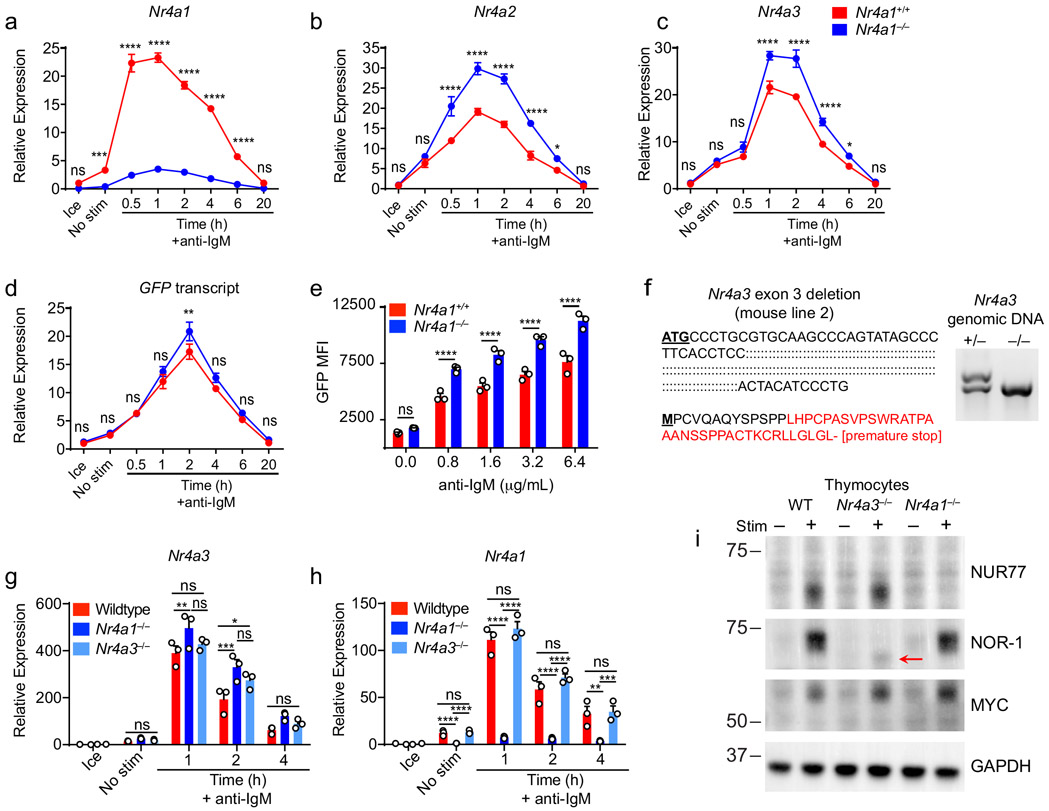
Although NUR77/Nr4a1 plays a non-redundant role in B cells, the NR4A family exhibits functional redundancy in other immune cells, most strikingly in Treg cells9-11,15. Therefore, we next sought to unmask redundant NR4A functions in B cells. In the absence of NUR77 expression, Nr4a2 and Nr4a3 exhibit modestly enhanced induction in response to BCR stimulation (Fig. 5a, Extended Data Fig. 5a-c). NUR77 may also repress its own expression; we generated Nr4a1−/− NUR77-EGFP BAC Tg mice and observed enhanced EGFP transcript and protein induction in response to BCR stimulation in the absence of endogenous NUR77 expression (Extended Data Fig. 5d, e). Importantly, although Nr4a2 is modestly upregulated in Nr4a1−/− B cells, absolute transcript abundance remains quite low relative to Nr4a3, even after BCR stimulation (Fig. 5a). We therefore hypothesized that loss of Nr4a1 and Nr4a3 gene products (NUR77 and NOR-1 respectively) should eliminate virtually all NR4A function in B cells and reveal any redundancy.
Figure 5. Conditional elimination of NR4A function in B cells reveals cooperative repression of BCR-induced B cell expansion.
A. Purified B cells from Nr4a1+/+ and Nr4a1−/− mice were stimulated for 2 h with 10 μg/mL anti-IgM, and analyzed by RNAseq as described in Fig 1D and methods. Displayed is the FPKM of Nr4a2 and Nr4a3. N=4. B. Purified B cells from WT, Nr4a1−/− and Nr4a3−/− mice were incubated +/− PMA and ionomycin for 2 h. Subsequently whole cell lysates were blotted with Ab to detect NOR-1, MYC, pERK, and GAPDH. Red arrow indicates presence of low abundance truncated NOR-1 protein. C. Representative flow plots show gated splenic Treg cell population in WT, Nr4a1−/−, Nr4a3−/− and Nr4a1−/− x Nr4a3−/− mice, as determined by CD25 expression and intra-cellular staining for Foxp3 in splenic CD4+ T cells. Plots are representative of 5 biological replicates. D. Different genotypes are defined as the following: mb1-cre: mb1-cre mice; Nr4a1cKO: mb1-cre x Nr4a1 fl/fl; cDKO: mb1-cre x Nr4a1fl/fl x Nr4a3−/−. Purified B cells were isolated from whole lymph node via MACs purification, and stimulated for the indicated times with 10 μg/mL anti-IgM. Relative Nr4a2 transcript was determined via qPCR.
E, F. Lymphocytes from CD45.2+ WT, Nr4a1−/−, and Nr4a3−/− mice were each mixed in a 1:1 ratio with CD45.1+ lymphocytes, CTV loaded and co-cultured in the presence of indicated doses of anti-IgM for 72 h. Cells were then stained to detect CD45.1, CD45.2, B220 and CTV via flow cytometry. E. Shown is the ratio of WT, Nr4a1−/− or Nr4a3−/− B cells relative to co-cultured CD45.1+ WT B cells, normalized to the unstimulated condition. F. Graph depicts division index for each genotype. G. An allelic series was generated by crossing Nr4a3−/−, mb1-cre and Nr4a1fl/fl lines to generate mice with a varying number of functional NR4A alleles, as indicated by the legend to the right. Lymphocytes were prepared and co-cultured as described for E, F above. Graph depicts division index plotted for N=1 mouse/genotype and is representative of 3 independent experiments. H-J. Different genotypes are defined as in D, above. Lymphocytes were prepared and co-cultured as described for E, F above. H. Histograms depict CTV dilution as described for B above and are representative of at least 3 mice/genotype. I. Shown is the ratio of each B cell genotype relative to co-cultured CD45.1+ WT B cells, normalized to the unstimulated condition. J. Graph depicts division index for each genotype.
Graphs in this figure depict N=3 biological replicates for all panels except (A) and (G) as noted above. Mean +/− SEM displayed for all graphs. Statistical significance was assessed with two-tailed unpaired student’s t-test without correction (A); two-way ANOVA with Tukey’s (D, E, F, I, J). *p<0.05, **p<0.01, ***p<0.001, ****p<0.0001
To test this hypothesis, we generated a germline deletion of Nr4a3 using CRISPR-mediated NHEJ on the Nr4a1fl/fl genetic background. Two independent founders were selected for further breeding and study. These lines exhibited a 115 bp and 112bp deletion respectively that resulted in a frameshift and premature stop codon (Extended Data Fig. 5f). Although Nr4a3 transcript abundance is unaltered and evades nonsense-mediated decay in Nr4a3−/− B cells (Extended Data Fig. 5g, h), little protein is produced; residual truncated protein expression – detected using a polyclonal antibody raised against aa200-300 of NOR-1 (ab94507) – was minimally inducible and of extremely low abundance (Fig. 5b, Extended Data Fig. 5i). Taken together, this is consistent with highly inefficient initiation of translation from an internal ATG that is downstream of the premature stop codon generated by CRISPR-mediated deletion. To further confirm that this is indeed a complete loss-of-function allele, we generated germline DKO mice lacking both Nr4a1 and Nr4a3, and observed early development of a Scurfy-like disease characterized by growth arrest, skin lesions, enlarged lymph nodes, and a near-complete lack of peripheral Treg cells, as previously described for CD4-cre Nr4a1fl/fl combined with an independently generated Nr4a3−/− line (Fig. 5c)10.
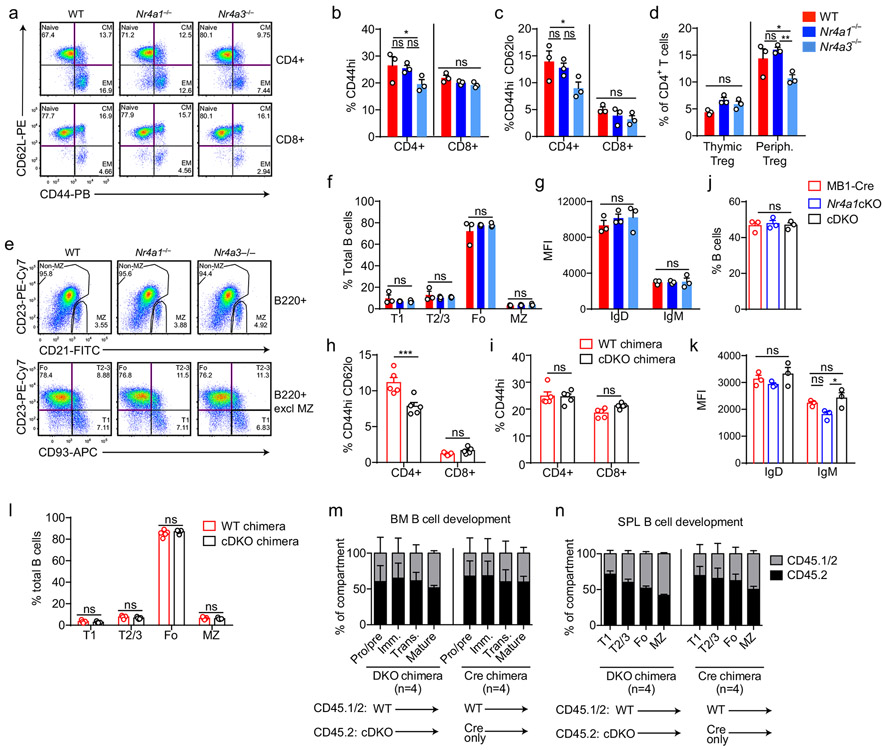
We postulated that by combining the mb1-cre Nr4a1fl/fl model with our new germline Nr4a3−/− mice (herein referred to as cDKO), we could eliminate NR4A function in B cells without provoking systemic inflammatory disease (Fig. 5c)10,15. Although Nr4a3−/− mice exhibit a subtle reduction in peripheral Treg cells, we established that T cell subsets and homeostasis as well as B cell development were unperturbed in Nr4a3−/− animals (Extended Data Fig. 6a-g). Similarly, T and B cell homeostasis was unaffected in cDKO mice and chimeras (Extended Data Fig. 6h-n). Importantly, we identified only modest over-induction of Nr4a2 in cDKO B cells, suggesting that Nr4a2 expression is unlikely to compensate for loss of Nr4a1 and Nr4a3 in the B cell compartment (Fig. 5d). Together, these data suggest that our cDKO model eliminates NR4A function in B cells without disrupting B cell development and immune homeostasis.
NUR77/Nr4a1 and NOR-1/Nr4a3 restrain BCR-induced expansion
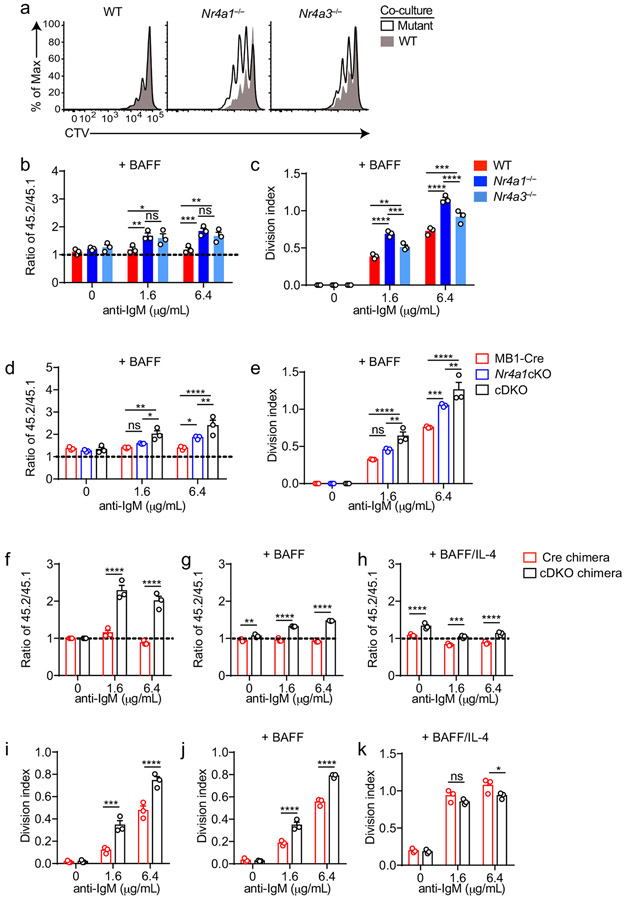
We found that Nr4a3−/− B cells also displayed a competitive survival and proliferative advantage relative to co-cultured wild-type B cells in response to BCR ligation, but it was not as pronounced as the advantage enjoyed by Nr4a1−/− B cells in parallel assays (Fig. 5e,f, Extended Data Fig. 7a-c). We next took advantage of mb1-cre Nr4a1fl/fl (Nr4a1 cKO forthwith) and Nr4a3−/− mice in order to generate an ‘allelic series’ of mice with varying numbers of functional NR4A alleles in the B cell compartment (Fig. 5g-j). We found that BCR-induced survival and proliferation of B cells was enhanced in proportion to the number of deleted NR4A alleles (Fig. 5g-j, Extended Data Fig. 7d, e).
Because Nr4a3 is deleted in the germline in cDKO mice, we wanted to rule out cell-extrinsic contributions to these phenotypes. To do so, we generated competitive chimeras and showed that cDKO B cells indeed exhibit a cell-intrinsic advantage that is lost with the addition of signal 2 (Extended Data Fig. 7f-k). We conclude that Nr4a1 and Nr4a3 play partially redundant roles in restraining survival and proliferation of B cells in response to BCR stimulation in vitro.
The NR4A family restrain expression of BCR-induced target genes
Since proximal BCR signal transduction is unaltered in Nr4a1−/− B cells, we next sought to define transcriptional targets of NUR77 that might account for its negative regulatory role. To do so, we assessed global transcript abundance via RNA-Seq in Nr4a1−/− and Nr4a1+/+ B cells stimulated with anti-IgM for 2 h. We sought to capture the genes regulated by NUR77 at its peak of expression (2-4 h) and to enrich for direct targets of NUR77 by selecting such an early time point. We identified a large number of genes that were significantly differentially expressed (DEGs) between Nr4a1−/− and Nr4a1+/+ B cells after BCR stimulation, but only a small number of these exhibited more than a 30% change in expression (Fig. 6a, Supplementary Data 1).
Figure 6. NUR77/Nr4a1 restrains a subset of BCR-induced primary response genes.
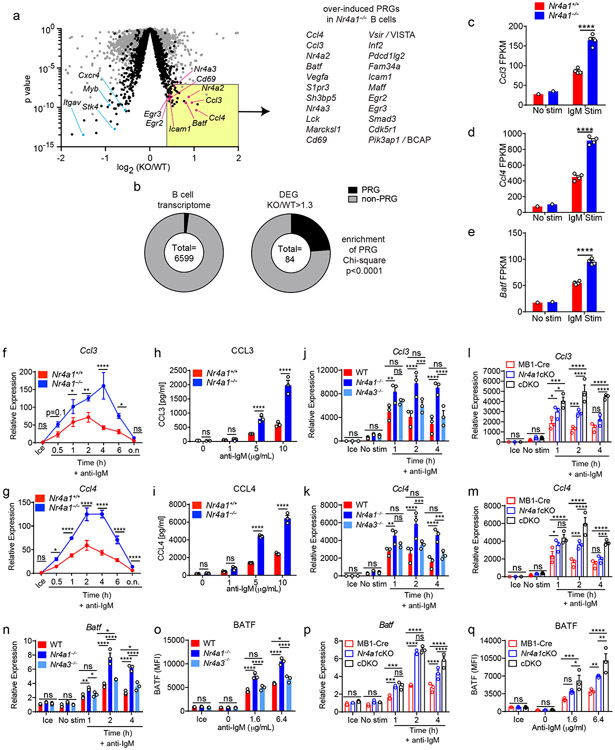
A-E. B cells from Nr4a1+/+ and Nr4a1−/− mice were purified by bench-top negative selection from pooled splenocytes and LNs, stimulated with 10 μg/mL anti-IgM for 2 h, flash frozen and sent to Q2 Solutions for RNA sequencing. N=1 for the unstimulated conditions, and N=4 for the stimulated conditions. A. Differentially expressed genes following 2 h anti-IgM stimulation and associated p values were identified via EdgeR pipeline. Gray points depict p value v log2FC for all genes, while black points depict genes filtered for log2CPM > 4. Gene list depicts all PRGs that are over-induced among Nr4a1−/− B cells relative to Nr4a1+/+ B cells with FC >= 1.3, p-value < 10−7, and log2CPM > 4. For broad identification of both immediate-early and delayed-early genes, PRG here are defined as BCR stim/unstim > 2 after 2 h. For complete list of filtered and unfiltered DEG, see Supplemental Data 1. B. EdgeR output was used to identify DEG with FC>= 1.3 and p value <= 0.05, and log2CPM > 4 was used to filter both B cell transcriptome and DEG list. Reference PRG list was derived from GSE61608 data set (genes induced > 5 fold with BCR stimulation at 2 h). Enrichment of this PRG set among genes that are over-induced in Nr4a1−/− B cells relative to Nr4a1+/+ B cells was plotted and assessed for significance via two-tailed Chi-square test. C-E. Displayed is the FPKM of Ccl3, Ccl4, and Batf. F, G. Lymphocytes from Nr4a1+/+ and Nr4a1−/− mice harboring NUR77-EGFP BAC Tg were stimulated with 10 μg/mL anti-IgM for the indicated times. qPCR was performed to determine relative expression of Ccl3 (G) and Ccl4 (H) transcripts. Samples correspond to those described in Extended Data Fig 5A-C. H, I. B cells from Nr4a1+/+ and Nr4a1−/− mice were purified by bench-top negative selection from pooled splenocytes and LNs, stimulated with given doses of anti-IgM for 48 h, and supernatant was analysed via ELISA to determine concentration of CCL3 (H) and CCL4 (I). J, K. B cells from Nr4a1+/+, Nr4a1−/−, and Nr4a3−/− mice were purified by bench-top negative selection from pooled splenocytes, and were stimulated with 10 μg/mL anti-IgM for the indicated times. qPCR was performed to determine relative expression of Ccl3 (J) and Ccl4 (K) transcripts. L, M. Experiment performed as in J, K except with purified B cells from genotypes: mb1-cre; mb1-cre x Nr4a1 fl/fl (“Nr4a1cKO”); mb1-cre x Nr4a1 fl/fl x Nr4a3−/− (“cDKO”). qPCR was performed to determine relative expression of Ccl3 (L) and Ccl4 (M) transcripts. N. Purified, stimulated B cell samples described in J, K subjected to qPCR to determine relative expression of Batf transcript. O. Lymphocytes were harvested from WT, Nr4a1−/−, and Nr4a3−/− mice, mixed in a 1:1 ratio with CD45.1 WT lymphocytes, and stimulated with the given doses of anti-IgM for 24 hours. Graph depicts MFI of intracellular BATF protein expression in CD45.2 B cells as determined via flow cytometry. P. Purified, stimulated B cell samples described in L, M subjected to qPCR to determine relative expression of Batf transcript. Q. Experiment performed as in (O) except with genotypes listed. Graph depicts MFI of intracellular BATF protein expression in B cells as determined via flow cytometry. Data in this figure depict N=3 biological replicates for all panels except (A-E) as noted above. Mean +/− SEM displayed for all graphs. Statistical significance was assessed using the two-tailed exact test with multiple comparison correction via Benjamini-Hochberg method within the EdgeR pipeline (A), two-tailed Chi-square test (B), two-tailed unpaired student’s t-test with Holm-Sidak (C-I); two-way ANOVA with Tukey’s (J-Q). *p<0.05, **p<0.01, ***p<0.001, ****p<0.0001
A fraction of the naïve B cell transcriptome is rapidly upregulated in response to antigen stimulation3,27. Transcripts that were over-induced in Nr4a1−/− B cells (including Nr4a2 and Nr4a3; Fig. 5a) were highly enriched for such BCR-induced PRGs (Fig. 6b). By contrast, this was not the case for genes that were downregulated in Nr4a1−/− B cells (Supplementary Data 1). This suggests that NUR77 imposes negative feedback regulation downstream of antigen encounter to restrain expression of a subset of PRGs, and we focused our attention on these genes.
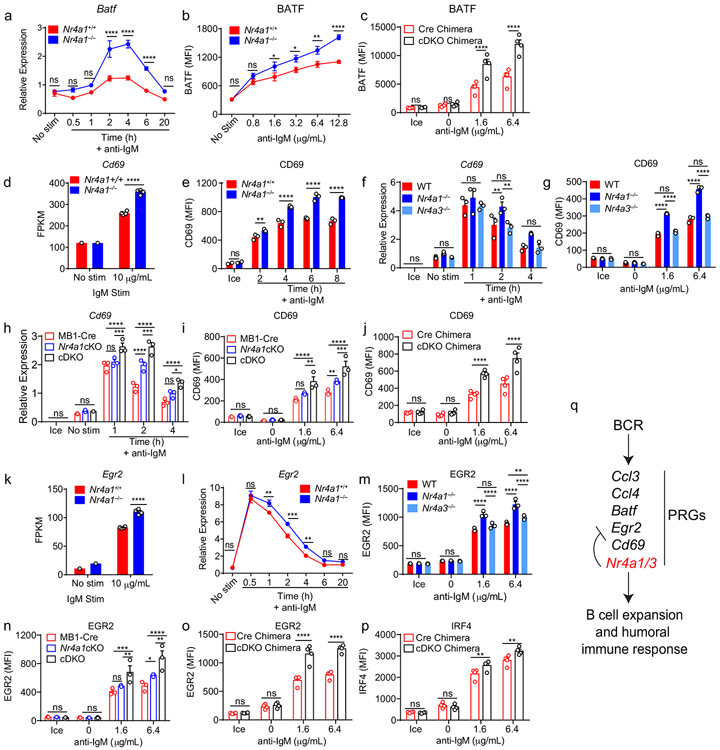
To further prioritize this list for follow-up, we filtered differentially expressed PRGs on the basis of statistical significance and fold change, which served to identify a limited number of genes, many of which are known to play important roles in mediating humoral immune responses (Fig. 6a)2,28-33. Of these, the most differentially induced genes we identified encoded the chemokines CCL3 and CCL4 (also known as MIP-1α,β), and the transcription factor BATF (Fig. 6c-e)31,32,34. We found that expression of Ccl3 and Ccl4 transcripts was rapidly and transiently induced in wild-type B cells, but both the peak and duration of transcript expression was increased markedly in the absence of NUR77 (Fig. 6f,g). This in turn correlated with increased CCL3 and CCL4 chemokine secretion by Nr4a1−/− B cells after 48 h of in vitro BCR stimulation (Fig. 6h,i). By contrast, Nr4a3−/− B cells exhibited minimal change in Ccl3 and Ccl4 transcript induction (Fig. 6j,k). Strikingly, however, cDKO B cells that were deficient for both Nr4a1 and Nr4a3 expression showed a substantial increase in Ccl3 and Ccl4 expression relative to mb1-cre Nr4a1fl/fl (Nr4a1 cKO) B cells, suggesting that NUR77/Nr4a1 and NOR-1/Nr4a3 cooperatively restrain expression of these target genes in B cells (Fig. 6l,m).
Similarly, we found that Batf transcript and protein were overexpressed after BCR stimulation in Nr4a1−/− B cells but not in Nr4a3−/− B cells (Fig. 6n,o, Extended Data Fig. 8a,b). Like Ccl3 and Ccl4, Batf transcript was over-induced in cDKO B cells relative to Nr4a1 cKO B cells at later time points, and this corresponded to over-expression of BATF protein after 24 h of BCR stimulation (Fig. 6p,q). Importantly, we showed that this was reproducible in competitive chimeras as well, confirming B cell intrinsic regulation by the NR4A family (Extended Data Fig. 8c). We also went on to validate Cd69 and Egr2 as NR4A target genes. Similar to Batf, both Cd69 and Egr2 transcript and protein products are over-induced in Nr4a1−/− B cells but not Nr4a3−/− B cells, while cDKO B cells exhibit synergistic and cell-intrinsic over-induction (Fig. Extended Data Fig. 8d-o). By contrast, we found only subtle differences in B cells for Irf4 transcript and protein, a reported transcriptional NUR77 target in CD8 T cells (Supplementary Data 1, Extended Data Fig. 8p)35. Collectively, these data support a model in which Nr4a1 and Nr4a3 are rapidly induced by antigen stimulation and feedback to cooperatively restrain the expression of a small subset of other PRGs that play important roles in orchestrating humoral immune responses.
Negative regulation of MYC by NUR77/Nr4a1 and BATF
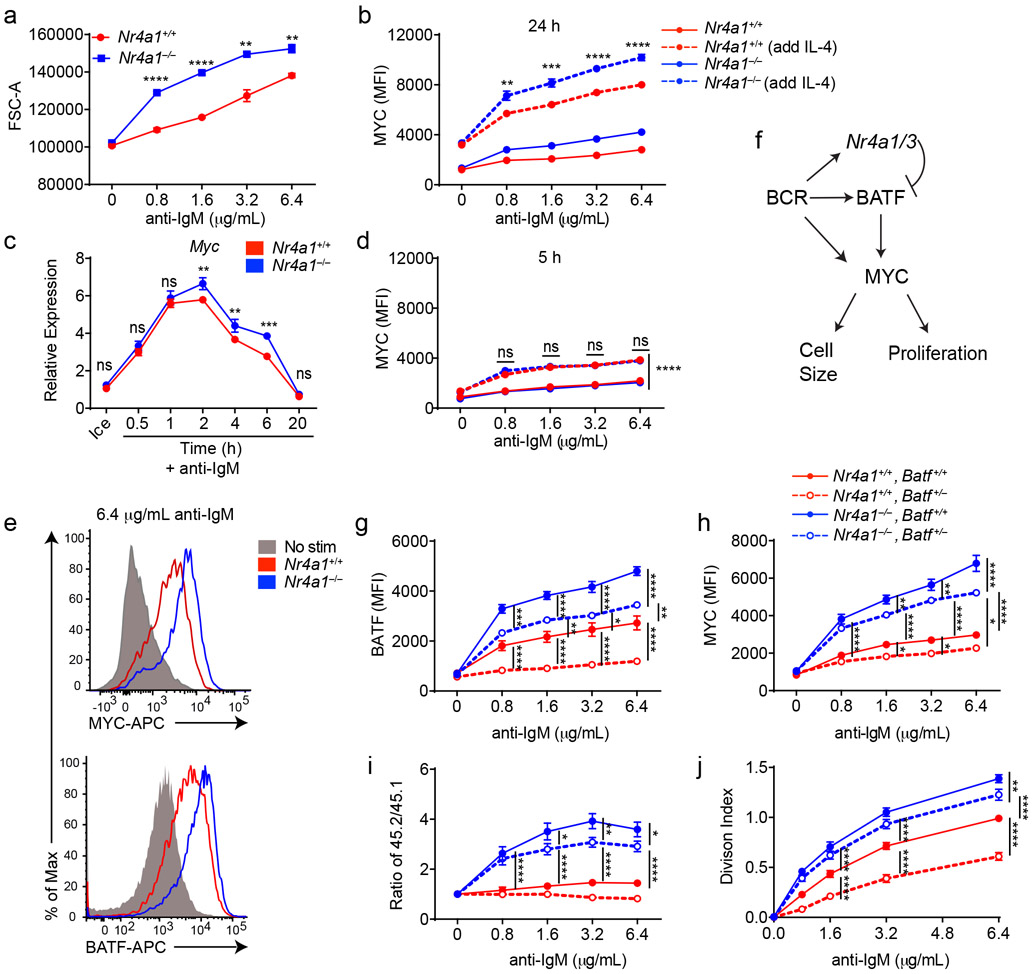
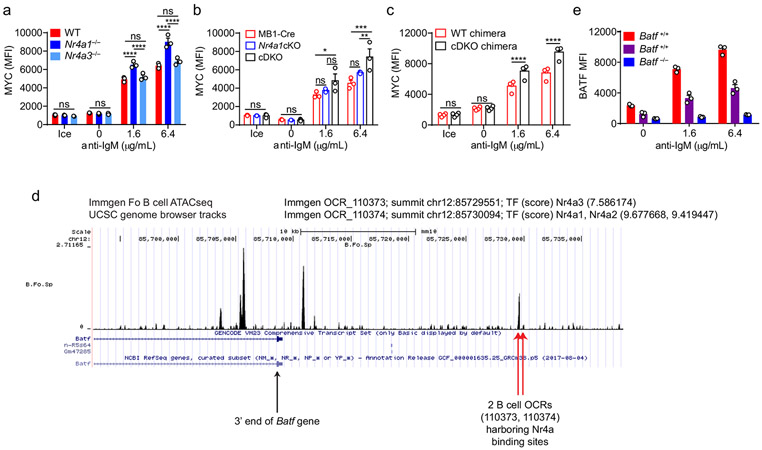
Not only do Nr4a1−/− B cells proliferate more in response to BCR stimulation, but cell size is markedly increased relative to wild-type after 24 h of stimulation. (Fig. 7a). MYC protein levels have been shown to correlate with and direct cell growth, metabolic reprogramming, and proliferative potential of naïve and GC B cells in a dose-dependent manner36-38. Indeed, we found that MYC protein expression is markedly over-induced in BCR-stimulated Nr4a1−/− and cDKO (but not Nr4a3−/−) B cells in a cell-intrinsic manner (Fig. 7b, Extended Data Fig. 9a-c). Moreover, MYC protein is robustly upregulated in both Nr4a1−/− and Nr4a1+/+ B cells with addition of IL-4, and this could help account for how provision of signal 2 might bypass negative regulation by NUR77 (Fig. 7b). Therefore, we hypothesized that negative regulation of MYC contributes to NR4A-dependent repression of B cell proliferation in response to signal 1 in the absence of signal 2. However, over-induction of Myc transcript in Nr4a1−/− B cells after BCR stimulation is subtle at early time points, becoming more marked only by 6 h (Fig. 7c). Similarly, MYC protein over-induction in Nr4a1−/− B cells is only detectable at relatively late time points (24 h) after BCR stimulation (Fig. 7b,d,e). These data suggest that Myc may be an indirect transcriptional target of the NR4A family.
Figure 7. BATF mediates negative regulation of MYC expression and proliferation by NUR77/Nr4a1.
A. Lymphocytes were harvested from Nr4a1+/+ and Nr4a1−/− mice, and stimulated with the given dose of anti-IgM for 72 h. Graph depicts forward scatter (FSC) of total live B cells as determined by flow cytometry. B. Lymphocytes harvested from Nr4a1+/+ and Nr4a1−/− mice were stimulated with the given doses of anti-IgM+/− 10ng/ml IL-4 for 24 h. Graph depicts MFI of intracellular MYC protein expression in B cells as determined via flow cytometry. C. Purified, stimulated B cell samples (described in Extended Data Fig 5A-C and Fig. 6F, G) were subjected to qPCR to determine relative expression of Myc transcript. D. Experiment performed as in (B) except lymphocytes were stimulated for only 6 h. Graph depicts MFI of intracellular MYC protein expression in B cells as determined via flow cytometry. E. Representative histograms depict intracellular MYC and BATF protein expression in gated LN B cells from Nr4a1+/+ and Nr4a1−/− mice after 24 h stimulation with 6.4 μg/mL anti-IgM. Samples are overlaid onto unstimulated B cells (gray shaded histograms) for reference. F. Working model: BCR stimulation drives expression of PRGs including Nr4a1/3, Batf, and Myc. MYC promotes a broad gene expression program that is required for cell growth and proliferation. Since BATF has been shown to act as a positive regulator of MYC, we propose that Nr4a1/3 gene products restrain BATF and thereby indirectly function as negative regulators of MYC and B cell expansion. G-J. Lymphocytes harvested from Nr4a1+/+ and Nr4a1−/− mice expressing either 1 or 2 copies of Batf (genotypes as shown in legend) were each mixed in a 1:1 ratio with CD45.1+ lymphocytes, +/− CTV loading, and co-cultured in the presence of indicated doses of anti-IgM for either 24 h (G, H) or 72 h (I, J). G, H. Graphs depict MFI of either intra-cellular BATF (G) or MYC (H) protein expression in CD45.2 B cells. N=3 biological replicates representative of 3 independent experiments. I, J. Cells were stained to detect CD45.1, CD45.2, B220 and CTV via flow cytometry. N=9 biological replicates pooled from 3 independent experiments. I. Shown is the ratio of each CD45.2+ B cells of each genotype relative to co-cultured CD45.1+ WT B cells, normalized to the unstimulated condition. J. Graph depicts division index for each genotype. Data in this figure depict N=3 biological replicates for all panels except I, J as anoted above which include N=9 biological replicates pooled from 3 independent experiments. Mean +/− SEM displayed for all graphs. Statistical significance was assessed with two-tailed unpaired student’s t-test with Holm-Sidak (A, C); two-way ANOVA with Tukey’s (B, D, G-J). *p<0.05, **p<0.01, ***p<0.001, ****p<0.0001
By contrast to MYC, the AP-1 family member BATF is the most robustly upregulated transcription factor in Nr4a1-deficient B cells at early time points (2 h) after BCR stimulation. We identified consensus NR4A-binding motifs in regions of open chromatin (OCR; i.e. putative cis-regulatory elements) 20 kB downstream of Batf in mature follicular B cells (ImmGen ATAC-seq data; Extended Data Fig. 9d), suggesting that Batf may be a direct transcriptional target of NR4A family. Since BATF can cooperate with IRF4 to induce Myc expression39, and Batf-deficient B cells exhibit defective clonal expansion40, we hypothesized that NUR77 regulates MYC in part via modulation of BATF (see model, Fig. 7f). To test this hypothesis, we sought to rescue BATF over-induction in NUR77-deficient B cells by generating Nr4a1−/− Batf+/− mice. We found, as expected, that hemizygosity for Batf reduced expression by approximately 50% and resulted in a near-normalization of BATF protein expression in Nr4a1-deficient B cells after BCR stimulation (Fig. 7g, Extended Data Fig. 9e). As predicted by our model (Fig. 7f), MYC over-induction was partially rescued (Fig. 7h). Across genotypes, we observed a correlation between BATF and MYC expression, and B cell proliferation (Fig. 7g-j). These data suggest that NUR77 represses MYC in part via repression of BATF, but other mechanisms may also contribute to enhanced proliferation of Nr4a1−/− B cells.
NUR77 limits B cell responses when T cell help is limiting
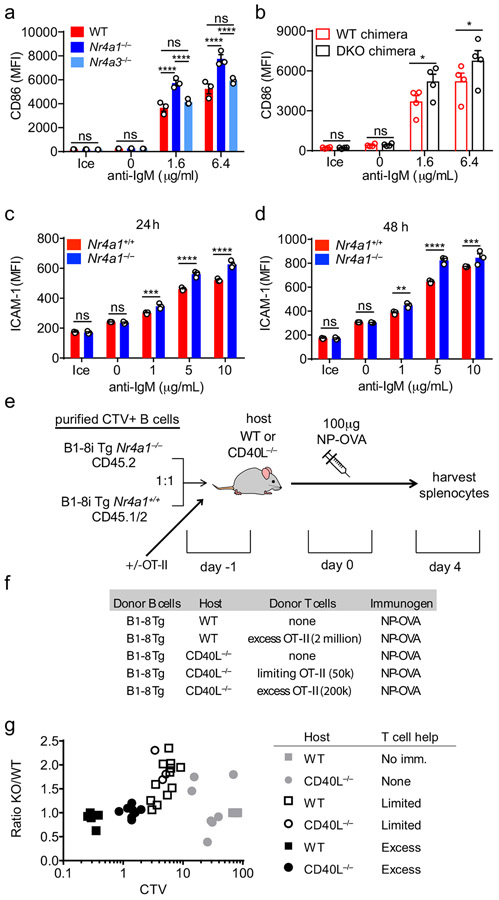
Although we identified a role for the NR4A family restraining B cell expansion in response to BCR stimulation (signal 1) without co-stimulation (signal 2), the most differentially induced genes in Nr4a1−/− B cells were Ccl3 and Ccl4, which encode chemokines that serve to recruit T cell help via CCR532,34. In addition, RNAseq analysis identified additional putative NUR77 target genes that are well-recognized to facilitate engagement of T cell help for B cells, including Cd86 and Icam12,28. CD86 protein is over-induced in the absence of Nr4a1 but not Nr4a3, and this is recapitulated in cDKO B cells in a cell-intrinsic manner (Extended Data Fig. 10a,b). Similarly, ICAM1 is over-induced in Ag-stimulated Nr4a1−/− B cells (Extended Data Fig. 10c,d). Collectively, these data suggested that the NR4A family may play a role in T-dependent immune responses.
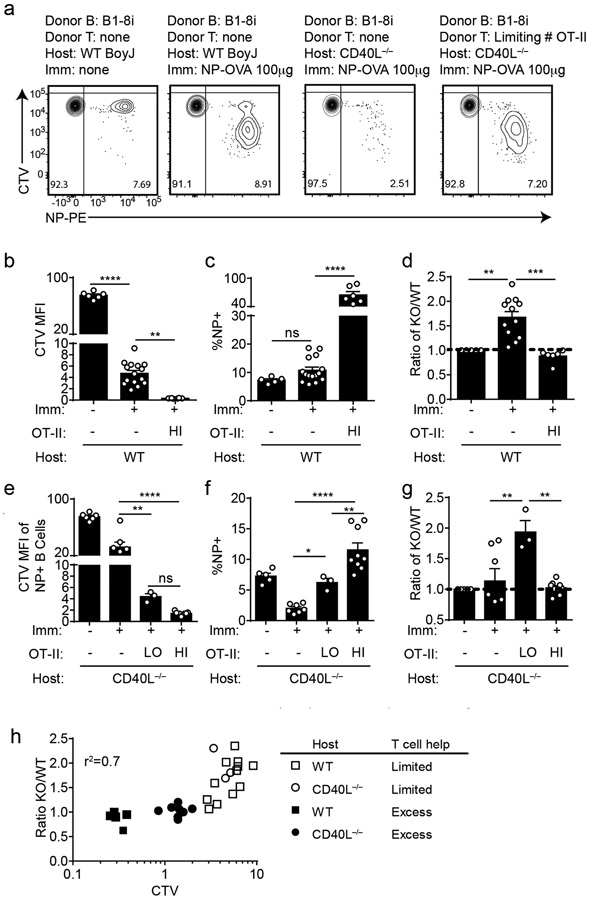
Although NUR77/Nr4a1 expression did not influence B cell responses to co-stimulatory signals in vitro and in vivo, we reasoned that access to T cell help (signal 2) in these assays was not limiting. We hypothesized that Nr4a1-deficient B cells might exhibit a competitive advantage in the context of a limiting supply of T cell help. To test this hypothesis, we undertook adoptive transfer of Ag-specific Nr4a1+/+ or Nr4a1−/− B cells harboring the B1-8i HC Tg. By co-transferring varying numbers of OVA-specific OTII splenocytes in conjunction with donor B cells into either wild-type or CD40L−/− hosts, we could manipulate the supply of Ag-specific T cell help (Extended Data Fig. 10d,e). As expected, we observed a profound defect in Ag-specific B cell proliferation in CD40L−/− hosts that could be rescued with adoptive transfer of Ag-specific T cells (Fig. 8a).
Figure 8. NUR77/Nr4a1 restrains B cell competition for T cell help under limiting conditions.
B cells were purified from splenocytes harvested from Nr4a1+/+ B1-8 Tg CD45.1/2+ and Nr4a1−/− B1-8 Tg CD45.2+ mice via bench-top negative selection, mixed 1:1, and loaded with CTV. 2x10⁶-3x10⁶ B cells were then adoptively transferred +/− OTII splenocytes into either WT or CD40L−/− hosts. Host mice were then immunized IP one day later with 100 μg NP-OVA/alum, followed by spleen harvest on d4. Schematic of experimental design is depicted in Extended Data Fig. 10A, B.
A. Representative flow plots gated on total donor B cells depict CTV dilution among NP-binding B cell under varied conditions. B-D. Adoptive transfers into WT hosts were performed as described above. Mice which excess T cell help (OTII: “HI”) received donor B cells co-transferred with 2x10⁶ OTII splenocytes Graphs depict CTV dilution among donor NP-binding B cells (B), expansion of NP-binding donor B cells (C), and ratio of Nr4a1−/− relative to Nr4a1+/+ donor NP-binding B cells normalized to the ratio in unimmunized hosts (D). N=5 unimmunized recipients, N=13 hosts that received only donor B cells, and N=6 hosts that received donor B cells mixed with excess OTII, pooled from a total of 3 independent experiments. E-G. Adoptive transfers into CD40L−/− hosts were performed as described above. Mice which received limited T cell help (OTII: “LO”) received donor B cells co-transferred co-transferred with 5x10⁴ splenocytes harvested from OTII mice, and mice which received excess T cell help (OTII: “HI”) received donor B cells co-transferred co-transferred with 2x10⁵ splenocytes. Graphs depict CTV dilution among donor NP-binding B cells (E), expansion of NP-binding donor B cells (F), and ratio of Nr4a1−/− relative to Nr4a1+/+ donor NP-binding B cells normalized to the ratio in unimmunized hosts (G). N=5 unimmunized recipients, N= 7 hosts that received B1-8 donor B cells only, N=3 hosts that received limited T cell help, and N=9 hosts that received excess OTII T cells, pooled from 3 independent experiments. H. Graph depicts correlation between ratio of Nr4a1−/− relative to Nr4a1+/+ donor NP-binding B cells (as plotted in D, G above) and CTV dilution of NP-binding donor B cells in individual recipients (as a proxy measure of T cell help). Mean +/− SEM displayed for all graphs. Biological replicates as described above. Statistical significance was assessed with one-way ANOVA with Tukey’s (B-D) or Sidak (E-G); Pearson correlation coefficient (H). *p<0.05, **p<0.01, ***p<0.001, ****p<0.0001
Although we observed robust vital dye dilution and expansion of adoptively transferred Ag-specific B cells in wild-type hosts after immunization with NP-OVA, this response increased dramatically with provision of excess T cell help, suggesting that endogenous OVA-specific T cells are limiting (Fig. 8b,c). Indeed, we observed a striking competitive advantage for Nr4a1−/− NP-specific donor B cells in immunized wild-type hosts that was completely lost with provision of excess T cell help (Fig. 8d). We next sought to reproduce this finding in CD40L−/− mice where endogenous T cell help is defective (Fig. 8a). Upon transfer of either no, limiting, or excess numbers of OTII splenocytes into CD40L−/− hosts, the amplitude of donor B cell expansion scaled with the amount of Ag-specific T cell help (Fig. 8e,f). Again, we observed a clear competitive advantage for antigen specific Nr4a1−/− B cells specifically under conditions where T cell help is limiting, that is lost with provision of excess T cell help (Fig. 8g).
Finally, we took advantage of heterogeneity in the amplitude of B cell responses in individual host mice to look for a correlation between the supply of T cell help and any competitive advantage enjoyed by Nr4a1−/− B cells. To do so, we used vital dye dilution of Ag-specific donor B cells in individual hosts as a proxy measure of the supply of T cell help. Indeed, we identified a clear inverse correlation (r2 = 0.7) between the supply of T cell help and competitive fitness of Ag-specific Nr4a1−/− donor B cells (Fig. 8h, Extended Data Fig. 10g). These data suggest that NUR77 mediates a negative feedback loop downstream of antigen stimulation, and may play a role not only in T-independent responses, but also in T-dependent immune responses, specifically in competitive settings where T cell help is limiting.
DISCUSSION
Co-stimulatory signals must be received within a limited span of time in order to divert Ag-stimulated B cells from apoptosis/anergy, but there is a physiologic delay between initial antigen encounter by B cells and acquisition of T cell help4,5. Recent work described gradual accumulation of intracellular calcium in Ag-activated B cells accompanied by progressive mitochondrial dysfunction and loss of glycolytic capacity5. This process may serve as a molecular timer that imposes a “point of no return” after which B cells can no longer be rescued from apoptosis by co-stimulation5. Our data suggest that induction of NR4A gene expression represents a novel molecular strategy that limits B cell responses to antigen, and helps to enforce dependence upon co-stimulation. We hypothesize that the balance between NR4A-mediated apoptosis and pro-survival signals generated by BCR ligation may help to modulate the time window within which T cell help must be engaged to avoid a terminal fate. Consistent with such a model, Nr4a1−/− B cells exhibit an advantage relative to wild-type B cells when co-stimulatory signals are delayed.
Since the initial increase in the glycolytic capacity of Ag-activated B cells depends on MYC induction, we propose that the NR4A family may also contribute to a gradual loss in glycolytic capacity and metabolic dysfunction over time by suppressing MYC induction37. Conversely, upregulation of MYC by co-stimulation may help explain how second signals circumvent the inhibitory effects of the NR4A family. Additional mechanisms may also contribute to this phenomenon; post-translational modifications triggered by antigen and/or co-stimulatory signals could regulate subcellular localization or protein-binding interactions of NR4A family members to influence downstream effector functions such as apoptosis or target gene transcription6,41-43.
Several NR4A target genes play a specific role in T cell–B cell interactions. Most notably, secretion of the chemokines CCL3 and CCL4 (MIP-1α, β) by B cells can induce migration of activated T cells via CCR532,34. CD86 is a ligand for CD28 and has a very well-established role in T cell co-stimulation, while ICAM1 and 2 facilitate T-B conjugate formation during T-dependent immune responses and are critical for efficient B cell expansion in this context2,28. CD69 functions to promote retention of activated lymphocytes in secondary lymphoid organs via negative regulation of S1P1, and thereby facilitates cognate T:B interactions29.
Other important mediators of the humoral immune response are also regulated by the NR4A family. Although the zinc finger TFs EGR2 and EGR3 have tolerogenic and regulatory functions in the setting of chronic antigen stimulation, like EGR1, they are also important for proliferation in response to acute antigen stimulation30. BATF heterodimerizes with JUN to bind cooperatively with IRF4 at so-called AP-1-IRF4 composite elements (AICE)44,45, and as a result, BATF plays pleiotropic roles as a transcriptional regulator in immune cells31,40,46.
Importantly, we also identified a subset of genes that are downregulated in Nr4a1−/− B cells. Although these targets are not enriched for PRGs, they may nevertheless be functionally relevant. For example, the TF c-MYB is important for B cell development and for BAFF-dependent B cell survival47. This and other NR4A targets will be important to explore in future studies.
Since NR4A expression scales with the intensity of antigen stimulation, we predict that the NR4A family may disproportionately restrain the most strongly Ag-activated B cell clones in a polyclonal repertoire. Indeed, although B cell clones compete for clonal dominance and limited resources (T cell help) during the primary immune response48, low-affinity B cell clones do enter (and persist in) the germinal center49, suggesting that some physiological mechanism must exist to restrain high affinity B cell clones from completely monopolizing T cell help49. Future work will test the hypothesis that the NR4A family may serve to limit immunodominance and preserve clonal diversity during evolving humoral immune responses.
Our data suggests that the NR4A family imposes a novel negative feedback loop downstream of antigen stimulation that renders B cells highly dependent upon co-stimulatory input, and restrains strongly activated B cells from monopolizing limiting quantities of T cell help. Although no endogenous ligand has been identified for the NR4A family, small molecule agonist and antagonist ligands for NUR77/Nr4a1 have been described50,51. One could envision treating B cell-mediated autoimmune disease with a selective NUR77 agonist. Conversely, an antagonist compound could boost T-independent B cell responses and serve as a novel ‘universal adjuvant’. Our work identifies a molecular mechanism by which both self- and foreign-reactive B cells are regulated and may be therapeutically manipulated.
METHODS
Mice.
NUR77-EGFP and IgHEL (MD4) mice were previously described17,52. Nr4a1fl/fl mice were generously shared by P. Chambon, University of Strasbourg and C. Hedrick, La Jolla Institute for Immunology10. Mb1-cre, CD21-cre, OT-II, Cd40L−/−, Nr4a1−/−, B1-8i, Batf−/−, C57BL/6, and CD45.1+ BoyJ mice were from The Jackson Laboratory 22-25,46,53,54. Tcra−/− were obtained from A. Weiss (UCSF)55. Nr4a3−/− mice were generated via electroporation of gRNA and Cas9 mRNA. In brief, Cas9 protein (40μM) and Nr4a3 gRNAs (80 μM) were mixed and electroporated into C57BL/6 Nr4a1fl/+ zygotes. Nr4a3 exon 3 (containing start ATG) was targeted for deletion. 15 founder lines with the targeted deletion were identified through a screen for PCR amplicon size, and confirmed via sequencing of cloned PCR products. Two founder lines (#2, #3) harboring a 115 bp and 112 bp deletion, respectively, that resulted in a frameshift and premature stop codon were chosen for further analysis. These lines were backcrossed for at least 4 generations onto the C57BL/6J genetic background. Fig. 5b,c and chimera experiments included in the manuscript used line # 3. All other experiments involving Nr4a3−/− and cDKO mice used both lines #2 and #3. All other strains were fully backcrossed to the C57BL/6J genetic background for at least 6 generations. Mice of both sexes were used for experiments between ages of 6-10 weeks. All mice were housed in a specific pathogen-free facility at UCSF according to University and National Institutes of Health guidelines.
Antibodies and Reagents.
Antibodies for surface markers:
Streptavidin (SA) and antibodies to B220 (RA3-6B2), BAFFR/CD268 (eBio7H22-E16), CD3 (17A2), CD4 (RM4-5 or GK1.5), CD8 (53-6.7), CD19 (1D3), CD21 (7G6), CD23 (B3B4), CD86 (GL-1), CD62L (MEL-14), CD69 (H1.2F3), CD93 (AA4.1), CD44 (IM7), CD45.1 (A20), CD45.2 (104), IgM (II/41), IgD (11-26c), Igλ1 (R11-153) conjugated to biotin or fluorophores (BioLegend, eBiosciences, BD, or Tonbo); NP(23)-PE (LGC Biosearch Technologies).
Intra-cellular FOXP3 staining:
FOXP3/Transcription factor staining buffer set (ebioscience), FOXP3 antibody conjugated to APC (clone FJK-16s) manufactured by Invitrogen.
Antibodies for intra-cellular staining:
anti-BATF (clone C7D5), anti-pERK (clone 194g2) and anti-pS6 (clone 2F9), were from Cell Signaling Technologies; anti-NUR77 conjugated to PE (clone 12.14) and anti-EGR2 conjugated to PE (clone erongr2) manufactured by Invitrogen, purchased from eBioscience; anti-MYC (clone D84C12, Cell Signaling); anti-activated caspase-3 conjugated to APC (clone C92-605) purchased from BD Pharmingen; anti-IRF4 conjugated to PE (clone 3E4) was from eBioscience; Donkey anti-rabbit secondary antibody conjugated to APC was from Jackson Immunoresearch.
Antibodies for immunoblots:
anti-MYC (clone D84C12), anti-pERK (Thr202/Tyr204), (clone 197G2), and anti-GAPDH (14C10) were from Cell Signaling; anti-NOR-1 (cat# ab94507) was from Abcam; anti-NUR77 (cat# 554088, clone 12.14) was from BD Pharmingen. Anti-mouse- and anti-rabbit- HRP secondary antibodies were from Southern Biotech.
Stimulatory Antibodies:
Goat anti-mouse IgM F(ab’)2 was from Jackson Immunoresearch; Stimulatory anti-IgD was from MD Biosciences; Murine IL-4 (Peprotech), anti-CD40 (hm40-3 clone; BD Pharmingen), recombinant murine BAFF (R&D), LPS (O26:B6; Sigma), CpG (ODN 1826; InvivoGen).
ELISA reagents:
Costar Assay Plate, 96 Well Clear, Flat bottom half area high binding, polystyrene (Corning); SA-HRP, anti-mouse IgM, anti-mouse IgG1 and anti-mouse IgG3 antibodies conjugated to HRP (Southern Biotech); TMB (Sigma); NP(1)-RSA and NP(29)-BSA (Biosearch); CCL3 and CCL4 ELISAs were performing using the Duoset kit from R&D systems: ancillary reagent kit 2 (cat #:DY008), Mouse CCL3 MIP-1α DuoSet ELISA (R&D #DY450-05), Mouse CCL4 MIP-1β DuoSet ELISA (R&D #DY451).
Immunogens:
NP(53)-Ficoll, NP(17)-OVA, NP(0.3)-LPS and NP(29)-KLH were from Biosearch; Alhydrogel 1% adjuvant (Accurate Chemical and Scientific Corp).
Other:
Recombinant HEL, HEL-2X (R73E, D101R), HEL-3X (R73E, D101R, R21Q) proteins were a gift from W. Cheng, University of Michigan56. Complete culture media was prepared with RPMI-1640 + L-glutamine (Corning-Gibco), Penicillin Streptomycin L-glutamine (Life Technologies), 10 mM HEPES buffer pH7.2-7.5 (Life Technologies), 55 mM β-mercaptoethanol (Gibco), I mM sodium pyruvate [ (Life Technologies), Non-essential Amino acids (Life Technologies), 10% heat inactivated FBS (Omega Scientific).
Flow Cytometry and data analysis.
After staining, cells were analyzed on a Fortessa (Becton Dickinson). Data analysis was performed using FlowJo (v9.9.6 and v10) software (Treestar Inc.). Proliferative indices ‘division index’ and ‘% divided’ were calculated using FlowJo. Statistical analysis and graphs were generated using Prism v6 (GraphPad Software, Inc). Statistical tests used throughout are listed at the end of each figure legend. Student’s unpaired T test was used to calculate p values for all comparisons of two groups, and correction for multiple comparisons across time points or doses was then performed using Holm-Sidak method. One-way or two-way ANOVA with follow-up Tukey’s, Dunnett’s, or Sidak tests were performed when more than two groups were compared to one another. Mean ± SEM is displayed in all graphs. Statistical analysis of RNAseq data is described separately below. Throughout figures: *p<0.05, **p<0.01, ***p<0.001, ****p<0.0001.
Intracellular staining to detect pERK, pS6, NUR77, MYC, BATF, EGR2, IRF4, and activated Caspase 3.
Either immediately ex vivo or following in vitro stimulation, cells were fixed in a final concentration of 2% paraformaldehyde for 10 min, permeabilized on ice with 100% methanol for 30 min (or −20 °C overnight), and following washes and rehydration were then stained with primary antibody followed by lineage markers and secondary antibodies if needed for 40 min at 20°C.
FOXP3 staining.
FOXP3 staining was performed utilizing a FOXP3/transcription factor buffer set (eBioscience) in conjunction with an APC anti-FOXP3 antibody (eBioscience), as per manufacturer’s instructions.
Intracellular Calcium Flux.
Cells were loaded with 5 μg/mL Indo-1 AM (Life Technologies) and stained with lineage markers for 15 min. Cells were rested at 37 °C for 2 min, and Indo-1 fluorescence was measured by FACS immediately prior to and after stimulation to determine intracellular calcium.
Live/dead staining.
LIVE/DEAD Fixable Near-IR Dead Cell Stain kit (Invitrogen). Reagent was reconstituted as per manufacturer’s instructions, diluted 1:1000 in PBS, and cells were stained at a concentration of 2×10⁶ cells /100 μL on ice for 10 min.
Vital dye loading.
Cells were loaded with CellTrace Violet (CTV; Invitrogen) per the manufacturer’s instructions except at 5×10⁶ cells/ml rather than 1×10⁶ cells/ml.
In Vitro B Cell Culture and Stimulation.
Splenocytes or lymphocytes were harvested into single cell suspension, subjected to red cell lysis using ACK (ammonium chloride potassium) buffer in the case of splenocytes, +/− CTV loading as described above, and plated at a concentration of 2-5×10⁵ cells/200 μL in round bottom 96 well plates in complete RPMI media with stimuli for 1-3 days. In vitro cultured cells were stained to exclude dead cells as above in addition to surface or intra-cellular markers for analysis by flow cytometry depending on assay.
Immunoblot analysis.
Thymocytes and purified splenic/LN B cells (protocol described below) were harvested from mice, and stimulated in complete media +/− PMA/ionomycin for 2 h at 37 °C. Following stimulation, cells were lysed with 1% NP40, and centrifuged for 15 min at 20,000g to remove cellular debris. The supernatants were denatured at 95°C for 5 min in SDS sample buffer with 2.5% β-ME. Lysates were run on Tris-Bis (pH 6.4) thick gradient (4%-12%) gels (Invitrogen), and transferred to PVDF membranes with a Mini-Protean Tetra cell (Bio-rad). Membranes were blocked for 1 h with 3% skim milk in Tris buffered saline with Tween 20 (pH 7.6), and then probed with primary antibodies listed above, overnight at 4 °C. The next day, membranes were incubated with HRP-conjugated secondary antibodies. Blots were developed utilizing a chemiluminescent substrate (Western Lightning Plus ECL, Perkin Elmer), and visualized with a Chemi-doc Touch imager (Bio-Rad).
Immunizations.
Mice were immunized via I.P injection of 200 μL of immunogen diluted in PBS. For T-dependent immunizations, NIP(24)-KLH, NP(17)-OVA, or NP(29)-KLH (LGC Biosearch Technologies) either 10 μg or 100 μg was diluted in PBS, and emulsified in Alhydrogel 1% adjuvant (Accurate Chemical and Scientific Corp.). For NP-Ficoll immunization, 100 μg NP(53)-Ficoll (Biosearch) was diluted in PBS. For NP-LPS immunization, 100 μg NP(0.6)-LPS (Biosearch) was diluted in PBS. For GC analysis, mice were sacrificed 7 days after immunization, and spleens were harvested for analysis via flow cytometry. For serum antibody titers, mice were bled prior to immunization, and then serially every seven days for either 21- or 28-days total, and titers were determined via ELISA as described below. Adoptive transfer assays are described further below.
B cell purification.
B cell purification was performed utilizing MACS separation per manufacturer’s instructions. In short, pooled spleen and/or lymph nodes were prepared utilizing the B cell isolation kit (Miltenyi), and purified by negative selection through an LS column (Miltenyi). Processed samples were then subjected to either RNA preparation, immunoblot, in vitro culture, or adoptive transfer.
ELISA for CCL3/CCL4 detection.
Supernatants from in vitro cultured purified splenic/LN B cells plated at 5×10⁵ cells/200 μL were harvested after 48 h and CCL3, CCL4 concentration was measured in supernatants using commercial ELISA kit per manufacturer’s instructions (R&D biosystems).
ELISA for serum Antibody titer.
Serum antibody titers for anti-NP IgM, IgG3 and IgG1 were measured by ELISA. For anti-NP IgM, IgG3, and low affinity anti-NP IgG1 96-well plates (Costar) were coated with 1 μg/mL NP(29)-BSA (Biosearch). For high affinity anti-NP IgG1, 96-well plates (Costar) were coated with 1μg/mL NP(1)-BSA (Biosearch). Sera were diluted serially, and total antigen specific titer was detected with a corresponding anti-Ig-HRP (Southern Biotech). All ELISA plates were developed with TMB (Sigma) and stopped with 1N sulfuric acid. Absorbance was measured at 450 nm using spectrophotometer (Spectramax M5, Molecular Devices).
Bone marrow chimeras.
Host mice were irradiated with 530 rads x 2, 4 h apart, and injected IV with 106 donor A mixed with 106 donor B BM cells to generate competitive chimeras or with 2×10⁶ donor BM cells independently to generate unmixed chimeras. Chimeras were sacrificed 10-12 weeks after irradiation, and cells were assayed ex vivo by flow staining to assess lymphocyte development, or after in vitro stimulation as described above to assay protein expression and proliferation as described above.
Adoptive transfer experiments.
In order to study T-dependent responses, splenocytes and lymphocytes from CD45.2 Nr4a1−/− B1-8i Tg and CD45.1/2 Nr4a1+/+ B1-8i Tg mice were harvested into single cell suspensions, subjected to red blood cell lysis with ACK buffer and mixed in a 1:1 ratio. B cells were then purified by negative selection and loaded with CTV vital dye as described above. 2-3×10⁶ cells in 200 μL total volume were injected into each host via the tail vein (+/− varying numbers of OT-II splenocytes as noted in figures). One day post-transfer, hosts were either immunized IP with 100 μg NP(17)-ova / alum (1:1) or left unimmunized. After 4 days, hosts splenocytes were harvested and analyzed by flow cytometry to detect donor B cells, NP-binding, and CTV dilution. Alternatively, to study NUR77-eGFP induction in vivo, B1-8i reporter splenocytes were loaded directly with vital dye and 4-5×10⁶ splenocytes were adoptively transferred into CD45.1+ hosts. Mice were then immunized IP with 100 μg NIP(24)-KLH mixed 1:1 with alum, and host spleen was harvested for FACS analysis after 3 days.
qPCR.
Either total lymphocytes or MACS-purified B cells were cultured at 37 °C with varying stimuli, and harvested into Trizol (Invitrogen), and stored at −80 °C. RNA was extracted via phenol phase separation. cDNA was prepared with Superscript III kit (Invitrogen). qPCR reactions were run on a QuantStudio 12K Flex thermal cycler (ABI) using SYBR Green detection with primer sets as follows: Batf : F, 5’-CACAGAAAGCCGACACCCTT-3’; R, 5’-GCTGTTTGATCTCTTTGCGGA-3’; Ccl3: F, 5’-ACCATGACACTCTGCAACCA-3’; R, 5’-CGATGAATTGGCGTGGAATCT-3’; Ccl4: F, 5’-CAAACCTAACCCCGAGCAAC-3’; R, 5’-AGAAACAGCAGGAAGTGGGA-3’; Cd69: F, 5’-AGCTCTTCACATCTGGAGAGAG-3’; R, 5’-CCACTATTAACACAGCCCAAGG-3’; Egr2: F, 5’-TTGACCAGATGAACGGAGTG-3’; R, 5’-CAGAGATGGGAGCGAAGCTA-3’; Gfp: F, 5’-CACATGAAGCAGCACGACTT-3’; R, 5’-TCCTTGAAGTCGATGCCCTT-3’; Myc: F, 5’-TGAAGTTCACGTTGAGGGG-3’; R, 5’-AGAGCTCCTCGAGCTGTTTG-3’; Nr4a1: F, 5’-GCCTAGCACTGCCAAATTG-3’; R, 5’-GGAACCAGAGAGCAAGTCAT-3’ k; Nr4a2: F, 5’-TGAATGAAGAGAGCGGACAA-3’; R, 5’-TGTCGTAATTCAGCGAAGGA-3’; Nr4a3: F, 5’-AAACTTGCAGAGCCTGAACC-3’; R, 5’-CTGGTGGTCCTTTAAGCTGC-3’. Data were normalized within each sample to Gapdh and further normalized to the unstimulated ice sample in each graph using the ddCT method.
RNA sequencing and bioinformatics:
Sample preparation, RNA sequencing, and data processing:
Single cell suspensions were generated from pooled splenocytes and lymphocytes as described above. B cells were purified via negative selection using MACS kit (Miltenyi Biotech), following the manufacturer’s instructions. B cells were stimulated ± anti-IgM F(ab)’2 (10 μg/ml) for 2 h, and subsequently pelleted via centrifugation, supernatant was removed, and the pellet was frozen at −80 °C. Quadruplicate biological replicate samples of stimulated Nr4a1+/+ and Nr4a1−/− B cells were then sent to Q2 Solutions commercial laboratory for RNA preparation, sequencing and analysis. In brief, RNA samples were converted into cDNA libraries with the Illumina TruSeq Stranded mRNA sample preparation kit, and then sequenced on an Illumina sequencing platform. After sequencing, QC analysis and gene and isoform quantification was performed according to the Q2 solutions in-house RNAv9 pipeline. After QC analysis, samples were aligned using STAR software version 2.4 and quantification of FPKM was performed using RSEM version 1.2.14. Fastq and RSEM FPKM data are publicly available (GEO accession number GSE146747). Supplemental Data 1 contains filtered gene list (average FPKM > 10 in BCR-stimulated wild-type samples and FPKM > 0 in all samples). EdgeR platform was used to identify genes that are differentially expressed (DEG) between wild-type and Nr4a1−/− B cells after 2 h stimulation, and output is provided in Supplemental Data 1.
Statistical analysis for PRG enrichment:
To identify Ag-induced B cell primary response genes (PRG) with statistical robustness, a reference data set of PRG was extracted from publicly available RNA-seq data generated following 2hr anti-IgM stimulation of primary mouse B cells (GEO accession number GSE61608)27. Statistically significant PRG (>5 fold upregulated by BCR stimulation) were identified using Cufflinks/Cuffdiff suite v1.3.1 (GSE61608_Differential_Expression_summary.txt).
B cell ATAC-seq analysis:
Publicly available follicular mature B cell ATAC-seq data (Immgen.org) was accessed to identify all consensus NR4A DNA binding motifs located within OCR <100 kb from Batf gene. The closest, most prominent peak was identified −20 kb downstream of 3′ Batf exons, and tracks were displayed using UCSC genome browser.
Extended Data
Extended Data Fig. 1. NUR77 does not alter proximal BCR signal transduction or BAFFR expression.
A, B. NUR77-EGFP lymphocytes were treated as in Fig 1H except for only 2 h. Endogenous NUR77 (A) and EGFP (B) in B220+ B cells was assessed via flow. C. Splenocytes from Nr4a1+/+ and Nr4a1−/− mice were loaded with Indo-1 dye and stained to identify CD23+ B cells. Samples were collected on a flow cytometer for 20s, and then for 3m following stimulation with either anti-IgM or anti-IgD. Intracellular calcium is depicted for CD23+ B cells. D, E. Splenocytes from Nr4a1+/+ and Nr4a1−/− mice were stimulated with anti-IgM for 5 m, fixed, permeabilized, and then stained for either pErk (B) or pS6 (C) followed by staining to identify CD23+ B220+ B cells. F. Splenocytes from CD45.1+ Nr4a1+/+ and CD45.2+ Nr4a1−/− mice were mixed 1:1, and then either stimulated with 10 μg/mL anti-IgM or media alone for 4 h. After stimulus wash-out and 15 m rest, cells were re-stimulated with anti-IgD for 5 m and processed as in B, C to detect intra-cellular pErk. G, H, I. Lymphocytes from CD45.1+ Nr4a1+/+ and CD45.2+ Nr4a1−/− mice were mixed 1:1 and co-cultured for 72 h with anti-IgM +/− BAFF 20ng/ml as described. Cells were then stained to detect CD45.1, CD45.2, B220, and BAFFR. G. Plots depict surface expression of BAFFR in B and T cells either ex vivo or after culture +/− anti-IgM. H. Graph depicts BAFFR MFI in B220+ B cells. I. Graph depicts ratio of CD45.2+ Nr4a1−/− relative to CD45.1+ Nr4a1+/+ B220+ B cells after 72 h culture normalized to input ratio. Data in C-F reflect N=2 biological replicates and in G-I reflect N=3 biological replicates. Mean +/− SEM displayed for all graphs. Statistical significance was assessed with two-way ANOVA with Tukey’s (H); two-tailed unpaired student’s t-test with Holm-Sidak (I). **p<0.01, ****p<0.0001
Extended Data Fig. 2. NUR77 restrains survival and proliferation of BCR-stimulated B cells in a cell-intrinsic manner.
A. Graph depicts live CD45.2+ B cell number corresponding to Fig. 2A, B samples. B. Lymphocytes from NUR77-EGFP mice were stimulated with anti-IgM +/− 20 ng/mL BAFF for 24 h. Graph depicts GFP MFI of live B cells. C, D. Graphs depict the ratio of CD45.2+ Nr4a1−/− or Nr4a1+/+ B cells relative to co-cultured WT CD45.1+ B cells, normalized to the input ratio, and correspond to Fig 2. C, D samples. E. Splenocytes from Nr4a1+/+, Nr4a1+/− and Nr4a1−/− mice were stimulated with 10 μg/mL anti-IgM for 2 h. Graph depicts MFI of endogenous NUR77 expression in CD23+ B cells. F-H. Either MACS-purified B cells or total lymphocytes from CD45.2+ Nr4a1−/− and CD45.1+ Nr4a1+/+ mice were co-cultured in a 1:1 ratio with anti-IgM for 72 h. F. Histograms depict CTV dilution after culture with 6.4μg/ml anti-IgM. G. Graph depicts ratio of Nr4a1−/− CD45.2+ relative to co-cultured WT CD45.1+ purified B cells, normalized to the input ratio. H. Graph depicts division index of co-cultured purified B cells. I-J. Lymphocytes from either Nr4a1+/+ or Nr4a1−/− CD45.2+ IgHEL Tg mice were treated as in Fig. 2A. I. Graph depicts ratio of CD45.2+ B cells of each genotype relative to co-cultured CD45.1+ WT B cells, normalized to the input ratio. J. Graph depicts division index of CD45.2+ B cells for each genotype. K, L. Lymphocytes from either mb1-cre, mb1-cre Nr4a1fl/fl, or Nr4a1−/− mice were mixed 1:1 with CD45.1+ lymphocytes and treated as in Fig. 2A. K, L. Graphs depicts total B cell number (K) and division index (L) of each genotype. Data in this figure depict N=3 biological replicates. Mean +/− SEM displayed for all graphs. Statistical significance was assessed with two-tailed unpaired student’s t-test with Holm-Sidak (A-D, G-J); two-way ANOVA with Tukey’s (K, L). *p<0.05, **p<0.01, ***p<0.001, ****p<0.0001
Extended Data Fig. 3. Regulation of NUR77 expression by co-stimulation.
A-C. Lymphocytes from WT mice were stimulated with the given doses of the indicated stimulus over a time course. Graphs depict endogenous NUR77 expression in B cells as determined via intracellular flow staining. Graphs in this figure depict N=3 biological replicates for all panels. Mean +/− SEM displayed for all graphs.
Extended Data Fig. 4. NUR77 restrains B cell expansion in the absence of signal two.
A-C. Lymphocytes from CD45.1+ Nr4a1+/+ and CD45.2+ Nr4a1−/− mice were mixed 1:1, loaded with CTV, and co-cultured for 72 h with the given stimulus. Cells were then stained to detect CD45.1, CD45.2, B220, CTV via flow cytometry. A. Representative histograms depict CTV dilution of Nr4a1+/+ and Nr4a1−/− B cells stimulated with: 10 μg/mL LPS, 2 μM CPG, or 10 μg/mL anti-IgM +/− either 1 μg/mL anti-CD40 or 10 ng/mL IL-4. B. Graph depicts ratio of CD45.2+ Nr4a1−/− B cells relative to co-cultured CD45.1+ Nr4a1+/+ B cells, normalized to the input ratio. C. Graph depict % of B cells that divided at least once as determined by CTV dilution. D. Mixed co-cultures were generated as described above in (D-F) in the presence of low dose anti-IgM 1 μg/mL. Co-stimulation with 1 μg/mL anti-CD40 was added at the indicated timepoint, and cells were harvested for analysis after a total of 72 h in culture each condition. Shown are representative histograms depicting CTV dilution of live B cells of each co-cultured genotype. Histograms are representative of 4 biological replicates.
E. mb1-cre and mb1-cre Nr4a1f/f (Nr4a1cKO) mice were immunized IP with 100 μg NP-Ficoll (as in Fig. 4B); anti-NP IgG3 titers were determined via ELISA at serial time points. F. Model: Ag induces NUR77 expression which restrains B cell proliferation and promotes apoptosis. Receipt of co-stimulatory signals bypasses restraint imposed by NUR77 by supplying robust proliferation and survival signals.
Graphs in this figure depict N=3 biological replicates for all panels except E which depicts N=5 biological replicates. Mean +/− SEM displayed for all graphs. Statistical significance was assessed with one-way ANOVA with Dunnett’s (B); two-tailed unpaired student’s t-test with Holm-Sidak (C, E). *p<0.05, **p<0.01, ***p<0.001, ****p<0.0001
Extended Data Fig. 5. Compensatory expression of Nr4a genes in Nr4a1−/− B cells and generation of Nr4a3−/− mice.
A-D. Lymphocytes from Nr4a1+/+ and Nr4a1−/− mice harboring NUR77-EGFP BAC Tg were stimulated with 10 μg/mL anti-IgM for the indicated times. qPCR was performed to determine relative expression of Nr4a1, Nr4a2, Nr4a3, and GFP transcripts. Samples were also subjected to surface staining in parallel to detect % B cells via flow cytometry. Mean % B cells for Nr4a1+/+ samples was 37.6 ± 0.15 (SEM), and for Nr4a1−/− samples was 33.5 ± 1.02 (SEM). N=3 biological replicates for all conditions. Nr4a1+/+ samples correspond to data in Figs 1A-C. E. Lymphocytes from reporter Nr4a1+/+ and Nr4a1−/− mice were stimulated with the given doses of anti-IgM for 24 h. Graph depicts GFP MFI in B cells as determined by flow cytometry.
F. Left: Schematic showing the extent of nucleotide deletion in exon 3 of the Nr4a3 gene harboring ATG translation initiation site, resulting in the introduction of a premature stop codon. Right: Representative PCR showing absence of the WT Nr4a3 gene and the presence of a truncated product in Nr4a3−/− mice.
G, H. MACS-purified B cells from Nr4a1+/+, Nr4a1−/−, and Nr4a3−/− splenocytes were stimulated with 10 μg/mL anti-IgM for the indicated times. qPCR was performed to determine relative expression of Nr4a3 (G) and Nr4a1 (H) transcripts. I. Thymocytes from WT, Nr4a1−/− and Nr4a3−/− mice were incubated +/− PMA and ionomycin for 2 h. Subsequently whole cell lysates were blotted with Ab to detect NUR77, NOR-1, MYC, and GAPDH. Red arrow indicates presence of low abundance truncated NOR-1 protein in Nr4a3−/− mice. Graphs in this figure depict N=3 biological replicates for all panels. Mean +/− SEM displayed for all graphs. Statistical significance was assessed with two-tailed unpaired student’s t-test with Holm-Sidak (A-E); two-way ANOVA with Tukey’s (G, H). *p<0.05, **p<0.01, ***p<0.001, ****p<0.0001
Extended Data Fig. 6. B and T cell development and homeostasis in NR4A-deficient mice.
A-C. Splenocytes from WT, Nr4a1−/− and Nr4a3−/− mice were stained to detect T cell subsets. A. Plots depict gating. CM=central memory. EM=effector memory. B, C. Graphs depict T cell subsets. D. Thymocytes and splenocytes from WT, Nr4a1−/− and Nr4a3−/− mice were permeabilized and stained to detect Foxp3. Graph depicts % Tregs in CD4+ gate. E-G. Splenocytes from WT, Nr4a1−/− and Nr4a3−/− mice were stained to detect B cell subsets. E. Plots of B220+ cells (top row) to identify marginal zone (MZ). Bottom row depicts B220+ subsets after exclusion of MZ. F, G. Graphs depict B cell subsets (F) and IgM/IgD MFI on B220+CD23+ splenocytes (G). H, I. Non-competitive chimeras were generated by reconstituting lethally irradiated CD45.1+ WT mice with BM from either CD45.2+ mb1-cre mice (cre chimera), or CD45.2+ cDKO chimera for 8-10 weeks. Graphs depict splenic T cell subsets as gated in A. N=5 chimeras / genotype. J, K. Splenocytes from from mb1-cre, Nr4a1cKO, and cDKO mice were stained to detect B cells. Graphs depict % B220+ cells (J) and IgM/IgD MFI on B220+ splenic B cells (K). L. Graph depicts splenic subsets from chimeras above (H, I) as gated in E. M, N. Irradiated CD45.1+ recipients were reconstituted with 1:1 BM mix from donor A (CD45.1/2 WT mice) and donor B (either CD45.2+ mb1-cre control or CD45.2+ cDKO mice) for 10-12 weeks. Graphs depict relative reconstitution of B cell developmental subsets in the BM and spleen. N=5 for chimeras each. Panels depict N=3 biological replicates except N=5 got chimeras (H, I, L, M, N). Mean +/− SEM for all graphs. Statistical significance was assessed with two-way ANOVA with Tukey’s (B-D, F, G, K); two-tailed unpaired student’s t-test with Holm-Sidak (H, I, L); one-way ANOVA with Tukey’s (J). *p<0.05, **p<0.01, ***p<0.001, ****p<0.0001
Extended Data Fig. 7. NUR77/Nr4a1 and NOR-1/Nr4a3 redundantly restrain BCR-induced B cell expansion.
A-C. Samples correspond to those described in Fig 5E, F. A. Histograms depict CTV dilution in CD45.2+ B cells (black histogram) and co-cultured CD45.1 WT B cells (shaded gray histogram), and are representative of at least 3 mice/genotype. B. Shown is the ratio of CD45.2+ WT, Nr4a1−/− or Nr4a3−/− B cells relative to co-cultured CD45.1+ WT B cells (+ 20 ng/ml BAFF), normalized to the unstimulated condition. C. Graph depicts division index for each genotype. D, E. Samples correspond to those described in Fig 5I, J, cultured in the presence of 20 ng/ml BAFF. D. Shown is the ratio of each CD45.2+ B cell genotype relative to co-cultured CD45.1+ WT B cells, normalized to the unstimulated condition. E. Graph depicts division index for each genotype. F-K. Competitive bone marrow chimeras were generated as described in Extended Data Fig 5H, I. 10-12 weeks after reconstitution, lymphocytes were harvested from chimeras, CTV loaded and cultured with given stimuli (anti-IgM doses +/− 20 ng/ml BAFF +/− 10 ng/ml IL-4). N=5 chimeras of each genotype were analyzed. F, G, H. Graphs depict ratio of CD45.2+ cre+ or cDKO B cells relative to CD45.1/2 WT B cells from each chimera, normalized to unstimulated condition. I, J, K. Graphs depict division index for CD45.2+ cre+ or cDKO B cells from each chimera. Graphs in this figure depict N=3 biological replicates for panels (D-E) except (F-K) as noted above which represent N=5 chimeras each. Mean +/− SEM displayed for all graphs. Statistical significance was assessed with two-way ANOVA with Tukey’s (B-E); two-tailed unpaired student’s t-test with Holm-Sidak (F-K). *p<0.05, **p<0.01, ***p<0.001, ****p<0.0001
Extended Data Fig. 8. Validation of NUR77 targets in BCR-stimulated B cells.
A. Relative expression of Batf transcript assessed by qPCR in purified B cells corresponding to Extended Data Fig. 5A-C samples. B. Lymphocytes from Nr4a1+/+ and Nr4a1−/− mice were stimulated with anti-IgM for 24 hours. Graph depicts MFI of BATF in B cells. C. Lymphocytes from competitive bone marrow chimeras (as in Extended Data Fig. 6M, N) were stimulated with anti-IgM for 24 h. Graph depicts MFI of BATF in CD45.2+ Cre-only or cDKO B cells. D. Graph depicts FPKM of Cd69 corresponding to Fig 6A. E. Lymphocytes from CD45.1+ Nr4a1+/+ and CD45.2+ Nr4a1−/− mice were co-cultured with anti-IgM for 24 h. Graph depicts MFI of CD69 on B cells. F. Relative expression of Cd69 transcript assessed by qPCR in purified B cells corresponding to Fig 6J, K samples. G. Experiment performed as in Fig. 6O. Graph depicts MFI of CD69 on B cells. H. Relative expression of Cd69 transcript assessed by qPCR in purified B cells corresponding to Fig 6L, M. I. Experiment performed as in Fig. 6Q. Graph depicts MFI of CD69 on B cells. J. Experiment performed as in C above. Graph depicts MFI of CD69 on B cells. K-O. Experiments performed as in H-J, but Egr2 transcript and protein assayed instead. P. Experiment performed as in C above. Graph depicts MFI of IRF4 in B cells. Q. Model: Nr4a1 and Nr4a3 feedback to restrain expression of other primary response genes (PRGs) induced by BCR stimulation. Data in this figure depict N=3 biological replicates for all panels except in C, D, J, K, O, P which have N=4. Mean +/− SEM displayed for all graphs. Statistical significance was assessed with two-tailed unpaired student’s t-test with Holm-Sidak (A-E, J-L, O, P); two-way ANOVA with Tukey’s (F-I, M, N). *p<0.05, **p<0.01, ***p<0.001, ****p<0.0001
Extended Data Fig. 9. Regulation of MYC and BATF by NUR77.
A. Experiment performed as in Fig. 6O. Graph depicts MFI of intracellular MYC expression on B cells as determined via flow cytometry. B. Experiment performed as in Fig. 6Q. Graph depicts MFI of intracellular MYC expression on B cells as determined via flow cytometry. C. Experiment performed as in Extended Data Fig. 8C with competitive chimeras described in Extended Data Fig. 6M, N. Graph depicts MFI of intracellular MYC expression on B cells as determined via flow cytometry. D. Publicly available ATAC-seq data (Immgen.org) was accessed to identify all consensus NR4A DNA binding motifs located within OCR <100kb from Batf gene in follicular mature B cells. The closest, most prominent peak was identified −20kB downstream of 3’ Batf exons, and tracks were displayed using UCSC genome browser. E. Lymphocytes from Batf+/+, Batf+/−, and Batf−/− mice were stimulated with the given doses of anti-IgM for 24 h. Graph depicts intracellular BATF expression in B cells as determined via flow cytometry. Data in this figure depict N=3 biological replicates. Mean +/− SEM displayed for all graphs. Statistical significance was assessed with two-way ANOVA with Tukey’s (A, B); two-tailed unpaired student’s t-test with Holm-Sidak (C). *p<0.05, **p<0.01, ***p<0.001, ****p<0.0001
Extended Data Fig. 10. NUR77 modulates access to T cell help under competitive conditions.
A. Experiment performed as in Fig 6O. Graph depicts MFI of surface CD86 expression on B cells as determined via flow cytometry. B. Experiment performed as in Extended Data Fig. 8C with competitive chimeras described in Extended Data Fig. 6M, N. Graph depicts MFI of surface CD86 expression on B cells as determined via flow cytometry. C, D. Lymphocytes harvested from CD45.1+ Nr4a1+/+ and CD45.2+ Nr4a1−/− mice were mixed 1:1 and co-cultured with the given doses of anti-IgM for 24 h (C) or 48 h (D). Graphs depict MFI of ICAM-1 surface expression on each genotype of B cells as determined via flow cytometry. E, F. Schematic of adoptive transfer experimental design for Fig 8. B cells were purified from splenocytes harvested from Nr4a1+/+ B1-8 Tg CD45.1/2+ and Nr4a1−/− B1-8 Tg CD45.2+ mice via bench-top negative selection, mixed 1:1, and loaded with CTV. 2x10⁶-3x10⁶ B cells were then adoptively transferred +/− OTII splenocytes into either WT or CD40L−/− hosts. Host mice were then immunized IP one day later with 100 μg NP-OVA/alum, followed by spleen harvest on d4. G. Graph depicts adoptive transfer data from experiments described in E, F above and presented in Fig 8H with addition of unimmunized controls and CD40L−/− hosts that did not receive adoptive transferred OTII cells (shaded gray points). Data in this figure depict N=3 biological replicates except B (N=4) and G where individual biological samples are plotted. Mean +/− SEM displayed for all other graphs. Statistical significance was assessed with two-way ANOVA with Tukey’s (A); two-tailed unpaired student’s t-test with Holm-Sidak (B-D). *p<0.05, **p<0.01, ***p<0.001, ****p<0.0001
Supplementary Material
Suplementary Data 1 RNAseq RSEM_FPKM and EdgeR DEG lists
Suplementary Data 2 Exact p values for all figures and Extended Data figures
ACKNOWLEDGEMENTS
We thank our funders: NIAID 5T32AI007334-28 (CT), HHMI Medical Research Fellows program (JH), NIAMS R01AR069520 (JZ), and Rheumatology Research Foundation (JZ). A.M. holds a Career Award for Medical Scientists from the Burroughs Wellcome Fund, is an investigator at the Chan–Zuckerberg Biohub and is a recipient of The Cancer Research Institute (CRI) Lloyd J. Old STAR grant. A.M. has received funds from the Innovative Genomics Institute (IGI) and the Parker Institute for Cancer Immunotherapy (PICI).
Footnotes
DECLARATION OF INTERESTS
The authors declare competing financial interests: A.M. is a co-founder of Arsenal Biosciences and Spotlight Therapeutics, and serves on their board of directors and scientific advisory boards. A.M. has served as an advisor to Juno Therapeutics, was a member of the scientific advisory board at PACT Pharma, and was an advisor to Trizell. A.M. owns stock in Arsenal Biosciences, Spotlight Therapeutics and PACT Pharma. The Marson lab has received sponsored research support from Juno Therapeutics, Epinomics, Sanofi, GlaxoSmithKline, Gilead and Anthem Blue Cross Blue Shield. J.Z. serves as a scientific consultant for Walking Fish Therapeutics.
STATEMENT OF DATA AVAILABILITY
Raw and processed data files for the RNA-seq analyses (corresponding to Fig. 6a, b) have been deposited in the NCBI Gene Expression Omnibus under accession number GSE146747 and are provided in “Supplemental Data 1.xlsx”. All other source data that support the findings of this study are available from the corresponding author upon request.
References
- 1.Bretscher P & Cohn M A theory of self-nonself discrimination. Science 169, 1042–1049 (1970). [DOI] [PubMed] [Google Scholar]
- 2.Cyster JG & Allen CDC B Cell Responses: Cell Interaction Dynamics and Decisions. Cell 177, 524–540 (2019). [DOI] [PMC free article] [PubMed] [Google Scholar]
- 3.Damdinsuren B et al. Single round of antigen receptor signaling programs naive B cells to receive T cell help. Immunity 32, 355–366 (2010). [DOI] [PMC free article] [PubMed] [Google Scholar]
- 4.Turner JS, Marthi M, Benet ZL & Grigorova I Transiently antigen-primed B cells return to naive-like state in absence of T-cell help. Nat Commun 8, 15072 (2017). [DOI] [PMC free article] [PubMed] [Google Scholar]
- 5.Akkaya M et al. Second signals rescue B cells from activation-induced mitochondrial dysfunction and death. Nat Immunol 19, 871–884 (2018). [DOI] [PMC free article] [PubMed] [Google Scholar]
- 6.Winoto A & Littman DR Nuclear hormone receptors in T lymphocytes. Cell 109 Suppl, S57–66 (2002). [DOI] [PubMed] [Google Scholar]
- 7.Lin B et al. Conversion of Bcl-2 from protector to killer by interaction with nuclear orphan receptor Nur77/TR3. Cell 116, 527–540 (2004). [DOI] [PubMed] [Google Scholar]
- 8.Thompson J & Winoto A During negative selection, Nur77 family proteins translocate to mitochondria where they associate with Bcl-2 and expose its proapoptotic BH3 domain. J Exp Med 205, 1029–1036 (2008). [DOI] [PMC free article] [PubMed] [Google Scholar]
- 9.Calnan BJ, Szychowski S, Ka-Ming Chan F, Cado D & Winoto A A role for the orphan steroid receptor Nur77 in apoptosis accompanying antigen-induced negative selection. Immunity 3, 273–282 (1995). [DOI] [PubMed] [Google Scholar]
- 10.Sekiya T et al. Nr4a receptors are essential for thymic regulatory T cell development and immune homeostasis. Nature immunology 14, 230–237 (2013). [DOI] [PubMed] [Google Scholar]
- 11.Chen J et al. NR4A transcription factors limit CAR T cell function in solid tumours. Nature 567, 530–534 (2019). [DOI] [PMC free article] [PubMed] [Google Scholar]
- 12.Liu X et al. Genome-wide analysis identifies NR4A1 as a key mediator of T cell dysfunction. Nature 567, 525–529 (2019). [DOI] [PMC free article] [PubMed] [Google Scholar]
- 13.Cheng LEC, Chan FKM, Cado D & Winoto A Functional redundancy of the Nur77 and Nor-1 orphan steroid receptors in T-cell apoptosis. EMBO Journal 16, 1865–1875 (1997). [DOI] [PMC free article] [PubMed] [Google Scholar]
- 14.Moran AE et al. T cell receptor signal strength in Treg and iNKT cell development demonstrated by a novel fluorescent reporter mouse. J Exp Med 208, 1279–1289 (2011). [DOI] [PMC free article] [PubMed] [Google Scholar]
- 15.Mullican SE et al. Abrogation of nuclear receptors Nr4a3 and Nr4a1 leads to development of acute myeloid leukemia. Nature medicine 13, 730–735 (2007). [DOI] [PubMed] [Google Scholar]
- 16.Mueller J, Matloubian M & Zikherman J Cutting Edge: An In Vivo Reporter Reveals Active B Cell Receptor Signaling in the Germinal Center. The Journal of Immunology (2015). [DOI] [PMC free article] [PubMed] [Google Scholar]
- 17.Zikherman J, Parameswaran R & Weiss A Endogenous antigen tunes the responsiveness of naive B cells but not T cells. Nature 489, 160–164 (2012). [DOI] [PMC free article] [PubMed] [Google Scholar]
- 18.Noviski M et al. Optimal Development of Mature B Cells Requires Recognition of Endogenous Antigens. J Immunol 203, 418–428 (2019). [DOI] [PMC free article] [PubMed] [Google Scholar]
- 19.Tan C et al. Nur77 Links Chronic Antigen Stimulation to B Cell Tolerance by Restricting the Survival of Self-Reactive B Cells in the Periphery. J Immunol 202, 2907–2923 (2019). [DOI] [PMC free article] [PubMed] [Google Scholar]
- 20.Huang B, Pei HZ, Chang HW & Baek SH The E3 ubiquitin ligase Trim13 regulates Nur77 stability via casein kinase 2alpha. Sci Rep 8, 13895 (2018). [DOI] [PMC free article] [PubMed] [Google Scholar]
- 21.Paus D et al. Antigen recognition strength regulates the choice between extrafollicular plasma cell and germinal center B cell differentiation. J Exp Med 203, 1081–1091 (2006). [DOI] [PMC free article] [PubMed] [Google Scholar]
- 22.Sonoda E et al. B cell development under the condition of allelic inclusion. Immunity 6, 225–233 (1997). [DOI] [PubMed] [Google Scholar]
- 23.Lee SL et al. Unimpaired thymic and peripheral T cell death in mice lacking the nuclear receptor NGFI-B (Nur77). Science (New York, N.Y.) 269, 532–535 (1995). [DOI] [PubMed] [Google Scholar]
- 24.Hobeika E et al. Testing gene function early in the B cell lineage in mb1-cre mice. Proc Natl Acad Sci U S A 103, 13789–13794 (2006). [DOI] [PMC free article] [PubMed] [Google Scholar]
- 25.Kraus M, Alimzhanov MB, Rajewsky N & Rajewsky K Survival of resting mature B lymphocytes depends on BCR signaling via the Igalpha/beta heterodimer. Cell 117, 787–800 (2004). [DOI] [PubMed] [Google Scholar]
- 26.Huizar J, Tan C, Noviski M, Mueller JL & Zikherman J Nur77 Is Upregulated in B-1a Cells by Chronic Self-Antigen Stimulation and Limits Generation of Natural IgM Plasma Cells. Immunohorizons 1, 188–197 (2017). [DOI] [PMC free article] [PubMed] [Google Scholar]
- 27.Fowler T et al. Divergence of transcriptional landscape occurs early in B cell activation. Epigenetics Chromatin 8, 20 (2015). [DOI] [PMC free article] [PubMed] [Google Scholar]
- 28.Zaretsky I et al. ICAMs support B cell interactions with T follicular helper cells and promote clonal selection. J Exp Med 214, 3435–3448 (2017). [DOI] [PMC free article] [PubMed] [Google Scholar]
- 29.Shiow LR et al. CD69 acts downstream of interferon-alpha/beta to inhibit S1P1 and lymphocyte egress from lymphoid organs. Nature 440, 540–544 (2006). [DOI] [PubMed] [Google Scholar]
- 30.Li S et al. The transcription factors Egr2 and Egr3 are essential for the control of inflammation and antigen-induced proliferation of B and T cells. Immunity 37, 685–696 (2012). [DOI] [PMC free article] [PubMed] [Google Scholar]
- 31.Betz BC et al. Batf coordinates multiple aspects of B and T cell function required for normal antibody responses. J Exp Med 207, 933–942 (2010). [DOI] [PMC free article] [PubMed] [Google Scholar]
- 32.Taub DD, Conlon K, Lloyd AR, Oppenheim JJ & Kelvin DJ Preferential migration of activated CD4+ and CD8+ T cells in response to MIP-1 alpha and MIP-1 beta. Science 260, 355–358 (1993). [DOI] [PubMed] [Google Scholar]
- 33.Shrestha B et al. B cell-derived vascular endothelial growth factor A promotes lymphangiogenesis and high endothelial venule expansion in lymph nodes. J Immunol 184, 4819–4826 (2010). [DOI] [PubMed] [Google Scholar]
- 34.Krzysiek R et al. Antigen receptor engagement selectively induces macrophage inflammatory protein-1 alpha (MIP-1 alpha) and MIP-1 beta chemokine production in human B cells. J Immunol 162, 4455–4463 (1999). [PubMed] [Google Scholar]
- 35.Nowyhed HN, Huynh TR, Thomas GD, Blatchley A & Hedrick CC Cutting Edge: The Orphan Nuclear Receptor Nr4a1 Regulates CD8+ T Cell Expansion and Effector Function through Direct Repression of Irf4. J Immunol 195, 3515–3519 (2015). [DOI] [PMC free article] [PubMed] [Google Scholar]
- 36.Finkin S, Hartweger H, Oliveira TY, Kara EE & Nussenzweig MC Protein Amounts of the MYC Transcription Factor Determine Germinal Center B Cell Division Capacity. Immunity 51, 324–336 e325 (2019). [DOI] [PMC free article] [PubMed] [Google Scholar]
- 37.Caro-Maldonado A et al. Metabolic reprogramming is required for antibody production that is suppressed in anergic but exaggerated in chronically BAFF-exposed B cells. J Immunol 192, 3626–3636 (2014). [DOI] [PMC free article] [PubMed] [Google Scholar]
- 38.Heinzel S et al. A Myc-dependent division timer complements a cell-death timer to regulate T cell and B cell responses. Nat Immunol 18, 96–103 (2017). [DOI] [PubMed] [Google Scholar]
- 39.Ma Y et al. CRISPR/Cas9 Screens Reveal Epstein-Barr Virus-Transformed B Cell Host Dependency Factors. Cell Host Microbe 21, 580–591 e587 (2017). [DOI] [PMC free article] [PubMed] [Google Scholar]
- 40.Inoue T et al. The transcription factor Foxo1 controls germinal center B cell proliferation in response to T cell help. J Exp Med 214, 1181–1198 (2017). [DOI] [PMC free article] [PubMed] [Google Scholar]
- 41.Wingate AD & Arthur JS Post-translational control of Nur77. Biochem Soc Trans 34, 1107–1109 (2006). [DOI] [PubMed] [Google Scholar]
- 42.Masuyama N et al. Akt inhibits the orphan nuclear receptor Nur77 and T-cell apoptosis. J Biol Chem 276, 32799–32805 (2001). [DOI] [PubMed] [Google Scholar]
- 43.Pekarsky Y et al. Akt phosphorylates and regulates the orphan nuclear receptor Nur77. Proc Natl Acad Sci U S A 98, 3690–3694 (2001). [DOI] [PMC free article] [PubMed] [Google Scholar]
- 44.Glasmacher E et al. A genomic regulatory element that directs assembly and function of immune-specific AP-1-IRF complexes. Science 338, 975–980 (2012). [DOI] [PMC free article] [PubMed] [Google Scholar]
- 45.Li P et al. BATF-JUN is critical for IRF4-mediated transcription in T cells. Nature 490, 543–546 (2012). [DOI] [PMC free article] [PubMed] [Google Scholar]
- 46.Schraml BU et al. The AP-1 transcription factor Batf controls T(H)17 differentiation. Nature 460, 405–409 (2009). [DOI] [PMC free article] [PubMed] [Google Scholar]
- 47.Thomas MD, Kremer CS, Ravichandran KS, Rajewsky K & Bender TP c-Myb is critical for B cell development and maintenance of follicular B cells. Immunity 23, 275–286 (2005). [DOI] [PubMed] [Google Scholar]
- 48.Schwickert TA et al. A dynamic T cell-limited checkpoint regulates affinity-dependent B cell entry into the germinal center. J Exp Med 208, 1243–1252 (2011). [DOI] [PMC free article] [PubMed] [Google Scholar]
- 49.Kuraoka M et al. Complex Antigens Drive Permissive Clonal Selection in Germinal Centers. Immunity 44, 542–552 (2016). [DOI] [PMC free article] [PubMed] [Google Scholar]
- 50.Zhan Y et al. Cytosporone B is an agonist for nuclear orphan receptor Nur77. Nature chemical biology 4, 548–556 (2008). [DOI] [PubMed] [Google Scholar]
- 51.Zhan Y et al. The orphan nuclear receptor Nur77 regulates LKB1 localization and activates AMPK. Nature chemical biology 8, 897–904 (2012). [DOI] [PubMed] [Google Scholar]
Methods-only References:
- 52.Goodnow CC et al. Altered immunoglobulin expression and functional silencing of self-reactive B lymphocytes in transgenic mice. Nature 334, 676–682 (1988). [DOI] [PubMed] [Google Scholar]
- 53.Barnden MJ, Allison J, Heath WR & Carbone FR Defective TCR expression in transgenic mice constructed using cDNA-based alpha- and beta-chain genes under the control of heterologous regulatory elements. Immunol Cell Biol 76, 34–40 (1998). [DOI] [PubMed] [Google Scholar]
- 54.Renshaw BR et al. Humoral immune responses in CD40 ligand-deficient mice. J Exp Med 180, 1889–1900 (1994). [DOI] [PMC free article] [PubMed] [Google Scholar]
- 55.Mombaerts P et al. Mutations in T-cell antigen receptor genes alpha and beta block thymocyte development at different stages. Nature 360, 225–231 (1992). [DOI] [PubMed] [Google Scholar]
- 56.Wholey WY et al. Synthetic Liposomal Mimics of Biological Viruses for the Study of Immune Responses to Infection and Vaccination. Bioconjug Chem (2020). [DOI] [PMC free article] [PubMed] [Google Scholar]
Associated Data
This section collects any data citations, data availability statements, or supplementary materials included in this article.
Supplementary Materials
Suplementary Data 1 RNAseq RSEM_FPKM and EdgeR DEG lists
Suplementary Data 2 Exact p values for all figures and Extended Data figures
Data Availability Statement
Raw and processed data files for the RNA-seq analyses (corresponding to Fig. 6a, b) have been deposited in the NCBI Gene Expression Omnibus under accession number GSE146747 and are provided in “Supplemental Data 1.xlsx”. All other source data that support the findings of this study are available from the corresponding author upon request.


