PLOS ONE logoLink to PLOS ONE
. 2021 Apr 28;16(4):e0247903. doi: 10.1371/journal.pone.0247903

Reliability of heart rate and respiration rate measurements with a wireless accelerometer in postbariatric recovery

Fleur Jacobs 1,#, Jai Scheerhoorn 2,*,#, Eveline Mestrom 3, Jonna van der Stam 4,5, R Arthur Bouwman 3,6, Simon Nienhuijs 2
Editor: Bijan Najafi7
PMCID: PMC8081266  PMID: 33909642

Abstract

Recognition of early signs of deterioration in postoperative course could be improved by continuous monitoring of vital parameters. Wearable sensors could enable this by wireless transmission of vital signs. A novel accelerometer-based device, called Healthdot, has been designed to be worn on the skin to measure the two key vital parameters respiration rate (RespR) and heart rate (HeartR). The goal of this study is to assess the reliability of heart rate and respiration rate measured by the Healthdot in comparison to the gold standard, the bedside patient monitor, during the postoperative period in bariatric patients. Data were collected in a consecutive group of 30 patients who agreed to wear the device after their primary bariatric procedure. Directly after surgery, a Healthdot was attached on the patients’ left lower rib. Vital signs measured by the accelerometer based Healthdot were compared to vital signs collected with the gold standard patient monitor for the period that the patient stayed at the post-anesthesia care unit. Over all patients, a total of 22 hours of vital signs obtained by the Healthdot were recorded simultaneously with the bedside patient monitor data. 87.5% of the data met the pre-defined bias of 5 beats per minute for HeartR and 92.3% of the data met the pre-defined bias of 5 respirations per minute for RespR. The Healthdot can be used to accurately derive heart rate and respiration rate in postbariatric patients. Wireless continuous monitoring of key vital signs has the potential to contribute to earlier recognition of complications in postoperative patients. Future studies should focus on the ability to detect patient deterioration in low-care environments and at home after discharge from the hospital.

Introduction

In hospitalized patients, vital signs are routinely measured by spot checks to identify clinical deterioration in the postoperative period [1]. These assessments are usually based on manual measurements and therefore represent a considerable workload for healthcare personnel, are prone-to-error and furthermore are not continuous [2, 3]. Technological innovations in sensor miniaturization, power consumption and wireless connectivity enable wearable wireless devices capable of continuously recording and transmitting several vital parameters such as heart rate (HeartR) and respiration rate (RespR) [4] and thereby facilitating remote continuous monitoring of vital signs in general hospital wards. Nowadays, several wearable devices exist for the continuous monitoring of vital parameters. Studies reviewing these devices are varied in population, ranging from patients of a general ward or intensive care unit to pregnant women [57]. However, to our knowledge, no studies exist in which wearable devices are used on patients with a Body-Mass Index (BMI) above 40 such as bariatric patients. It may be challenging to reach the required accuracy and precision using accelerometry in bariatric patients, due to their large Body-Mass-Index (BMI) and thicker layer of subcutaneous fat around the chest, which could compromise the measurements. Therefore, it is particularly interesting to evaluate the accuracy of an accelerometry-based vital signs monitor in this patient group.

Accelerometers combine seismocardiography (SCG), the measurement of micro-vibrations produced by the heart contraction, with monitoring chest movements to measure the accelerations of objects in motion along reference axes [810]. The accelerometry data can be used to derive velocity and displacement information by integrating the data with respect to time [1]. This enables the calculation of HeartR and RespR making accelerometers useful and practical sensors to measure vital parameters [8].

Recently, Philips Research developed the Healthdot for wireless remote monitoring of vital signs. The Healthdot is an accelerometer-based device, which is able to continuously measure breathing movements and heart contractions for a period of 2 weeks. It calculates and wirelessly transmits HeartR, RespR, posture and activity parameters via a low-power wide-area network (LoRa) both inside and outside the hospital.

The objective of this study is to determine the accuracy of the Healthdot for continuously monitoring RespR and HeartR in bariatric patients during their stay in a post-anesthesia care unit, by comparing these measurements with the standard electrocardiagram ECG and capnography measurements collected from a patient monitor.

Material and methods

Study design

The study population is a subset of the overall study population of the TRICA study. The TRICA Study NCT03923127 (NL7602, PJ-013483 FLAGSHIP Transitional Care Study 3) collected data from wearables for post-operative monitoring of recovery and potential complications and was conducted in a tertiary single center hospital in The Netherlands (Catharina Hospital, Eindhoven, the Netherlands) during 2019 and 2020. Formal approval for this study was obtained from the ethical committee of the Maxima Medical Centre, Veldhoven, The Netherlands (W19.001).

Study population

All adult patients scheduled for bariatric surgery (gastric bypass or sleeve gastrectomy) were screened by the surgeons for inclusion in the study. Participants were excluded if they had an active implantable device, antibiotic resistant skin infection, allergy to tissue adhesives or any skin condition at the area of application of the devices. If patients were able to join, patients were further informed of the study by the researchers. If patients were willing to participate, written informed consent was obtained prior to commencing any research procedures. At the day of surgery, the Healthdot (Philips Electronic Nederland BV) was applied in the post-anesthesia care unit and HeartR as well as RespR were continuously recorded for a period of two weeks. For 30 out of 350 bariatric patients the real-time data of the patient monitor (reference monitor) were also extracted during their stay in the post-anesthesia care unit and compared to the extracted values of The sample size was estimated by a power analysis using the Bland-Altman method of Lu et al. [11]. Creating a power of 0.8, a bias of 0, a standard deviation of 1.5 and an acceptable range of 5.0, a minimal sample size of 19 patients is needed. Therefore, 30 bariatric patients were selected in random order, to guarantee that an appropriate power will be reached for this validation study.

Study procedure

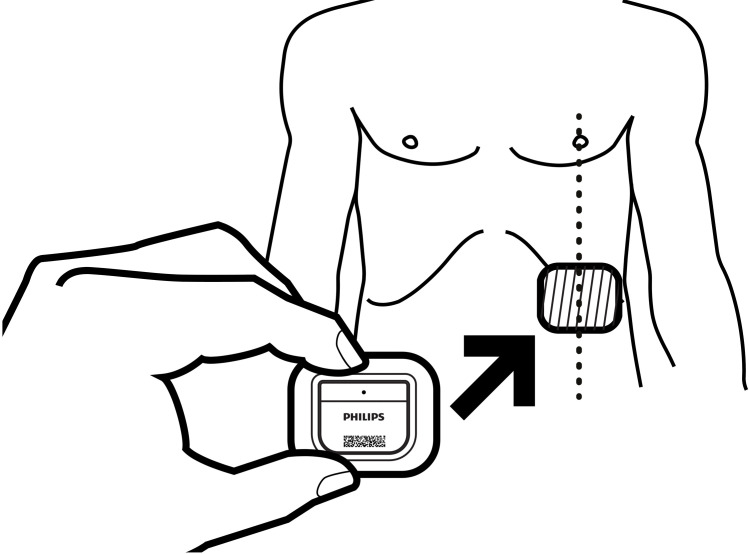
Directly after patients were arrived at the post-anesthesia care unit, the Healthdot was applied on the patients’ lower left rib on the mid-clavicular line. The Healthdot is a wearable data logger that measures 5x3 cm and weighs 13.6 g, consisting of an adhesive layer, electronics and a battery (Fig 1). Before applying the Healthdot, the sensor was activated and its identification number was linked to the study number of the patient. These activities were completed by the researchers just before the patient arrived the recovery department. The algorithm within the Healthdot process the motion signal to derive HeartR, RespR and a quality index for the measurements. This data is internally stored on an 8-sec (for HeartR) and 1-sec (for RespR) interval while also an aggregated average is transmitted every 5-min to a cloud server. Together with the vital parameters of the Healthdot, reference data of HeartR and RespR were obtained from ECG and capnography respectively, as measured by a patient monitoring system (CARESCAPE Monitor B650, GE Healthcare, Milwaukee, WI USA). The real-time data extraction of the reference monitor started as soon as the Healthdot was placed on the patient’s thorax. The registered data was extracted using the iCollect software (iCollect, GE Healthcare), both in trends and waveforms, having a sample frequency of 0.1 Hz and 100 Hz respectively. The patient monitor was disconnected when the patient was transferred from the recovery to the general ward.

Fig 1. Schematic view of the Healthdot.

Fig 1

Reprinted from Philips Electronic Nederland BV under a CC BY license, with permission from Philips Electronic Nederland BV, original copyright 2020.

Data collection and analysis

All data collected were analyzed retrospectively after patients completed the study. The American National Standards Institute standard for cardiac monitors, heart rate meters, and alarms defines accuracy as a “readout error of no greater than ±10% of the input rate or ±5 beats per minute (bpm), whichever is greater” [12]. Therefore, in this study the acceptable error between the measurements was set at 5 bpm for HeartR and 5 respirations per minute (rpm) for RespR. Data management and analysis was performed using RStudio.

Data preprocessing

The Healthdot starts logging directly after activation. Only the periods when there was logging of patient parameters were evaluated during this study.

For this comparative analysis, only the internally stored data of the Healthdot was evaluated, because it has a higher sampling frequency than the transmitted aggregated data. Because the sample frequencies of the HeartR and RespR generated by the Healthdot are different, the 8-sec HeartR data were resampled by linear interpolation between samples, obtaining a 1-sec interval for the HeartR data as well as the RespR data.

Extracted reference from the patient monitor and Healthdot measurements were represented on the same time frequency (1 value/second) and then time-synchronized. The synchronization procedure included as first step a fixed time shift of the Healthdot measurements by applying the time lag corresponding to the maximum of the cross-correlation function between reference and Healthdot measurements. The second step corresponded to a visual inspection of the offset-corrected Healthdot measurement and the reference to fine tune the selected offset in three different instances of the recording so to identify via these offsets eventual clock drifts. Clock drift was defined as any progressive increase or decrease in the offset over time, which was then corrected by linear interpolation of the time offset along the measurement samples. Only intervals with quality index > 0 (scale 0–100) were retained.

Data analysis

The vital signs of the Healthdot and the reference monitor were compared using the Bland-Altman method for repeated measurements [13]. This method was used to account for within-subject variation by correcting for the variance of differences between the average differences across patients and the number of measurements per patient [14, 15]. The mean difference, or bias, between the wireless sensor and the reference monitor, and the 95% confidence interval (CI) (+/- 1.96 SD), or limits of agreement, were determined for both the HeartR and RespR data. Furthermore, the Pearson’s correlation coefficient was calculated to assess the strength of the association between the measurements of the Healthdot and the measurements of the reference patient monitor.

Because outliers were observed in the data, error bars of the mean differences between the Healthdot and patient monitor, including their confidence interval, were made for each patient for both HeartR and RespR. These error bars were created on the data with a 1-sec interval as well as on the data over a 5-min average. The latter analysis was performed because the Healthdot is currently designed to average data and send that data package to the cloud every 5 minutes, which represents the intended performance in clinical use.

Results

A total of 30 patients were enrolled. 4 patients were excluded before processing; two because of technical issues with extracting the data from the internal memory of the Healthdot, two because the devices were discarded by the patient or medical staff and the data from the internal memory of the Healthdot could not be extracted. For two patients, all the registered HeartR vitals were of low quality. Patient demographics are shown in Table 1.

Table 1. Patient demographics.

Demographic variable N*
Total number of participants 26
Age (years) 46.5 [39.5, 55.5]
Male gender 10
BMI (kg/m2) 40.0 [38.8,42.0]
Weight (kg) 120.0 [107.8, 129.5]
Length (m) 1.72 [1.65,1.79]
Surgery type
Gastric bypass 17
Sleeve gastrectomy 9
ASAS score
7
19
Hypertension 10
Asthma/COPD 3
Diabetes 4
Surgery duration (min) 75.5 [63.0,83.0]
Monitoring duration (min) 50.0 [32.0,56.2]
Length of stay
1 day 21
2 days 5

* Continuous variables are summarized by median and [IQR].

Heart rate

473 min (35%) of HeartR data were excluded during the preprocessing phase because of low data quality (465 min from Healthdot; 8 min from patient monitor). Therefore, 14.6 hours of valid HeartR measurement pairs were available for analysis. The median [IQR] duration in percentage of the low quality Healthdot data with respect to the total monitoring time was 20 [6–58] %.

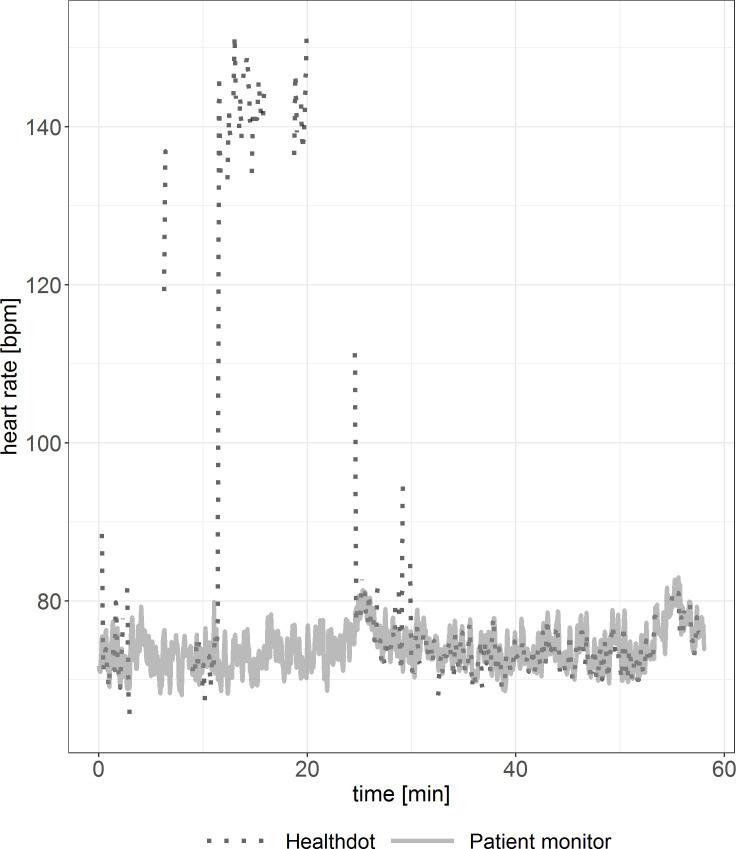
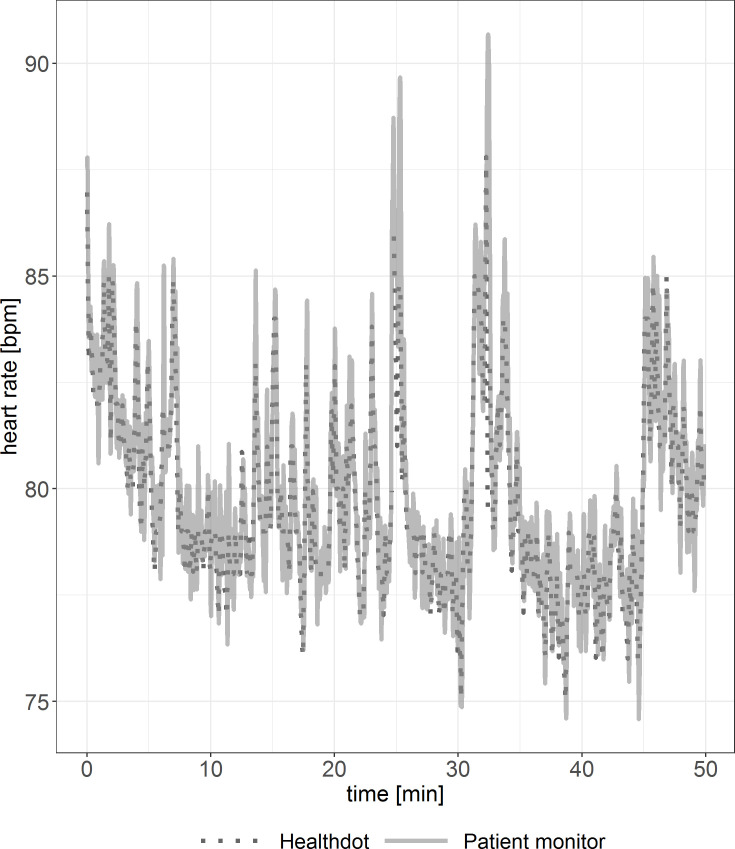
To observe the agreement between the two modalities, the HeartR vitals were evaluated for each patient. Discrepancies between patients are shown in Figs 2 and 3. In Fig 2, visual inspection shows good agreement. In Fig 3, outliers in the Healthdot vitals can be observed. In both graphs, some Healthdot data points are missing due to the excluded low quality data.

Fig 2. Example of HeartR vitals showing good agreement.

Fig 2

Reference standard (solid line) and Healthdot (dotted line) in bpm.

Fig 3. Example of HeartR vitals including outliers.

Fig 3

Reference standard (solid line) and Healthdot (dotted line) in bpm.

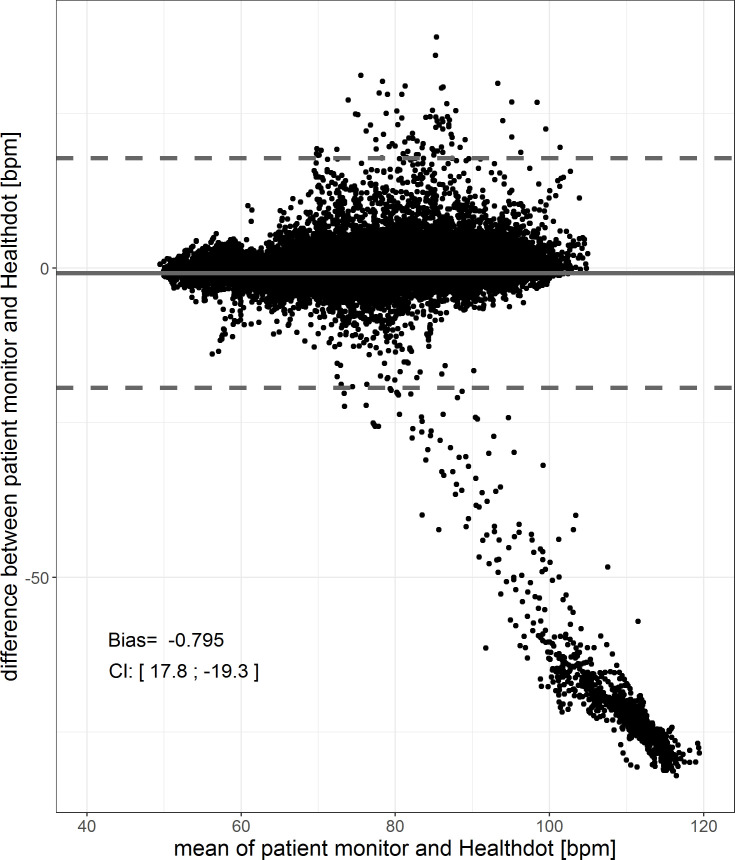
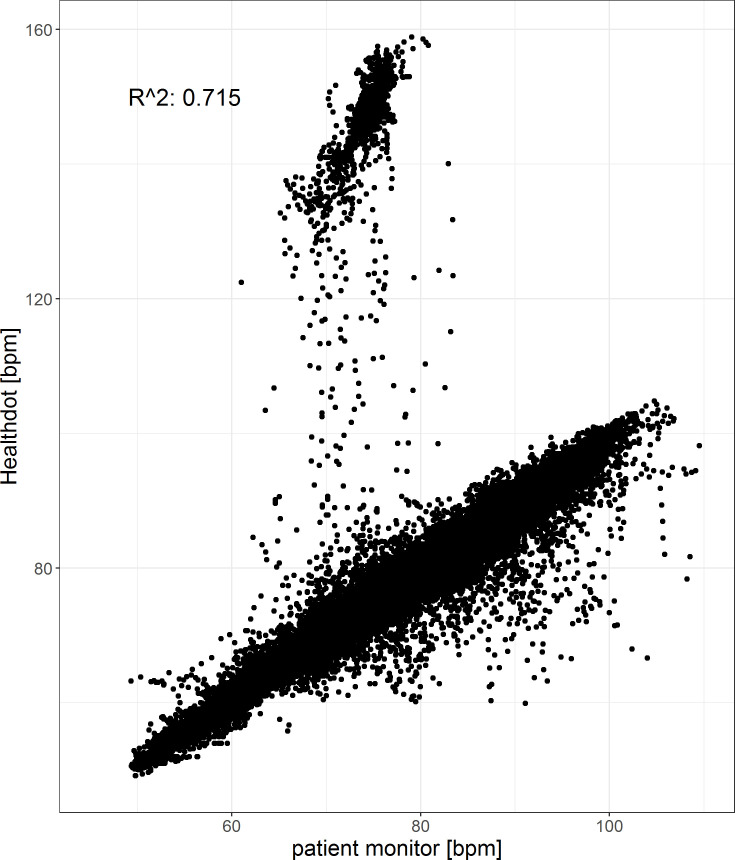
The results of the HeartR analysis for all patients are shown in Figs 4 and 5. The bias is -0.80 bpm and the CI is 17.8; -19.3 bpm. The Pearson correlation coefficient is 0.72, having a CI of [0.71:0.72] (p < 0.001). Both in the Bland-Altman plot as well as the correlation plot, outliers are observed. These are caused by higher HeartR values of the Healthdot with respect to those of the patient monitor. This was also observed in Fig 3.

Fig 4. Bland-Altman plot of the HeartR.

Fig 4

The difference between the two methods (Healthdot and patient monitor) is plotted against the average of the two, respectively on the y-axis and x-axis. The bias (-0.80 bpm) is indicated by the gray solid line and the confidence interval [CI: 17.8; -19.3 bpm] is indicated by the gray dashed lines.

Fig 5. Correlation plot of the HeartR.

Fig 5

The reference data (x-axis) is plotted against the Healthdot data (y-axis). The corresponding Pearson correlation coefficient is 0.72 (CI: [0.71:0.72], p < 0.001).

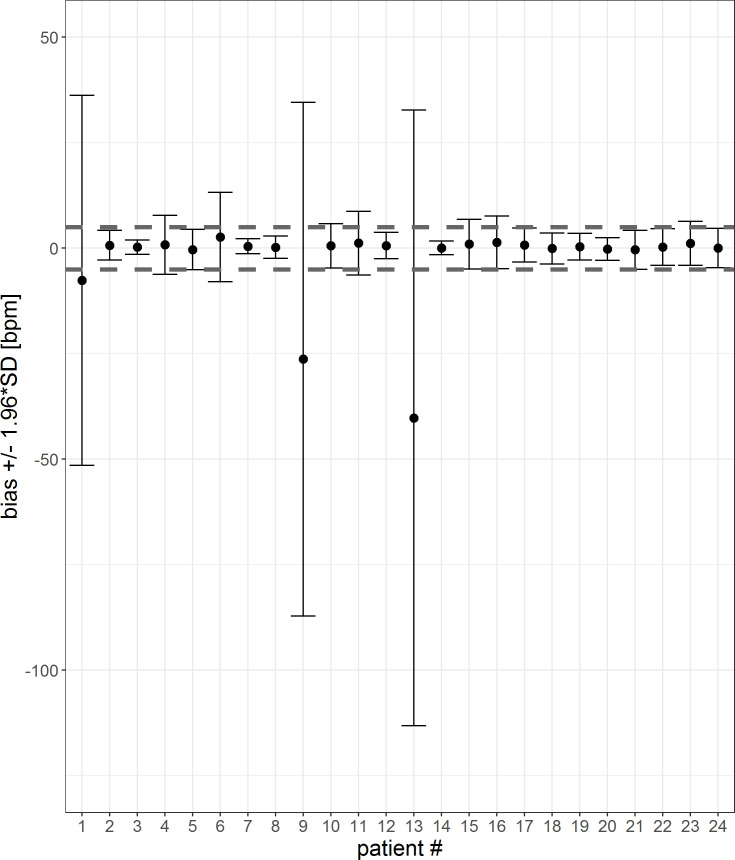
To visualize the impact and prevalence of the outliers, the mean difference and confidence interval for each patient is calculated for both a 1-sec-interval and a 5-min-average (Figs 6 and 7). HeartR accuracy was generally influenced negatively by the data of three patients (#1, #9 and #13). The tables corresponding to the figures are shown in the S1 and S2 Tables. For three patients (#6, #9 and #16) the 5-min-averaging results could not be created because there were too few data points to average over a 5-min-period.

Fig 6. Error bar of each patient for a 1-sec-interval.

Fig 6

The mean differences and confidence interval (bias +/- 1.96*SD) for each patient are plotted. Difference was calculated by subtracting patient monitor data from Healthdot data, based on a1-sec-interval. The gray dashed lines indicate the required threshold of 5 bpm.

Fig 7. Error bar of each patient for a 5-min-interval.

Fig 7

The mean differences and confidence interval (bias +/- 1.96*SD) for each patient are plotted. Difference was calculated by subtracting patient monitor data from Healthdot data, based on 5-min averages. The gray dashed lines indicate the required threshold of 5 bpm.

The percentage of patients who met the threshold of 5 bpm for both the mean differences as well as CI’s is visualized in Table 2 for both the 1 sec-interval and 5-min-averages. When averaging the data over a 5 minute period, accuracy is increased.

Table 2. Percentage of patients who met the threshold of 5 bpm for both the mean differences as well as CI for 1-sec averages and 5-min averages.

1-sec averages 5-min averages
Mean differences within threshold 87.5% 90.5%
CI within threshold 50.0% 90.5%

Respiration rate

For the analysis of RespR, 162 min (12%) of the 22.5 hours of recordings were excluded in the preprocessing phase because of low quality data (26 min from Healthdot, 136 min from patient monitor). Therefore, 19.8 hours of RespR measurement pairs were available for analysis. The median [IQR] duration in percentage of the low quality Healthdot data with respect to the total monitoring time was 1 [0, 3] %.

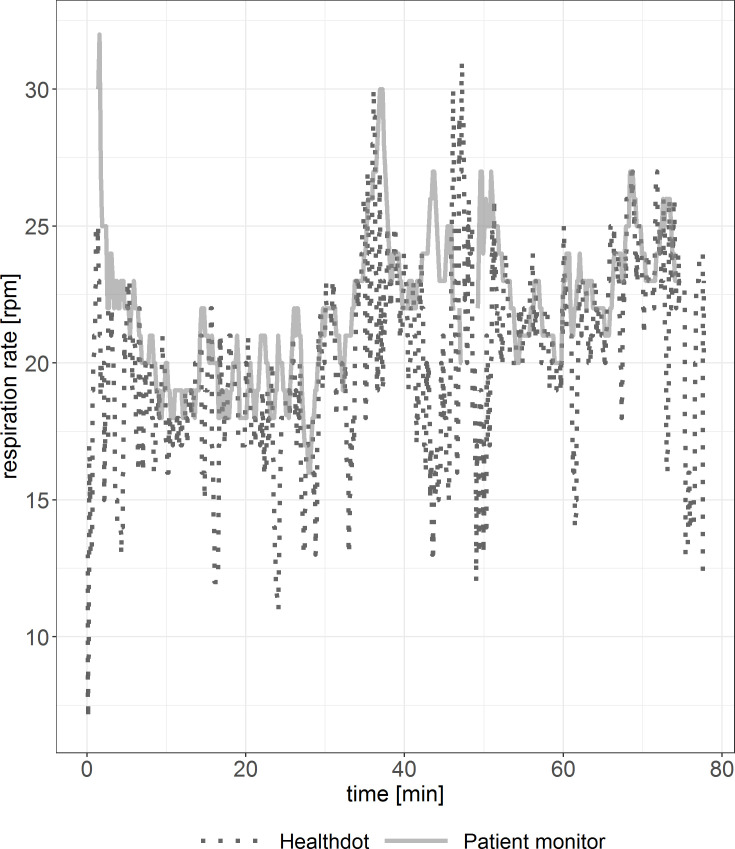
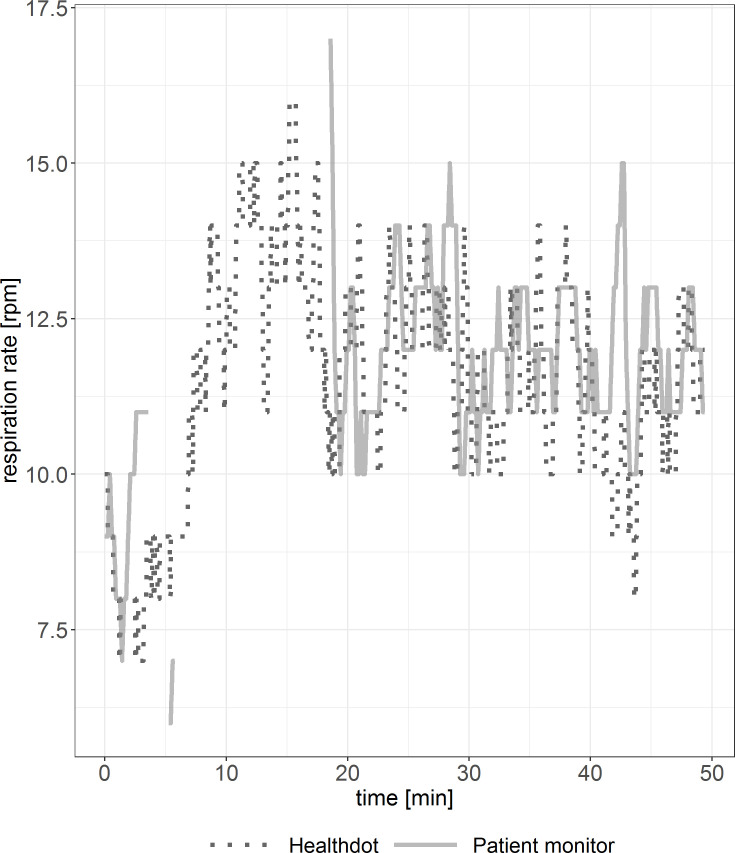
In Figs 8 and 9, RespR data of the Healthdot and patient monitor are shown for two patients. Periods of incoherent synchronization are observed in both figures, especially in Fig 9. Some data points are missing due to the excluded low-quality data.

Fig 8. Example of RespR vitals showing good agreement.

Fig 8

Reference standard (solid line) and Healthdot (dotted line) in rpm.

Fig 9. Example of RespR vitals suboptimal agreement.

Fig 9

Reference standard (solid line) and Healthdot (dotted line) in rpm.

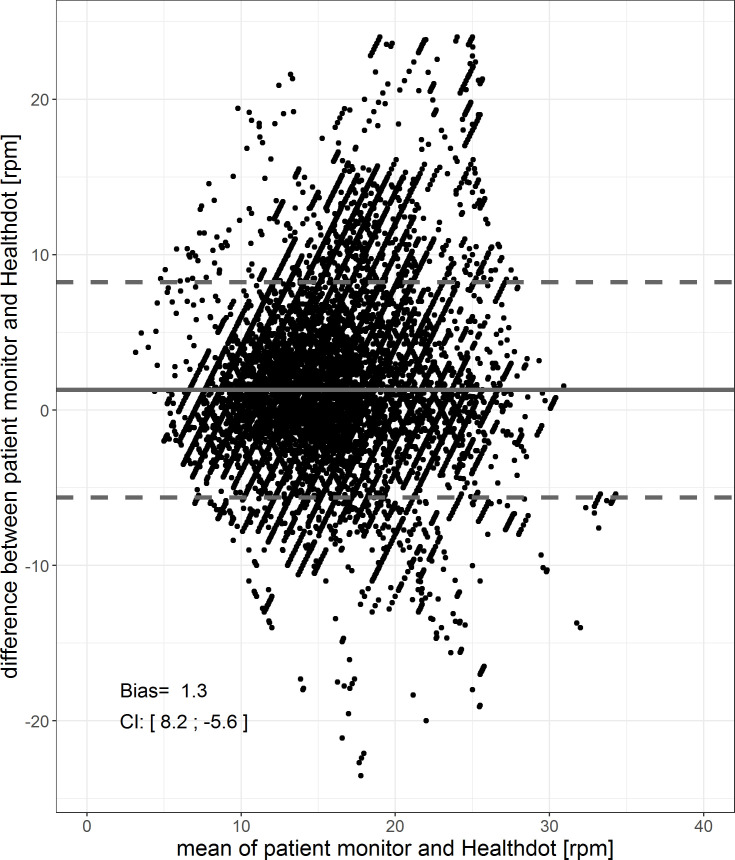
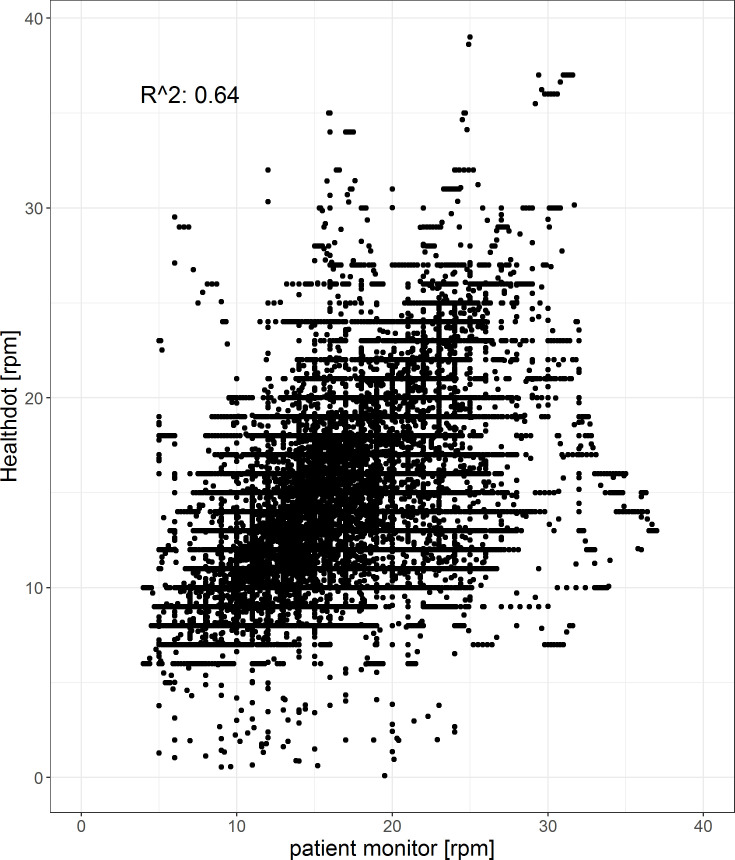
The results of the RespR analysis are shown in Figs 10 and 11. The bias is 1.3 and precision is 8.2; -5.6 rpm. The Pearson correlation coefficient is 0.64, having a CI of [0.636: 0.644] (p < 0.001).

Fig 10. Bland-Altman plot of the RespR.

Fig 10

The difference between the two methods (Healthdot and patient monitor) is plotted against the average of the two, respectively on the y-axis and x-axis. The bias (1.3 bpm) is indicated by the gray solid line and the confidence interval [CI: 8.2; -5.6 bpm] is indicated by the gray dashed lines.

Fig 11. Correlation plot of the RespR.

Fig 11

The reference data (x-axis) is plotted against the Healthdot data (y-axis). The corresponding Pearson correlation coefficient is 0.64 (CI: of [0.636: 0.644], p < 0.001).

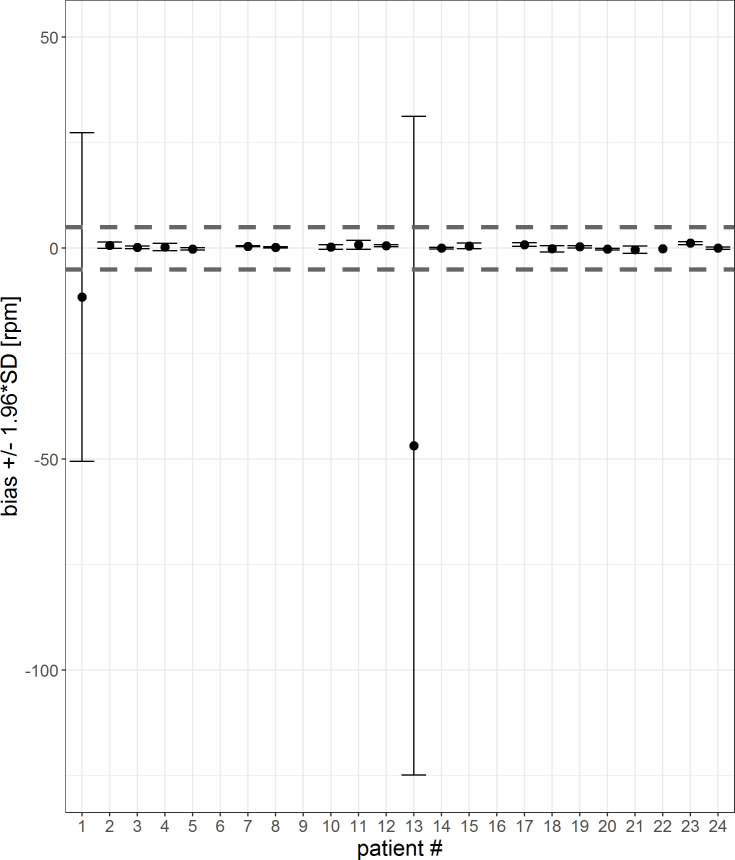
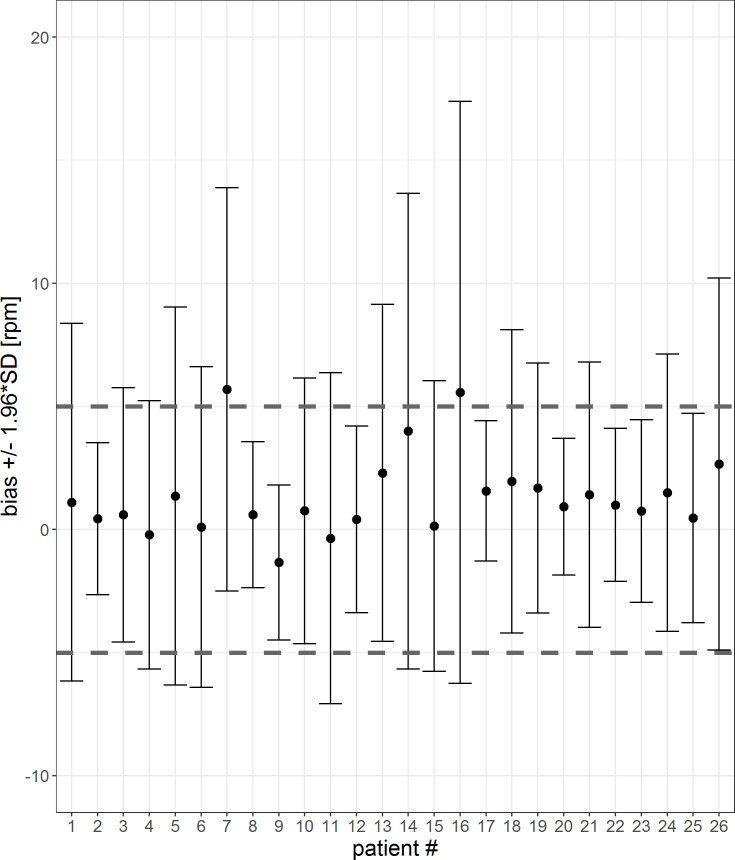
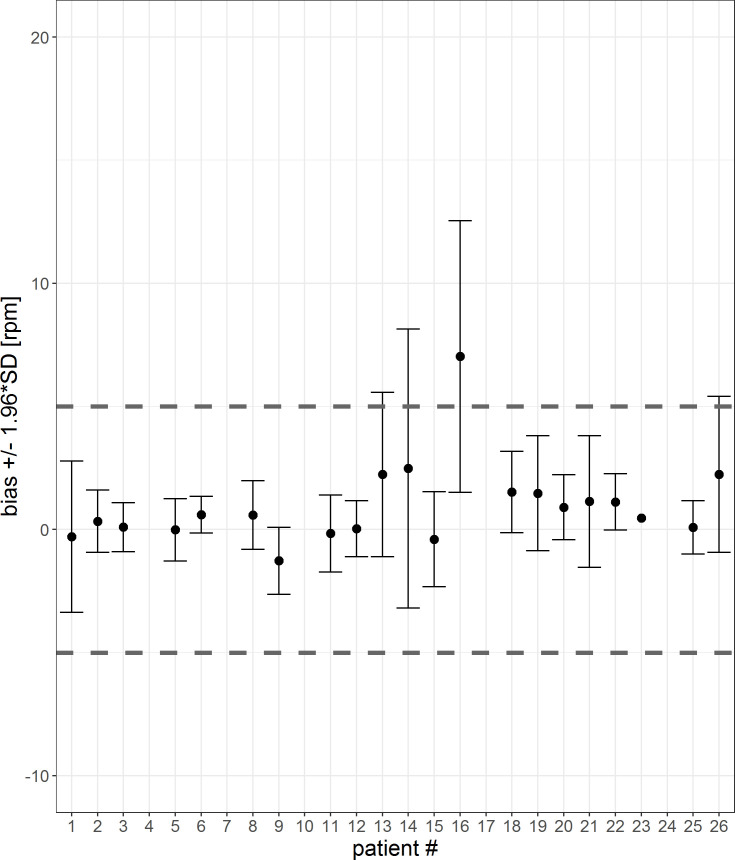
In Figs 12 and 13, the mean differences and confidence interval for each patient for 1-sec-interval and 5-min-averages are visualized. The corresponding tables are shown in the S3 and S4 Tables. For two patients (#7, #16) the mean differences are not within the threshold of 5 rpm. For five patients (#4, #7, #10, #17 and #24), the 5-min-averaged results could not be calculated because there were too few data points to average over a 5-minute interval.

Fig 12. Error bar of each patient for a 1-sec-interval.

Fig 12

The mean differences and confidence interval (bias +/- 1.96*SD) for each patient are plotted. Difference was calculated by subtracting patient monitor data from Healthdot data, based on a 1-sec-period. The gray dashed lines indicate the required threshold of 5 rpm.

Fig 13. Error bar of each patient for a 5-min-interval.

Fig 13

The mean differences and confidence interval (bias +/- 1.96*SD) for each patient are plotted. Difference was calculated by subtracting patient monitor data from Healthdot data, based on 5-min averages. The gray dashed lines indicate the required threshold of 5 rpm.

The percentage of patients who met the threshold of 5 rpm for both the mean differences as well as CIs are visualized in Table 3 for the 1 sec-averages and 5-min-averages. Accuracy increases after averaging over 5-min intervals.

Table 3. Percentage of patients who met the threshold of 5 rpm for both the mean differences as well as CI for 1-sec averages and 5-min averages.

1-sec-averages 5-min-averages
Mean differences within threshold 92.3% 95.2%
CI within threshold 34.6% 81.0%

Discussion

In this study we demonstrated that wireless accelerometry provides estimates of RespR and HeartR within 5 rpm and 5 bpm of the gold standard in 87.5% and 92.3% of the patients respectively for a 1-sec-period. If 5-min-averages are used, which will be the intended use of the system, 90.5% and 95.2% of the data has reached the threshold of 5 bpm/rpm for HeartR and RespR respectively, provided that the accelerometer signal was of sufficient quality.

Our finding that averaging over 5-min intervals presents a more accurate comparison between the two monitoring devices than averaging over 1-s intervals, implies that accelerometric vital signs assessment in bariatric patients may not be able to replace beat-to-beat reference methods. However, it could be an acceptable alternative in circumstances where vital signs assessments over longer intervals (typically 5 minutes and longer) are sufficient, such as the general ward or home situation. Averaging over a longer interval than 5 minutes was difficult in this study due to the short time period the patients were at the recovery department. However, when patients are at the general ward or at home, averaging over a longer period will be possible and probably more effective since longer measurement intervals were associated with improved accuracy.

The study of Li et al. researched the accuracy of respiratory rate, obtained from a wearable biosensor created by Philips [2]. They showed that 72.8% of biosensor-derived respiration rates were within 3 rpm of the capnography-derived respiration rates. The overall mean difference was 3.5 rpm (+/- 5.2 rpm). In this study, the threshold of 5 rpm was used according to the American National Standards. When the threshold of 3 rpm was used like by the study of Li et al., 88.5% of the patients met the criteria for RespR. Furthermore, the overall bias was 1.3 [SD: 3.5] rpm. Therefore, the Healthdot seems to be more accurate than the biosensor investigated by Li et al. Other advantages of the Healthdot with respect to the biosensor are the size of the monitoring system, the wireless design and the ability of remote monitoring. Breteler et al. reported the HealthPatch MD bio sensor (VitalConnect, San Jose, California, USA) was able to accurately measure HeartR with a deviation within 10% of the reference standard (ECG). The accuracy for RespR was outside the limit range considered acceptable [4]. A recent review shows that however several sensor designs are available, these require larger clinical trials to ensure accuracy and usability [16]. We believe that this study offers an appropriate study population in a clinical setting. We do believe that monitoring time per patient could be longer to ensure enough data to average over a 5-minute period.

One of the limitations of the Healthdot found in this study is the amount of low quality data for HeartR, which was 34.5% of the overall data. Because of this, a median [IQR] of 20% [6%, 58%] had to be excluded from analysis for each patient. Excluding 20% of the vital parameters is substantial, especially when the low quality data is clustered. In clinical practice, this can lead to empty data packages send to the cloud. The reason of the amount of the low quality data is unknown yet. Future research is needed to investigate whether this is due to the patient population included in this study, user error in placing the Healtdot or any other kind of malfunction. Furthermore it must be investigated in what degree the low quality data is clustered.

Another limitation was the presence of remarkably high values of three patients in the HeartR signal. These outliers affect the Bland-Altman and correlation plot. In clinical practice, these periods of increased HeartR vitals would give false tachycardia alarms. To prevent alarm fatigue by medical staff and to avoid making bad judgements on the measured vital signs in postoperative bariatric patients, improved measurements would be necessary. The exact reason of the outliers in the HeartR data is unknown yet. It is expected that the outliers are most likely caused by a combination of the measurement technique of the Healthdot and the physiological effect of the heart. Since the heart actually contracts twice in one heartbeat, the accelerometer could measure this as two contractions, which results in two heartbeats, making double frequencies visible in the data. To be able to make reliable clinical decisions in future, this could be either through an updated internal software of the Healthdot or implementation of a post-processing tool in the device which will exclude these abnormalities before sending it to the cloud server.

Furthermore, the use of the capnography-derived respiratory rate measurements was another limitation of this study. Capnography was used as the reference as it is currently considered the gold standard for monitoring perioperative patients [2]. However, this study has shown that capnography often shows unreliable signals. This is most likely caused by the nasal cannula, which may be uncomfortable and therefore may be moved or removed by the patient, leading to inaccurate measurements. To be able to validate the RespR of the Healthdot in a more accurate way, another reference parameter is required. Without a true gold standard, we are unable to determine the effect of errors on these findings.

A wireless and continuous monitoring device, like the Healthdot, could be used to detect early deterioration in postoperative patients. Future studies should focus on early detection of deterioration in both the hospital situation and the outpatient situation. Furthermore, the effect of continuous monitoring on clinical outcome and the possibility of early discharge of bariatric patients will be researched in a follow-up study.

Conclusion

The results of this study suggest that the Healthdot can provide quantitative assessment of HeartR and RespR of bariatric patients and is able to measure in an automatic, wireless and continuous way. Furthermore, Healthdot offers an accurate solution for both HeartR and RespR measurements when compared to ECG and capnography in clinical settings, since 87.5% of the patients met the HeartR requirements and 92.3% met the RespR requirements. Therefore, a new generation of lightweight wearable patient monitors, based on accelerometry measurements and not-requiring patient interaction, has potential value for remote monitoring of post-bariatric patients. Especially in situations where vital signs assessments over longer intervals (typically 5 minutes and longer) are sufficient, such as at the general ward or at home.

Supporting information

S1 Table. Differences of HeartR vitals between patient monitor and Healthdot per patient for a 1-sec-period.

Statistics of the HeartR vitals per patient on a 1-sec-period. The mean differences are shown in the first column, the CIs are shown in columns 2 and 3. The gray values are the values which exceed the threshold of 5 bpm.

(PDF)

S2 Table. Differences of HeartR vitals between patient monitor and Healthdot per patient for a 5-min-average.

Statistics of the HeartR vitals per patient on a 5-min- average. The mean differences are shown in the first column, the CIs are shown in columns 2 and 3. The gray values are the values which exceed the threshold of 5 bpm.

(PDF)

S3 Table. Differences of RespR vitals between patient monitor and Healthdot per patient for a 1-sec-period.

Statistics of the RespR vitals per patient on a 1-sec-period. The mean differences are shown in the first column, the CIs are shown in columns 2 and 3. The gray values are the values which exceed the threshold of 5 rpm.

(PDF)

S4 Table. Differences of RespR vitals between patient monitor and Healthdot per patient for a 5-min-average.

Statistics of the RespR vitals per patient on a 5-min- average. The mean differences are shown in the first column, the CIs are shown in columns 2 and 3. The gray values are the values which exceed the threshold of 5 rpm.

(PDF)

S1 Study protocol

(PDF)

Acknowledgments

The authors wish to thank the participants of this study, the hospital staff and Philips Research for their constructive and practical contributions.

Data Availability

We have uploaded the minimal anonymized dataset to Dryad repository (doi:10.5061/dryad.tb2rbp006).

Funding Statement

The author(s) received no specific funding for this work.

References

  • 1.Weenk M, van Goor H, Frietman B, Engelen LJ, van Laarhoven CJ, van de Belt TH et al. Continuous Monitoring of Vital Signs Using Wearable Devices on the General Ward: Pilot Study. JMIR Mhealth Uhealth. 2017. July 5;5(7):e91 10.2196/mhealth.7208 [DOI] [PMC free article] [PubMed] [Google Scholar]
  • 2.Li T, Divatia S, McKittrick J, Moss J, Hijnen NM, Becker LB. A pilot study of respiratory rate derived from a wearable biosensor compared with capnography in emergency department patients. Open Access Emerg Med. 2019;11:103–108. 10.2147/OAEM.S198842 [DOI] [PMC free article] [PubMed] [Google Scholar]
  • 3.Touw HRW. Continuous remote monitoring and point-of-care lung ultrasound to detect clinical deterioration and postoperative complications [dissertation]. Vrije Universiteit, Amsterdam; 2019. [Google Scholar]
  • 4.Breteler MJM, Huizinga E, van Loon K, Leenen LPH, Dohmen DAJ, Kalkman CJ, et al. Reliability of wireless monitoring using a wearable patch sensor in high-risk surgical patients at a step-down unit in the Netherlands: a clinical validation study. BMJ Open 2018;8:e020162. 10.1136/bmjopen-2017-020162 [DOI] [PMC free article] [PubMed] [Google Scholar]
  • 5.Kroll RR, Boyd JG, Maslove DM. Accuracy of a wrist-worn wearable device for monitoring heart rates in hospital inpatients: a prospective observational study. J Med Internet Res. 2016. September 20;18(9):e253. 10.2196/jmir.6025 [DOI] [PMC free article] [PubMed] [Google Scholar]
  • 6.Appelboom G, Camacho E, Abraham ME, Bruce SS, Dumont EL, Zacharia BE, et al. Smart wearable body sensors for patient self-assessment and monitoring. Arch Public Health. 2014. August;72(1):28. 10.1186/2049-3258-72-28 [DOI] [PMC free article] [PubMed] [Google Scholar]
  • 7.Boatin A.A., Wylie B.J., Goldfarb I., et al.: Wireless vital sign monitoring in pregnant women: a functionality and acceptability study. Telemed J E Health 2016; 22: pp. 564–571. 10.1089/tmj.2015.0173 [DOI] [PubMed] [Google Scholar]
  • 8.Yang CC, Hsu YL. A review of accelerometry-based wearable motion detectors for physical activity monitoring. Sensors (Basel). 2010;10(8):7772–7788. 10.3390/s100807772 [DOI] [PMC free article] [PubMed] [Google Scholar]
  • 9.DiRienzo M., Vaini E., Castiglioni P., Merati G., Meriggi P., Parati G., et al. Wearable seismocardiography: towards a beat-by-beat assessment of cardiac mechanics in ambulant subjects. Auton. Neurosci. 2013. 178:50–5. 10.1016/j.autneu.2013.04.005 [DOI] [PubMed] [Google Scholar]
  • 10.Etemadi M, Inan OT. Wearable ballistocardiogram and seismocardiogram systems for health and performance. J Appl Physiol (1985). 2018;124(2):452–461. 10.1152/japplphysiol.00298.2017 [DOI] [PMC free article] [PubMed] [Google Scholar]
  • 11.Lu M, Zhong W, Yu-Xiu L, Miao H, Li Y, Ji M, Sample Size for Assessing Agreement between Two Methods of Measurement by Bland-Altman Method (2016). [DOI] [PubMed] [Google Scholar]
  • 12.ANSI/AAMI. Cardiac Monitors, Heart Rate Meters, and Alarms. Arlington: American National Standards Institute, Inc; 2002. [Google Scholar]
  • 13.Bland J. M.; Altman D. G., Statistical methods for assessing agreement between two methods of clinical measurement. Lancet (London, England) 1986, 1, (8476), 307–10. [PubMed] [Google Scholar]
  • 14.Bland J. M.; Altman D. G., Agreement between methods of measurement with multiple observations per individual. J Biopharm Stat 2007, 17, (4), 571–82. 10.1080/10543400701329422 [DOI] [PubMed] [Google Scholar]
  • 15.Zou G. Y., Confidence interval estimation for the Bland-Altman limits of agreement with multiple observations per individual. Stat Methods Med Res 2013, 22, (6), 630–42. 10.1177/0962280211402548 [DOI] [PubMed] [Google Scholar]
  • 16.Joshi M, Ashrafian H, Aufegger L, Khan S, Arora S, Cooke G, et al. , Wearable sensors to improve detection of patient deterioration. Expert Rev Med Devices. 2019. February;16(2):145–154. 10.1080/17434440.2019.1563480 [DOI] [PubMed] [Google Scholar]

Decision Letter 0

Yutaka Kondo

17 Dec 2020

PONE-D-20-29197

Reliability of heart rate and respiration rate measurements with a wireless accelerometer in postbariatric recovery

PLOS ONE

Dear Dr. Scheerhoorn,

Thank you for submitting your manuscript to PLOS ONE. After careful consideration, we feel that it has merit but does not fully meet PLOS ONE’s publication criteria as it currently stands. Therefore, we invite you to submit a revised version of the manuscript that addresses the points raised during the review process.

We have care fully evaluated your manuscript and make this judgement. Please see and reply our reviewers comments. Thank you very much, again.

Please submit your revised manuscript by Jan 31 2021 11:59PM. If you will need more time than this to complete your revisions, please reply to this message or contact the journal office at plosone@plos.org. When you're ready to submit your revision, log on to https://www.editorialmanager.com/pone/ and select the 'Submissions Needing Revision' folder to locate your manuscript file.

Please include the following items when submitting your revised manuscript:

  • A rebuttal letter that responds to each point raised by the academic editor and reviewer(s). You should upload this letter as a separate file labeled 'Response to Reviewers'.

  • A marked-up copy of your manuscript that highlights changes made to the original version. You should upload this as a separate file labeled 'Revised Manuscript with Track Changes'.

  • An unmarked version of your revised paper without tracked changes. You should upload this as a separate file labeled 'Manuscript'.

If you would like to make changes to your financial disclosure, please include your updated statement in your cover letter. Guidelines for resubmitting your figure files are available below the reviewer comments at the end of this letter.

If applicable, we recommend that you deposit your laboratory protocols in protocols.io to enhance the reproducibility of your results. Protocols.io assigns your protocol its own identifier (DOI) so that it can be cited independently in the future. For instructions see: http://journals.plos.org/plosone/s/submission-guidelines#loc-laboratory-protocols

We look forward to receiving your revised manuscript.

Kind regards,

Yutaka Kondo

Academic Editor

PLOS ONE

Journal Requirements:

When submitting your revision, we need you to address these additional requirements.

1. Please ensure that your manuscript meets PLOS ONE's style requirements, including those for file naming. The PLOS ONE style templates can be found at

https://journals.plos.org/plosone/s/file?id=wjVg/PLOSOne_formatting_sample_main_body.pdf and

https://journals.plos.org/plosone/s/file?id=ba62/PLOSOne_formatting_sample_title_authors_affiliations.pdf

2. We noted that submitted this study as a clinical trial, but according to your description and the WHO definition of clinical trials we would not consider this a clinical trial. This is because you do not assess the effects of the wearable device on health outcomes. In order to avoid confusion we would suggest that you avoid referring to this study or its parent as a clinical trial. We also suggest removing any references to TREND in your flow diagram.

3. Thank you for including your ethics statement: "The study population is a subset of the overall study population of the TRICA study. The TRICA Study NCT03923127 (NL7602, PJ-013483 FLAGSHIP Transitional Care Study  Formal approval for this study was obtained from the ethical committee (W19.001). Written informed consent was obtained from all participants prior to commencing any research procedures."   

a. Please amend your current ethics statement to include the full name of the ethics committee/institutional review board(s) that approved your specific study.

b. Once you have amended this/these statement(s) in the Methods section of the manuscript, please add the same text to the “Ethics Statement” field of the submission form (via “Edit Submission”).

 For additional information about PLOS ONE ethical requirements for human subjects research, please refer to http://journals.plos.org/plosone/s/submission-guidelines#loc-human-subjects-research.

4. In your Methods section, please provide additional information about the participant recruitment method and the demographic details of your participants. Please ensure you have provided sufficient details to replicate the analyses such as a table of relevant demographic details.

5. Please provide a sample size and power calculation in the Methods, or discuss the reasons for not performing one before study initiation.

6. In the Methods section, please provide the source of the Healthdot.

7. We note that Figure 1 in your submission contain copyrighted images. All PLOS content is published under the Creative Commons Attribution License (CC BY 4.0), which means that the manuscript, images, and Supporting Information files will be freely available online, and any third party is permitted to access, download, copy, distribute, and use these materials in any way, even commercially, with proper attribution. For more information, see our copyright guidelines: http://journals.plos.org/plosone/s/licenses-and-copyright.

We require you to either (1) present written permission from the copyright holder to publish these figures specifically under the CC BY 4.0 license, or (2) remove the figures from your submission:

7.1.         You may seek permission from the original copyright holder of Figure 1 to publish the content specifically under the CC BY 4.0 license.

We recommend that you contact the original copyright holder with the Content Permission Form (http://journals.plos.org/plosone/s/file?id=7c09/content-permission-form.pdf) and the following text:

“I request permission for the open-access journal PLOS ONE to publish XXX under the Creative Commons Attribution License (CCAL) CC BY 4.0 (http://creativecommons.org/licenses/by/4.0/). Please be aware that this license allows unrestricted use and distribution, even commercially, by third parties. Please reply and provide explicit written permission to publish XXX under a CC BY license and complete the attached form.”

Please upload the completed Content Permission Form or other proof of granted permissions as an "Other" file with your submission. 

In the figure caption of the copyrighted figure, please include the following text: “Reprinted from [ref] under a CC BY license, with permission from [name of publisher], original copyright [original copyright year].”

7.2.    If you are unable to obtain permission from the original copyright holder to publish these figures under the CC BY 4.0 license or if the copyright holder’s requirements are incompatible with the CC BY 4.0 license, please either i) remove the figure or ii) supply a replacement figure that complies with the CC BY 4.0 license. Please check copyright information on all replacement figures and update the figure caption with source information. If applicable, please specify in the figure caption text when a figure is similar but not identical to the original image and is therefore for illustrative purposes only.

8. Thank you for stating the following in the Competing Interests section:

" R. Bouwman act as clinical consultant for Philips Research in Eindhoven, The Netherlands. This does not alter our adherence to PLOS ONE policies on sharing data and materials. "

Please confirm that this does not alter your adherence to all PLOS ONE policies on sharing data and materials, by including the following statement: "This does not alter our adherence to  PLOS ONE policies on sharing data and materials.” (as detailed online in our guide for authors http://journals.plos.org/plosone/s/competing-interests).  If there are restrictions on sharing of data and/or materials, please state these. Please note that we cannot proceed with consideration of your article until this information has been declared.

Please include your updated Competing Interests statement in your cover letter; we will change the online submission form on your behalf.

Please know it is PLOS ONE policy for corresponding authors to declare, on behalf of all authors, all potential competing interests for the purposes of transparency. PLOS defines a competing interest as anything that interferes with, or could reasonably be perceived as interfering with, the full and objective presentation, peer review, editorial decision-making, or publication of research or non-research articles submitted to one of the journals. Competing interests can be financial or non-financial, professional, or personal. Competing interests can arise in relationship to an organization or another person. Please follow this link to our website for more details on competing interests: http://journals.plos.org/plosone/s/competing-interests

9. We note that you have stated that you will provide repository information for your data at acceptance. Should your manuscript be accepted for publication, we will hold it until you provide the relevant accession numbers or DOIs necessary to access your data. If you wish to make changes to your Data Availability statement, please describe these changes in your cover letter and we will update your Data Availability statement to reflect the information you provide.

[Note: HTML markup is below. Please do not edit.]

Reviewers' comments:

Reviewer's Responses to Questions

Comments to the Author

1. Is the manuscript technically sound, and do the data support the conclusions?

The manuscript must describe a technically sound piece of scientific research with data that supports the conclusions. Experiments must have been conducted rigorously, with appropriate controls, replication, and sample sizes. The conclusions must be drawn appropriately based on the data presented.

Reviewer #1: Partly

Reviewer #2: Yes

Reviewer #3: No

Reviewer #4: Yes

**********

2. Has the statistical analysis been performed appropriately and rigorously?

Reviewer #1: No

Reviewer #2: Yes

Reviewer #3: No

Reviewer #4: N/A

**********

3. Have the authors made all data underlying the findings in their manuscript fully available?

The PLOS Data policy requires authors to make all data underlying the findings described in their manuscript fully available without restriction, with rare exception (please refer to the Data Availability Statement in the manuscript PDF file). The data should be provided as part of the manuscript or its supporting information, or deposited to a public repository. For example, in addition to summary statistics, the data points behind means, medians and variance measures should be available. If there are restrictions on publicly sharing data—e.g. participant privacy or use of data from a third party—those must be specified.

Reviewer #1: No

Reviewer #2: Yes

Reviewer #3: No

Reviewer #4: Yes

**********

4. Is the manuscript presented in an intelligible fashion and written in standard English?

PLOS ONE does not copyedit accepted manuscripts, so the language in submitted articles must be clear, correct, and unambiguous. Any typographical or grammatical errors should be corrected at revision, so please note any specific errors here.

Reviewer #1: No

Reviewer #2: Yes

Reviewer #3: Yes

Reviewer #4: Yes

**********

5. Review Comments to the Author

Please use the space provided to explain your answers to the questions above. You may also include additional comments for the author, including concerns about dual publication, research ethics, or publication ethics. (Please upload your review as an attachment if it exceeds 20,000 characters)

Reviewer #1: This paper presents an interesting study on the use of a wearable device, called Healthdot, towards continuous monitoring of heart rate and respiratory rate in post-bariatric surgery patients. The paper is mostly focussed on a clinical study using an existing wearable device, rather than any novel technical / engineering perspective in design, development or data analytics. The following points are of concern:

1. The paper lacks substantial references. Example: in introduction please refer to several previous literature of use of wearables for continuous monitoring, introduce what are the challenges in bariatric surgery that requires particularly monitoring of heart rate etc. The motivation for use particularly in bariatric surgery is not clear.

2. The paper concludes that the device may be suitable for long term monitoring in home but not particularly suitable for bariatric patients for short term monitoring after surgery, based on the results. The finding is interesting, but it clashes with the idea of the use of the device in post-bariatric surgery monitoring. There is also no comparison or reference to any other wearable device which has been used in post-surgical monitoring.

3. A lot of data was excluded because of low quality. How does that affect the practical use of the device?

4. For heart rate monitoring outliers in healthdot data observed in Fig. 3. This is further reflected in Figs. 4 and 5. Is there an explanation for those outliers?

5. The process of time synchronization of reference data and healthdot measurements (section: Data preprocessing) lacks clarity.

6. In Data Preprocessing, it is observed that only internally stored data was evaluated, however, for practical purposes, it will be the transmitted data that will be used, right? If it has lower sampling frequency then will it perform poorly? Has that been studied?

7. In Data Preprocessing, what does actual logging mean and how is it measured?

8. All figures are of very poor quality.

Reviewer #2: In this paper, the authors assessed the reliability of heart rate and respiration rate measured by the Healthdot in comparison to the gold standard, the bedside patient monitor. The work is technically sound and well written. Please find the comments below.

1. Each paragraph should be aligned.

2. There are a lot of data being labelled “low data quality”. Please explain the reasons.

3. Perhaps the authors can include the Healthdot datasheet in appendix since some limitations arises from the hardware itself such as 5-minute interval update.

Reviewer #3: PONE-D-20-29197: statistical review

SUMMARY. This study compares measurements of heart rate and respiration rate, as taken by a novel wireless device to measurements made by the gold standard, the bedside patient monitor. The statistical analysis is based on the Balnd-Altam method, which tests the agreement between two different assays. I have two major concerns about this paper, which require a full revision of the statistical analysis.

MAJOR ISSUES:

1) As far as I know, the Bland-Altam method assumes independent data. The data of this study are however repeated measures and, as such, they are dependent. The authors say that they use the "Bland-Altman method for repeated measurements" (line 145), perhaps alluding to some kind of correction to account for dependent observations. However, this is not clarified. Anyway, the standard approach to repeated measures analysis relies on random effects models. The statistical analysis should be fully revised by taking this approach.

2) We do know something about the subjects under study (age, gender,, BMI, weight). However, this information was not used in the study. Why? Do we know that these covariates do not influence the measurements? Can the sample be considered homogeneous? Does the covariate distribution reflect the distribution of the population of interest? The analysis should be revised by accounting for the available covariates:\\. Under this setting, random effects models provide a flexible framework to analyze repeated measurements, conditionally on covariate values.

Reviewer #4: The author assessed the reliability of heart rate and respiration rate measured by the accelerometer-based device ,Healthdot, compared to the gold standard, the bedside patient monitor, during the postoperative period in bariatric patients. However, the manuscript do little contribute anything new and is not very referable. In whole, the paper cannot be accepted by PLOS ONE.

Other comments:

1. the full name of HeartRand RespR should be given in Abstract when mentioned for the first time.

2. Too few references.

3. On Line 165, ‘…nearly 20.5 hours of HeartR data were used in the analysis’. but on line 173, 473 min excluded,14.6hours available, which is ambiguous.

4. Figure 2, different line types should be used for comparison.

**********

6. PLOS authors have the option to publish the peer review history of their article (what does this mean?). If published, this will include your full peer review and any attached files.

If you choose “no”, your identity will remain anonymous but your review may still be made public.

Do you want your identity to be public for this peer review? For information about this choice, including consent withdrawal, please see our Privacy Policy.

Reviewer #1: Yes: M Palaniswami

Reviewer #2: No

Reviewer #3: No

Reviewer #4: No

[NOTE: If reviewer comments were submitted as an attachment file, they will be attached to this email and accessible via the submission site. Please log into your account, locate the manuscript record, and check for the action link "View Attachments". If this link does not appear, there are no attachment files.]

While revising your submission, please upload your figure files to the Preflight Analysis and Conversion Engine (PACE) digital diagnostic tool, https://pacev2.apexcovantage.com/. PACE helps ensure that figures meet PLOS requirements. To use PACE, you must first register as a user. Registration is free. Then, login and navigate to the UPLOAD tab, where you will find detailed instructions on how to use the tool. If you encounter any issues or have any questions when using PACE, please email PLOS at figures@plos.org. Please note that Supporting Information files do not need this step.

PLoS One. 2021 Apr 28;16(4):e0247903. doi: 10.1371/journal.pone.0247903.r002

Author response to Decision Letter 0


30 Jan 2021

Dear Editor,

Thank you very much for the opportunity to re-submit our manuscript after revision. We addressed to each suggestion or comment of the reviewer as described below. These changes have been highlighted in the manuscript. We believe the comments and suggestions by the reviewers have improved this revision. We are looking forward to hearing from you.

Sincerely yours,

Fleur Jacobs, Jai Scheerhoorn, Eveline Mestrom, Jonna v.d. Stam, R. Arthur Bouwman, Simon Nienhuijs

1. Please ensure that your manuscript meets PLOS ONE's style requirements, including those for file naming.

Response:

We thank the editor for this comment and his/her time to thoroughly review this manuscript. We have checked the manuscript and files for coherence to the PLOS ONE style requirements.

2. We noted that submitted this study as a clinical trial, but according to your description and the WHO definition of clinical trials we would not consider this a clinical trial. This is because you do not assess the effects of the wearable device on health outcomes. In order to avoid confusion we would suggest that you avoid referring to this study or its parent as a clinical trial. We also suggest removing any references to TREND in your flow diagram.

Response:

We avoided referring to this study or its parent as a clinical trial and removed any mention of TREND in our flow diagram.

3. Thank you for including your ethics statement: "The study population is a subset of the overall study population of the TRICA study. The TRICA Study NCT03923127 (NL7602, PJ-013483 FLAGSHIP Transitional Care Study Formal approval for this study was obtained from the ethical committee (W19.001). Written informed consent was obtained from all participants prior to commencing any research procedures."

a. Please amend your current ethics statement to include the full name of the ethics committee/institutional review board(s) that approved your specific study.

b. Once you have amended this/these statement(s) in the Methods section of the manuscript, please add the same text to the “Ethics Statement” field of the submission form (via “Edit Submission”).

Response:

a. We have included the full name of the ethics committee that approved our study.

b. We have edited the “Ethics Statement” field of the submission form.

4. In your Methods section, please provide additional information about the participant recruitment method and the demographic details of your participants. Please ensure you have provided sufficient details to replicate the analyses such as a table of relevant demographic details.

Response:

We have added additional information about the participant recruitment method and demographic details of our participants (see Table 1).

5. Please provide a sample size and power calculation in the Methods, or discuss the reasons for not performing one before study initiation.

Response:

We have added a sample size and power calculation to the Methods section.

6. In the Methods section, please provide the source of the Healthdot.

Response:

We have added the source of the Healthdot (Philips Electronic Nederland BV) to the method section.

7. We note that Figure 1 in your submission contain copyrighted images. All PLOS content is published under the Creative Commons Attribution License (CC BY 4.0), which means that the manuscript, images, and Supporting Information files will be freely available online, and any third party is permitted to access, download, copy, distribute, and use these materials in any way, even commercially, with proper attribution.

Response:

We have obtained written permission from the copyright holder to publish this figure. We will add the completed Content Permission Form as an "Other" file with our submission. Also we changed the figure caption accordingly.

8. Thank you for stating the following in the Competing Interests section:

" R. Bouwman act as clinical consultant for Philips Research in Eindhoven, The Netherlands. This does not alter our adherence to PLOS ONE policies on sharing data and materials. "

Please confirm that this does not alter your adherence to all PLOS ONE policies on sharing data and materials, by including the following statement: "This does not alter our adherence to PLOS ONE policies on sharing data and materials.”. If there are restrictions on sharing of data and/or materials, please state these. Please note that we cannot proceed with consideration of your article until this information has been declared.

Please include your updated Competing Interests statement in your cover letter; we will change the online submission form on your behalf.

Response:

We confirm that this does not alter our adherence to all PLOS ONE policies on sharing data and materials. We will include our updated Competing Interests statement in our cover letter.

9. We note that you have stated that you will provide repository information for your data at acceptance. Should your manuscript be accepted for publication, we will hold it until you provide the relevant accession numbers or DOIs necessary to access your data. If you wish to make changes to your Data Availability statement, please describe these changes in your cover letter and we will update your Data Availability statement to reflect the information you provide.

Response:

We do not wish to make changes to our Data Availability statement.

Reviewer 1

This paper presents an interesting study on the use of a wearable device, called Healthdot, towards continuous monitoring of heart rate and respiratory rate in post-bariatric surgery patients. The paper is mostly focussed on a clinical study using an existing wearable device, rather than any novel technical / engineering perspective in design, development or data analytics. The following points are of concern:

Response:

We thank the reviewer for this comment and his/her time to thoroughly review this manuscript. We addressed each comment below.

1. The paper lacks substantial references. Example: in introduction please refer to several previous literature of use of wearables for continuous monitoring, introduce what are the challenges in bariatric surgery that requires particularly monitoring of heart rate etc. The motivation for use particularly in bariatric surgery is not clear.

Response:

We have added references regarding of use of wearables for continuous monitoring, to embed our paper in previous literature. Also, we added motivation for use of the Healthdot device in bariatric surgery.

2. The paper concludes that the device may be suitable for long term monitoring in home but not particularly suitable for bariatric patients for short term monitoring after surgery, based on the results. The finding is interesting, but it clashes with the idea of the use of the device in post-bariatric surgery monitoring. There is also no comparison or reference to any other wearable device which has been used in post-surgical monitoring.

Response:

Indeed we find that averaging vital signs over a 5-minute interval increases accuracy. However, we do believe that this does not necessarily mean the Healthdot is not suitable for post-bariatric surgery monitoring. The most common early post-bariatric complication is bleeding, which are usually mild and slow and occur in the first 12 to 24 hours. This complication is accompanied by a raise in heartrate, which even when measured every 5-minutes will still be recognized in time. To add comparison to other wearable devices used in post-surgical monitoring we added references.

3. A lot of data was excluded because of low quality. How does that affect the practical use of the device?

Response:

We understand the concerns raised by the reviewer. We added a section on the practical use of the device in our discussion.

“Excluding 20% of the vital parameters is substantial, especially when the low quality data is clustered. For clinical practice, this can lead to empty data packages send to the cloud. The reason of the amount of the low quality data is unknown yet. Future research is needed to investigate whether this is due to the patient population included in this study, user error in placing the Healtdot or any other kind of malfunction. Furthermore it must be investigated in what degree the low quality data is clustered. “

4. For heart rate monitoring outliers in healthdot data observed in Fig. 3. This is further reflected in Figs. 4 and 5. Is there an explanation for those outliers?

Response:

The exact reason of the outliers in the HeartR data is unknown yet. It is expected that the outliers are most likely caused by a combination of the measurement technique of the Healthdot and the physiological effect of the heart. Since the heart actually contracts twice in one heartbeat, the accelerometer could measure this as two contractions, which results in two heartbeats, making double frequencies visible in the data. To be able to make reliable clinical decisions in future, this could be either through an updated internal software of the Healthdot or implementation of a post-processing tool in the device which will exclude these abnormalities before sending it to the cloud server. We have added this paragraph to our manuscript.

5. The process of time synchronization of reference data and healthdot measurements (section: Data preprocessing) lacks clarity.

Response:

Extracted reference from the patient monitor and Healthdot measurements were represented on the same time frequency (1 value/second) and then time-synchronized. The synchronization procedure included as first step a fixed time shift of the Healthdot measurements by applying the time lag corresponding to the maximum of the cross-correlation function between reference and Healthdot measurements. The second step corresponded to a visual inspection of the offset-corrected Healthdot measurement and the reference to fine tune the selected offset in three different instances of the recording so to identify via these offsets eventual clock drifts. Clock drift was defined as any progressive increase or decrease in the offset over time, which was then corrected by linear interpolation of the time offset along the measurement samples. Only intervals with quality index > 0 (scale 0-100) were retained. We added this paragraph to our manuscript to clarify the process of time synchronization of reference data and Healthdot measurements.

6. In Data Preprocessing, it is observed that only internally stored data was evaluated, however, for practical purposes, it will be the transmitted data that will be used, right? If it has lower sampling frequency then will it perform poorly? Has that been studied?

Response:

For this analysis, internally stored data was evaluated instead of transmitted data. These both have the same sampling frequency, but the transmitted data has already been averaged over a 5-minute interval (before transmission). Since that will be the clinical use of this medical device, the internally stored data was averaged over a 5-minute interval as to mimic the clinical practice.

7. In Data Preprocessing, what does actual logging mean and how is it measured?

Response:

Before applying the Healthdot, the sensor was activated and its identification number was linked to the study number of the patient. These activities were completed by the researchers just before the patient arrived the recovery department. It is at that point in time the Healthdot starts logging (measuring parameters). We have edited the manuscript to clarify this term.

8. All figures are of very poor quality.

Response:

We have edited the figures.

Reviewer #2: In this paper, the authors assessed the reliability of heart rate and respiration rate measured by the Healthdot in comparison to the gold standard, the bedside patient monitor. The work is technically sound and well written. Please find the comments below.

Response:

We thank the reviewer for this comment and his/her time to thoroughly review this manuscript. We addressed each comment below.

1. Each paragraph should be aligned.

Response:

We have aligned each paragraph

2. There are a lot of data being labelled “low data quality”. Please explain the reasons.

Response:

The reason of the amount of the low quality data is unknown yet. Future research is needed to investigate whether this is due to the patient population included in this study, user error in placing the Healtdot or any other kind of malfunction. Furthermore it must be investigated in what degree the low quality data is clustered. We have added a paragraph in the manuscript to address this.

3. Perhaps the authors can include the Healthdot datasheet in appendix since some limitations arises from the hardware itself such as 5-minute interval update.

Response;

Unfortunately an official datasheet is not yet available.

Reviewer #3: PONE-D-20-29197: statistical review

SUMMARY. This study compares measurements of heart rate and respiration rate, as taken by a novel wireless device to measurements made by the gold standard, the bedside patient monitor. The statistical analysis is based on the Balnd-Altam method, which tests the agreement between two different assays. I have two major concerns about this paper, which require a full revision of the statistical analysis.

Response:

We thank the reviewer for this comment and his/her time to thoroughly review this manuscript. We addressed each comment below.

MAJOR ISSUES:

1) As far as I know, the Bland-Altam method assumes independent data. The data of this study are however repeated measures and, as such, they are dependent. The authors say that they use the "Bland-Altman method for repeated measurements" (line 145), perhaps alluding to some kind of correction to account for dependent observations. However, this is not clarified. Anyway, the standard approach to repeated measures analysis relies on random effects models. The statistical analysis should be fully revised by taking this approach.

Response:

We have added literature which, we believe, justifies using the Bland-Altman method for repeated measurements.

2) We do know something about the subjects under study (age, gender,, BMI, weight). However, this information was not used in the study. Why? Do we know that these covariates do not influence the measurements? Can the sample be considered homogeneous? Does the covariate distribution reflect the distribution of the population of interest? The analysis should be revised by accounting for the available covariates:\\. Under this setting, random effects models provide a flexible framework to analyze repeated measurements, conditionally on covariate values.

Response:

The patient demographics are added to table 1. Our measurements were within a homogenous group (BMI range is within 3.2 BMI points) and close to the average of primary bariatric surgery patients of North-Western Europe1. We have not included covariates in our analysis because they do not influence the measurements.

1: Poelemeijer YQM, Liem RSL, Våge V, Mala T, Sundbom M, Ottosson J, Nienhuijs SW. Perioperative Outcomes of Primary Bariatric Surgery in North-Western Europe: a Pooled Multinational Registry Analysis. Obes Surg. 2018 Dec;28(12):3916-3922. doi: 10.1007/s11695-018-3408-4. PMID: 30027332; PMCID: PMC6223749.

Reviewer #4: The author assessed the reliability of heart rate and respiration rate measured by the accelerometer-based device ,Healthdot, compared to the gold standard, the bedside patient monitor, during the postoperative period in bariatric patients. However, the manuscript do little contribute anything new and is not very referable. In whole, the paper cannot be accepted by PLOS ONE.

Response:

We thank the reviewer for this comment and his/her time to thoroughly review this manuscript. We addressed each comment below.

Other comments:

1. the full name of HeartRand RespR should be given in Abstract when mentioned for the first time.

Response:

We have added this to the Abstract

2. Too few references.

Response:

We have added references to embed our paper in previous literature.

3. On Line 165, ‘…nearly 20.5 hours of HeartR data were used in the analysis’. but on line 173, 473 min excluded,14.6hours available, which is ambiguous.

Response:

We agree with the reviewer that the current presentation of data available for analysis was ambiguous. We have changed this to hopefully more clearly show the amount of data available for analysis after excluding low quality data.

4. Figure 2, different line types should be used for comparison.

Response:

We have altered figure 2 (and other figures) based on the suggestion made. We hope this clarifies the figures.

Attachment

Submitted filename: Response to reviewers.docx

Decision Letter 1

Bijan Najafi

17 Feb 2021

Reliability of heart rate and respiration rate measurements with a wireless accelerometer in postbariatric recovery

PONE-D-20-29197R1

Dear Dr. Scheerhoorn,

We’re pleased to inform you that your manuscript has been judged scientifically suitable for publication and will be formally accepted for publication once it meets all outstanding technical requirements.

Within one week, you’ll receive an e-mail detailing the required amendments. When these have been addressed, you’ll receive a formal acceptance letter and your manuscript will be scheduled for publication.

An invoice for payment will follow shortly after the formal acceptance. To ensure an efficient process, please log into Editorial Manager at http://www.editorialmanager.com/pone/, click the 'Update My Information' link at the top of the page, and double check that your user information is up-to-date. If you have any billing related questions, please contact our Author Billing department directly at authorbilling@plos.org.

If your institution or institutions have a press office, please notify them about your upcoming paper to help maximize its impact. If they’ll be preparing press materials, please inform our press team as soon as possible -- no later than 48 hours after receiving the formal acceptance. Your manuscript will remain under strict press embargo until 2 pm Eastern Time on the date of publication. For more information, please contact onepress@plos.org.

Kind regards,

Bijan Najafi

Academic Editor

PLOS ONE

Additional Editor Comments (optional):

Reviewers' comments:

Reviewer's Responses to Questions

Comments to the Author

1. If the authors have adequately addressed your comments raised in a previous round of review and you feel that this manuscript is now acceptable for publication, you may indicate that here to bypass the “Comments to the Author” section, enter your conflict of interest statement in the “Confidential to Editor” section, and submit your "Accept" recommendation.

Reviewer #2: All comments have been addressed

Reviewer #3: All comments have been addressed

**********

2. Is the manuscript technically sound, and do the data support the conclusions?

The manuscript must describe a technically sound piece of scientific research with data that supports the conclusions. Experiments must have been conducted rigorously, with appropriate controls, replication, and sample sizes. The conclusions must be drawn appropriately based on the data presented.

Reviewer #2: Yes

Reviewer #3: (No Response)

**********

3. Has the statistical analysis been performed appropriately and rigorously?

Reviewer #2: Yes

Reviewer #3: (No Response)

**********

4. Have the authors made all data underlying the findings in their manuscript fully available?

The PLOS Data policy requires authors to make all data underlying the findings described in their manuscript fully available without restriction, with rare exception (please refer to the Data Availability Statement in the manuscript PDF file). The data should be provided as part of the manuscript or its supporting information, or deposited to a public repository. For example, in addition to summary statistics, the data points behind means, medians and variance measures should be available. If there are restrictions on publicly sharing data—e.g. participant privacy or use of data from a third party—those must be specified.

Reviewer #2: Yes

Reviewer #3: (No Response)

**********

5. Is the manuscript presented in an intelligible fashion and written in standard English?

PLOS ONE does not copyedit accepted manuscripts, so the language in submitted articles must be clear, correct, and unambiguous. Any typographical or grammatical errors should be corrected at revision, so please note any specific errors here.

Reviewer #2: Yes

Reviewer #3: (No Response)

**********

6. Review Comments to the Author

Please use the space provided to explain your answers to the questions above. You may also include additional comments for the author, including concerns about dual publication, research ethics, or publication ethics. (Please upload your review as an attachment if it exceeds 20,000 characters)

Reviewer #2: (No Response)

Reviewer #3: (No Response)

**********

7. PLOS authors have the option to publish the peer review history of their article (what does this mean?). If published, this will include your full peer review and any attached files.

If you choose “no”, your identity will remain anonymous but your review may still be made public.

Do you want your identity to be public for this peer review? For information about this choice, including consent withdrawal, please see our Privacy Policy.

Reviewer #2: No

Reviewer #3: No

Acceptance letter

Bijan Najafi

15 Apr 2021

PONE-D-20-29197R1

Reliability of heart rate and respiration rate measurements with a wireless accelerometer in postbariatric recovery

Dear Dr. Scheerhoorn:

I'm pleased to inform you that your manuscript has been deemed suitable for publication in PLOS ONE. Congratulations! Your manuscript is now with our production department.

If your institution or institutions have a press office, please let them know about your upcoming paper now to help maximize its impact. If they'll be preparing press materials, please inform our press team within the next 48 hours. Your manuscript will remain under strict press embargo until 2 pm Eastern Time on the date of publication. For more information please contact onepress@plos.org.

If we can help with anything else, please email us at plosone@plos.org.

Thank you for submitting your work to PLOS ONE and supporting open access.

Kind regards,

PLOS ONE Editorial Office Staff

on behalf of

Dr. Bijan Najafi

Academic Editor

PLOS ONE

Associated Data

    This section collects any data citations, data availability statements, or supplementary materials included in this article.

    Supplementary Materials

    S1 Table. Differences of HeartR vitals between patient monitor and Healthdot per patient for a 1-sec-period.

    Statistics of the HeartR vitals per patient on a 1-sec-period. The mean differences are shown in the first column, the CIs are shown in columns 2 and 3. The gray values are the values which exceed the threshold of 5 bpm.

    (PDF)

    S2 Table. Differences of HeartR vitals between patient monitor and Healthdot per patient for a 5-min-average.

    Statistics of the HeartR vitals per patient on a 5-min- average. The mean differences are shown in the first column, the CIs are shown in columns 2 and 3. The gray values are the values which exceed the threshold of 5 bpm.

    (PDF)

    S3 Table. Differences of RespR vitals between patient monitor and Healthdot per patient for a 1-sec-period.

    Statistics of the RespR vitals per patient on a 1-sec-period. The mean differences are shown in the first column, the CIs are shown in columns 2 and 3. The gray values are the values which exceed the threshold of 5 rpm.

    (PDF)

    S4 Table. Differences of RespR vitals between patient monitor and Healthdot per patient for a 5-min-average.

    Statistics of the RespR vitals per patient on a 5-min- average. The mean differences are shown in the first column, the CIs are shown in columns 2 and 3. The gray values are the values which exceed the threshold of 5 rpm.

    (PDF)

    S1 Study protocol

    (PDF)

    Attachment

    Submitted filename: Response to reviewers.docx

    Data Availability Statement

    We have uploaded the minimal anonymized dataset to Dryad repository (doi:10.5061/dryad.tb2rbp006).


    Articles from PLoS ONE are provided here courtesy of PLOS

    RESOURCES