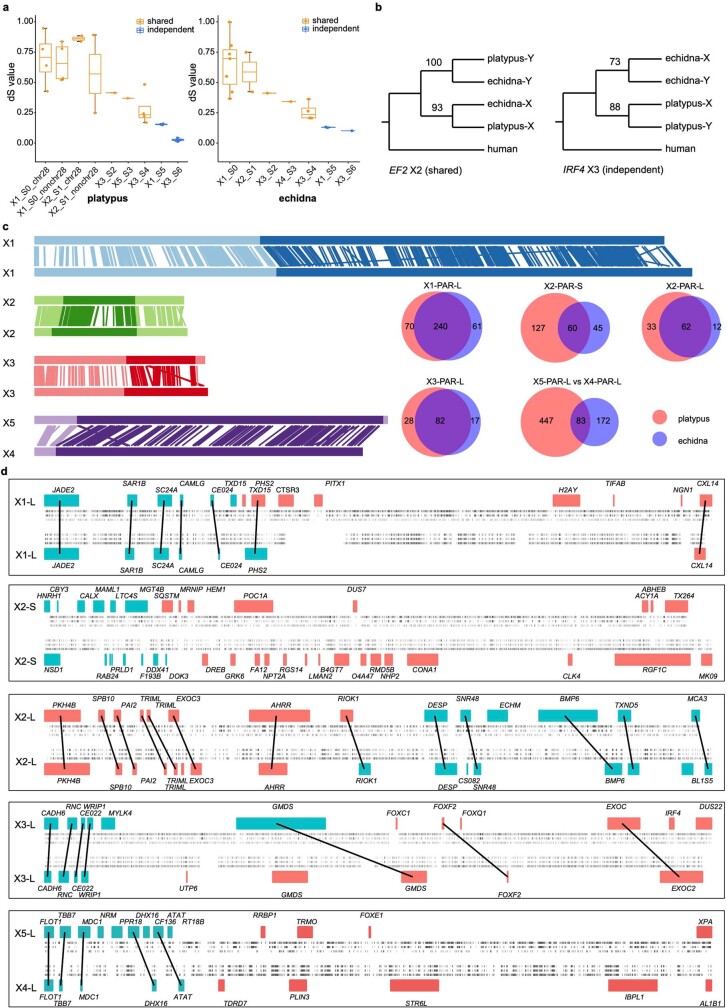
Extended Data Fig. 5. Evolution of PARs after the platypus and echidna divergence.
a, The distribution of pairwise dS values of platypus and echidna sex chromosomes. In both platypus and echidna, gametologue pairs in the X1 S0 region (Fig. 2), which is largely homologous to chicken chromosome 28, have a higher dS value than those of any other sex-linked regions. This suggests that X1 S0 is the oldest evolutionary stratum. Therefore, we also show platypus genes of X2 with an orthologue on chicken chromosome 28 separately from others (X1_S0_chr28). Following the order of dS values of different chromosome regions, we inferred the time order of formation of evolutionary strata, called S0–S6. For platypus, n = 5, 5, 2, 2, 1, 1, 4, 2 and 6 XY gametologue pairs are plotted, from left to right. For echidna, n = 7, 2, 1, 1, 4, 2 and 1 XY gametologue pairs are plotted, from left to right. Box plots show median, quartiles (boxes) and range (whiskers). b, Phylogenetic tree examples of gametologues that evolved in the common ancestor of monotremes (EF2 in X2) and independently in two monotreme species (IRF4 in X3). c, Alignments of platypus and echidna X chromosomes (PAR, light colours; SDR, dark colours; the top chromosomes are from platypus and the bottom chromosomes are from echidna) were used to infer X2-PAR-S and X5-PAR-L of platypus evolved independently from echidna after their divergence, given their different lengths. This is supported by the Venn diagrams of PAR genes between platypus and echidna, in which most genes are not shared within independently evolved PARs. d, Alignments of PAR–SDR boundaries between platypus and echidna. Alignments of genes (±1 Mb around the boundaries) support independent evolution of X2-PAR-S and X5-PAR-L in platypus and echidna, as most of their genes are not homologous at the PAR–SDR boundaries (blue, PAR genes; red, SDR genes; platypus, top chromosome, echidna, bottom chromosome). We used lines to connect the genes of the two species, whenever they are orthologous to each other. For each X chromosome, we also labelled their repeat information. Six repeat tracks between each X pair are shown, from top to bottom: the overall repeat content of platypus; LINE/L2 elements of platypus; SINE/MIR elements of platypus; SINE/MIR elements of echidna; LINE/L2 elements of echidna and overall repeat content of echidna. We did not find obvious repeat enrichment at PAR–SDR boundaries, as shown previously in cow91.

