

Summary
Tumor-associated macrophages (TAMs) are highly heterogenous regarding their intratumoral localization, surface marker expression, and molecular properties. This protocol describes the complete procedure for isolation and digestion of murine breast cancer samples and fluorescence-activated cell sorting (FACS) of TAMs from murine orthotopic 4T1 breast tumors. This includes steps to separate PoEMs (podoplanin-expressing macrophages) and non-PoEMs (podoplanin-negative macrophages). Our FACS separation approach could also be used for other tumor types with TAM infiltration.
For complete details on the use and execution of this protocol, please refer to Bieniasz-Krzywiec et al. (2019).
Subject areas: Cancer, Cell isolation, Flow Cytometry/Mass Cytometry, Immunology, Model Organisms
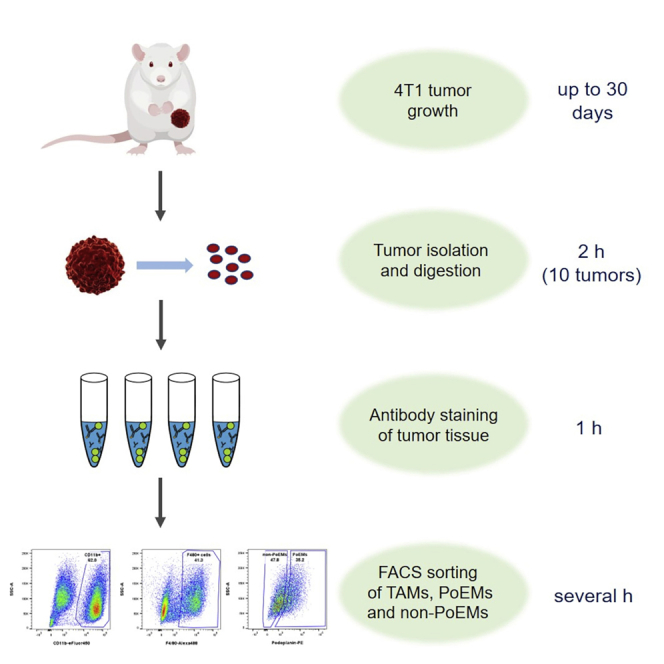
Graphical abstract
Highlights
-
•
Procedure to isolate and digest murine 4T1 breast cancer samples
-
•
Protocol for FACS sorting of TAMs from murine breast tumors
-
•
Steps to separate TAMs into “PoEMs” and “non-PoEMs” subpopulations by FACS
Tumor-associated macrophages (TAMs) are highly heterogenous regarding their intratumoral localization, surface marker expression, and molecular properties. This protocol describes the complete procedure for isolation and digestion of murine breast cancer samples and FACS sorting of TAMs from murine orthotopic 4T1 breast tumors. This includes steps to separate PoEMs (podoplanin-expressing macrophages) and non-PoEMs (podoplanin-negative macrophages). Our FACS separation approach could also be used for other tumor types with TAM infiltration.
Before you begin
-
1.
Set up a flow cytometry staining panel for your populations of interest. The panel used in this protocol is shown in Table 1.
-
2.
This protocol is optimized for breast tumors (4T1 model) in mice with BALB/c background but has also been tested on mice with C57BL/6 background (E0771 model). It is important to note that other tumor types might produce different isolation outcomes. Make sure you are familiar with the growth kinetics of the tumor model used to be able to accurately schedule the TAM isolation day. Of note, TAMs have been detected in 4T1 tumors as early as on day 4 post-cancer inoculation (Makela et al., 2017).
-
3.If the isolated cells are to be put in culture, make sure that all procedures are performed under sterile conditions.Note: Titration of all antibodies and dyes is highly recommended if other types of sorters or software are used, to ensure the best stain index for each isolated population.
Table 1.
Flow cytometry panel for the analysis and sorting of murine TAMs, PoEMs and Non-PoEMs
| Marker | Fluorophore | Final dilution |
|---|---|---|
| Viability | eFluor506 | 1:400 |
| CD11b | eFluor450 | 1:400 |
| F4/80 | AlexaFluor488 | 1:100 |
| PDPN | PE | 1:200 |
Key resources table
| REAGENT or RESOURCE | SOURCE | IDENTIFIER |
|---|---|---|
| Antibodies | ||
| Anti-mouse CD11b-eFluor450 | eBioscience | 48-0112-82 |
| Anti-mouse CD16/CD32 | BD Pharmingen | 553142 |
| Anti-mouse F4/80-AlexaFluor 488 | eBioscience | 53-4801-82 |
| Anti-mouse Podoplanin-PE | BioLegend | 127407 |
| Chemicals, peptides, and recombinant proteins | ||
| Collagenase I | Thermo Fisher Scientific | 17100017 |
| Dispase | Gibco | 17105-041 |
| DNAse I | Sigma-Aldrich | 11284932001 |
| Critical commercial assays | ||
| Invitrogen™ UltraComp eBeads™ Compensation Beads | Thermo Fisher Scientific | 501129040 |
| Red Blood Cell Lysing Buffer - Hybri-MaxTM | Sigma-Aldrich | R7757 |
| RLT lysis buffer | QIAGEN | 79216 |
| Fixable Viability Dye eFluor506 | eBioscience | 65-0866-14 |
| Deposited data | ||
| RNA-sequencing data | (Bieniasz-Krzywiec et al., 2019) | GSE126722: https://www.ncbi.nlm.nih.gov/geo/query/acc.cgi?acc=GSE126722 |
| Experimental models: cell lines | ||
| 4T1 Cell line | ATCC | CRL-2539 |
| Experimental models: organisms/strains | ||
| Mouse: WT BALB/c | Animalium Gasthuisberg, Leuven, Belgium | n/a |
| Software and algorithms | ||
| BD FACSDivaTM software, version 8.0 | BD Biosciences | 23-14523-00 |
| FlowJo™, version 10.4.2 | BD Biosciences | n/a |
| Other | ||
| BD FACSAria™ III Cell Sorter Details regarding sorter configuration are shown inTable 2. |
BD Biosciences | 23-11585-02 |
| Dulbecco’s modified Eagle’s medium (DMEM) | Gibco | 41965039 |
| Dulbecco’s phosphate-buffered saline (PBS) | Thermo Fisher Scientific | 14190144 |
| EDTA (0.5 M), pH 8.0, RNase-free | Thermo Fisher Scientific | AM9261 |
| Falcon Round-Bottom Polystyrene Test Tubes with Cell Strainer Snap Cap, 5 mL | Thermo Fisher Scientific | 352235 |
| Falcon 15 mL Conical Centrifuge Tubes | Thermo Fisher Scientific | 14-959-53A |
| Falcon 50 mL Conical Centrifuge Tubes | Thermo Fisher Scientific | 14-432-22 |
| Falcon 40 μm Cell Strainer | Corning | 352340 |
| Falcon 70 μm Cell Strainer | Corning | 352350 |
| FBS (fetal bovine serum) | Biochrom GmbH | S0115 |
| gentleMACS C Tubes | Miltenyi Biotec | 130-093-237 |
| gentleMACS Octo Dissociator with Heaters | Miltenyi Biotec | 130-096-427 |
| Gibco Penicillin-Streptomycin (10.000 U/mL) | Thermo Fisher Scientific | 15140122 |
| Petri dishes, polystyrene, 60 mm × 15 mm | Merck | P5481-500EA |
| RPMI-1640 Medium | Thermo Fisher Scientific | 11875093 |
| Sodium chloride solution 0.15 M | Sigma-Aldrich | 7647-14-5 |
| Sterilin 30 mm Petri Dishes | Thermo Fisher Scientific | 121V |
| Trypsin-EDTA (0.25%) | Thermo Fisher Scientific | 25200056 |
| 1,5 mL Eppendorf Safe-Lock Tubes | Eppendorf | 0030 120.086 |
| 96-Well cell culture plates | Thermo Fisher Scientific | 8404 |
Table 2.
BD FACSAria™ III cell sorter configuration
| Laser | Detector | Filter Setup | Fluorochromes | |
|---|---|---|---|---|
| Violet 407 | F | 450/40 BP | DAPI / Pacific Blue / V450 / eFluor450 / BV421 / eBFP / Hoechst33258 | |
| E | 502 LP | 510/50 BP | AmCyan / V450 / eFluor506 / BV510 / Pac Green | |
| D | 600 LP | 610/20 BP | BV605 / Pac Orange | |
| C | 630 LP | 660/20 BP | Qdot 655 | |
| B | 685 LP | 710/50 BP | Qdot 705 | |
| A | 735 LP | 780/60 BP | Qdot 800 | |
| Blue 488 | C | 488/10 BP | SSC | |
| B | 502 LP | 530/30 BP | FITC / AlexaFluor 488 / GFP / CFSE / YFP | |
| A | 655 LP | 695/40 BP | PerCP-Cy5-5 / PerCP--eFluor 710 / PI | |
| Yellow-Green 561 | E | 582/15 BP | PE / Td Tomato | |
| D | 600 LP | 610/20 BP | PE-Texas Red / PE-eFluor610 / mCherry | |
| C | 630 LP | 670/14 BP | PE-Cy5 / PI | |
| B | 685 LP | 710/50 BP | PE-Cy5-5 | |
| A | 735 LP | 780/60 BP | PE-Cy7 | |
| Red 633 | C | 660/20 BP | APC / eFluor660 / Alexa Fluor 647 | |
| B | 690 LP | 730/45 BP | Alexa Fluor 700 / APC-Cy5-5 / eFluor710 | |
| A | 755 LP | 780/60 BP | APC-Cy7 / APC - H7 / APC -Alexa750 / eFluor780 | |
Materials and equipment
Complete DMEM medium
Working under sterile conditions, supplement basic DMEM medium with 10% of fetal bovine serum (FBS), 100 units/mL penicillin and 100 μg/mL streptomycin. The complete DMEM medium can be stored at 4°C for up to 4 weeks.
Complete RPMI medium
Working under sterile conditions, supplement basic RPMI medium with 10% of FBS, 100 units/mL penicillin and 100 μg/mL streptomycin. The complete RPMI medium can be stored at 4°C for up to 4 weeks.
DNAse I stock
Working under sterile conditions, dissolve DNAse I powder in DNAse-free water to obtain a clear 100× stock solution of 20 mg/mL. Aliquot and store at −20°C for up to 3 years. Avoid freeze and thaw cycles as this can compromise the DNAse activity.
FACS buffer
Supplement PBS with 2% of FBS and 2 mM of EDTA. Sterile FACS buffer can be stored at 4°C for up to 6 months.
Fc blocking solution
Dilute the Fc block CD16/CD32 antibody in the FACS buffer in the ratio 1:25, i.e., 4 μL of antibody in 96 μL of FACS buffer. The solution should be prepared fresh each time.
Tumor digestion buffer
Supplement complete RPMI medium with 0.1% collagenase type I, 0.2% dispase type I and 0.2 mg/mL DNAse I (dilute the stock 1:100). The powders can be weighed in advance; however, dissolve the powders, add the DNase I stock and pass through a 0.22 μm filter on the day of tumor isolation (the complete buffer can be stored on ice for a few hours).
Step-by-step method details
4T1 tumor inoculation and growth
Timing: 30 days if end-stage 4T1 tumors (i.e., on day 24 post-cancer inoculation) are utilized
-
1.Mouse preparation:
-
a.Use healthy, 9–12-weeks-old female BALB/c mice.
-
b.Remove the fur around and below the right nipple of the 4th mammary gland of each mouse (Eriksson et al., 2014) by depilation or shaving, to expose the injection site. Cancer cells can be inoculated on the following day.
-
a.
-
2.Cancer cell inoculation:
-
a.Culture Mus musculus 4T1 mammary gland cancer cells in complete DMEM media in a humidified incubator in 5% CO2 at 37°C, under sterile conditions. The cells should not be allowed to become confluent and should be subcultured at 80% confluence. A subcultivation ratio of 1:5 is recommended. After thawing, passage at least twice before injecting the cells in mice.
-
b.Remove the media from cell culture flasks, quickly rinse the cells with PBS and incubate them with 0.25% Trypsin-EDTA solution at 37°C until they detach. Next, add fresh culture medium and collect the cells into 50 mL falcons. Spin down for 5 min at 300 g and wash the cell pellets twice in PBS by means of centrifugation (5 min, 300 g) to completely wash away the cell culture medium.
-
c.Resuspend the pellets in PBS at a concentration of 1 × 10⁶ cells per 50 μL. Keep the cellular suspensions on ice at all times.Note: It is recommended to prepare an excess volume of cell suspension (10%–20%) to ensure there is sufficient volume for injections.
-
d.Inject 1 × 10⁶ cells into the right nipple of the 4th mammary gland.
-
a.
Hold the syringe with the needle tip turned upwards to enter the skin subcutaneously at 10 mm from the inoculation nipple, between the 4th and 5th mammary gland. When inserted, move the needle along the skin towards the inoculation nipple until the tip of the needle is located right under that nipple. While still holding the needle parallel to the skin, move it slightly in all directions around the nipple (within a 3 mm radius). Carefully move the needle tip up into the mammary fat pad till the needle eye comes under the nipple tip. Inject the cells at once, but slowly, so that a visible flat thickening forms around the nipple. After injection, turn the needle 45 degrees to the right and slowly pull it out, while still pressing on the plunger.
-
3.Tumor growth:
-
a.Measure tumor growth with a caliper, 3 times per week for up to 24 days. An exemplary tumor growth curve is shown in Figure 1.
-
a.
Figure 1.

Exemplary tumor growth curve of 4T1 breast cancer cells implanted orthotopically in WT→WT or Pdpn KO→WT bone marrow chimeras
Figure reprinted with permission from (Bieniasz-Krzywiec et al., 2019).
Tumor collection and digestion
Proceed in the following way when tumors reach the growth endpoint or a desired size.
Note: It is recommended to always use tumors of the same stage in order to ensure consistency and comparability of experimental outcomes.
-
4.
Sacrifice the tumor-bearing mice using a method approved by an ethical committee of your institution (e.g., cervical dislocation, CO2 inhalation) and immediately collect the tumors in cold PBS.
Note: The draining lymph node can often be found in close proximity to the tumor. Thus, ensure that it is appropriately separated from the tumor.
-
5.
Place each tumor in a plastic dish and chop it with a scalpel into 2–4 mm long pieces.
-
6.
Transfer the tissue into a gentleMACS C Tube containing 5 mL of sterile digestion buffer (RPMI medium containing 0.1% collagenase type I, 0.2% dispase type I and 1% DNAse I stock).
Note: The powders can be weighed in advance. However, dissolve the powders, add the DNase I stock and pass through a 0.22 μm filter immediately before use.
-
7.
Tightly close the C Tube and attach it upside down onto the sleeve of the gentleMACS Octo Dissociator.
Note: Ensure that the sample is located in the area of the rotor/stator, covered with digestion buffer, and that there are no tumor pieces on the tube walls.
-
8.
Run the gentleMACS program with the heating function suitable for hard tumors, i.e., ‘37C_m_TDK_2’.
Note:If softer tumors are used (e.g., E0771 mammary tumors), the ‘37C_m_TDK_1’ program should be used for tissue dissociation.
Alternatively, when no tissue dissociator is available, mince tumors in 5 mL RPMI medium containing 0.1% collagenase type I and 0.2% dispase type I to very small pieces using a scalpel. Tumor pieces should be then maintained in the same solution for the following 30 min at 37°C, and vortexed every 5 min.
CRITICAL:If multiple samples are to be processed, make sure they are all digested for the same amount of time, i.e., transfer each sample to ice exactly after 30 min.
-
9.
Add 10 mL of FACS buffer (PBS containing 2% FBS and 2 mM EDTA) into the gentleMACS C Tube containing the sample in tumor digestion solution and apply the cell suspension to a 70 μm cell strainer placed on a 50 mL tube. Filter the digested tissue using the strainer.
-
10.
Centrifuge the cell suspension for 5 min at 350 g. Discard the supernatant.
-
11.
Incubate the resulting pellets in 1 mL of the red blood cell lysis buffer for 3 min at 37°C.
Immediately place the samples on ice and resuspend them in 10 mL of FACS buffer in order to neutralize the red blood cell lysis buffer. Pipet up and down and pass through a 40 μm cell strainer placed on a 50 mL tube.
Note: Make sure that pellets are well covered by the red blood cell lysis buffer. For 4T1 tumors up to 1 g, 1 mL of the buffer is sufficient, however, for other tumor types this volume might need to be optimized.
An exemplary picture of the pellet covered in red blood cell lysis buffer is shown in Figure 2.
-
12.
Centrifuge the cell suspension for 5 min at 350 g. Discard the supernatant. Resuspend the cell pellet in 5 mL FACS buffer and calculate the number of viable cells in each sample using a counting chamber and a light microscope.
Figure 2.

A representative photo of a 4T1 tumor pellet following digestion and straining through a 70 μm strainer, where the volume of the red blood cell lysis buffer can be appreciated (marked with a black arrow).
Flow cytometry antibody staining
The cell suspensions are stained with indicated antibodies for flow cytometric analysis.
-
13.
Resuspend each sample in the blocking solution (dilute the Fc block CD16/CD32 antibody in the FACS buffer in the ratio 1:25, i.e., 4 μL of antibody in 96 μL of FACS buffer) in the following ratio: 1 × 10⁶ cells per 10 μL of the blocking solution.
-
14.
Transfer the samples to FACS tubes.
-
15.
Incubate for 15 min at 4°C.
-
16.From each sample, collect a small equal volume (e.g., 10 μL) and pool in FACS tubes for the following controls (as detailed in point 18). Ensure to note down the final volumes of your controls:
-
a.Unstained
-
b.Fluorescence Minus One (FMO) controls - the experimental cells stained with all the fluorophores except for one fluorophore.CRITICAL:FMO controls should be done for all the fluorophores in your panel when starting a new multicolor experiment. This will allow you to assess the spread of all the fluorophores into your missing channel and set your gates accordingly. For detailed information on the FMO controls in the context of tumor microenvironment, please refer to (Young et al., 2016).
-
c.Live cells compensation controls.
-
a.
-
17.Cell staining:
- Prepare a 2× concentrated master mix of the appropriate antibodies/dyes in an Eppendorf tube. To each sample (cells in the blocking solution) of a given volume, add the same volume of the 2× concentrated master mix. In this way, the final concentration of the staining mix in each sample is 1× (Table 1). Vortex briefly and incubate for 20 min at 4°C (protected from light). Centrifuge (5 min, 350 g) and resuspend the pellets in 3 mL PBS, then centrifuge again (5 min, 350 g) to wash the samples. Resuspend the pellets in the FACS buffer, at a concertation of 20 million cells per 1000 μL. Keep at 4°C protected from light until detection and sorting.
-
18.Control stainings:
-
a.Unstained: add the volume of FACS buffer equal to the volume of that sample. Vortex briefly and incubate for 20 min at 4°C (protected from light). Keep at 4°C protected from light until detection.
-
b.FMOs: Prepare a 2× concentrated staining mix for each FMO control (containing all the antibodies except for one). Add the volume of 2× mix to each FMO control equal to the volume of that FMO control sample, so that the final concentration of the staining mix in each sample is 1×. Vortex briefly and incubate for 20 min at 4°C protected from light. Centrifuge (5 min, g and resuspend the pellets in 3 mL PBS, then centrifuge again (5 min, 350 g) to wash the samples. Resuspend the pellets in 100–200 μL of the FACS buffer. Keep at 4°C protected from light until detection.
-
a.
-
19.Prepare single stained compensation controls:
-
a.For fluorochrome-conjugated antibodies, use UltraComp beads or equivalent beads following the manufacturer’s instructions.
-
b.For the viability dye, use either ArCTM amine reactive beads (following the manufacturer’s instructions) or use any cultured cells as follows:
-
i.Detach any cultured cells (e.g., 4T1 cells) with Trypsin-EDTA (0.25%);
-
ii.Take an aliquot and incubate at 65°C for 1 min in order to kill the cells and place them on ice immediately afterward;
-
iii.Mix an equal volume of viable and heat-killed cells;
-
iv.Spin down and wash once with FACS buffer;
-
v.Incubate the cell mixture with a viability dye diluted in FACS buffer (the same concentration as your cells) for 20 min on ice protected from light;
-
vi.Wash the cells twice with FACS buffer to ensure a complete removal of excessive viability dye.
-
i.
-
a.
-
20.
Prepare cell collection tubes (15 mL Falcon tubes containing 4 mL of sterile complete RPMI medium) and store them on ice.
Note: The collection tubes can be prepared a day in advance.
Cell collection and data acquisition
The cells are collected using the BD FACSAria™ III Cell Sorter with the BD FACSDivaTM software.
-
21.
Select parameters including FSC-A, FSC-W, FSC-H, SSC-A, SSC-W, SSC-H, eFluor-506 (viability), eFluor-450 (CD11b), AlexaFluor488 (F4/80), PE (PDPN).
-
22.
Use the unstained control to set appropriate photomultiplier tubes voltages for FSC-A and SSC-A parameters.
Note: given inherent differences between instruments, we encourage to test the panel in advance with your instrument to ensure that all the populations are inside of the axis and/or titrate the antibodies to ensure that the panel is optimal. We strongly discourage the use of the unstained control to adjust the voltages of the fluorochrome detectors.
-
23.
Calculate the compensation matrix with the single stained compensation controls.
-
24.
Use the unstained or the appropriate FMO control to create gates for various populations of interest, e.g., total TAMs (single, viable, CD11b+, F4/80+), PoEMs (single, viable, CD11b+, F4/80+, PDPN+) and non-PoEMs (single, viable, CD11b+, F4/80+, PDPN-) (Figure 3).
-
25.
Sort different TAM populations into corresponding collection tubes, i.e., 15 mL Falcon tubes containing 4 mL of sterile complete RPMI medium (see point 20). Store isolated cells on ice for up to 2 h. If possible, the sorting and collection tubes should be kept at 4°C during the sorting. Use a 100 μm nozzle and sort at a 1-3 flow rate.
-
26.
Analyze the data with the FlowJo software (optional).
Figure3.

Gating strategy for the isolation of various populations of 4T1 tumor-infiltrating TAMs, including total TAMs (single, viable, CD11b+, F4/80+), PoEMs (single, viable, CD11b+, F4/80+, PDPN+) and non-PoEMs (single, viable, CD11b+, F4/80+, PDPN-).
Processing of isolated cells
-
27.
Wash the collected cells with PBS and put them in culture in DMEM complete in Sterilin 30 mm Petri Dishes (0.5 million cells per dish) or in 96-well cell culture plates (up to 3 × 10⁴ cells per well). Alternatively, spin the cells down (5 min, 300 g), wash them in PBS (5 min, 300 g), aspirate the supernatant and collect the cells in RLT lysis buffer (according to the manufacturer’s instructions) and immediately store at −80°C until the RNA isolation.
Note: An alternative lysis buffer for RNA extraction can be used.
Expected outcomes
PoEMs constitute 30% of all TAMs infiltrating end-stage (e.g., on day 24 post-cancer inoculation) 4T1 tumors. The maximum number of total TAMs isolated from end-stage 4T1 tumors is 1 × 10⁶.
Sorted populations may be cultured, used for various types of cellular assays or their RNA/protein can be directly isolated.
Limitations
The flow cytometry panel shown in this protocol can only be used for the isolation of total TAMs, PoEMs and non-PoEMs. This panel, however, can be extended to other immune and non-immune (e.g., endothelial) cell types present in 4T1 tumors. For such extended panels, please refer to (Bieniasz-Krzywiec et al., 2019). Of note, when sorting immune cells that are also found in the blood and are indistinguishable from those infiltrating the tissue, mice must be perfused prior to tumor dissection in order to exclude such blood-derived populations.
Troubleshooting
Problem 1
Larger pieces of the tumor tissue may remain after digestion with the gentleMACS Octo Dissociator.
Potential solution
To further increase the cell yield allow the remaining tissue to settle and remove 1.5 mL of the supernatant to a fresh tube. Insert the C Tube with the remaining tissue pieces onto the sleeve of the gentleMACS Octo Dissociator and run the following program: m_imptumor_01. Combine the resulting cell suspension with the previously removed supernatant.
Resource availability
Lead contact
Further information and requests for resources and reagents should be directed to and will be fulfilled by the lead contact, Massimiliano Mazzone (massimiliano.mazzone@kuleuven.vib.be)
Materials availability
This study did not generate new unique reagents.
Data and code availability
The RNA sequencing data of 4T1 PoEMs and non-PoEMS are deposited in the GEO database under the accession number: GSE126722 (https://www.ncbi.nlm.nih.gov/geo/query/acc.cgi?acc=GSE126722).
Acknowledgments
This work was supported by the European Research Council (ERC) Consolidator Grant (773208; EU), Worldwide Cancer Research Fund (13-1031; United Kingdom), and Fonds Wetenschappelijk Onderzoek (FWO) (G087615N; Belgium). C.R.-D. was supported by an FWO grant (1108919N).
Author contributions
P.B.-K., R.M.-P., and C.R.-D. performed the experiments, data acquisition, and data interpretation and wrote this protocol. M.M. supervised the study and wrote this protocol.
Declaration of interests
M.M. and P.B.-K. are co-inventors of the patent “Podoplanin-positive macrophages” (WO2019081714A1).
References
- Bieniasz-Krzywiec P., Martín-Pérez R., Ehling M., García-Caballero M., Pinioti S., Pretto S., Kroes R., Aldeni C., Di Matteo M., Prenen H. Podoplanin-expressing macrophages promote lymphangiogenesis and lymphoinvasion in breast cancer. Cell Metab. 2019;30:917–936.e10. doi: 10.1016/j.cmet.2019.07.015. [DOI] [PMC free article] [PubMed] [Google Scholar]
- Eriksson P.O., Aaltonen E., Petoral R., Lauritzson P., Miyazaki H., Pietras K., Månsson S., Hansson L., Leander P., Axelsson O. Novel nano-sized MR contrast agent mediates strong tumor contrast enhancement in an oncogene-driven breast cancer model. PLoS One. 2014;9:e107762. doi: 10.1371/journal.pone.0107762. [DOI] [PMC free article] [PubMed] [Google Scholar]
- Makela A.V., Gaudet J.M., Foster P.J. Quantifying tumor associated macrophages in breast cancer: A comparison of iron and fluorine-based MRI cell tracking. Sci. Rep. 2017;7:42109. doi: 10.1038/srep42109. [DOI] [PMC free article] [PubMed] [Google Scholar]
- Young Y.K., Bolt A.M., Ahn R., Mann K.K. Analyzing the tumor microenvironment by flow cytometry. Methods Mol. Biol. 2016;1458:95–110. doi: 10.1007/978-1-4939-3801-8_8. [DOI] [PubMed] [Google Scholar]
Associated Data
This section collects any data citations, data availability statements, or supplementary materials included in this article.
Data Availability Statement
The RNA sequencing data of 4T1 PoEMs and non-PoEMS are deposited in the GEO database under the accession number: GSE126722 (https://www.ncbi.nlm.nih.gov/geo/query/acc.cgi?acc=GSE126722).