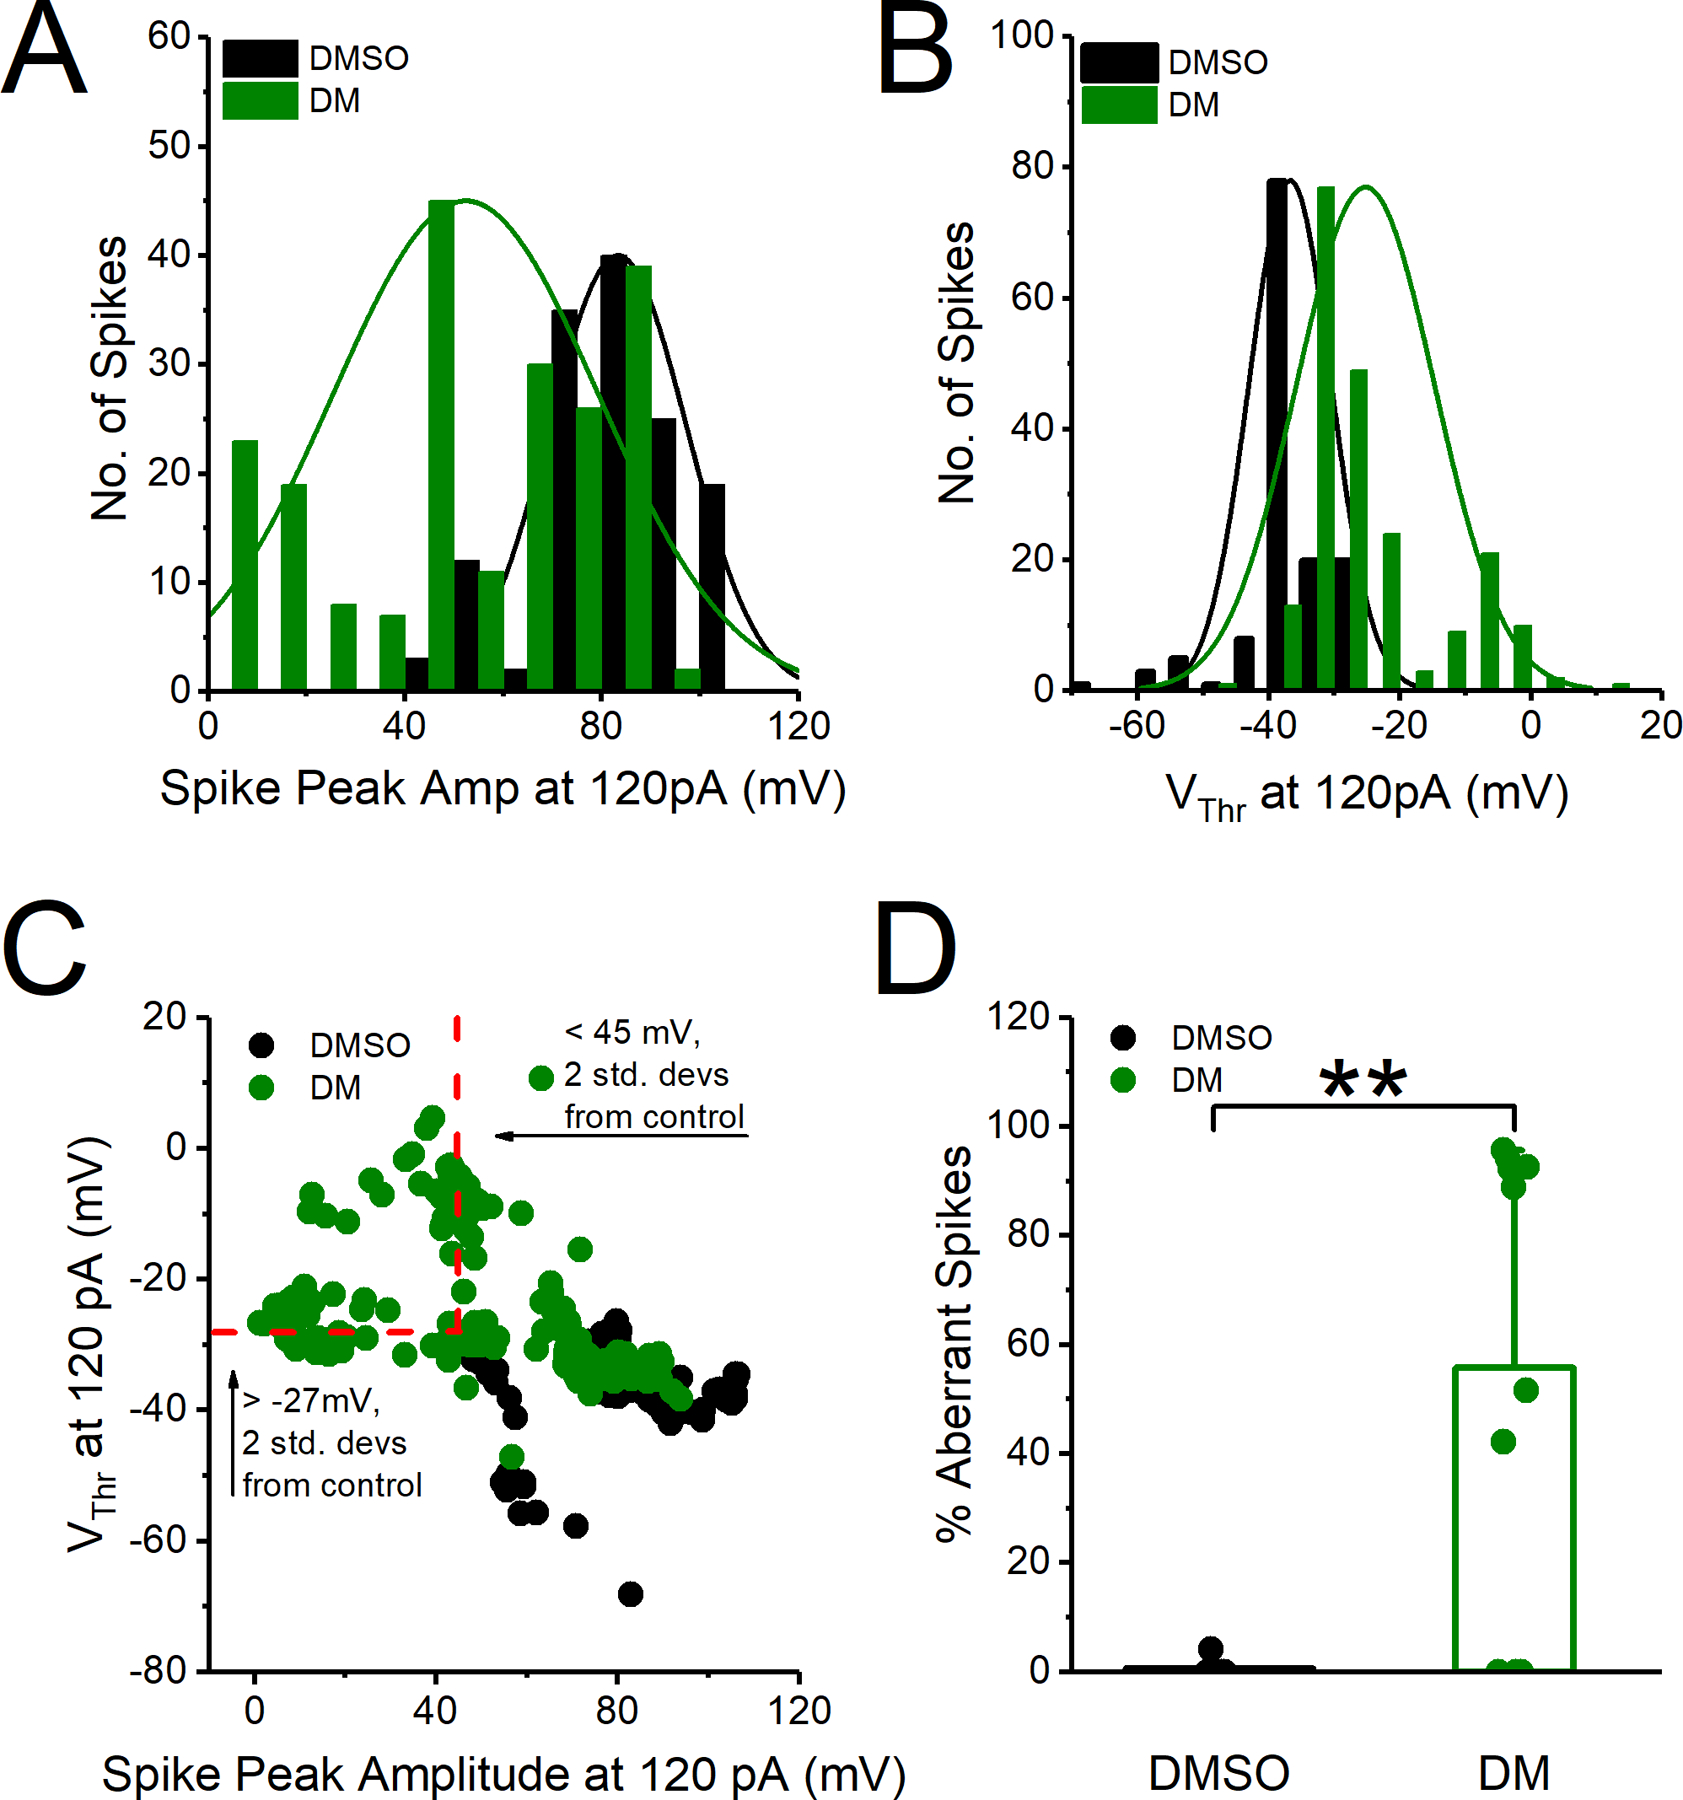
Figure 4).

A. Histogram distribution of action potentials (spikes) peak amplitude at 120 pA injected current step. B. Histogram distribution of action potential voltage threshold (Vthr) at 120 pA of injected current step. C. Voltage threshold plotted against amplitude for action potentials at 120 pA injected current step. Red dotted lines represent cut off for aberrant spikes with voltage threshold (Vthr) >−27 mV or amplitude <45 mV (two standard deviations outside the mean of control neurons). Spikes in the upper left quadrant are therefore considered aberrant. D. Percent aberrant spikes at 120 pA injected current step. All data are represented as mean ± SEM. *p<0.05, **p< 0.01.
