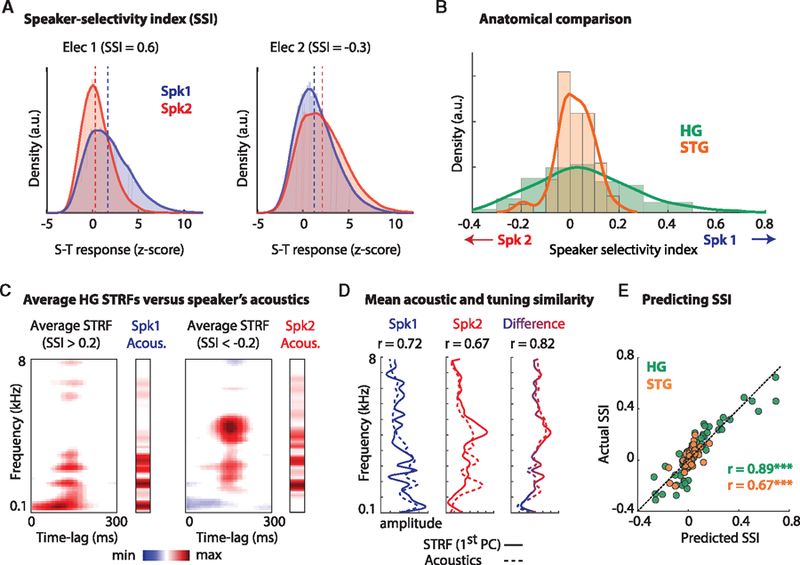
Figure 2. Selective Responses of Neural Sites to Specific Speakers.

(A) The distribution of the responses to Spk1 and Spk2 in the single-talker condition from 2 example electrodes in HG. Electrodes 1 and 2 respond preferentially to Spk1 and Spk2, respectively. The dashed lines indicate the median of each distribution. The speaker selectivity index (SSI) is the effect size (Cohen’s D) of the difference in the response to the 2 speakers. Positive numbers indicate a preference for Spk1, and vice versa.
(B) The distribution of the SSI in HG (green) and STG (orange) shows significantly more speaker-selective sites in HG (p < 0.001).
(C) Comparing the spectrotemporal tuning properties of neural sites with the acoustic profile of each speaker. Left panel: the average spectrotemporal receptive field (STRF) for all sites showing a preference for Spk1 (SSI >0.2) and the average acoustic spectrum of Spk1 (labeled Spk1 Acous.). Right panel: the average STRF for all sites showing a preference for Spk2 and the average acoustic spectrum of Spk2.
(D) The correlation between the average STRFs and average acoustics (after removing the temporal component of the STRFs by obtaining their 1st PC). Left panel: the correlation between the STRFs of Spk1 selective (SSI >0.2) sites (solid line) and the average acoustic spectrum of Spk1 (dashed line). Middle panel: the correlation between the STRFs of Spk2 selective sites and the average acoustics of Spk2. Right panel: the correlation between the difference in the 2 groups of STRFs and the difference in the acoustics of the 2 speakers.
(E) Predicting the SSI of a site from its STRF for all sites in HG (green) and STG (orange).
