

Abstract
The 2019 novel coronavirus (SARS-CoV-2) has spread rapidly worldwide and was declared a pandemic by the WHO in March 2020. The evolution of SARS-CoV-2, either in its natural reservoir or in the human population, is still unclear, but this knowledge is essential for effective prevention and control. We propose a new framework to systematically identify recombination events, excluding those due to noise and convergent evolution. We found that several recombination events occurred for SARS-CoV-2 before its transfer to humans, including a more recent recombination event in the receptor-binding domain. We also constructed a probabilistic mutation network to explore the diversity and evolution of SARS-CoV-2 after human infection. Clustering results show that the novel coronavirus has diverged into several clusters that cocirculate over time in various regions and that several mutations across the genome are fixed during transmission throughout the human population, including D614G in the S gene and two accompanied mutations in ORF1ab. Together, these findings suggest that SARS-CoV-2 experienced a complicated evolution process in the natural environment and point to its continuous adaptation to humans. The new framework proposed in this study can help our understanding of and response to other emerging pathogens.
Keywords: SARS-CoV-2, recombination, evolution, mutation network, adaptation
Introduction
A novel coronavirus, SARS-CoV-2, has spread rapidly in humans worldwide and was declared a pandemic by the WHO in March 2020. The ongoing pandemic has resulted in 37 million infections and over 1 million deaths worldwide as of 14 October 2020 [1]. Currently, laboratories worldwide have submitted more than 140 000 SARS-CoV-2 sequences [2], and the viral genome showed a sequence identity of 99.9% in the early stage [3]. Some new strains isolated from a potential intermediate host have provided clues as to the origin of the virus [4, 5]. However, the evolution, diversity and hidden adaptation of the virus are not yet fully understood.
Coronaviruses evolve naturally and bats shape their evolutionary history. Six coronaviruses are known to infect humans thus far: Human coronavirus-229E (HCoV-229E), HCoV-OC43, HCoV-NL63, HCoV-HKU1, Severe Acute Respiratory Syndrome coronavirus (SARS-CoV) and Middle East Respiratory Syndrome coronavirus (MERS-CoV) [6]. Like other coronaviruses, SARS-CoV-2 is an enveloped, single-stranded, positive-sense RNA virus. Both SARS-CoV-2 and SARS-CoV belong to lineage B (subgenus, Sarbecovirus) of the genus Betacoronavirus [7]. RNA recombination is known to be particularly frequent in coronaviruses [6, 7] and is associated with the expansion of host ranges, the emergence of new viruses, alteration of transmission vector specificities and increased virulence and pathogenesis [8]. Indeed, recombination has promoted the emergence of new pathogenic coronaviruses, such as Genotype D of HCoV-OC43, which arose because of recombination between the B and C genotypes in the NSP2–NSP3 genes and NSP12-N genes [9, 10]. Furthermore, recombination between the Rp3 strain from Guangxi province and the Rf1 strain from Hubei province generated a new strain (SARSr-Civet CoV SZ3) in civets, with a breakpoint at the nsp16/spike and S2 region [11]. Researchers have also suggested that coronaviruses identified in pangolins may have supplied a partial spike gene to SARS-CoV-2 via recombination [12], whereas others have considered it to be an example of convergent evolution [5, 13]. The evolutionary source of the RBD region of SARS-CoV-2 is still controversial. At the same time, the strains that have been found in other hosts, such as the bat-derived RaTG13 and RmYN02 strains, are closely related to SARS-CoV-2 but exhibit low identity in the S gene region [4, 14, 15]. These findings suggest that a close intermediate host and strain are still missing. It is also possible that coronaviruses can spread to people directly through bats with human-to-human transmissibility.
RNA viruses, which use RNA-dependent RNA polymerases (RdRps), are known to have a higher nucleotide substitution rate than DNA viruses, the latter of which use DNA polymerases. Because RdRps are more error prone than DNA polymerases, the latter can have error-correcting domains that further reduce the mutation rate during DNA replication by at least an order of magnitude [16]. Furthermore, a change in ecological niche always goes with selective evolution acting on the viral genome, which hence leads to genomic adaptations and genetic mutations [17]. By accumulating and fixing mutations, a virus can adapt to its host by either perfecting its replication or decreasing its virulence. For instance, during the South Korean outbreak, MERS-CoVs, which carried point mutations in the receptor-binding domain (RBD) region, appeared and spread rapidly, but showed decreased binding to the cellular receptor [18]. These findings suggest that MERS-CoV continuously adapts after entering humans by evolving to evade the binding of neutralizing antibodies, resulting in a trade-off with receptor-binding affinity [17].
Although existing methods have been extensively used in the analysis of SARS-CoV-2 [12, 19–21], new methods are still needed to address challenges in comprehensive analysis of the virus with the huge amount of sequence data that has accumulated quickly. Based on the currently available coronavirus sequences from both humans and bats, we developed a new framework that automatically distinguishes real recombination events from noise and convergent evolution and identified recombination events related to the evolution of SARS-CoV-2 before its entry into the human population. In addition, we constructed a mutation network to explore the diversity and adaptation signal of the virus after its circulation in humans. The results from our analysis may shed light on the evolution process prior to cross-species transmission and adaptation of SARS-CoV-2 and assist with the global effort to monitor and control the virus.
Materials and methods
Recombination analysis
Several methods have been applied to identify recombination events and were used in SARS-COV-2 [12, 19]. We designed a two-step procedure to systematically identify real recombination events by excluding cases generated from noise and convergent evolution. First, 3172 coronavirus sequences were downloaded from National Centre for Biotechnology Information to build a local BLAST database. To explore the recombination regions of SARS-COV-2 and related viruses, one representative strain with the least number of gaps was selected as a query for SARS-CoV-2, RmYN02, RaTG13, PangolinGD (viruses isolated from Pangolin in Guangdong province) and PangolinGX lineages (viruses isolated from Pangolin in Guangxi province) (Table S1; IDs in bold). For simplification, groups of related coronavirus were defined as lineages: SARS-CoV-2, RmYN02, RaTG13, PangolinGD, PangolinGX, BatSL (Bat-SL-CoV ZXC21 and Bat-SL-CoV ZC45), SARSr-CoVs (SARS-related coronaviruses) and SARS-CoV. The closest lineage of each query from the genomic tree was taken as the backbone. Each representative strain was used as a query to run the BLASTn algorithm in BLAST v2.10.0+ [22] against the BLAST database described above using default parameters settings (−task ‘blastn’, −qcov_hsp_perc 70) with a sliding window of 501 bp (167 codons). For the designed window, the most similar lineage (assigned based on the lineage that the most similar strain belongs to) was identified through the BLASTn algorithm. If the most similar lineage was not the backbone lineage and was confirmed by the significant test (see below), then a potential recombination region was identified.
We designed a two-component significant test as follows: (i) the similarity relationship (query-similar-backbone triple) is supported by no less than 80% of the bootstrapped dataset and (ii) the similarity relationship is supported by synonymous divergence. Bootstrapping was performed by generating random sequences (query-similar-backbone triple) with the same length through randomly selecting nucleotide triples from the real sequences and was repeated 1000 times. Synonymous divergence was calculated via KaKs_Calculator2.0 [23] using the LWL model and this was repeated for every sliding window of 501 bp. Series of confirmed overlapping recombination regions were then merged to longer regions. This was done for lineage in the order according to the phylogenetic relationship to SARS-CoV-2 (Figure 1B) as follows: SARS-CoV-2, RmYN02, RaTG13, PangolinGD and PangolinGX. To avoid repeat results, we did the scan only against later lineages.
Figure 1.
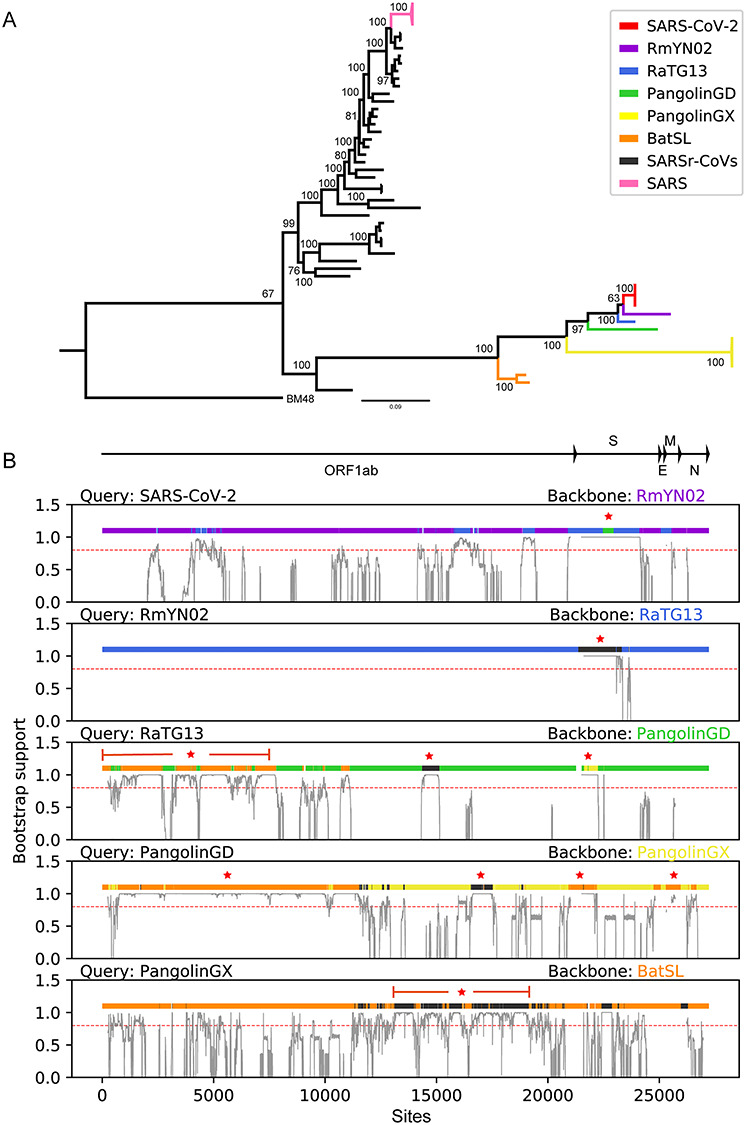
Phylogenetic and recombination analysis of SARS-CoV-2. (A) Phylogenetic tree for the 53 betacoronaviruses based on genomic sequences. (B) Recombination regions identified in this study (regions with color different from backbone). Recombinant events with further divergence time estimation are starred. The red dash line indicates the bootstrap value of 0.8 for the support of recombination.
As a result, a total of 53 strains (including only four of the earlier SARS-CoV-2 strains) were identified (Table S1). The strain BM48 (GenBank accession number: NC_014470) was used as an outgroup for the phylogenetic analysis. Multiple sequence alignment was constructed using MAFFT v7.273 [24] and PRANK v170427 [25] and then refined manually (check Table S2 for the alignment). Only the coding region of ORF1ab, E, S, M and N were used (27 393 bp length). Phylogenetic tree was constructed for the 53 beta-coronaviruses by IQ-TREE v1.6.12 [26] using the GTR + F + R model and 1000 bootstrap replicates (Figure 1) and visualized using FigTree v1.4.4 [27]. The divergence times were estimated by BEAST v1.10.4 [28], MCC trees were obtained, and the substitution model were selected based on ModelFinder [29]. All parameters used in BEAST are listed in Table S3.
Validation of recombination analysis
To validate our new framework for recombination identification, we designed a simulation pipeline. It was tested under various combinations of recombination and mutation rates and the results are comparable to a range of existing methods [30] (Figure S1A). Particularly, our method is better than 3Seq [31], which is a tool with best performance on low false positive rates [32], on reducing false positives from convergent evolution [33] (Figure S1B).
For each test, 100 coalescent genealogies were simulated (s = 100) using Recodon v1.6.0 [34]. Each genealogy consists of 10 sequences (n = 10) with 1000 codons (l = 1000) and the population size is 1000 (N = 1000) [35]. Pseudo sequences were generated by the F3 × 4 model with κ = 2.0 (transition/transversion ratio), ω = 0.63 (across all sites) and  (equilibrium frequencies) under different combinations of mutation rate (0.25/1.25/2.5/5×
 per site per generation) and recombination rate (0.25/1/4/16×
 per site per generation). Detecting rate was calculated as the proportion that recombination could be found among 100 genealogies.
Convergent evolution was exerted on the middle region (codon 300–600) of two sequences that were randomly selected from the same genealogy without recombination. In this region, artificial convergent evolution was acted by fixing single-nucleotide mutations that cause the same amino acids change, while keeping the nucleotide divergence between sequences.
Network analysis
Network was used widely in the evolution study of SARS-CoV-2 [20, 21]. As an alternative approach for describing the relationship of viruses, the mutation network avoids the unrealistic restriction of bifurcation while keeping the probabilistic uncertainty property of the real world [36]. Then, based on a vast number of sequences in a short period, we constructed a mutation network by considering each SARS-CoV-2 strain as a node and considering only the most possible mutation route for each strain compared to all other strains as a link. A total of 29 941 SARS-CoV-2 sequences were downloaded from GISAID (Global Initiative on Sharing All Influenza Data) on 15 July 2020 [37]. Among those sequences, 14 303 of them remained after filtering out redundant sequences (identical sequences from the same region) or those without date information (check Table S4 for accession numbers). These sequences were also aligned by MAFFT, and the UTR regions were removed. Undetermined nucleotides or gaps were replaced with the highest frequency nucleotides at the corresponding position based on the top 10 closest sequences measured by the Hamming distance [38]. Here, observed mutation frequency was used as the replacement of mutation probability because of high identity of viral sequences [39]. The baseline mutation frequencies were calculated as the number of mutations between A, T, G and C divided by the overall number of mutations with single-nucleotide difference among the 14 403 sequences (check Table S5) [36]. The mutation probability between each pair of strains was calculated as the product of single mutation frequency based on the baseline mutation frequencies. Every strain as a node was connected to the strain with the highest mutation probability among all the strains. If isolated subnetworks existed, they were connected through pair of strains with the highest mutation probabilities between them. Finally, an undirected and weighted network was constructed, with the weight being the mutation probability between two nodes. The ‘Wuhan-1’ (GenBank accession number: NC_04512) [14] sequence was used as a reference to confirm the direction of the network. The direction was then defined based on the shortest path from the reference to each SARS-CoV-2 strain. The shortest path was extracted using the Dijkstra algorithm based on the mutation network with the weights transformed by a negative logarithmic function. As a result, directions were confirmed for some links, and for the remaining links, the direction was defined from the strain with higher mutation probability to the strain with lower mutation probability according to the reference node. When the mutation probabilities were same between two nodes from the reference, the direction was from the strain with the earlier date to the strain with the later date. The direction will be flipped once a circle appears.
Network clusters were identified using the MCL method [40] by fixing the scheme parameter at four and choosing the main inflation value of the first plateau of the mean cluster size (the probability that two randomly chosen SARS-CoV-2 viruses lie in the same cluster) curve [38]. Possible fixed mutations, which occur on the trunk of the network, were identified by collecting mutations along the shortest paths between a random chosen node and each tip-node (node without children) in the network [36]. This process was repeated 800 times. The mutation frequency for each site was normalized by total mutations in the 800 iteration results.
Results
Recombination history for SARS-CoV-2 in the natural environment
For systematic identification of all possible and true recombination events from the genomic data, we designed a new framework, based on bootstrapping and synonymous divergence, to distinguish robust signals from noise and exclude false signals from convergent evolution (Materials and methods for more details). The framework performs comparably well and shows advantage in reducing false positives due to convergent evolution from synthetic datasets (Figure S1). Based on the genomic tree, the closest strain to SARS-CoV-2 is the bat-originated coronavirus RmYN02 [15], followed by RaTG13, PangolinGD, PangolinGX, BatSL and SARSr-CoVs (Figure 1A). To illustrate the evolutionary path of SARS-CoV-2 before its entry into the human population, we designed a screening framework to identify potential major recombination events during the generation of SARS-CoV-2 (Methods and materials for details). Taking RmYN02 as the backbone, several significant recombination regions were identified (Figure 1B). Of note, the recombination between the backbone RmYN02 and PangolinGD involved the RBD region in the S gene (green region in panel 1 of Figure 1B), which encodes the essential protein for binding the ACE2 (angiotensin I converting enzyme 2) receptor [41]. This was a recent recombination event, occurring around 2007 (Figure S2). Other recombination events that occurred during the generation of SARS-CoV-2 were in the ORF1ab and S genes between RmYN02 and RaTG13 (Figure 1B, blue regions in panel 1). In addition, for RmYN02, a region on the S gene is derived from SARSr-CoVs (black region in panel 2 of Figures 1B and S3). Next, based on the backbone lineage PangolinGD, we found that the occurrence of three major recombination events related to BatSL, SARSr-CoVs, and PangolinGX generated RaTG13 (brown, black, and yellow regions in panel 3 of Figures 1B and S4). Similarly, we found that there are four major recombination events related to PangolinGD based on the backbone lineage PangolinGX (Figure S5), and only one related to PangolingGX with BatSL as the backbone (Figures 1B and S6).
Evolutionary diversity of SARS-CoV-2 in humans
With the accumulation of a considerable number of SARS-CoV-2 sequences, the probabilistic relationships among them are better shown via a network. Thus, we constructed a mutation network framework to illustrate the evolutionary diversity of SARS-CoV-2 after its entry into human hosts. Strains were connected through highest mutation probabilities (Materials and Methods for more details) and a clustering procedure was applied to the network to identify closely related communities (Figures 2A; check Figure S7 for the full network and Table S6 for the list of clusters). Clusters with proportion greater than 0.1 in any of the main regions (China, Europe, the USA, and Oceania) were numbered in Figure 2 and are discussed below. The results show that SARS-CoV-2 strains were divided into three clusters in the early stage: Cluster 1 (red), Cluster 2 (blue) and Cluster 3 (orange), representing the strains isolated in China (Figure 2B and panel 1 in Figure 2C). Cluster 1 was also later dominant in Europe (panel 2 in Figure 2C). Cluster 4 (green) gradually emerged in Europe, was later dominant in Oceania and transmitted to China around April (panel 1 in Figure 1C). Cluster 5 (purple) gradually emerged and was later dominant in the USA in the early stage. As the virus spread around the world, a variety of new clusters appeared and replaced the earlier epidemic strains, such as Cluster 7 (beige) and Cluster 8 (pink), whereas Cluster 6 (light blue) appeared in Europe and mostly circulated there. At the same time, multiple clusters were also cocirculating in Europe, with the dominant clusters changing over time. Cluster 7, which is currently predominant in Europe, is related to the outbreak that occurred in Beijing in June. Cluster 8 (pink), which first appeared in Europe in February (Table S6), then circulated throughout the USA and Oceania and became the predominant strain in the USA. Interestingly, small clusters prevailed briefly (grey) and disappeared in later stages. We counted the mutations on the trunk of the mutation network and found that the high-frequency mutations (see the top 50 mutations in Table S7) that occurred between main clusters are positions 1059, 3037, 8782, 11083 (ORF1a), 14408 (ORF1b), 23403 (S), 25563 (ORF3a), 28144 (ORF7a), and three consecutive mutations 28881-28883 on the N gene (positions refers to Wuhan-1 sequence) (Figure 2A).
Figure 2.

Mutation network of SARS-CoV-2 and the dynamic change of clusters. (A) Each node represents a cluster, including many sequences that were classified into the same cluster based on the clustering procedure. The node size is scaled to the number of sequences included. The links were colored according to the color of its origin. High-frequency mutations between main clusters were noted along the links with the color of their corresponding clusters. (B) The global proportion of clusters over time. The vertical axis indicates each week since the last week of 2019. (C) The proportion of clusters in different regions over time. Only clusters with a proportion of greater than 0.1 are shown.
Discussion
Based on the available genome sequences of bat betacoronaviruses and SARS-CoV-2, we designed a new framework to systematically identify possible and realistic recombination events by excluding ones from noise and convergent evolution. Then it was used to illustrate the potential recombination events that led to the creation of SARS-CoV-2, which has caused considerable infections and deaths worldwide. Moreover, considering an alternative idea that strains are cross-connected in the probabilistic scenario, so we used a mutation network approach to illustrate the dynamic changes of SARS-CoV-2 in the human population. The mutation network shows that the virus is continuously evolving and is already forming heterogenic clusters globally. Furthermore, several fixed mutations were also observed, that may be essential for the virus to adapt to the new human host.
Previous studies have shown that recombination occurs often in bat coronaviruses because of the diverse virus pool, which includes SARS-CoV in 2003 [6, 9]. Although researchers suspect that the origin of SARS-CoV is masked palm civets from a live animal market, both wild and farmed masked palm civets largely tested negative for SARS-CoV, suggesting that the masked palm civet was an intermediate host but not the reservoir. Currently, the closest relative to SARS-CoV-2 is a bat-derived strain, RmYN02 [15]. Both RmYN02 and RaTG13 show high similarity with SARS-CoV-2 in terms of genome, but our analysis found that in some regions, RaTG13 is more closely related to the novel coronavirus (Figure 1A), which may mean that recombination events occurred in other hosts before SARS-CoV-2 entered humans. This phenomenon is common when multiple coronavirus strains infect a host, in which viral synthesis involves many homologous strains with high similarities and which leads to discontinuous transcription of mRNA [42, 43]. Pangolins have also been suggested as a potential intermediate host of SARS-CoV-2, but strains isolated from pangolins exhibit lower identity than RmYN02 or RaTG13 overall. It is possible that viruses isolated from pangolins could be a distinct spill over of virus from the viral pool of bats to pangolins. Interestingly, the virus from pangolin harbors the closet genome region of SARS-CoV-2 around the RBD (Figure 1B), which is a region that allows SARS-CoV-2 to bind to human respiratory receptors, and which differs from that of RaTG13 and RmYN02. To clarify, researchers have suggested that this receptor binding function of the novel coronavirus is a result of convergent evolution by phylogenetic analysis [5]. However, our results suggest that SARS-CoV-2 could recombine from PangolinGD, which is consistent with the results of Li et al. [12]. At the molecular level, recombination is a key mechanism for coronavirus evolution [10, 44]. Our analysis supports the scenario of frequent recombination among coronaviruses, many of which are related to SARSr-CoVs (Figure 1B). The coronavirus is ancient with diverse lineages in various hosts and, based on our study, the most possible scenario is that bats have provided a huge genetic pool, including the ancestor strain of SARS-CoV-2, and that continuous mutations and recombination have been crucial to its cross-species transmission.
We also constructed a mutation network using numerous virus sequences to explore the evolution of SARS-CoV-2 after spill over to humans. The mutation network is an alternative tool to study the evolution and transmission pattern for a new pathogenic virus that produces a large amount of sequence data with high identity in a short time. Compared to a traditional phylogenetic tree, the mutation network approach avoids the bifurcate limitation and may also reflect the mutation probability. Our clustering analysis results showed few variations in the viral genome, and only a handful of clusters were prevalent in the early stage of the pandemic. However, continuous mutations accumulate as the novel virus spreads worldwide (Figure 2). As the virus mutated, the emergence of small clusters was replaced quickly, whereas others gradually became dominant because the mutations were fixed, such as the D614G mutation in the RBD region [45]. It is worth noting that the D614G mutation always accompanies the two most frequent mutation sites in the ORF1ab (14408 in ORF1b and 3037 in ORF1a) region, which is in the spike region at position 23403 according to the network mutation analysis (Table S4). The three mutations occurred during the transition between Cluster 1 and Cluster 4 and between Cluster 1 and Cluster 7 (Figure 2A). Moreover, researchers reported the substitution causing a D614G amino acid change that may advance the fitness of the virus by increasing its infectivity [45, 46]. At the same time, the two mutations located in ORF1a (3037) and ORF7b (28144), which are the basis for defining virus lineage [13], occurred early on during the transition from Cluster 1 to Cluster 3. In addition, three consecutive mutations are often the focus of attention on the N gene region occurring during the transition from Cluster 1 to Cluster 7 (Figure 2A and Table S7). Experiments demonstrate N proteins playing a role in virion assembly and virus replication [47–50]. Thus, mutations focused on the N gene are likely to evade immune recognition and facilitate replication of SARS-CoV-2. There are other high-frequency mutations widely distributed on the genome whose effects are yet to be elucidated (for example, G11083T between Cluster 1 and Cluster 2 as well as C1059T and G15583T between Cluster 4 and Cluster 8). Taken together, these changes in the virus implicate continuous adaptation and evolution of SARS-CoV-2 in humans, and the mutations observed here require further laboratory validation.
In conclusion, SARS-CoV-2 is constantly evolving and is still a significant problem worldwide. Our recombination analysis reveals the complex evolution of SARS-CoV-2 before spill over to humans, while the mutation network analysis implicated the increasing diversity and adaptation of SARS-CoV-2 after its entry into the human population. The new framework for recombination identification provides a more precise solution on ones related to convergent evolution for betacoronaviruses with large divergence, and the mutation network supplies an alternative way of evolution analysis for SARS-CoV-2 with a large number of sequences accumulated in a short period. Although further improvements are needed, these new methods facilitate the comprehensive understanding of SARS-CoV-2 and could be easily applied to other pathogens. Timely and effective surveillance of viral sequences in animals and the study of virus adaptation are worthwhile for effective prevention and control.
Key Points
We proposed a new method for systematically identifying recombination regions, which distinguished real ones from both noise and convergent evolution and applied it to SARS-CoV-2.
We applied a mutation network that utilizes probabilistic network relationships to explore the evolution pattern of SARS-CoV-2 after transfer to humans.
Coronavirus demonstrates intensive recombination during the circulation in the natural environment and continuous evolution and adaptation of SARS-CoV-2 in the human population, which is of great significance for the surveillance, prevention and control of COVID-19.
Supplementary Material
Acknowledgments
We gratefully acknowledge all the authors from the originating laboratories who managed obtaining the specimens and those from the submitting laboratories where genetic sequence data were generated and shared via the GISAID Initiative, on which this research is based.
Yinghan Wang is a student at the School of Public Health (Shenzhen), Sun Yat-sen University.
Jinfeng Zeng is a PhD student at the School of Public Health (Shenzhen), Sun Yat-sen University.
Chi Zhang is a PhD student at the School of Public Health (Shenzhen), Sun Yat-sen University.
Cai Chen received a master’s degree from the School of Public Health (Shenzhen), Sun Yat-sen University.
Zekai Qiu is a student at the School of Public Health (Shenzhen), Sun Yat-sen University.
Jiali Pang received a bachelor’s degree from the School of Life Science, Sun Yat-sen University. She is currently working toward a master’s degree at the Harvard T.H. Chan School of Public Health, Harvard University.
Yutian Xu is a student at the School of Intelligent Systems Engineering, Sun Yat-sen University.
Zhiqi Dong is a student at the School of Public Health (Shenzhen), Sun Yat-sen University.
Yanxin Song is a student at Lingnan College, Sun Yat-sen University.
Weiying Liu is a student at the School of Public Health (Shenzhen), Sun Yat-sen University.
Peipei Dong is a student at the School of Public Health (Shenzhen), Sun Yat-sen University.
Litao Sun is a professor in the School of Public Health (Shenzhen), Sun Yat-sen University. His research focuses on infection and immunity of viruses.
Yao-Qing Chen is a professor in the School of Public Health (Shenzhen), Sun Yat-sen University. His research focuses on the immune response mechanism of virus infection and vaccination.
Yuelong Shu is the dean of and a professor in the School of Public Health (Shenzhen), Sun Yat-sen University. His research focuses on cross-species transmission and the mechanisms of pathogenesis of avian influenza.
Xiangjun Du is a professor in the School of Public Health (Shenzhen), Sun Yat-sen University. His research focuses on bioinformatics and systematic biology.
Data availability
All data analyzed in this study is available on GenBank (ncbi.nlm.nih.gov) and the GISAID database (gisaid.org). Please see the accession number in Supplementary Table S4. We uploaded all raw code to GitHub at: github.com/DuLab-SYSU/NSRecomb.git.
Authors’ contributions
XD and YShu designed the study. YW, JZ, CZ, CC, ZQ, JP, YX, ZD, YSong and WL collected and analyzed the data. XD, YShu, LS and YC interpreted the data. XD, YW and JZ prepared the manuscript. XD, YShu, YW and JZ edited the paper. All authors reviewed and approved the submitted manuscript.
Funding
This work was supported by the Guangdong Frontier and Key Tech Innovation Program [2019B111103001, 2019B020228001]; National Key Research and Development Program of China [2020YFC0840900]; and Shenzhen Science and Technology Program [KQTD20180411143323605].
Abbreviations
SARS-CoV-2: The 2019 novel coronavirus
RBD: Receptor-binding domain
SARS-CoV: Severe Acute Respiratory Syndrome coronavirus
MERS-CoV: Middle East Respiratory Syndrome coronavirus.
PangolinGD: Viruses isolated from pangolin in Guangdong province.
PangolinGX: Viruses isolated from pangolin in Guangxi province.
BatSL: Bat-SL-CoVZXC21 and Bat-SL-CoVZC45.
SARSr-CoVs: SARS-related coronaviruses.
ACE2: Angiotensin I converting enzyme 2.
Conflict of interest
The authors declare that they have no conflict of interest.
References
- 1. WHO . World Health Organization. Coronavirus disease (COVID-19)pandemic. 2020; Available from: https://www.who.int/emergencies/diseases/novel-coronavirus-2019.
- 2. Zhao WM, Song SH, Chen ML, et al. The 2019 novel coronavirus resource. Yi Chuan 2020;42(2):212–21. [DOI] [PubMed] [Google Scholar]
- 3. Lu R, Zhao X, Li J, et al. Genomic characterisation and epidemiology of 2019 novel coronavirus: implications for virus origins and receptor binding. Lancet 2020;395(10224):565–74. [DOI] [PMC free article] [PubMed] [Google Scholar]
- 4. Zhou P, Yang XL, Wang XG, et al. A pneumonia outbreak associated with a new coronavirus of probable bat origin. Nature 2020;579(7798):270–3. [DOI] [PMC free article] [PubMed] [Google Scholar]
- 5. Lam TT, Shum MH, Zhu HC, et al. Identifying SARS-CoV-2 related coronaviruses in Malayan pangolins. Nature 2020;583(7815):282–5. [DOI] [PubMed] [Google Scholar]
- 6. Cui J, Li F, Shi ZL. Origin and evolution of pathogenic coronaviruses. Nat Rev Microbiol 2019;17(3):181–92. [DOI] [PMC free article] [PubMed] [Google Scholar]
- 7. Chen Y, Liu Q, Guo D. Emerging coronaviruses: genome structure, replication, and pathogenesis. J Med Virol 2020;92(4):418–23. [DOI] [PMC free article] [PubMed] [Google Scholar]
- 8. Perez-Losada M, Arenas M, Galan JC, et al. Recombination in viruses: mechanisms, methods of study, and evolutionary consequences. Infect Genet Evol 2015;30:296–307. [DOI] [PMC free article] [PubMed] [Google Scholar]
- 9. Su S, Wong G, Shi W, et al. Epidemiology, genetic recombination, and pathogenesis of coronaviruses. Trends Microbiol 2016;24(6):490–502. [DOI] [PMC free article] [PubMed] [Google Scholar]
- 10. Lau SK, Lee P, Tsang AK, et al. Molecular epidemiology of human coronavirus OC43 reveals evolution of different genotypes over time and recent emergence of a novel genotype due to natural recombination. J Virol 2011;85(21):11325–37. [DOI] [PMC free article] [PubMed] [Google Scholar]
- 11. Lau SK, Li KS, Huang Y, et al. Ecoepidemiology and complete genome comparison of different strains of severe acute respiratory syndrome-related Rhinolophus bat coronavirus in China reveal bats as a reservoir for acute, self-limiting infection that allows recombination events. J Virol 2010;84(6):2808–19. [DOI] [PMC free article] [PubMed] [Google Scholar]
- 12. Li XJ, Giorgi EE, Marichann MH, et al. Emergence of SARS-CoV-2 through recombination and strong purifying selection. Sci Adv 2020;6(27):eabb9153. [DOI] [PMC free article] [PubMed] [Google Scholar]
- 13. Tang XL, Wu CC, Li X, et al. On the origin and continuing evolution of SARS-CoV-2. Natl Sci Rev 2020;7(6):1012–23. [DOI] [PMC free article] [PubMed] [Google Scholar]
- 14. Wu F, Zhao S, Yu B, et al. A new coronavirus associated with human respiratory disease in China. Nature 2020;579(7798):265–9. [DOI] [PMC free article] [PubMed] [Google Scholar]
- 15. Zhou H, Chen X, Hu T, et al. A novel bat coronavirus closely related to SARS-CoV-2 contains natural insertions at the S1/S2 cleavage site of the spike protein. Curr Biol 2020;30(11):2196–2203 e3. [DOI] [PMC free article] [PubMed] [Google Scholar]
- 16. Duffy S, Shackelton LA, Holmes EC. Rates of evolutionary change in viruses: patterns and determinants. Nat Rev Genet 2008;9(4):267–76. [DOI] [PubMed] [Google Scholar]
- 17. Forni D, Cagliani R, Clerici M, et al. Molecular evolution of human coronavirus genomes. Trends Microbiol 2017;25(1):35–48. [DOI] [PMC free article] [PubMed] [Google Scholar]
- 18. Kim Y, Cheon S, Min CK, et al. Spread of mutant Middle East respiratory syndrome coronavirus with reduced affinity to human CD26 during the south Korean outbreak. MBio 2016;7(2):e00019. [DOI] [PMC free article] [PubMed] [Google Scholar]
- 19. Boni MF, Lemey P, Jiang X, et al. Evolutionary origins of the SARS-CoV-2 sarbecovirus lineage responsible for the COVID-19 pandemic. Nat Microbiol 2020;5(11):1408–17. [DOI] [PubMed] [Google Scholar]
- 20. Forster P, Forster L, Renfrew C, et al. Phylogenetic network analysis of SARS-CoV-2 genomes. Proc Natl Acad Sci USA 2020;117(17):9241–3. [DOI] [PMC free article] [PubMed] [Google Scholar]
- 21. Adam DC, Wu P, Wong JY, et al. Clustering and superspreading potential of SARS-CoV-2 infections in Hong Kong. Nat Med 2020;26(11):1714–9. [DOI] [PubMed] [Google Scholar]
- 22. Camacho C, Coulouris G, Avagyan V, et al. BLAST+: architecture and applications. BMC Bioinf 2009;10(1):421. [DOI] [PMC free article] [PubMed] [Google Scholar]
- 23. Wang D, Zhang Y, Zhang Z, et al. KaKs_Calculator 2.0: a toolkit incorporating gamma-series methods and sliding window strategies. Gen Proteom Bioinf 2010;8(1):77–80. [DOI] [PMC free article] [PubMed] [Google Scholar]
- 24. Katoh K, Standley DM. MAFFT multiple sequence alignment software version 7: improvements in performance and usability. Mol Biol Evol 2013;30(4):772–80. [DOI] [PMC free article] [PubMed] [Google Scholar]
- 25. Loytynoja A. Phylogeny-aware alignment with PRANK. Methods Mol Biol 2014;1079:155–70. [DOI] [PubMed] [Google Scholar]
- 26. Nguyen LT, Schmidt HA, von Haeseler A, et al. IQ-TREE: a fast and effective stochastic algorithm for estimating maximum-likelihood phylogenies. Mol Biol Evol 2015;32(1):268–74. [DOI] [PMC free article] [PubMed] [Google Scholar]
- 27. Rambaut, A. 2009; Available from: http://tree.bio.ed.ac.uk/software/figtree/.
- 28. Suchard MA, Lemey P, Baele G, et al. Bayesian phylogenetic and phylodynamic data integration using BEAST 1.10. Virus Evol 2018;4(1):vey016. [DOI] [PMC free article] [PubMed] [Google Scholar]
- 29. Kalyaanamoorthy S, Minh BQ, Wong TKF, et al. ModelFinder: fast model selection for accurate phylogenetic estimates. Nat Methods 2017;14(6):587–9. [DOI] [PMC free article] [PubMed] [Google Scholar]
- 30. Posada D. Evaluation of methods for detecting recombination from DNA sequences: empirical data. Mol Biol Evol 2002;19(5):708–17. [DOI] [PubMed] [Google Scholar]
- 31. Lam HM, Ratmann O, Boni MF. Improved algorithmic complexity for the 3SEQ recombination detection algorithm. Mol Biol Evol 2018;35(1):247–51. [DOI] [PMC free article] [PubMed] [Google Scholar]
- 32. Martin DP, Murrell B, Khoosal A, et al. Detecting and analyzing genetic recombination using RDP4. Methods Mol Biol 2017;1525:433–60. [DOI] [PubMed] [Google Scholar]
- 33. McVean G, Awadalla P, Fearnhead P. A coalescent-based method for detecting and estimating recombination from gene sequences. Genetics 2002;160(3):1231–41. [DOI] [PMC free article] [PubMed] [Google Scholar]
- 34. Arenas M, Posada D. Recodon: coalescent simulation of coding DNA sequences with recombination, migration and demography. BMC Bioinf 2007;8:458. [DOI] [PMC free article] [PubMed] [Google Scholar]
- 35. Hudson RR. Properties of a neutral allele model with intragenic recombination. Theor Popul Biol 1983;23(2):183–201. [DOI] [PubMed] [Google Scholar]
- 36. Zhang C, Wang Y, Chen C, et al. A mutation network method for transmission analysis of human influenza H3N2. Viruses 2020;12(10):1125. [DOI] [PMC free article] [PubMed] [Google Scholar]
- 37. Shu Y, McCauley J. GISAID: global initiative on sharing all influenza data - from vision to reality. Euro Surveill 2017;22(13):30494. [DOI] [PMC free article] [PubMed] [Google Scholar]
- 38. Du X, Dong L, Lan Y, et al. Mapping of H3N2 influenza antigenic evolution in China reveals a strategy for vaccine strain recommendation. Nat Commun 2012;3(1):709. [DOI] [PubMed] [Google Scholar]
- 39. Yang Z. PAML 4: phylogenetic analysis by maximum likelihood. Mol Biol Evol 2007;24(8):1586–91. [DOI] [PubMed] [Google Scholar]
- 40. Enright AJ, Van Dongen S, Ouzounis CA. An efficient algorithm for large-scale detection of protein families. Nucleic Acids Res 2002;30(7):1575–84. [DOI] [PMC free article] [PubMed] [Google Scholar]
- 41. Xu J, Zhao S, Teng T, et al. Systematic comparison of two animal-to-human transmitted human coronaviruses: SARS-CoV-2 and SARS-CoV. Viruses 2020;12(2):244. [DOI] [PMC free article] [PubMed] [Google Scholar]
- 42. Lai MMC. Recombination in large RNA viruses: coronaviruses. Semin Virol 1996;7(6):381–8. [DOI] [PMC free article] [PubMed] [Google Scholar]
- 43. Lai MMC, Baric RS, Makino S, et al. Recombination between nonsegmented RNA genomes of murine coronaviruses. J Virol 1985;56(2):449–56. [DOI] [PMC free article] [PubMed] [Google Scholar]
- 44. Graham RL, Baric RS. Recombination, reservoirs, and the modular spike: mechanisms of coronavirus cross-species transmission. J Virol 2010;84(7):3134–46. [DOI] [PMC free article] [PubMed] [Google Scholar]
- 45. Korber B, Fischer WM, Gnanakaran S, et al. Tracking changes in SARS-CoV-2 spike: evidence that D614G increases infectivity of the COVID-19 virus. Cell 2020;182(4):812–827.e19. [DOI] [PMC free article] [PubMed] [Google Scholar]
- 46. Li Q, Wu J, Nie J, et al. The impact of mutations in SARS-CoV-2 spike on viral infectivity and antigenicity. Cell 2020;182(5):1284–1294 e9. [DOI] [PMC free article] [PubMed] [Google Scholar]
- 47. Cui L, Wang H, Ji Y, et al. The nucleocapsid protein of coronaviruses acts as a viral suppressor of RNA silencing in mammalian cells. J Virol 2015;89(17):9029–43. [DOI] [PMC free article] [PubMed] [Google Scholar]
- 48. Mu J, Xu J, Zhang L, et al. SARS-CoV-2-encoded nucleocapsid protein acts as a viral suppressor of RNA interference in cells. Sci China Life Sci 2020;63(9):1–4. [DOI] [PMC free article] [PubMed] [Google Scholar]
- 49. Fehr AR, Perlman S. Coronaviruses: an overview of their replication and pathogenesis. Methods Mol Biol 2015;1282:1–23. [DOI] [PMC free article] [PubMed] [Google Scholar]
- 50. Chang CK, Sue SC, Yu TH, et al. Modular organization of SARS coronavirus nucleocapsid protein. J Biomed Sci 2006;13(1):59–72. [DOI] [PMC free article] [PubMed] [Google Scholar]
Associated Data
This section collects any data citations, data availability statements, or supplementary materials included in this article.
Supplementary Materials
Data Availability Statement
All data analyzed in this study is available on GenBank (ncbi.nlm.nih.gov) and the GISAID database (gisaid.org). Please see the accession number in Supplementary Table S4. We uploaded all raw code to GitHub at: github.com/DuLab-SYSU/NSRecomb.git.