

Abstract
Background
The frequency with which sensory disturbances occur in patients with radicular leg pain and disc herniation is not well known, and the efficacy of tests to identify such changes are not firmly established. The presence of sensory disturbances is a key sign of nerve root involvement and may contribute to the diagnosis of a lumbar disc herniation, identify patients for referral to spinal imaging and surgery, and improve disease classification.
Questions/purposes
In this study, we sought: (1) to determine the frequency with which abnormal sensory findings occur in patients with lumbar disc herniation–related radicular pain, using a standard neurological sensory examination; (2) to determine what particular standard sensory test or combination of tests is most effective in establishing sensory dysfunction; and (3) to determine whether a more detailed in-depth sensory examination results in more patients being identified as having abnormal sensory findings.
Methods
Between October 2013 and April 2016, 115 patients aged 18 to 65 years referred to secondary health care with radicular leg pain and disc herniation were considered potentially eligible for inclusion in the study. Based on these inclusion criteria, 79% (91) were found eligible. Ten percent (11) were excluded because of other illness that interfered with the study purpose, 3% (3) because of cauda equina syndrome, 2% (2) because of spinal stenosis, 2% (2) because of prior surgery at the same disc level, and 2% (2) because of poor Norwegian language skills. Three percent (4) of the patients did not want to participate in the study. Of the 91 eligible patients, 56% (51) consented to undergo a comprehensive clinical examination and were used for analysis here. The sample for the purposes of the present study was predetermined at 50. These patients were first examined by a standard procedure, including sensory assessment of light touch, pinprick, vibration, and warmth and cold over the back and legs. Second, an in-depth semiquantitative sensory testing procedure was performed in the main pain area to assess sensory dysfunction and improve the detection of potential positive sensory signs, or sensory gain of function more precisely. Sensory loss was defined as sensations experienced as distinctly reduced in the painful side compared with the contralateral reference side. In contrast, sensory gain was defined as sensations experienced as abnormally strong, unpleasant, or painful and distinctly stronger than the contralateral side. Ambiguous test results were coded as a normal response to avoid inflating the findings. The proportions of abnormal findings were calculated for each sensory modality and for all combinations of the standard examination tests.
Results
The standard examination identified at least one abnormal finding in 88% (45 of 51) of patients. Sensory loss was present in 80% (41), while sensory gain was present in 35% (18). The combination of pinprick and light touch identified all patients who were classified as having abnormal findings by the full standard examination. The semiquantitative procedure identified an additional three patients with an abnormal finding.
Conclusion
We suggest that the combination of pinprick and light touch assessment is an adequate minimal approach for diagnostic and classification purposes in patients with lumbar radicular pain.
Level of Evidence
Level I, diagnostic study.
Introduction
A main purpose of the diagnostic work-up of patients with low back–related leg pain is to identify those with clinical signs of nerve root involvement. The objective loss of sensory function in the innervation territory of a nerve root is necessary to diagnose painful radiculopathy, and it is part of the formal definition of neuropathic pain [13]. Patients with neuropathic back pain report more pain and disability and present with more severe and more numerous comorbidities than patients classified with mainly nociceptive pain mechanisms [3, 27]. Distinguishing low back pain with and without radiculopathy may have therapeutic consequences, since interventional spine procedures, such as surgical decompression or epidural steroid injections, often are recommended to patients with signs of radiculopathy [29, 31]. Adequate assessment is also important for diagnostic precision. The differentiation of symptoms of neurological loss of function from those indicative of gain of function, such as neuronal hyperexcitability or reduced inhibitory function, has been used to guide treatment [10]. Finally, correct assessment is crucial for improving the classification of patients in research settings [43]. Sensory signs, especially negative ones such as partial or complete loss of one or several sensory modalities, are the hallmark symptoms in the diagnosis and grading of neuropathic pain [13].
Quantitative sensory testing (QST) is considered an effective method to assess patients with possible neuropathic pain [4, 8, 13, 40], but it is time consuming and requires specialized equipment and personnel. Hence, QST generally is not feasible outside specialized centers. Most research on patients with back pain has investigated sensory function by assessing either light touch or pinprick, which probably reflects common practice [24, 49]. A simpler, bedside-derived semiquantitative procedure, assessing several modalities using QST principles while still being clinically applicable, has been suggested [4, 9].
Somewhat surprisingly, the occurrence of sensory disturbances in patients with low back–related leg pain and lumbar disc herniation is not well known. Few studies have investigated how the various sensory modalities, such as touch, pinprick, vibration, and warmth and cold, are affected. The proportions of patients with sensory abnormalities among patients with radicular pain and disc herniation range from below 40% [28] to above 90% [53], but the examination procedures are often applied at a rudimentary level and only presented as appended data [46]. Further, how the test methods available in clinical practice compare with each other have not been studied extensively. Consequently, which test—or combination of tests—is adequate to classify a patient with low back–related leg pain who has a sensory abnormality in routine clinical practice, has not been well established. Guidelines on the assessment of neuropathic pain suggest examining a wider range of modalities and stimulus-evoked symptoms [8, 13, 23, 50]. The standard back pain–oriented examination is not well designed for the evaluation of positive sensory signs [50], and a more comprehensive examination could improve the assessment and outline of somatosensory alterations in patients with low back–related leg pain [18]. Few studies have evaluated semiQST in this setting, and how such methods compare with a standard clinical sensory examination is generally unknown. In other pain conditions, a standard neurological assessment and QST have yielded different results [30].
We therefore sought: (1) to determine the frequency with which abnormal sensory findings occur in patients with lumbar disc herniation–related radicular pain, using a standard neurological sensory examination; (2) to determine which particular standard sensory test or combination of tests is most effective in establishing sensory dysfunction; and (3) to determine whether a more detailed in-depth sensory examination procedure in the main pain area results in more patients being identified as having abnormal sensory findings.
Patients and Methods
Setting
The data from the present study were part of a prospective, 1-year observational study of patients with low back-related leg pain who were referred to a secondary health-care back clinic at the Østfold Hospital Trust, Norway.
Patients
Between October 2013 and April 2016, 115 patients aged 18 to 65 years with low back–related leg pain at the time of evaluation and a corresponding lumbar disc herniation at the relevant side and spinal level as confirmed by MRI were considered potentially eligible for inclusion in the study. The treating physician and physiotherapist evaluated the radiologist’s written report and the MRI results as part of the clinical evaluation. Based on these inclusion criteria, 79% (91) of the patients were found to be eligible. Ten percent (11) were excluded because of other illness interfering with the study purpose, 3% (3) because of cauda equina syndrome, 2% (2) because of spinal stenosis, 2% (2) because of prior surgery at the same disc level, and 2% (2) because of poor Norwegian language skills. An additional 3% (4) did not want to participate in the study. Of the 91 eligible patients, 56% (51) consented to undergo a comprehensive clinical examination and were used for analysis here. The sample for the purposes of the present study was predetermined at 50. A total of 33% (17 of 51) of the patients in the study were women, and the mean ± SD age was 43 ± 9 years (Table 1). Thirty-seven percent (19) of included patients received surgery for lumbar disc herniation after inclusion in the study. The complete exclusion criteria were: cauda equina syndrome; ongoing infection; suspected malignancy; pregnancy; breastfeeding; other illness interfering with the study purpose, such as neuropathic pain of other causes; inflammatory disease; spinal stenosis; prior surgery at the same disc level; any lumbar fusion; or poor Norwegian language skills. All patients received written information and signed an informed consent form.
Table 1.
Baseline patient characteristics (n = 51)
| Age in years, mean ± SD | 43 ± 9 |
| Women, % (n) | 33 (17) |
| Education in years, mean ± SDa | 14 ± 3 |
| Current smoker (daily or sometimes), % (n) | 24 (12) |
| Pain duration in weeks, median (IQR) | |
| Low back painb | 12 (3-34) |
| Leg pain | 12 (6.5-22) |
| Use of pain medication, % (n) | |
| Daily | 75 (38) |
| Weekly | 10 (5) |
| Monthly or no use | 16 (8) |
| Location of the main pain area, % (n) | |
| Back | 6 (3) |
| Leg | 88 (45) |
| Back and leg | 6 (3) |
| Most distal pain radiation, % (n) | |
| Knee | 6 (3) |
| Upper calf | 10 (5) |
| Lower calf/ankle | 43 (22) |
| Foot | 41 (21) |
| Pain intensity (0-10), mean ± SD | |
| Low back painb | 5.3 ± 2.7 |
| Leg pain | 6.8 ± 1.8 |
| painDETECT Questionnaire (-1 to 38), mean ± SDc | 13 ± 5 |
| Short-Form McGill Pain Questionnaire 2 (0-10), mean ± SD | 3.3 ± 1.48 |
| Bothersomeness of symptoms (rated as extremely), % (n) | |
| Back pain | 18 (9) |
| Leg pain | 75 (38) |
| Numbness and tingling | 31 (16) |
| Weakness | 20 (10) |
| Anxiety and depression (HSCL-25) (0-4), mean ± SDd | 1.42 ± 0.3 |
| HSCL-25 scores ≥ 1.75, % (n) | 16 (8) |
| Oswestry Disability Index (0-100), mean ± SD | 41 ± 16 |
| Level of disc herniation and compromised nerve root, % (n)e | |
| L3/4 level | 8 (4) |
| L3 root | 2 (1) |
| L4 root | 6 (3) |
| L4/5 level | 31 (16) |
| L4 root | 2 (1) |
| L5 root | 25 (13) |
| L4 and L5 roots | 4 (2) |
| L5/sacrum level | 59 (30) |
| L5 root | 2 (1) |
| S1 root | 57 (29) |
| Uncertain level (L4/5 and L5/sacrum) | 2 (1) |
| Muscle weakness, % (n)f | |
| Full strength | 33 (17) |
| Mild weakness | 37 (19) |
| Severe weakness | 29 (15) |
| Reflex loss, % (n) | |
| No loss | 39 (20) |
| Decreased/reinforced | 22 (11) |
| Absent | 39 (20) |
In Norway, 12 years is equivalent to finalized upper secondary education.
Patients without pain at the named location and time of measurement were not included in the calculations (n = 47).
One patient did not complete the questionnaire form (n = 50).
Hopkins Symptom Checklist-25. An average item score of ≥ 1.75 was found to be a good predictor of current help-seeking behavior in a Norwegian epidemiological study and is commonly used to define cases with emotional distress [35].
Disc herniation level and compromised nerve root was based on a radiologist’s written report and an evaluation by the treating physician and physiotherapist as part of the clinical evaluation.
Weakness classified as: mild, representing Grade 1 on functional tests (slight weakness) or Grade 4 on manual tests (active movement against gravity and resistance), or severe, representing Grade ≥ 2 on functional tests (functional difficulty) or ≤ 3 on the manual tests (active movement against gravity).
Primary and Secondary Study Outcomes
Our primary study goals were to determine the frequency with which abnormal sensory findings occur in patients with lumbar disc herniation–related radicular pain and to determine which particular standard sensory test or combination of standard tests were most effective in establishing a sensory dysfunction. To achieve these two goals, we examined patients using a standard neurological sensory examination and calculated the proportions of abnormal sensory findings according to each modality alone, all tests together, and any combination of the tests.
Our secondary study goal was to determine whether a more detailed in-depth sensory examination procedure resulted in more patients being identified as having abnormal sensory findings. Thus, we examined patients with an additional semiquantitative in-depth sensory examination in the main pain area and compared the two procedures results, especially concerning the additional effect of the in-depth procedure in identifying abnormal sensory findings.
Clinical Examination
All patients were examined with a back pain–oriented assessment, which included a standard sensory assessment and an additional in-depth sensory assessment. The patients were informed before testing that participation in the study would not influence their treatment. Testing began with standardized instructions. Calibration of the sensory testing procedures was performed several times during the study duration. The same senior physiotherapist (EH) examined all patients. The physiotherapist did not have access to the patient-reported outcome measure during the consultation.
The back pain–oriented assessment included muscular strength, tendon reflexes, and neurodynamic tests (such as straight leg raise and slump test). Muscle strength was assessed by (1) functional tests, graded 0 to 3 (normal, slight weakness, functional difficulty, no or very little function), and (2) manual tests, graded 0 to 5 (no contraction, flicker or trace of contraction, active movement with gravity eliminated, active movement against gravity, active movement against gravity and resistance, normal power) [34]. Patients with a Grade 1 score on a functional test (slight weakness) or Grade 4 on a manual test (active movement against gravity and resistance) were categorized with a mild motor deficit, and those with Grade 2 or more on a functional test or 3 or less on a manual test were categorized with a severe motor deficit. Tendon reflexes (patella, medial hamstring, and Achilles) were categorized as absent, decreased/reinforced, or no loss.
Standard Neurological Sensory Examination
The standard sensory examination procedure (Fig. 1) was used to outline sensory abnormalities over the back and legs. The patient was instructed to look away or close their eyes during testing.
Fig. 1.

The standard sensory examination procedure over the back and legs. Cotton wool was used to assess dynamic light touch, a spring-loaded needle device with a reproducible pressure of ≈ 40 g (Neuropen NT0100, Owen Mumford) was used to assess static sharp touch or “pinprick,” steel rollers preheated to 25° C and 40° C ± 2° C (Rolltemp, Somedic SenseLab AB) were used to assess thermal stimuli, and a Rydel-Seiffer 64 Hz graduated (black triangle, 0-8 scale) tuning fork (Medicon) was tested on a bony prominence to assess vibration sensation.
Light Touch
Light touch was tested using cotton wool gently stroked across the skin at an angle, with a pressure of ≈ 25 ± 10 mN over a surface area of 1.5 to 2 cm2.
Pinprick
Pinprick was tested using a spring-loaded needle device with a reproducible pressure of ≈ 40 g (Neuropen NT0100, Owen Mumford, Woodstock, UK) applied perpendicular to the skin.
Thermal Sensation
Thermal sensation was tested using steel rollers preheated to 25° C and 40° C ± 2° C (Rolltemp, Somedic SenseLab AB, Sösdala, Sweden), which were rolled slowly on the skin with minimal pressure added to the weight of the instrument.
Vibration
Vibration was tested using a Rydel-Seiffer 64 Hz graduated (0-8 scale) tuning fork (Medicon, Tuttlingen, Germany) tested on a relevant bony prominence, for example, the medial prominence of the big toe in cases with suspected L5 radiculopathy, with two repetitions.
Procedures and Grading
The cotton wool, spring-loaded needle device, and steel rollers were applied on the back and throughout the whole leg, testing across the transverse plane and switching sides in a random fashion, taking care to cover most of the back and legs. If patients described the sensations from light touch, pinprick, or thermal rollers as distinctly reduced in the painful side compared with the contralateral reference side, a sensory loss was noted. In contrast, if the sensation was experienced as abnormally strong, unpleasant, or painful and distinctly stronger than the contralateral side, a sensory gain was noted. The patients’ perception of sensory loss or gain was mapped out on a standardized body chart, which formed the basis for further categorization of normal and abnormal sensory findings.
For vibration, the detection threshold corresponding to the tuning fork 0 to 8 black triangle scale was established by the patients’ immediate report when the perceived vibration sensation disappeared [39, 42]. A mean value of ≤ 4 or a mean difference of 3 (approximately 2 SDs of the control area) compared with the contralateral side was regarded as a sensory loss [33].
In case of ambiguous results or if patients were uncertain of what to respond to a given test, the results were coded as a normal response.
Combinations of Tests from the Standard Sensory Examination
Using the results from the standard sensory examination, we calculated the number of patients identified with an abnormal sensory finding when using the results from all combinations of the standard sensory procedure tests.
In-depth Sensory Examination in the Main Pain Area
The standard sensory examination was followed by an in-depth examination procedure (Fig. 2) at the center part of the main pain area, as outlined by the patients. This procedure was a pragmatic bedside-derived approximation to QST [41, 50]. It began with a demonstration on the patients’ arm, followed by testing the most painful area and the corresponding contralateral reference site, with two repetitions. The patient was instructed to look away or close their eyes during testing.
Fig. 2.

The in-depth sensory examination procedure in the center of the main pain area. Monofilaments with varying nominal force between ≈ 0.25 and 1078 mN (0.14-1.01 mm diameter) (SenseLab Aesthesiometer, Somedic SenseLab AB) were used to assess static punctate touch; a pressure transducer with 1 cm probe area and a pressure slope of ≈ 10 kPa/s (Algometer Type II, Somedic SenseLab AB) was used to assess pressure pain; a monofilament at ≈ 235 mN (SenseLab Aesthesiometer, Somedic SenseLab AB), using 10 stimuli at 1/s rate, within a 1 cm2 area, was used to assess wind-up phenomenon or the perceptual correlate of temporal pain summation; the blunt side of a Brush-05 (Somedic SenseLab AB) was used to assess static blunt pressure; a Brush-05 with force of 200 ± 100 mN (Somedic SenseLab AB) was used to assess dynamic light touch; and the same instruments as for the standard procedure was used to assess vibration, static sharp touch, and thermal stimuli (see Fig. 1).
Punctate Touch
The punctate touch detection threshold was tested using Semmes-Weinstein type monofilaments with varying nominal force between ≈ 0.25 and 1078 mN (0.14-1.01 mm diameter) (SenseLab Aesthesiometer, Somedic SenseLab AB) applied according to the manufacturer’s manual. The threshold was established with three series of ascending and descending stimulus intensities, followed by a confirmation test with the nearest softer filament. We coded the result with the mean value of three test series.
Pressure Pain
The pressure pain threshold was tested using a pressure transducer with a 1-cm probe area and a slope of ≈ 10 kPa/s (Algometer Type II, Somedic SenseLab AB). The threshold was established by a patient-operated switch, which was engaged when the pressure was perceived to be painful and calculated as the mean of two trials.
Vibration
The vibration detection threshold was tested using a Rydel-Seiffer 64 Hz graduated (0-8 scale) tuning fork (Medicon). The threshold was tested bilaterally and established by the patients’ immediate report when the perceived vibration sensation disappeared. The result was coded with the mean value of two repetitions, corresponding to the tuning fork’s black triangle 0 to 8 scale [39, 42].
Wind-up Phenomenon
The wind-up phenomenon (that is, the perceptual correlate of temporal pain summation) was tested by applying a monofilament at ≈ 235 mN (SenseLab Aesthesiometer, Somedic SenseLab AB) using 10 stimuli at a rate of 1/s within 1 cm2 of the central main pain area, repeated three times. Patients scored a baseline pain level after a single stimulus and a final pain level after the last stimulus using a verbal pain rating scale (0-10). The baseline level was used as the control because the contralateral tests gave no positive results. The wind-up ratio was calculated as the mean final pain level divided by mean baseline pain level.
Grading of Punctate Touch, Pressure Pain, and Wind-up
The values for thresholds to punctate touch, pressure pain, and wind-up were log-transformed (base 10) [41]. To categorize individual findings for punctate touch, pressure pain, vibration, or wind-up phenomenon, either the raw data or logarithmically transformed data were z-transformed to give a standard normal distribution with zero mean and unit variance by subtracting the mean value of the corresponding reference, then dividing by the respective SD. Z-values outside the 95% confidence interval (values exceeding 1.96/-1.96) were coded as abnormal loss or abnormal gain, depending on the direction of the z-value.
Static Blunt Pressure
Static blunt pressure or touch was tested using the blunt side of a Brush-05 (Somedic SenseLab AB) with just enough pressure to indent the skin.
Dynamic Touch
Dynamic touch was tested with three strokes over 2 to 3 cm using a Brush-05 (Somedic SenseLab AB), which exerts a force of 200 ± 100 mN when brought in contact with the skin at an angle and moved a few millimeters until the brush filaments slightly bend.
Pinprick
Pinprick or static sharp touch was tested using a spring-loaded needle device with a reproducible pressure of ≈ 40 g (Neuropen NT0100, Owen Mumford) applied perpendicular to the skin four times.
Thermal Sensation
Thermal sensation was tested by steel rollers preheated to 25° C and 40 ± 2° C (Rolltemp, Somedic SenseLab AB), which were rolled slowly on the skin with minimal pressure added to the weight of the instrument.
Grading of Static Blunt Pressure, Dynamic Touch, Pinprick, and Thermal Sensation
The patient graded static blunt pressure, dynamic touch, pinprick, and thermal sensation in relation to the corresponding contralateral side and was scored as either no sensation, decreased, normal (or the same as the contralateral side), or increased sensation (if experienced as abnormally strong, unpleasant, or painful and distinctly stronger than the contralateral side). A score of either decreased or no sensation was classified as sensory loss and increased sensation was classified as sensory gain. Any pain elicited was scored on a 0 to 10 verbal pain rating scale. Pain from pinprick was only noted if the patient subjectively felt pain distinctly more pronounced in the pain area. When there were ambiguous results or inconsistency between the two repetitions of each test (one normal and one abnormal response), the results were coded as a normal response.
Patient-reported Measures
We measured low back pain and leg pain intensity during the last week using numeric rating scales with anchors of no pain (0) to worst imaginable pain (10). Pain and neuropathic pain components were assessed by the Norwegian Short-Form McGill Pain Questionnaire 2 (SF-MPQ-2) [11, 20] and the painDETECT Questionnaire [14, 19]. The bothersomeness of back pain, leg pain, numbness or tingling, and leg weakness during the last week was assessed using a numeric rating scale and presented here as not/somewhat bothersome (values 0-3) or extremely bothersome (values 4-5). We assessed anxiety and depression using the Hopkins Symptom Checklist-25 (HSCL-25) [22]. Pain-related disability was assessed using the Oswestry Disability Index (ODI) [5, 15]. Use of pain medication was measured by self-reported frequency of use and classified as daily, weekly, or monthly/no use.
Ethical Approval
The Norwegian Regional Committees for Medical and Health Research Ethics South-East approved this study (ref: S-0723b).
Statistical Analysis
The proportions are presented as percentages and rounded to the nearest whole number in the text. Paired binary outcomes were analyzed using the McNemar χ2 test without continuity correction [12] and reported with Cohen g effect size measure. All analyses were performed in R (v. 3.5.1, R Foundation for Statistical Computing, Vienna, Austria, 2018) and RStudio (v. 1.1.463, Rstudio Inc, Boston, MA, USA) with the package tidyverse (v. 1.2.1) [54]. Graphical vectorization was performed in Inkscape (v. 0.92.4, The Inkscape Project, Boston, MA, USA) and Affinity Designer (v. 1.8.3, Serif Europe Ltd, Nottingham, UK).
Results
Standard Neurological Sensory Exam: Frequency of Abnormal Sensory Findings
The standard examination found at least one abnormal finding in 88% (45 of 51) of patients. Sensory loss was present in 80% (41), while gain phenomena (sensations experienced as abnormally strong, unpleasant, or painful and distinctly stronger than the contralateral side) were present in 35% (18). The changes were found throughout the respective nerve root dermatome (Fig. 3). Fifty-one percent (26) of the patients had sensory loss signs only, while 6% (3) had sensory gain signs only. The single most commonly affected modality was loss to pinprick (55% [28]), followed by loss to touch (53% [27]), and warmth and cold (49% [25] and 45% [23]) (Fig. 4). Findings of gain phenomenon were less common; hyperalgesia (gain) to pinprick occurred in 24% (12). The test with the highest frequency of abnormal findings (including both loss and gain phenomena) was pinprick (75% [38]), followed by warmth, touch, and cold ≥ 53%). Reduced sense of vibration as tested on a bony prominence occurred in 6% (3) of the patients.
Fig. 3.

Sensory findings according to the affected nerve root (n = 48) are shown here. Three patients with more than one affected root are not included in the figure. Areas with sensory findings by the standard procedure, including loss or gain to light touch, pinprick, and warmth or cold, are projected on the left leg in green. The main pain area, as reported by the patient, is projected on the right leg in red. The darker color indicates a higher number of patients. The outlines were produced through digital vectorization of drawings on a standardized body chart. Determination of the affected nerve root was based on a radiologist’s written MRI report and clinical evaluation. A color image accompanies the online version of this article.
Fig. 4.
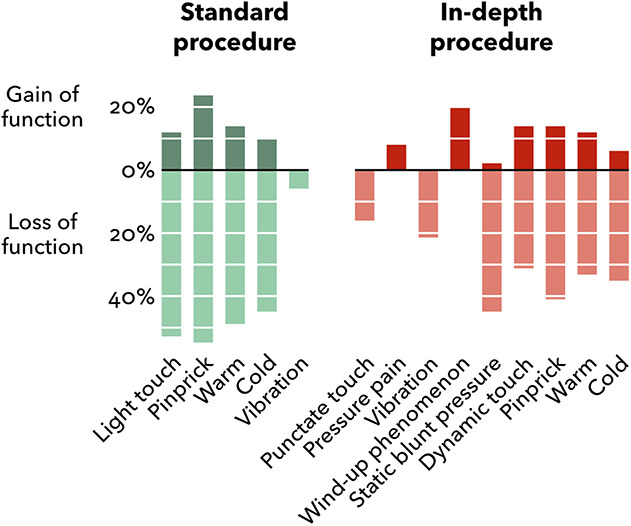
Proportions of patients with sensory gain and loss according to the standard in-depth procedures (n = 51). Green columns represent the standard procedure and the red columns represent the in-depth procedure. Columns above and below the line represent gain and loss of function, respectively. The patients could have concurrent loss and gain phenomena for a single modality at different locations in the standard procedure. Sensory abnormalities in the in-depth procedure were either loss or gain at the specific location tested. Altered sensations not clearly perceived as loss or gain, as reported by two patients, were not included (that is, light touch and thermal stimuli).
Standard Neurological Sensory Exam: Combinations of Tests
The combination of pinprick and light touch combined identified all patients who were classified with abnormal findings by the full standard examination (88% [45 of 51]). Other combinations identified fewer patients. The most effective combinations were pinprick–warm–cold, 84% (43); pinprick–warm or pinprick–cold, 82% (42); light touch–warm, 78% (40); pinprick–vibration, 76% (39) (Fig. 5).
Fig. 5.
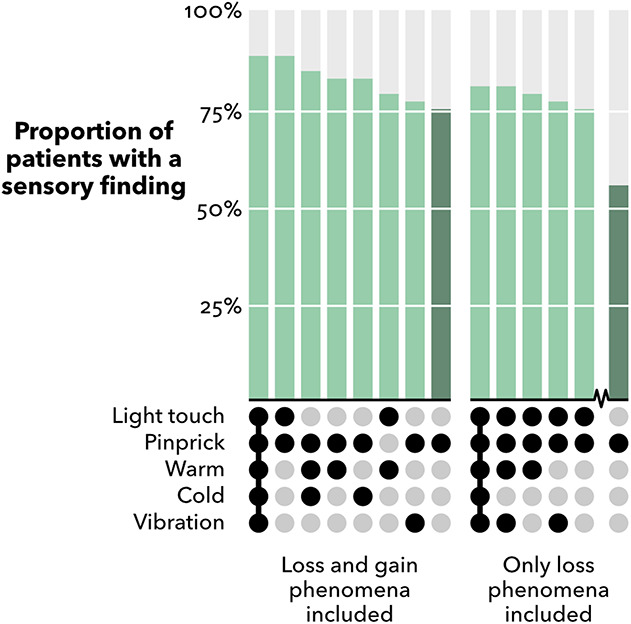
Frequencies of abnormal sensory findings by combinations of modalities from the standard examination procedure (n = 51). Modalities or combinations of modalities identifying < 75% of patients are not shown. Pinprick alone is included for comparison (dark green). The simplest possible set for a given frequency is shown, that is, the superfluous modalities to a given set are not included.
When only loss phenomena were included, the combination of pinprick and light touch identified 75% (38 of 51) of patients. Adding vibration and warmth loss only slightly increased the number of patients with an abnormal test (76% [39] and 78% [40], respectively). When combined, these four modalities identified sensory loss in (80% [41]) of patients.
In-depth Sensory Exam: Frequency of Abnormal Sensory Findings
The semiquantitative in-depth procedure only identified an additional 6% (3 of 51) of patients with an abnormal finding compared with the standard procedure (Table 2). One patient had no abnormal finding in the in-depth procedure but an abnormal finding in the standard procedure (detected by light touch) (Table 3). In total, 92% (47) of patients were categorized with an abnormal sensory finding by the in-depth procedure, while 55% (28) had loss only and 16% (8) had gain only. Sensory loss was most commonly detected by static blunt pressure (45% [23]) and loss to pinprick (41% [21]). Gain of function to wind-up phenomenon occurred in 20% (10) and to dynamic touch, pinprick, and warm stimuli in 12% (6) to 14% (7) of patients.
Table 2.
Abnormal sensory findings by the standard and in-depth procedures (n = 51)
| Loss of function,a | Gain of function,a | Other,b | Any abnormal finding, | |
| Procedure/sensory modality | % (n) | % (n) | % (n) | % (n) |
| Standard procedure (back and legs) | 80 (41) | 35 (18) | 88 (45) | |
| Light touch | 53 (27) | 12 (6) | 2 (1) | 61 (31) |
| Pinprick | 55 (28) | 24 (12) | 75 (38) | |
| Vibration on bony prominence | 6 (3) | 6 (3) | ||
| Warm 40° C | 49 (25) | 14 (7) | 2 (1) | 63 (32) |
| Cold 25° C | 45 (23) | 10 (5) | 2 (1) | 53 (27) |
| In-depth procedure (main pain area) | 76 (39) | 37 (19) | 92 (47) | |
| Punctate touch (monofilament) | 16 (8) | 16 (8) | ||
| Pressure pain (algometry) | 8 (4) | 8 (4) | ||
| Vibration in main pain area | 22 (11) | 22 (11) | ||
| Wind-up phenomenon | 20 (10) | 20 (10) | ||
| Static blunt pressure | 45 (23) | 2 (1) | 47 (24) | |
| Dynamic touch (brush) | 31 (16) | 14 (7) | 45 (23) | |
| Pinprick | 41 (21) | 14 (7) | 55 (28) | |
| Warm 40° C | 33 (17) | 12 (6) | 45 (23) | |
| Cold 25° C | 35 (18) | 6 (3) | 41 (21) |
If patients described the sensations during the standard procedure as distinctly reduced in the painful side compared with the contralateral reference side, a sensory loss was noted (loss of function). In contrast, if the sensation was experienced as abnormally strong, unpleasant, or painful and distinctly stronger than the contralateral side, a sensory gain was noted (gain of function). To categorize loss or gain for the in-depth procedure tests of punctate touch, pressure pain, or wind-up phenomenon, either the raw data or logarithmically transformed data were z-transformed to give a standard normal distribution with zero mean and unit variance by subtracting the mean value of the corresponding reference, then dividing it by the respective SD. Z-values outside the 95 confidence interval (values exceeding 1.96/-1.96) were coded as loss or gain of function depending on the direction of the z-value. Grading of the in-depth procedure tests of static blunt pressure, dynamic touch, pinprick, or thermal stimuli was done subjectively by the patient in relation to the corresponding contralateral side and scored as either no sensation, decreased, normal (or same as the contralateral side), or increased sensation (if experienced as abnormally strong, unpleasant, or painful and distinctly stronger than the contralateral side). A score of no sensation or decreased was noted as loss of function, and increased sensation was noted as gain of function.
Two patients reported altered sensation to the test stimulus, which was not clearly perceived as loss or gain.
Table 3.
Contingency table comparing abnormal sensory findings (+) and no findings (−) in the standard and in-depth procedures
| Standard | ||||
| + | − | Total | ||
| In-depth | + | 44 | 3 | 47 |
| − | 1 | 3 | 4 | |
| Total | 45 | 6 | 51 | |
McNemar test: p = 0.32; Cohen g = 0.25.
In the in-depth procedure (both loss and gain phenomenon included), the most commonly affected modality was pinprick (55% [28 of 51]), followed by blunt pressure, dynamic touch, and warm and cold stimuli (≥ 41%). Abnormal vibration and pressure pain threshold occurred in 22% (11) and 8% (4) of patients, respectively. Including vibration tested on the bony prominence, as used in the standard procedure, together with vibration in the main pain area did not result in higher proportions of findings.
When assessing the main pain area only, the standard procedure did not detect any sensory abnormalities in 27% (14) of patients. That is, in 14 of 51 patients, the four standard tests did not find sensory loss or gain in the area in which the in-depth tests were performed. Of those 14 patients, 11 had an abnormal finding by the in-depth procedure.
Discussion
Sensory signs are regarded as the hallmark symptom for neuropathic pain or radiculopathies. Establishing an adequate sensory examination procedure in the setting of low back–related leg pain may help to identify nerve root involvement correctly. Findings of sensory abnormalities may influence decision-making for treatment, referral to spinal imaging or surgical consultation, and improve patient classification in research settings. Our results suggest that sensory abnormalities are present in most patients with lumbar disc herniation–related pain, provided that the patients are examined in enough detail. In the present study, 92% (47 of 51) of the patients had at least one abnormal finding by a comprehensive in-depth examination procedure and 88% (45 of 51) by a standard procedure. However, the combination of only two standard tests (pinprick and light touch) also identified 88% of patients. The skills needed for light touch and pinprick tests are already familiar to most clinicians and the cotton wool and a spring-loaded needle-device used here are readily available and applicable in most clinical settings.
Limitations
This study should be interpreted in light of its limitations. Sensory examination results depend on the clinician’s experience, the technique used, and the communication between patient and clinician. One investigator performed the sensory examinations and collected the data; this likely improved consistency, but this consistency may have come at the cost of generalizability. Still, we believe the physical examination modalities we used are familiar to most surgeons, and we do not believe this is a serious shortcoming of our approach. To err on the side of caution in case of ambiguous results or uncertainties to a given test, the results were coded as normal to avoid inflating the abnormal findings. Throughout the study, we routinely calibrated the testing procedures for consistency and reproducibility. The investigator has more than 10 years of experience with this patient population. Although we believe the internal study consistency of testing was reliable, the dependability of assessing light touch using cotton wool may vary between approaches, depending on factors such as the angle to the skin and the pressure applied. Pressures have been found at ≈ 3 mN for a cotton wisp, 100 mN for a cotton swab fixed to an elastic strip, and 150 to 250 mN for a soft brush [41, 50]. The present study aimed to test with a larger surface (1.5-2 cm2) than a thin cotton wisp but still with a fairly low total pressure at ≈ 25 mN, or about 2.5 g of force. Using the standardized Brush-05 could potentially increase reproducibility but involves additional costs with regard to cleaning. Pinprick assessment using the spring-loaded needle device has been found acceptable with regard to within- and between-examiner reliability, and as a simplified alternative to quantitative sensory threshold testing for assessing peripheral nerve function [38, 51]. Sensory test results may also vary according to the number and frequency of repetitions used, the length and velocity of a stroke, the duration of skin contact, interstimulus intervals, the use of cross side for comparison, and choice of reference area. There are no formal standards for these elements for routine use.
All tests were subjectively compared with the contralateral reference area. There is some evidence that sensory changes can manifest in the asymptomatic side [37]; thus, we cannot rule out that some subtle disturbances may have been unnoticed. In addition, the use of the contralateral area as reference is susceptible to bias because of possible intraindividual between-side variability and preexisting sensory disturbances that potentially increase the likelihood of false positives [32, 40, 48]. To reduce this bias, we excluded patients with other illness interfering with the study purpose and coded the test results as a normal finding in case of an ambiguous or uncertain response.
The likelihood of detection by the semiquantitative in-depth procedure would likely also increase with a more comprehensive QST protocol, such as suggested by the German Research Network on Neuropathic Pain [40].
Our sample had baseline characteristics comparable to previous studies in secondary health care [2, 21, 52], and we included patients through regular referral routines; however, the presence of sensory dysfunction may have influenced referral. A UK study showed that 65% of patients referred to spinal specialist services had sensory deficits compared with 49% among those not referred [26]. Due to the limited sample size and specialist setting, our results need replication in primary care, such as in a general practice or physiotherapist setting.
Standard Neurological Sensory Exam: Frequency of Abnormal Sensory Findings
The standard examination procedure classified 88% (45 of 51) of patients as having abnormal findings. Our results are in line with a study of patients with long-standing lumbar nerve root symptoms, which reported 77% with disturbed sensibility to pinprick and 57% to touch [6]. Our group previously reported sensory loss to touch in 58% of 380 comparable patients [16]. Our findings concerning thermal stimuli and vibration are also in line with a prior study using QST [1]. Elevated vibratory thresholds in as many as 92% of patients have been reported using a higher frequency electrical tuning fork [53]. In the present study, only patients with lumbar disc herniation–related pain were included. Thus, we cannot assess the discriminative ability of the sensory tests to discern low back–related leg pain of neuropathic origin from that of nonneuropathic origin. Previous studies have found altered responses to pinprick to be substantially more prevalent in patients with radicular low back pain compared with those without [25, 44].
Combinations of Tests from the Standard Sensory Examination
We found that the combination of pinprick and light touch identified all patients who were classified with abnormal findings by the full standard examination. Seventy-five percent (38 of 51) of the patients had an abnormal response to pinprick, 61% (31) to light touch, and 88% (45) to both tests combined. Thus, applying both pinprick and light touch seems to be an adequate and feasible minimal approach for diagnostic and classification purposes. We are not aware of previous studies evaluating combinations of sensory tests in patients with lumbar radicular pain and our findings need replication. However, our results suggest that a single sensory test should not be used in this setting, rather combinations of sensory tests should be performed.
In-depth Sensory Exam: Frequency of Abnormal Sensory Findings
Because of the efficacy of the standard procedure, adding a comprehensive in-depth examination only marginally increased the number of patients with sensory dysfunction (from 88% to 92%). There may be several explanations why the in-depth procedure did not perform markedly better. First, the standard procedure assesses a larger area and may reach saturation, leaving few remaining patients with detectable sensory abnormalities in the painful area only. Second, punctate touch, pressure pain, wind-up, and vibration may have been influenced by our scoring criteria. As recommended [41], we performed a z-transformation based on the mean of all reference scores of the respective modality. This may have widened the 95% confidence intervals, potentially causing omission of minor findings. In a few aspects, our method deviated from those used to generate reference values, precluding direct comparisons [40]. Comparing findings with normative data from a symptom-free population would be desirable, but our approach was chosen because all patients were tested in different areas, making the use of external reference scores more difficult.
Although thermal assessment has been found valuable in lumbar radiculopathy [36, 55] and abnormal responses to cold stimulation have been shown to be one of the key indicators of radicular low back pain [44], the cold and warmth tests did not improve the overall results in the present study. However, the use of a more complete neurological assessment or QST, including the assessment of both mechanical and thermal modalities, may be important for diagnostic purposes in cases with undisclosed pain conditions [17]. For instance, the assessment of vibration was found to be important for distinguishing postherpetic neuralgia from chronic low back–related axial or lumbar disc herniation–related pain and painful diabetic polyneuropathy [44].
In the present study, one-third of the patients had sensory gain phenomena (sensations experienced as abnormally strong, unpleasant, or painful and distinctly stronger than the contralateral side). Positive sensory signs are not considered a specific indicator of neuropathic pain [13, 40], and the evidence on gain phenomena in low back–related leg pain is scarce. Positive sensory symptoms could mask sensory loss and have been linked to anxiety, sleep, and stress [7, 45, 47], which are arguably important in this setting. Positive sensory signs have been suggested to be useful in phenotyping patients with neuropathic pain and can potentially guide treatments [10]. Although the implications of this finding remain to be established, increased awareness of positive sensory signs in patients with low back–related leg pain seems justified.
Conclusion
We found that most patients with lumbar disc herniation–related radicular pain had sensory abnormalities. To detect sensory abnormalities, our results suggest a combination of pinprick and light touch tests as a feasible and sufficient approach for diagnostic and classification purposes. Applying a comprehensive semiquantitative test procedure did not markedly improve the detection rate, but a single test such as pinprick or light touch alone is insufficient. Further research is needed to confirm and extend our findings, perhaps by evaluating other settings (such as the primary care clinic; our work was done in a specialist clinic). To evaluate the accuracy of the suggested pinprick and light touch procedure, future studies also should include individuals without symptoms as well as patients with nonspecific low back pain.
Footnotes
All ICMJE Conflict of Interest Forms for authors and Clinical Orthopaedics and Related Research® editors and board members are on file with the publication and can be viewed on request.
Each author certifies that neither he nor she, nor any member of his or her immediate family, has funding or commercial associations (consultancies, stock ownership, equity interest, patent/licensing arrangements, etc.) that might pose a conflict of interest in connection with the submitted article.
Clinical Orthopaedics and Related Research® neither advocates nor endorses the use of any treatment, drug, or device. Readers are encouraged to always seek additional information, including FDA approval status, of any drug or device before clinical use.
Ethical approval for this study was obtained from the Norwegian Regional Committees for Medical and Health Research Ethics South-East (ref: S-0723b).
Contributor Information
Anne Julsrud Haugen, Email: anne.julsrud.haugen@so-hf.no.
Lars Grøvle, Email: lars.grovle@so-hf.no.
References
- 1.Andrasinova T, Kalikova E, Kopacik R, et al. Evaluation of the neuropathic component of chronic low back pain. Clin J Pain. 2019;35:7-17. [DOI] [PubMed] [Google Scholar]
- 2.Atlas SJ, Keller RB, Wu YA, Deyo RA, Singer DE. Long-term outcomes of surgical and nonsurgical management of sciatica secondary to a lumbar disc herniation: 10 year results from the maine lumbar spine study. Spine (Phila Pa 1976). 2005;30:927-935. [DOI] [PubMed] [Google Scholar]
- 3.Attal N, Lanteri-Minet M, Laurent B, Fermanian J, Bouhassira D. The specific disease burden of neuropathic pain: results of a French nationwide survey. Pain. 2011;152:2836-2843. [DOI] [PubMed] [Google Scholar]
- 4.Backonja MM, Attal N, Baron R, et al. Value of quantitative sensory testing in neurological and pain disorders: NeuPSIG consensus. Pain. 2013;154:1807-1819. [DOI] [PubMed] [Google Scholar]
- 5.Baker DJ, Pynsent PB, Fairbank JCT. The Oswestry disability index revisited: its reliability, repeatability and validity, and a comparison with the St Thomas’s disability index. In: Roland MO, Jenner JR, eds. Back Pain: New Approaches to Rehabilitation and Education. Manchester University Press; 1990:175–181. [Google Scholar]
- 6.Bertilson BC, Brosjo E, Billing H, Strender LE. Assessment of nerve involvement in the lumbar spine: agreement between magnetic resonance imaging, physical examination and pain drawing findings. BMC Musculoskelet Disord. 2010;11:202. [DOI] [PMC free article] [PubMed] [Google Scholar]
- 7.Crettaz B, Marziniak M, Willeke P, et al. Stress-induced allodynia--evidence of increased pain sensitivity in healthy humans and patients with chronic pain after experimentally induced psychosocial stress. PLoS One. 2013;8:e69460. [DOI] [PMC free article] [PubMed] [Google Scholar]
- 8.Cruccu G, Sommer C, Anand P, et al. EFNS guidelines on neuropathic pain assessment: revised 2009. Eur J Neurol. 2010;17:1010-1018. [DOI] [PubMed] [Google Scholar]
- 9.Cruz-Almeida Y, Fillingim RB. Can quantitative sensory testing move us closer to mechanism-based pain management? Pain Med. 2014;15:61-72. [DOI] [PMC free article] [PubMed] [Google Scholar]
- 10.Demant DT, Lund K, Vollert J, et al. The effect of oxcarbazepine in peripheral neuropathic pain depends on pain phenotype: a randomised, double-blind, placebo-controlled phenotype-stratified study. Pain. 2014;155:2263-2273. [DOI] [PubMed] [Google Scholar]
- 11.Dworkin RH, Turk DC, Revicki DA, et al. Development and initial validation of an expanded and revised version of the Short-form McGill Pain Questionnaire (SF-MPQ-2). Pain. 2009;144:35-42. [DOI] [PubMed] [Google Scholar]
- 12.Fagerland MW, Lydersen S, Laake P. The McNemar test for binary matched-pairs data: mid-p and asymptotic are better than exact conditional. BMC Med Res Methodol. 2013;13:91. [DOI] [PMC free article] [PubMed] [Google Scholar]
- 13.Finnerup NB, Haroutounian S, Kamerman P, et al. Neuropathic pain: an updated grading system for research and clinical practice. Pain. 2016;157:1599-1606. [DOI] [PMC free article] [PubMed] [Google Scholar]
- 14.Freynhagen R, Baron R, Gockel U, Tolle TR. painDETECT: a new screening questionnaire to identify neuropathic components in patients with back pain. Curr Med Res Opin. 2006;22:1911-1920. [DOI] [PubMed] [Google Scholar]
- 15.Grotle M, Brox JI, Vollestad NK. Cross-cultural adaptation of the Norwegian versions of the Roland-Morris Disability Questionnaire and the Oswestry Disability Index. J Rehabil Med. 2003;35:241-247. [DOI] [PubMed] [Google Scholar]
- 16.Grovle L, Haugen AJ, Natvig B, Brox JI, Grotle M. The prognosis of self-reported paresthesia and weakness in disc-related sciatica. Eur Spine J. 2013;22:2488-2495. [DOI] [PMC free article] [PubMed] [Google Scholar]
- 17.Hansson P. Possibilities and potential pitfalls of combined bedside and quantitative somatosensory analysis in pain patients. In: Boivie J, Hansson P, Lindblom U, ed. Touch, Temperature, and Pain in Health and Disease: Mechanisms and Assessments. Progress in Pain Research and Management, Volume 3. IASP Press; 1994:113-132. [Google Scholar]
- 18.Hansson P, Backonja M, Bouhassira D. Usefulness and limitations of quantitative sensory testing: clinical and research application in neuropathic pain states. Pain. 2007;129:256-259. [DOI] [PubMed] [Google Scholar]
- 19.Hasvik E, Haugen AJ, Gjerstad J, Grovle L. Assessing neuropathic pain in patients with low back-related leg pain: comparing the painDETECT questionnaire with the 2016 NeuPSIG grading system. Eur J Pain. 2018;22:1160-1169. [DOI] [PubMed] [Google Scholar]
- 20.Hasvik E, Haugen AJ, Haukeland-Parker S, Rimehaug SA, Gjerstad J, Grovle L. Cross-cultural adaptation and validation of the Norwegian Short-form McGill pain questionnaire-2 in low back-related leg pain. Spine (Phila Pa 1976). 2019;44:E774-E781. [DOI] [PubMed] [Google Scholar]
- 21.Haugen AJ, Brox JI, Grovle L, et al. Prognostic factors for non-success in patients with sciatica and disc herniation. BMC Musculoskelet Disord. 2012;13:183. [DOI] [PMC free article] [PubMed] [Google Scholar]
- 22.Hesbacher PT, Rickels K, Morris RJ, Newman H, Rosenfeld H. Psychiatric illness in family practice. J Clin Psychiatry. 1980;41:6-10. [PubMed] [Google Scholar]
- 23.Haanpaa M, Attal N, Backonja M, et al. NeuPSIG guidelines on neuropathic pain assessment. Pain. 2011;152:14-27. [DOI] [PubMed] [Google Scholar]
- 24.Iversen T, Solberg TK, Romner B, et al. Accuracy of physical examination for chronic lumbar radiculopathy. BMC Musculoskelet Disord. 2013;14:206. [DOI] [PMC free article] [PubMed] [Google Scholar]
- 25.Konstantinou K, Dunn KM, Ogollah R, Vogel S, Hay EM; the Atlas Study Research Team. Characteristics of patients with low back and leg pain seeking treatment in primary care: baseline results from the ATLAS cohort study. BMC Musculoskelet Disord. 2015;16:332. [DOI] [PMC free article] [PubMed] [Google Scholar]
- 26.Konstantinou K, Dunn KM, van der Windt D, et al. Subgrouping patients with sciatica in primary care for matched care pathways: development of a subgrouping algorithm. BMC Musculoskelet Disord. 2019;20:313. [DOI] [PMC free article] [PubMed] [Google Scholar]
- 27.Konstantinou K, Hider SL, Jordan JL, Lewis M, Dunn KM, Hay EM. The impact of low back-related leg pain on outcomes as compared with low back pain alone: a systematic review of the literature. Clin J Pain. 2013;29:644-654. [DOI] [PubMed] [Google Scholar]
- 28.Kortelainen P, Puranen J, Koivisto E, Lahde S. Symptoms and signs of sciatica and their relation to the localization of the lumbar disc herniation. Spine (Phila Pa 1976). 1985;10:88-92. [DOI] [PubMed] [Google Scholar]
- 29.Kreiner DS, Hwang SW, Easa JE, et al. An evidence-based clinical guideline for the diagnosis and treatment of lumbar disc herniation with radiculopathy. Spine J. 2014;14:180-191. [DOI] [PubMed] [Google Scholar]
- 30.Leffler AS, Hansson P. Painful traumatic peripheral partial nerve injury-sensory dysfunction profiles comparing outcomes of bedside examination and quantitative sensory testing. Eur J Pain. 2008;12:397-402. [DOI] [PubMed] [Google Scholar]
- 31.Lurie JD, Tosteson TD, Tosteson AN, et al. Surgical versus nonoperative treatment for lumbar disc herniation: eight-year results for the spine patient outcomes research trial. Spine (Phila Pa 1976). 2014;39:3-16. [DOI] [PMC free article] [PubMed] [Google Scholar]
- 32.Maier C, Baron R, Tolle TR, et al. Quantitative sensory testing in the German Research Network on Neuropathic Pain (DFNS): somatosensory abnormalities in 1236 patients with different neuropathic pain syndromes. Pain. 2010;150:439-450. [DOI] [PubMed] [Google Scholar]
- 33.Martina IS, van Koningsveld R, Schmitz PI, van der Meche FG, van Doorn PA. Measuring vibration threshold with a graduated tuning fork in normal aging and in patients with polyneuropathy. European Inflammatory Neuropathy Cause and Treatment (INCAT) group. J Neurol Neurosurg Psychiatry. 1998;65:743-747. [DOI] [PMC free article] [PubMed] [Google Scholar]
- 34.Medical Research Council. Aids to Examination of the Peripheral Nervous System. Memorandum No. 45. Her Majesty's Stationery Office; 1976. [Google Scholar]
- 35.Nettelbladt P, Hansson L, Stefansson CG, Borgquist L, Nordstrom G. Test characteristics of the Hopkins Symptom Check List-25 (HSCL-25) in Sweden, using the Present State Examination (PSE-9) as a caseness criterion. Soc Psychiatry Psychiatr Epidemiol. 1993;28:130-133. [DOI] [PubMed] [Google Scholar]
- 36.Nygaard OP, Kloster R, Solberg T, Mellgren SI. Recovery of function in adjacent nerve roots after surgery for lumbar disc herniation: use of quantitative sensory testing in the exploration of different populations of nerve fibers. J Spinal Disord. 2000;13:427-431. [DOI] [PubMed] [Google Scholar]
- 37.Nygaard OP, Mellgren SI. The function of sensory nerve fibers in lumbar radiculopathy. Use of quantitative sensory testing in the exploration of different populations of nerve fibers and dermatomes. Spine (Phila Pa 1976). 1998;23:348-352. [DOI] [PubMed] [Google Scholar]
- 38.Paisley A, Abbott C, van Schie C, Boulton A. A comparison of the Neuropen against standard quantitative sensory-threshold measures for assessing peripheral nerve function. Diabet Med. 2002;19:400-405. [DOI] [PubMed] [Google Scholar]
- 39.Panosyan FB, Mountain JM, Reilly MM, Shy ME, Herrmann DN. Rydel-Seiffer fork revisited: beyond a simple case of black and white. Neurology. 2016;87:738-740. [DOI] [PMC free article] [PubMed] [Google Scholar]
- 40.Rolke R, Baron R, Maier C, et al. Quantitative sensory testing in the German Research Network on Neuropathic Pain (DFNS): standardized protocol and reference values. Pain. 2006;123:231-243. [DOI] [PubMed] [Google Scholar]
- 41.Rolke R, Magerl W, Campbell KA, et al. Quantitative sensory testing: a comprehensive protocol for clinical trials. Eur J Pain. 2006;10:77-88. [DOI] [PubMed] [Google Scholar]
- 42.Rydel A, Seiffer W. Investigations on the feeling of vibration or the so-called "bone sensitivity" (pallesthesia) [in German]. Archiv für Psychiatrie und Nervenkrankheiten. 1903;37:488-536. [Google Scholar]
- 43.Schmid AB, Bland JD, Bhat MA, Bennett DL. The relationship of nerve fibre pathology to sensory function in entrapment neuropathy. Brain. 2014;137:3186-3199. [DOI] [PMC free article] [PubMed] [Google Scholar]
- 44.Scholz J, Mannion RJ, Hord DE, et al. A novel tool for the assessment of pain: validation in low back pain. PLoS Med. 2009;6:e1000047. [DOI] [PMC free article] [PubMed] [Google Scholar]
- 45.Schuh-Hofer S, Wodarski R, Pfau DB, et al. One night of total sleep deprivation promotes a state of generalized hyperalgesia: a surrogate pain model to study the relationship of insomnia and pain. Pain. 2013;154:1613-1621. [DOI] [PubMed] [Google Scholar]
- 46.Tawa N, Rhoda A, Diener I. Accuracy of clinical neurological examination in diagnosing lumbo-sacral radiculopathy: a systematic literature review. BMC Musculoskelet Disord. 2017;18:93. [DOI] [PMC free article] [PubMed] [Google Scholar]
- 47.Tesarz J, Gerhardt A, Leisner S, Janke S, Treede RD, Eich W. Distinct quantitative sensory testing profiles in nonspecific chronic back pain subjects with and without psychological trauma. Pain. 2015;156:577-586. [DOI] [PubMed] [Google Scholar]
- 48.Treede R-D, Baron R. How to detect a sensory abnormality. Eur J Pain. 2008;12:395-396. [DOI] [PubMed] [Google Scholar]
- 49.van der Windt DA, Simons E, Riphagen, et al. Physical examination for lumbar radiculopathy due to disc herniation in patients with low-back pain. Cochrane Database Syst Rev. 2010;(2):CD007431. [DOI] [PubMed] [Google Scholar]
- 50.Walk D, Sehgal N, Moeller-Bertram T, et al. Quantitative sensory testing and mapping: a review of nonautomated quantitative methods for examination of the patient with neuropathic pain. Clin J Pain. 2009;25:632-640. [DOI] [PubMed] [Google Scholar]
- 51.Wasan AD, Alter BJ, Edwards RR, et al. Test-retest and inter-examiner reliability of a novel bedside quantitative sensory testing battery in postherpetic neuralgia patients. J Pain. 2020;21:858-868. [DOI] [PMC free article] [PubMed] [Google Scholar]
- 52.Weinstein JN, Tosteson TD, Lurie JD, et al. Surgical vs nonoperative treatment for lumbar disk herniation: the Spine Patient Outcomes Research Trial (SPORT): a randomized trial. JAMA. 2006;296:2441-2450. [DOI] [PMC free article] [PubMed] [Google Scholar]
- 53.Weise MD, Garfin SR, Gelberman RH, Katz MM, Thorne RP. Lower-extremity sensibility testing in patients with herniated lumbar intervertebral discs. J Bone Joint Surg Am. 1985;67:1219-1224. [PubMed] [Google Scholar]
- 54.Wickham H, Averick M, Bryan J, et al. Welcome to the tidyverse. Journal of Open Source Software. 2019;4:1686. [Google Scholar]
- 55.Zwart JA, Sand T, Unsgaard G. Warm and cold sensory thresholds in patients with unilateral sciatica: C fibers are more severely affected than A-delta fibers. Acta Neurol Scand. 1998;97:41-45. [DOI] [PubMed] [Google Scholar]