Abstract
High density EEG (HD-EEG) recordings utilize a higher spatial sampling of scalp electrodes than a standard 10–20 low density EEG (LD-EEG) montage. Although several studies have demonstrated improved localization of the epileptogenic cortex using HD-EEG, widespread implementation is impeded by cost, setup and interpretation time, and lack of specific or sufficient procedural billing codes. In spite of these barriers, HD-EEG has been in use at several institutions for years. These centers have noted utility in a variety of clinical scenarios where increased spatial resolution from HD-EEG has been required, justifying the extra time and cost. We share select scenarios from several centers, utilizing different recording techniques and software, where HD-EEG provided information above and beyond the standard LD-EEG. We include seven cases where HD-EEG contributed directly to current clinical care of epilepsy patients and highlight two novel techniques which suggest potential opportunities to improve future clinical care. Cases illustrate how HD-EEG allows clinicians to: Case 1) lateralize falsely generalized interictal epileptiform discharges (IEDs); Case 2) Improve localization of falsely generalized epileptic spasms; Cases 3–4) Improve localization of IEDs in anatomic regions below the circumferential limit of standard LD-EEG coverage; Case 5) Improve non-invasive localization of the seizure onset zone in lesional epilepsy; Cases 6–7) Improve localization of the seizure onset zone to guide invasive investigation near eloquent cortex; Case 8) Identify epileptic fast oscillations; Case 9) Map language cortex. Together, these nine cases illustrate that using both visual analysis and advanced techniques, HD-EEG can play an important role in clinical management.
Keywords: electrical source imaging, spatial resolution, HD-EEG, non-invasive, localization, epilepsy
Introduction
High density EEG (HD-EEG) recordings utilize a higher spatial sampling of scalp electrodes than the standard 19–25 electrode low density EEG (LD-EEG) montage1. Typical HD-EEG recordings utilize a minimum of 64 channels, after which there may be incremental, but diminishing returns to spatial resolution2. Although many studies have demonstrated improved localization of the epileptogenic cortex using HD-EEG3–14, widespread implementation is impeded by cost, setup and interpretation time, and lack of specific or sufficient procedural billing codes for insurance reimbursement15. In spite of these barriers, HD-EEG has been in use in several institutions for years. Through experience, many centers have noted utility in a variety of clinical scenarios where increased spatial resolution from HD-EEG has been required and the extra time and cost is justified. In the following series of case reports, we share scenarios from several centers utilizing different recording techniques and software, where HD-EEG provided improved information beyond standard LD- EEG. Specifically, we discuss seven cases in which HD-EEG contributed directly to clinical care of epilepsy patients and also highlight two novel techniques which suggest opportunities to improve clinical care in the future.
Case Reports
Case 1. Lateralization of interictal discharges
An 11-year-old boy with refractory epilepsy associated with tuberous sclerosis complex (TSC), autism spectrum disorder, and anxiety was admitted to the epilepsy monitoring unit (EMU) for a phase I epilepsy surgery evaluation. He was the product of a full-term pregnancy, complicated by a late gestational ultrasound showing multiple cardiac rhabdomyomas in the left ventricle. Subsequent genetic testing revealed a TSC1 mosaic mutation. The patient suffered from multiple daily stereotyped seizures characterized by a “goofy grin”, at times associated with slight slumping to the right and rare right arm clonic activity. At the time of his admission he was being treated with valproic acid, lamotrigine, and cannabidiol. He had previously failed carbamazepine, lacosamide, and clobazam treatments.
The patient was admitted for 4 days of video HD-EEG monitoring acquired on a 128-channel ANT-neuro waveguard cap using a Natus amplifier at 1000Hz sampling. EEG electrode positions were digitized prior to recording using a 3D digitizer (Fastrak, Polhemus Inc., Colchester, VA). Clinical review of the data using standard LD-EEG revealed rare interictal discharges (IEDs) with maximal amplitude at the midline (Cz), and no evident lateralization (Figure 1A). On visual analysis of the HD-EEG recording, the IEDs had a clear left hemispheric predominance (Figure 1B).
Figure 1.
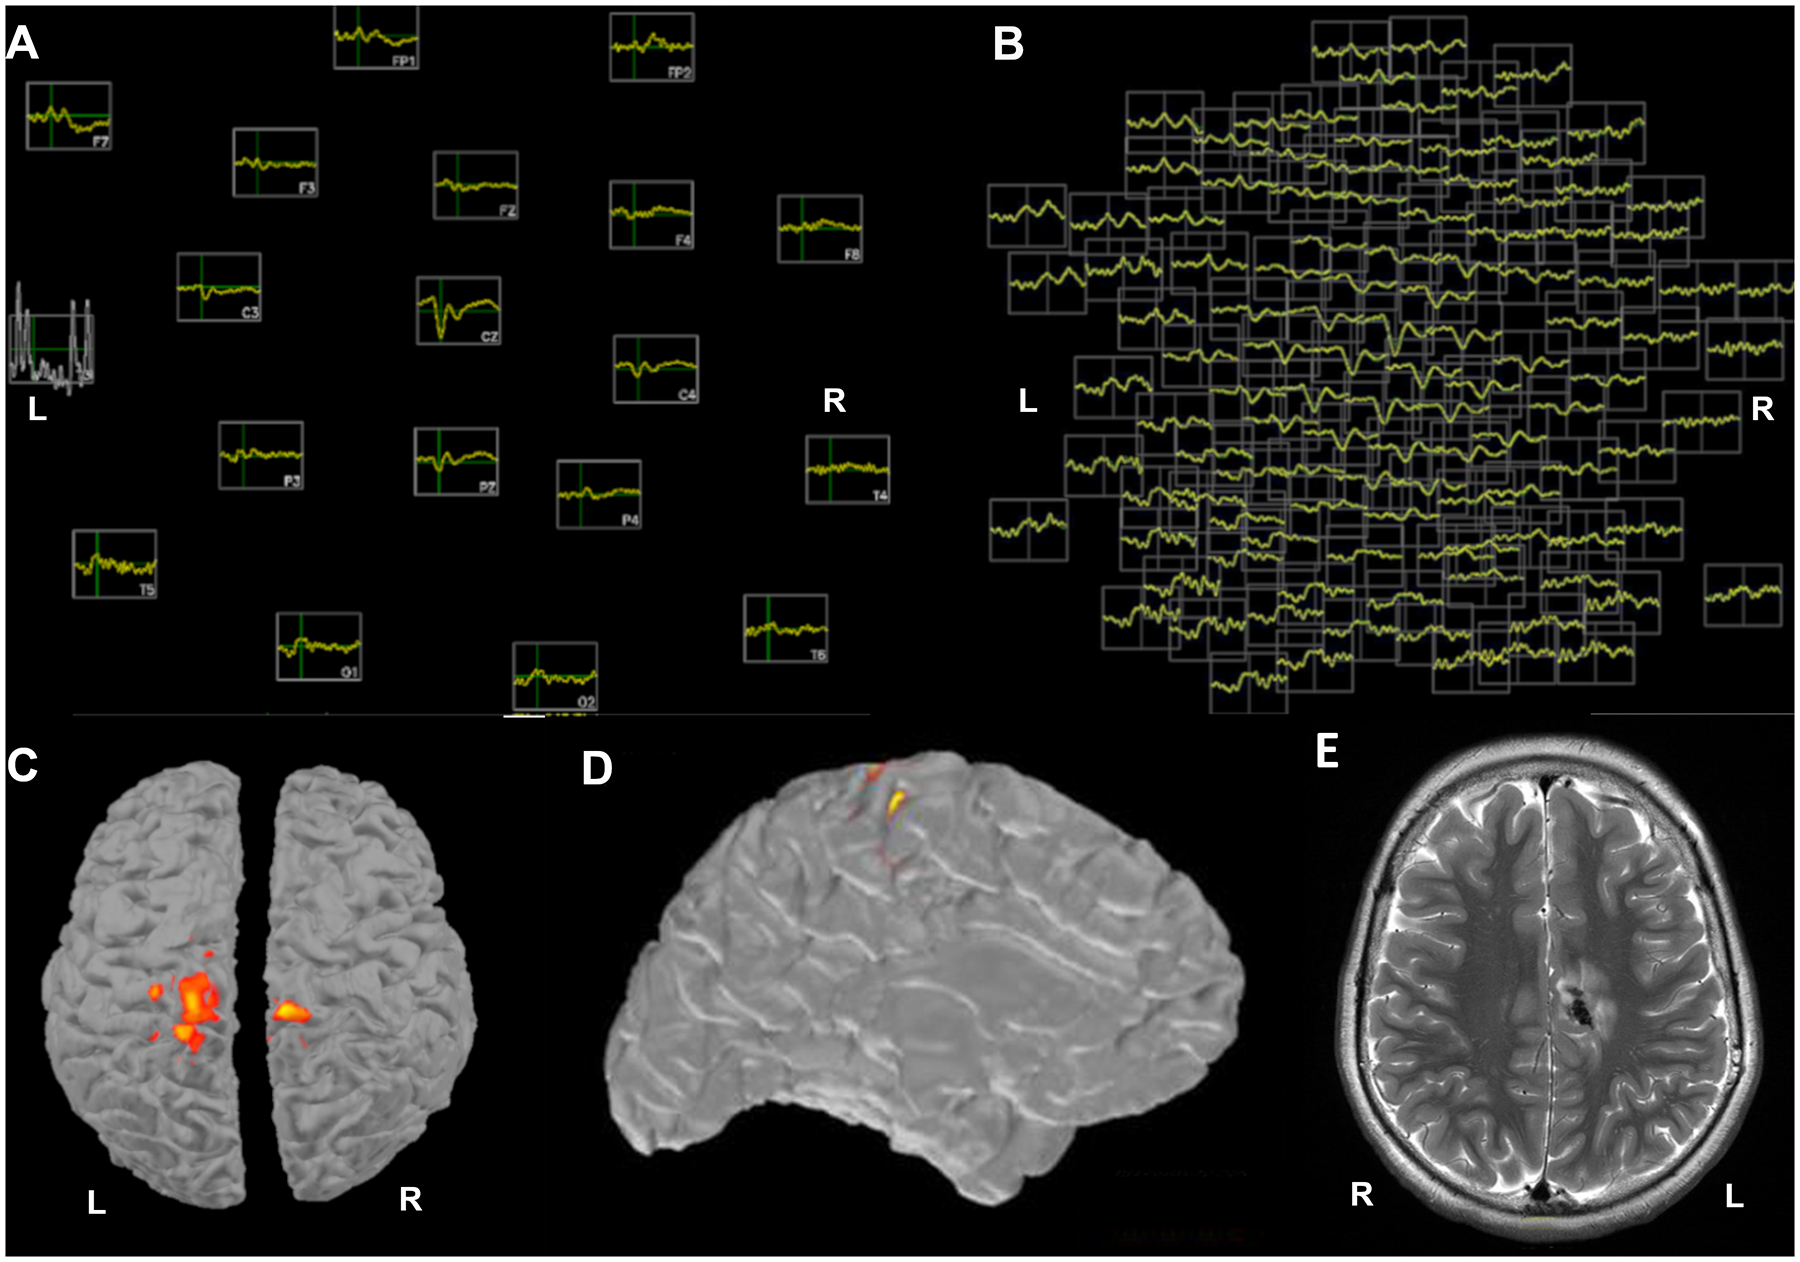
A) Topographic plot of 3 averaged IEDs in the LD-EEG montage with 19 electrodes: lateralization is not feasible due to the low number of electrodes. B) A topographic plot of the same averaged events in the 128 HD-EEG electrodes shows clear lateralization to the left hemisphere C) ESI using LD-EEG does not lateralize the averaged IEDs at any available thresholds (example threshold selected to minimize fragmentation shown here) D) ESI using HD-EEG lateralizes the averaged IEDs to the left hemisphere and localizes them to the left frontoparietal parasagittal region E) An image from the patient’s MRI shows the location of the single large calcified tuber, which colocalizes with the HD-EEG ESI estimate of the interictal events. The data were bandpass filtered at 1–70Hz, with a notch filter at 60Hz.
Source analysis of HD-EEG data was performed using the MNE-C software package16,17. Anatomical cortical surfaces of the brain were reconstructed using Freesurfer from the patient’s own T1-weighted multi echo magnetization-prepared rapid acquisition gradient-echo (MEMPRAGE) data18. For the forward model, a three-layer boundary element model (BEM) consisting of the inner skull, outer skull and outer skin surfaces was generated using the watershed algorithm from the Freesurfer software suite. Digitized electrode coordinates were aligned using the nasion and auricular points as fiducial markers. Coregistrations were confirmed for accuracy by visual inspection. Although a minimum of 10 IEDs are typically averaged in source localization procedures6,9,11, this is sometimes not feasible if discharges are rare. Here, electrical source imaging (ESI) of the peaks of the 3 averaged IEDs using LD-EEG and sLORETA19 (Figure 1C) could not be lateralized at any windowing threshold. Using HD-EEG, the ESI localized to the patient’s single large calcified tuber in the left posterior cingulate gyrus (Figure 1D, E). In this case, the accurate localization is supported by the known epileptogenic potential of these calcified lesions in TSC. In general, LD-EEG is able to lateralize when sources are far from the midline, but the spatial resolution is too low to lateralize for sources close to the midline, as in this case.
This case highlights the separate utility of both increased spatial sampling and accurate HD-EEG-MRI co-registration to lateralize IEDs located near the midline. Accurate lateralization of epileptogenic lesions is clinically important because focal lesions are approached with different pharmacologic and surgical treatment options.
Case 2. Lateralization of ictal events
A one-year-old male with TSC and multiple cortical tubers presented to the EMU with refractory epileptic spasms for a phase I surgery evaluation. He was the product of a full-term, uncomplicated pregnancy. He developed infantile spasms at 6 months of age. At the time of admission, he was being treated with vigabatrin and valproic acid and continued to have 1–2 clusters of infantile spasms per day. Previous treatment trials with the ketogenic diet, topiramate, clobazam, and oral steroids had failed.
The patient was admitted for 3 days of HD-EEG monitoring; the same technical procedures as those described in Case 1 were followed. This patient, while only one year old, fit an adult sized 128 channel HD-EEG cap due to benign external hydrocephalus. Standard LD-EEG and HD-EEG revealed multifocal IEDs with near-continuous interictal activity in the left posterior quadrant. The patient had several epileptic spasms recorded with a clinical presentation of bilateral upper extremity symmetric spasms that occasionally occur in clusters. These spasms coincided on LD-EEG with a complex broad transient followed by a generalized electrodecrement (Figure 2A). The ictal broad transients were noted to have a possible first deflection in the left posterior quadrant on LD-EEG that was clearer on HD-EEG (Figure 2A, B). Using HD-EEG ESI (following the same technical procedures described in Case 1) with MNE software, the ictal events localized to the left parietal cortex (Figure 2C). In this case two early ictal discharges were averaged for ESI. MRI revealed a large cyst-like cortical tuber in that region (Figure 2D). When ESI was performed on LD-EEG data, this activity did not localize to the tuber, but instead localized more posteriorly (Figure 2C-subplot).
Figure 2.
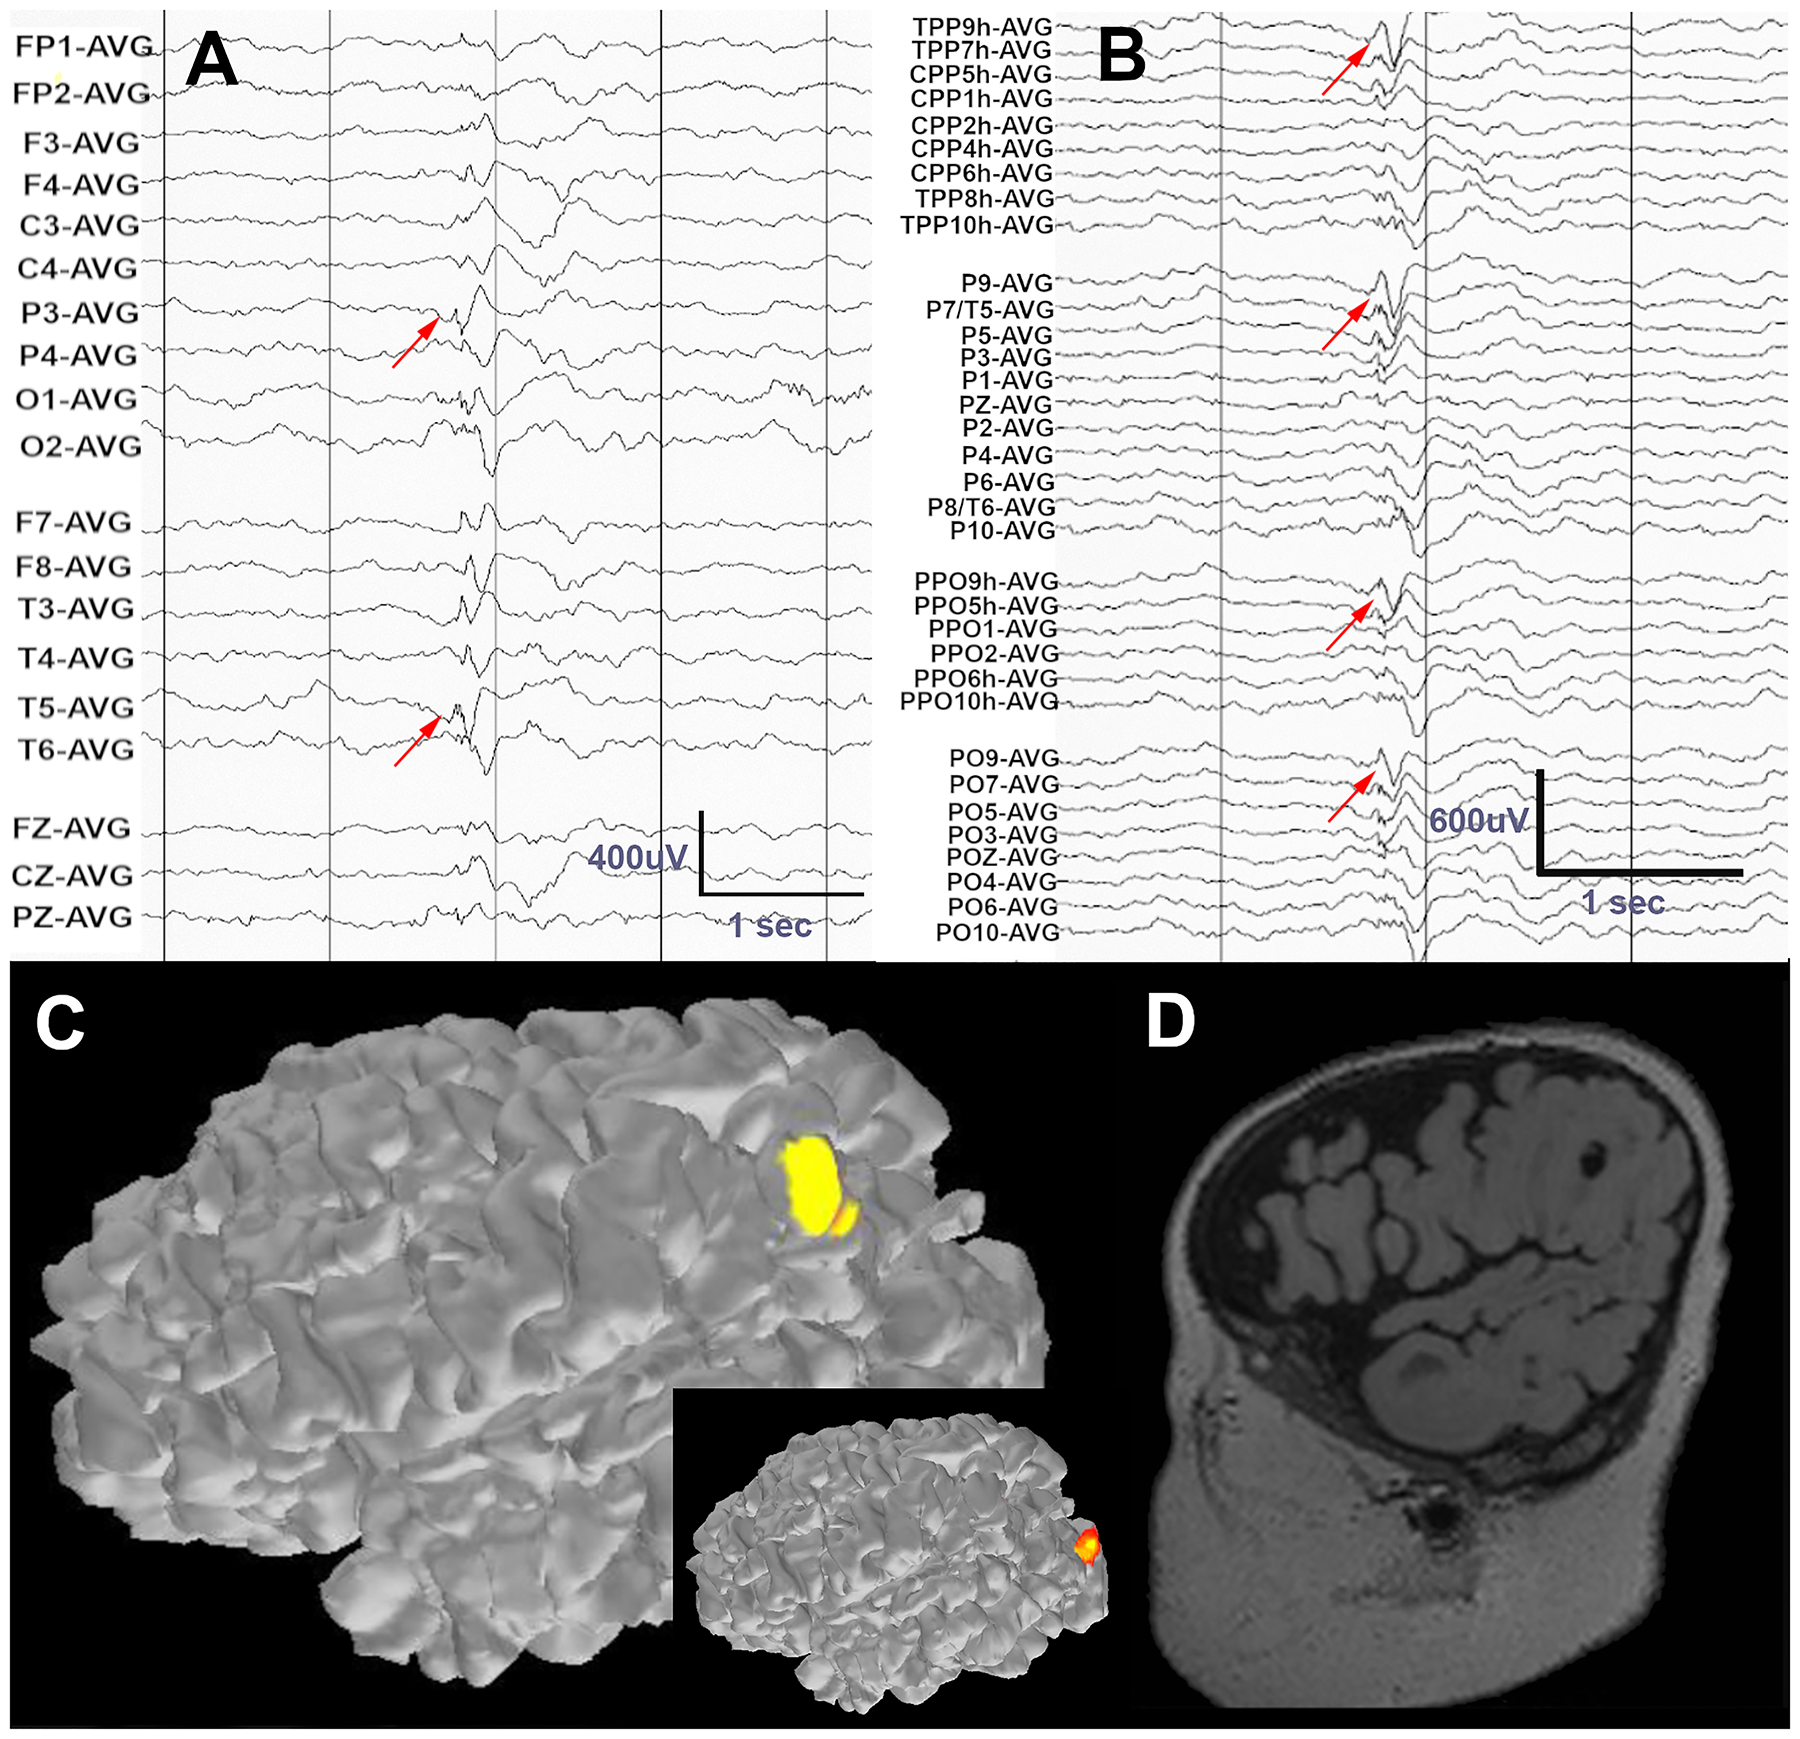
A) Standard LD-EEG recording of an epileptic spasm shows a complex event with possible first negative deflection at T3 and P3 (red arrows). B) On visual analysis of HD-EEG channels, a leading spike in left parietooccipital region is clearly evident and consistent across adjacent channels. C) ESI of the leading spike localizes to the left posterior parieto-occipital region using HD-EEG data. ESI based on LD-EEG (inset) localizes this event to the occipital cortex. D) MRI in this patient revealed a cyst-like cortical tuber that co-localizes with the HD-EEG ESI estimate of the ictal event. The data were band pass filtered at 1–70Hz, with a notch filter at 60Hz.
This case demonstrates the potential utility of HD-EEG to localize ictal activity that is poorly lateralized on standard LD-EEG. The lateralization and localization of a focal epileptogenic lesion through ictal recordings helps to tailor the appropriate pharmacologic and surgical treatment options.
Case 3. Expansion of posterior recording field
A 6-year-old boy with a history of behavioral dysregulation presented for evaluation of episodes of uncertain etiology. He met all early developmental milestones on time. He was diagnosed with attention deficit hyperactivity disorder that was unresponsive to psychostimulant and alpha-2 adrenergic agonist treatment trials.
Further neurodiagnostic testing included HD-EEG acquired and analyzed using a 122 EEG channel recording (Electrical Geodesic, Inc. 400 system with Net Station 5 software and Hydrocel Geodesic Sensor Net plus 6 facial electrodes recording eye movements). The HD-EEG was done with simultaneous video recording. HD-EEG was recorded continuously at 1000 Hz sampling and with digital filtering between 0.1 to 100Hz. Visual analysis of standard LD-EEG in a bipolar montage suggested possible left occipital IEDs, though this is evident only in one channel (O1), with a possible suggestion of a field to T5 (Figure 3A). The HD-EEG 128 channel topoplot array showed a more well-defined occipital IED, with an expansive field to electrodes below the inferior circumferential limit of standard LD-EEG (Figure 3B). 79 IEDs were averaged and the bulk of the negative field was found outside the zone of detection for the 23-electrode array, where an IED field was only evident on HD-EEG (Figure 3C). ESI using Geosource 2.0 localized to the left inferior occipital gyrus (Figure 3D).
Figure 3.
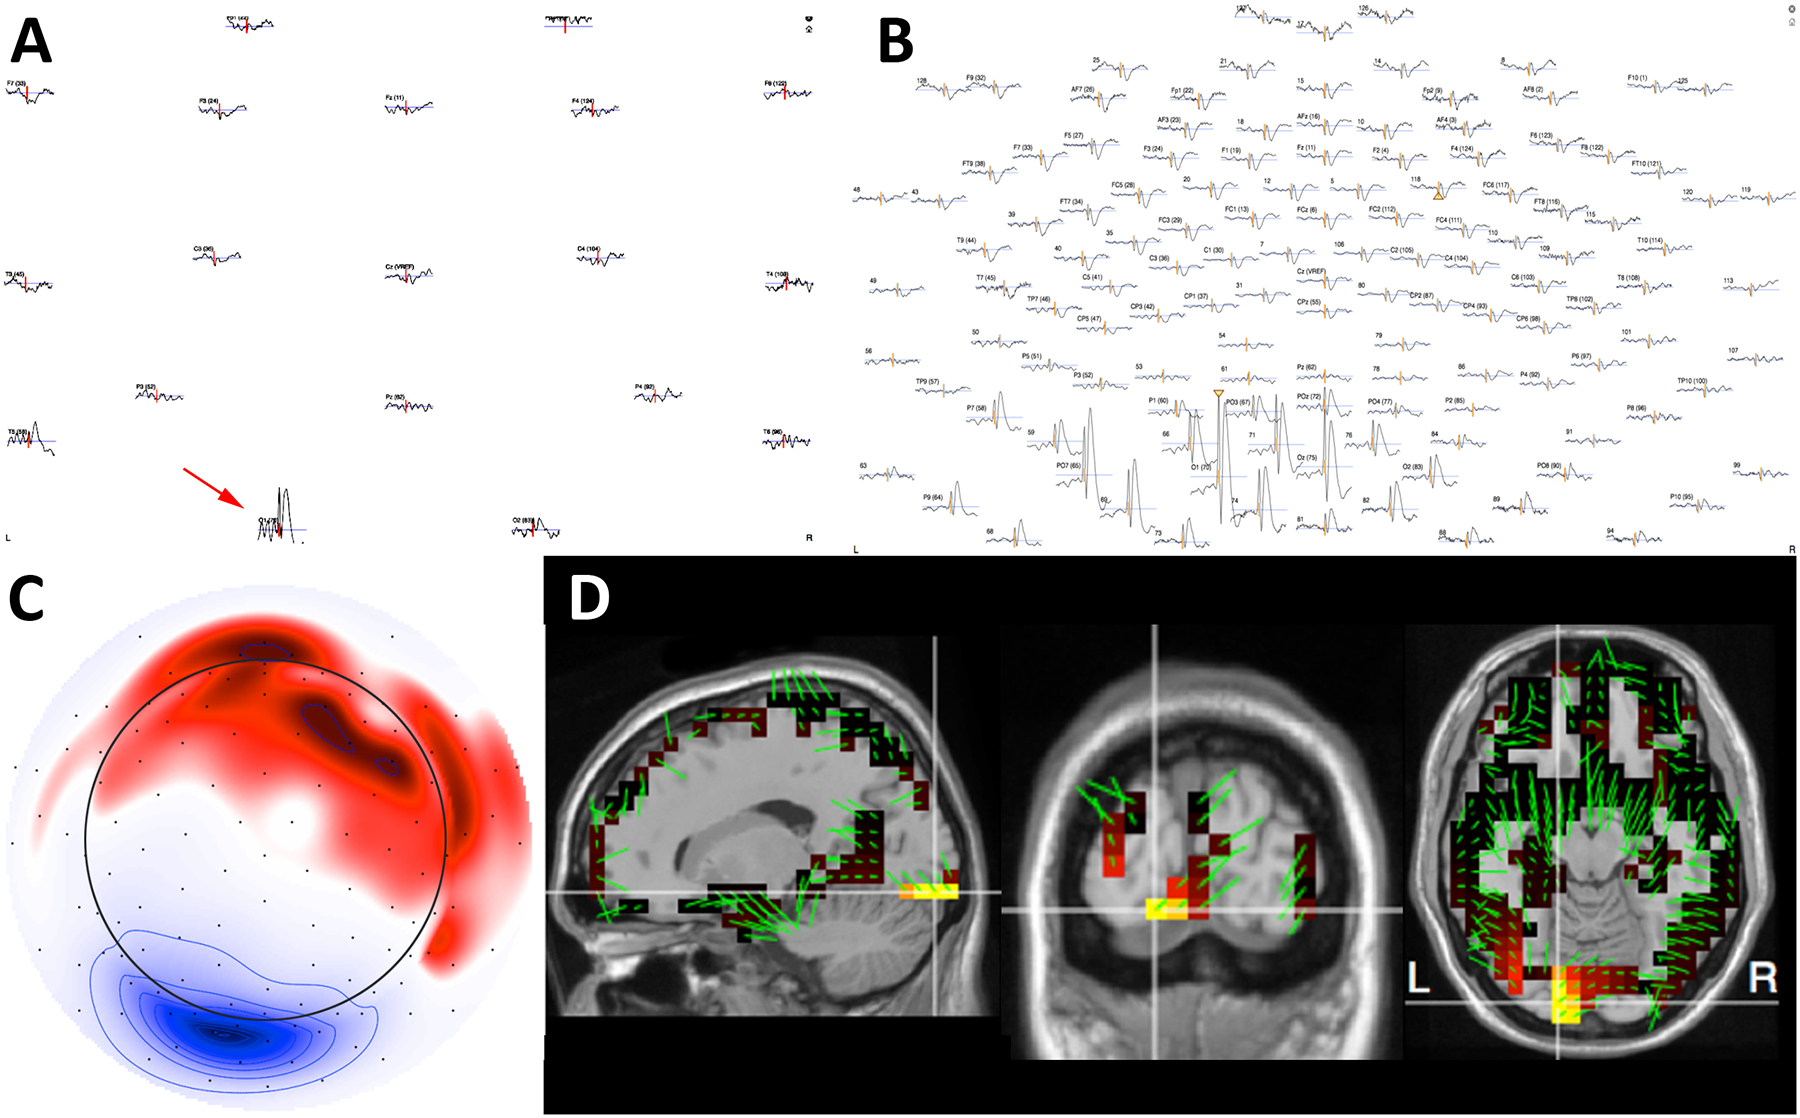
A) Topographic plot of 79 averaged IEDs using LD-EEG suggests an IED in O1 and T5. B) The same averaged events visualized using 128-channel HD-EEG reveal a broad distribution of the IED involving multiple channels around O1, allowing high confidence in the detection and localization of this event. C) The potential map of the averaged IEDs demonstrates that the majority of the cortical negativity (blue) is outside the zone of coverage for a standard LD-EEG array (circle). D) ESI of the IEDs co-registered to the child’s MRI provides anatomical localization of the cortical source. These data were band pass filtered at 1–70Hz, with a notch filter at 60Hz.
This case underscores the ability of “whole head” HD-EEG electrode placement to better visualize inferior and medial brain surfaces, resulting in improved resolution and clinical confidence in identifying and describing cortical IEDs at the edge of conventional LD-EEG coverage. If IEDs lie entirely outside of conventional recording areas, they will be missed resulting in inaccurate diagnostic and prognostic information.
Case 4: Expansion of frontal basal recording field
A 67-year-old man with a history of febrile and afebrile seizures since age 8 presented to the EMU for presurgical evaluation. Since diagnosis, he suffered from seizures 2–3 times per night as well as daytime seizures every other day. These were characterized by 1) nocturnal onset with abrupt arousal with impaired awareness and complex, aggressive vocalizations and hypermotor activity for minutes followed by postictal confusion and 2) daytime episodes characterized by impaired awareness and vocalizations for seconds. Risk factors included epilepsy in several family members: his daughter, maternal aunt, and maternal nephew. At the time of presentation to the EMU, he was being treated with carbamazepine, pregabalin, and rufinamide. Prior to this regimen, he had failed treatment with 10 other antiepileptic medications.
Upon admission, interictal LD-EEG revealed frequent left frontotemporal (F7) IEDs. Ictal LD-EEG showed arousal from sleep, diffuse attenuation contaminated by diffuse muscle, and movement artifact without evident rhythmic activity.
Video HD-EEG was recorded with a 256 channel Geodesic Sensor Net (GSN, EGI-Philips) using a NA400 amplifier at 1000Hz sampling20. EEG electrode positions were digitalized using a 3D digitizer (GPS, EGI-Philips). Visual review of HD-EEG confirmed frequent IEDs in the left frontotemporal region. Coregistration of HD-EEG to the patient’s T1-weighted MPRAGE MRI and reconstruction of the anatomical cortical surfaces of the brain were performed using Netstation and Geosource 3 software packages (EGI-Philips)21. The forward model was generated using the Finite Difference Method. This method models the head as a cubic grid in which each cube is assigned a conductivity tensor22. ESI performed at the peak of 10 averaged IEDs using sLORETA showed localization in the left basal frontal lobe (Figure 4A–C). Source localization based on MEG agrees with the left basal lateral and medial frontal lobe regions identified by HD-EEG. This demonstrates that estimates obtained using HD-EEG, which is a more accessible and affordable method of imaging than MEG, were similar to those achieved using MEGThis case demonstrates the utility of an expanded electrode layout, including electrodes over the face, in improving identification and localization of epileptiform activity in inferior, frontal basal brain regions, which are not well sampled in standard LD-EEG electrode placements. Accurate localization of basal seizure foci helps both clarify the diagnosis of epilepsy and plan targeting of further investigations, including tailored imaging or invasive EEG studies.
Figure 4.
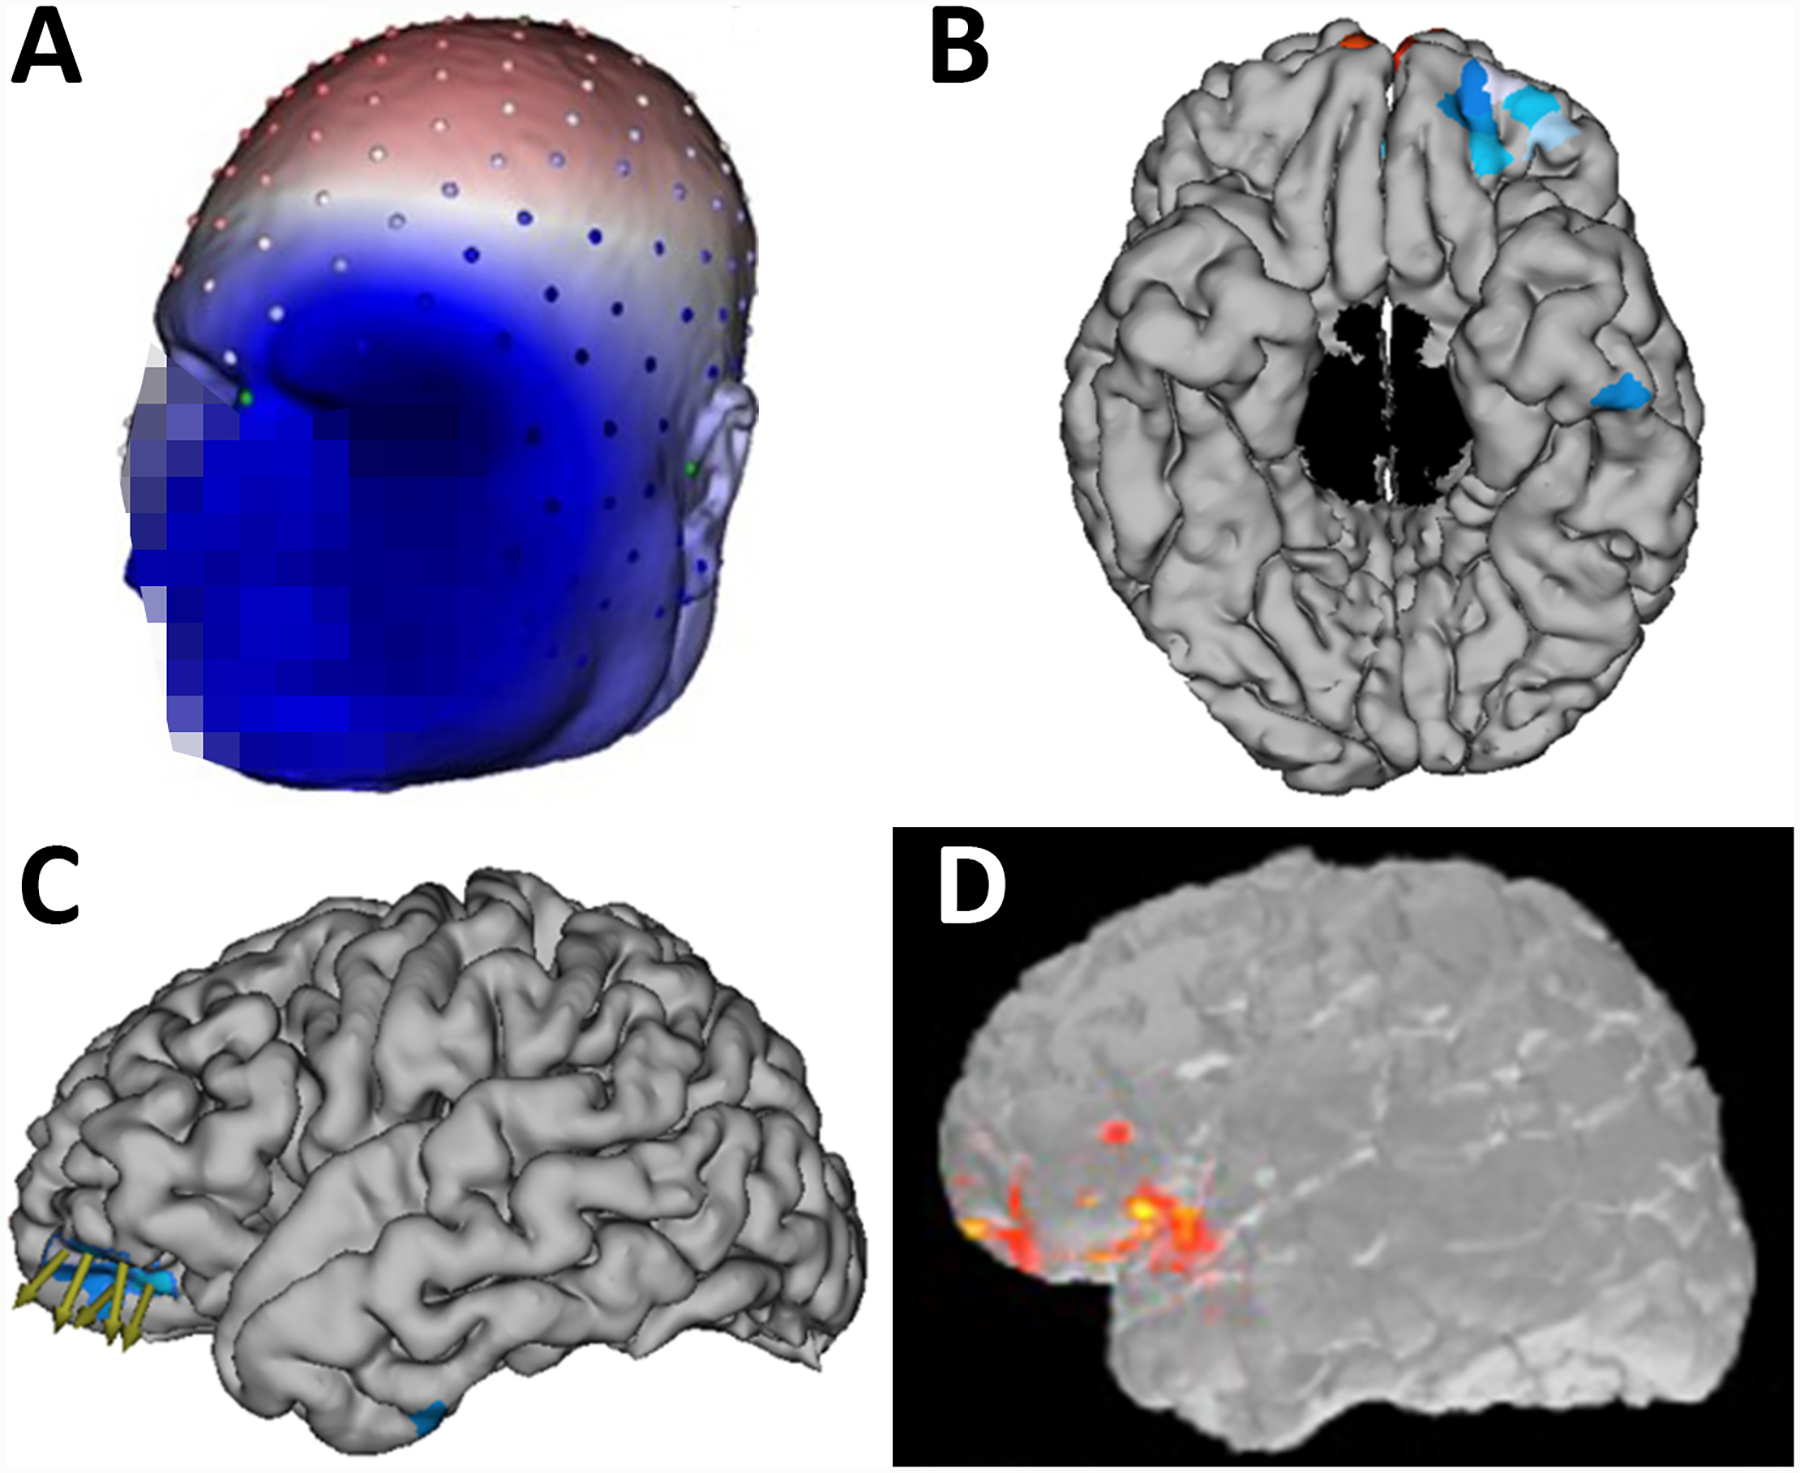
A) Electrode coordinates co-registered to the individual head model were created using the patient’s MRI (face blurred for patient confidentiality). The projection on the scalp shows the voltage field of the group dipole projection from 10 averaged IEDs. The deep blue represents the negative pole and the red represents the positive pole. B-C) Electrical source imaging results created using FDM forward model and sLORETA and dipole mapping of the average IED peak. This localizes to the left basal frontal region. The cortical patches highlighted in blue represent the areas with highest current density. The green arrows depict the dipole direction of the highlighted patch. D) MEG source analysis using the MNE-C software package showed similar localization of IEDs in the left basal frontal region.
Case 5. Identification of subtle seizure onsets
A 14-year-old girl was admitted to the epilepsy monitoring unit (EMU) for a phase I epilepsy surgery evaluation. She had begun having seizures at the age of 8; an MRI done at that time revealed a right occipital prenatal stroke. She was the product of a full-term, otherwise unremarkable pregnancy and met all early developmental milestones on time. Since diagnosis, the patient experienced daily seizures. These seizures were characterized by a nonspecific change in vision, followed by perseverative talking that sometimes progressed to unresponsiveness and fencer posturing, along with left head deviation and tonic clonic activity. She was treated with rufinamide and lamotrigine. She had previously failed treatment with levetiracetam, clobazam, lacosamide, and the ketogenic diet.
The patient was admitted for 6 days of HD-EEG monitoring (following the same technical procedures described in Case 1). Frequent IEDs were seen on visual review of both the LD-EEG and HD-EEG recordings, with the IEDs seen more anteriorly on the LD-EEG than on the HD-EEG recording. Three typical electroclinical seizures were captured that were poorly localized on the standard LD-EEG (Figure 5A). ESI of the LD-EEG data (following the same technical procedures described in Case 1) with MNE software inaccurately localized the activity to the anterior temporal lobe (Figure 5C). Visual analysis and ESI of HD-EEG data revealed a consistent seizure onset in the inferior portion of the encephalomalacic region of the right occipital cortex (Figure 5B, D). A PET scan showed a hypometabolic region in the same area as the EEG onset. On MEG, no IEDs were visualized. Neuropsychological testing was consistent with right parietal weakness and Goldmann visual field testing revealed a left inferior more than superior visual field deficit.
Figure 5.
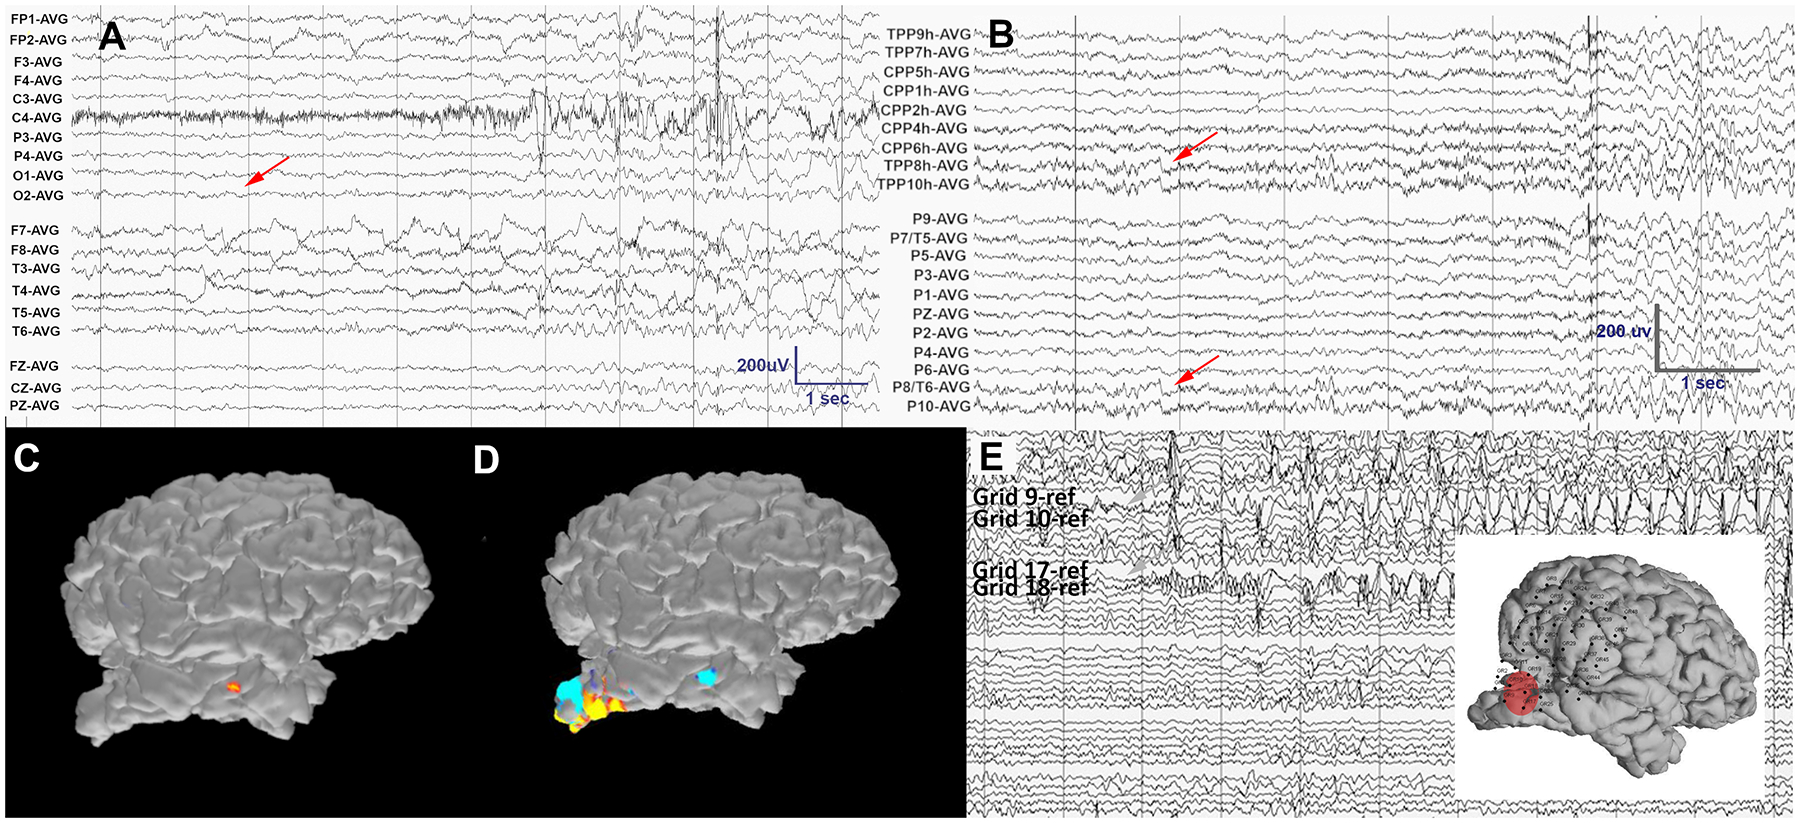
A) On visual analysis of the LD-EEG recording, no electrographic correlate to the patient’s ictal clinical onset is evident (red arrow) due to sparse coverage of the area of interest and an artifact in remaining channels. B) Visual analysis of the HD-EEG (a subset of channels is shown) reveals the onset of subtle evolving rhythmic activity in the right temporo-occipital electrodes that coincides with the clinical event (red arrows). C) ESI of 3 average peaks of the early ictal rhythmic sharp activity evident on HD-EEG localized to the anterior temporal lobe using only LD-EEG data. D) ESI of the same events using HD-EEG data localizes to the inferior cortical margin of the occipital stroke cavity. E) A subset of invasive electrocorticography channels demonstrates seizure onset on grid contacts 9, 10, 17 and 18, corresponding upon visual review to the source estimated from the HD-EEG ESI (red circle in inset). The data were band pass filtered at 1–70Hz, with a notch filter at 60Hz.
The patient was then admitted for a Phase II study and was implanted with four 4-contact strips, a 44 contact grid, and four 4-contact depth electrodes sampling the walls of the right occipital cavity based on the HD-EEG results. Electrode locations were visualized using CT and MRI reconstructions and custom MATLAB software23. Over 3 weeks of invasive monitoring, abundant IEDs and 5 seizures were captured and consistently localized to the posterior and inferior margins of the occipital stroke cavity (Fig 5D, E), validating the HD-EEG findings upon visual analysis. The patient proceeded to surgery and the posterior and inferior margins of the occipital cavity were resected sparing involved calcarine cortex. In the two years since surgery, the patient has had rare brief auras, but she has been free from her dyscognitive and tonic-clonic seizures.
This case illustrates the potential utility of HD-EEG in visualizing and accurately localizing ictal and interictal events that were evident neither in routine scalp nor in MEG recordings. In this case, the ictal events were not detected on LD-EEG due to the broad spatial sampling and circumferential limits. The combination of visual inspection and ESI using the improved spatial sampling of HD-EEG led to accurate identification and localization of the seizures and helped tailor the invasive electrode plan.
Case 6: Localization of epileptogenic zone near eloquent motor cortex
A 29-year-old female with a history of refractory seizures since age 6 was admitted to the EMU for reconsideration of epilepsy surgery. Since presentation, she had suffered 1–2 seizures per week; these were characterized by primarily nocturnal onset, left face and arm numbness as well as left arm clonic activity. At the time of admission, she was being treated with leviteracetam, lacosimide, topiramate, and valproate. She had previously failed trials of lamotrigine, felbamate, carbamezepine, oxcarbazepine, and cannabidiol oil.
The patient had previously been evaluated with non-localizing ictal SPECT, PET, and MRI as well as phase II implantation of grids covering the right peri-Rolandic and central areas. Despite recording three typical seizures around the right peri-Rolandic area, the patient was not offered surgery due both to the proximity to eloquent motor cortex and insufficiently precise localization.
The patient returned for another evaluation of her continuing seizures, this time with scalp HD-EEG. Using a 76-channel EEG including sub-temporal electrodes, 5 seizures with her typical semiology were recorded, again with right peri-Rolandic onset. IEDs were identified during wake and sleep with maximal amplitude in contacts over the right centroparietal region (Figure 6A). EEG source localization was performed on 39 representative IEDs with a bandpass filter from 2 to 55Hz (Figure 6B). Electrode digitized locations were not available for this patient, so electrode positions were determined using atlas-based average locations. The waveforms were aligned at peak amplitude and averaged, and dipole and sLORETA solutions were calculated at the midpoint of the rising phase of the waveform. The dipole and sLORETA maximum were coincident over the right peri-Rolandic region, extending into the frontal operculum (Figure 6C).
Figure 6.
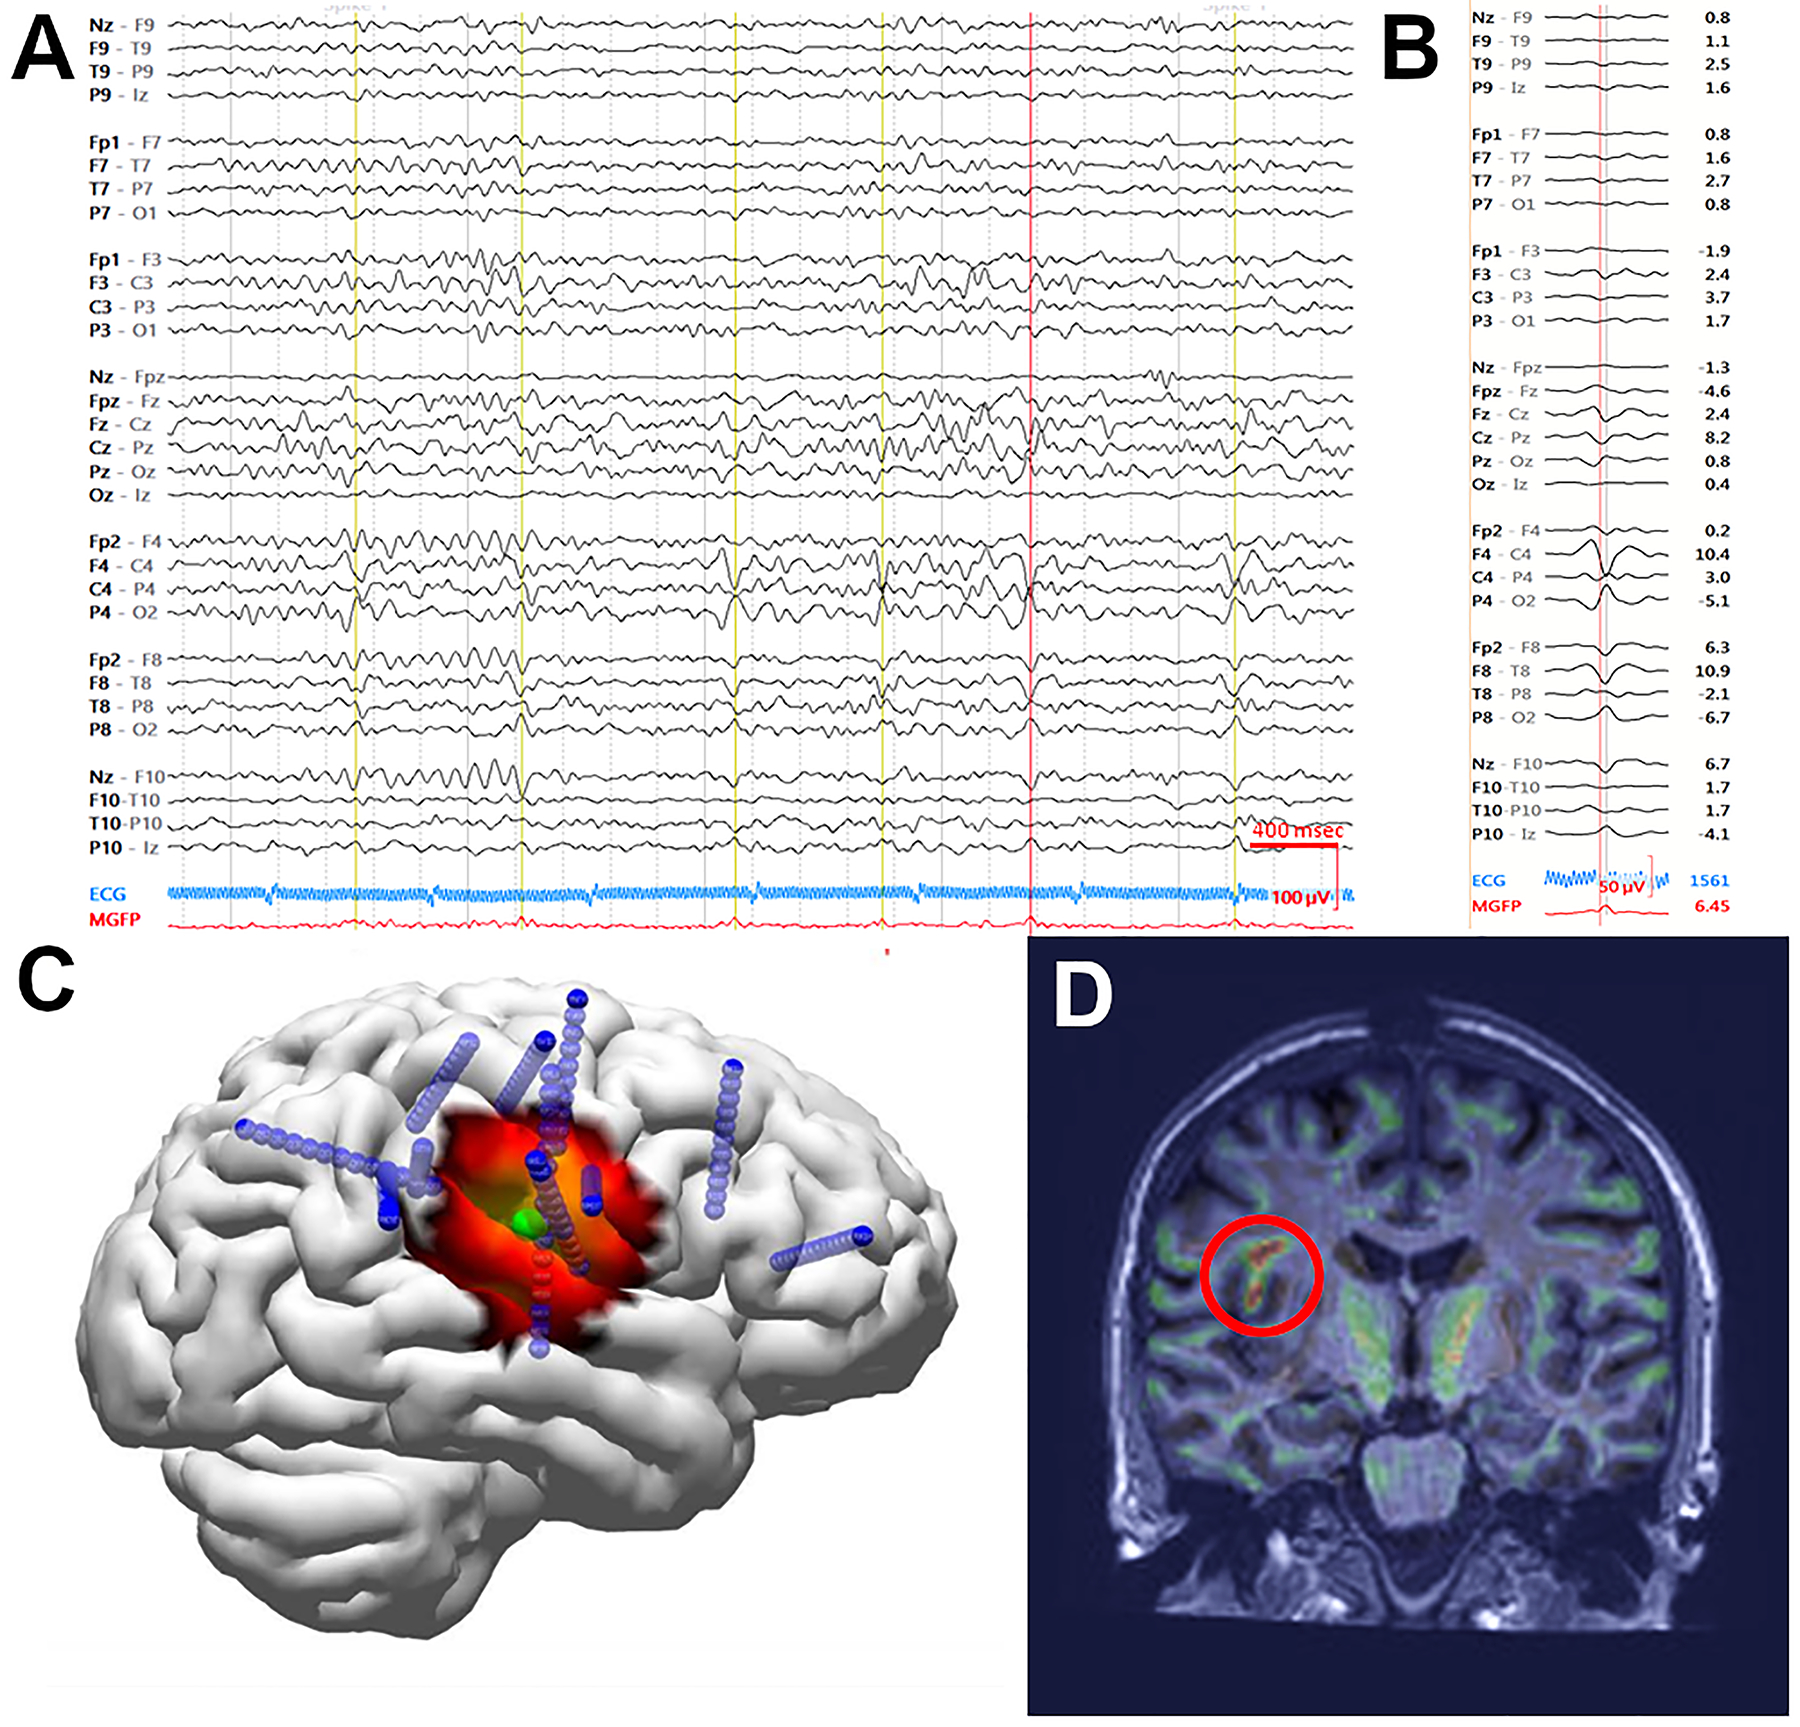
A) An example of an HD-EEG recording showing abundant IEDs over the right centroparietal region. IEDs selected for averaging designated by vertical lines. Data were bandpass filtered from 2 to 55Hz. B) Voltage tracing of 39 representative IEDs averaged. C) Dipole (green) and ESI estimation (heat map, sLORETA) at the mid-point of the rising slope of the averaged IEDs both localized to the peri-Rolandic frontal operculum. Subsequent depth electrode placements are shown in blue. D) Morphometric analysis revealed an abnormality (red circle), co-localizing with the region indicated by HD-EEG and invasive recording.
Morphometric analysis24,25 was performed on her T1-MPRAGE MRI, and both extension and junction maps suggested abnormal morphology in the right frontal operculum corresponding to a faint hook-shaped shadow extending into the white matter toward the ventricle (Figure 6D), near the area localized on HD-EEG.
A stereotactic EEG plan was developed to achieve right peri-Rolandic coverage covering the region of the patient’s previous subdural grid, and three typical seizures were recorded. Seizure onset was observed over deeper right peri-Rolandic contacts near the morphometric abnormality and sLORETA maximum. IEDs were more broadly distributed over the right peri-Rolandic contacts but maximal frequency corresponded with the seizure onset contacts. The patient was offered surgery based on this re-evaluation and, at the time of this publication, had recently undergone resection of the region identified.
This case highlights the utility of HD-EEG to better guide re-evaluation of continuing seizures when previous evaluations have resulted in poor localization.
Case 7: Localization of epileptogenic zone near eloquent language cortex
A 20-year-old right-handed woman with seizures since the age of 12 was admitted for a phase I epilepsy surgery evaluation. She suffered from dyscognitive seizures with occasional secondary generalization and postictal global aphasia. She had no aura and cognitive and neurological status were normal. At the time of admission, she was being treated with carbamazepine. She had previously been treated with levetiracetam, lamotrigine, valproate, and lacosamide.
Evaluation with 256 channel MR-compatible scalp HD-EEG recordings showed a very active IED focus over the left temporo-parietal cortex (Figure 7A). On visual analysis of the scalp recording, ictal onset was not well localized but could be lateralized to the left hemisphere. At a later stage, the focus shifted to the posterior temporal cortex. PET and visual analysis of high resolution MRI were normal. HD-EEG ESI of the IEDs, combined HD-EEG-fMRI and an ictal SPECT all localized the IED focus to the left posterior middle and inferior temporal cortex (Figure 7D). Re-analysis of the MRI with voxel-based morphometry identified a suspicious cortical region in the posterior temporal cortex with poor gray-white matter differentiation (Figure 7C). The patient’s seizure onset zone confirmed by intracranial recordings was adjacent to the lesion and accurately identified by HD-EEG ESI. Language mapping using fMRI suggested a left-sided posterior language area superior to the focus.
Figure 7.
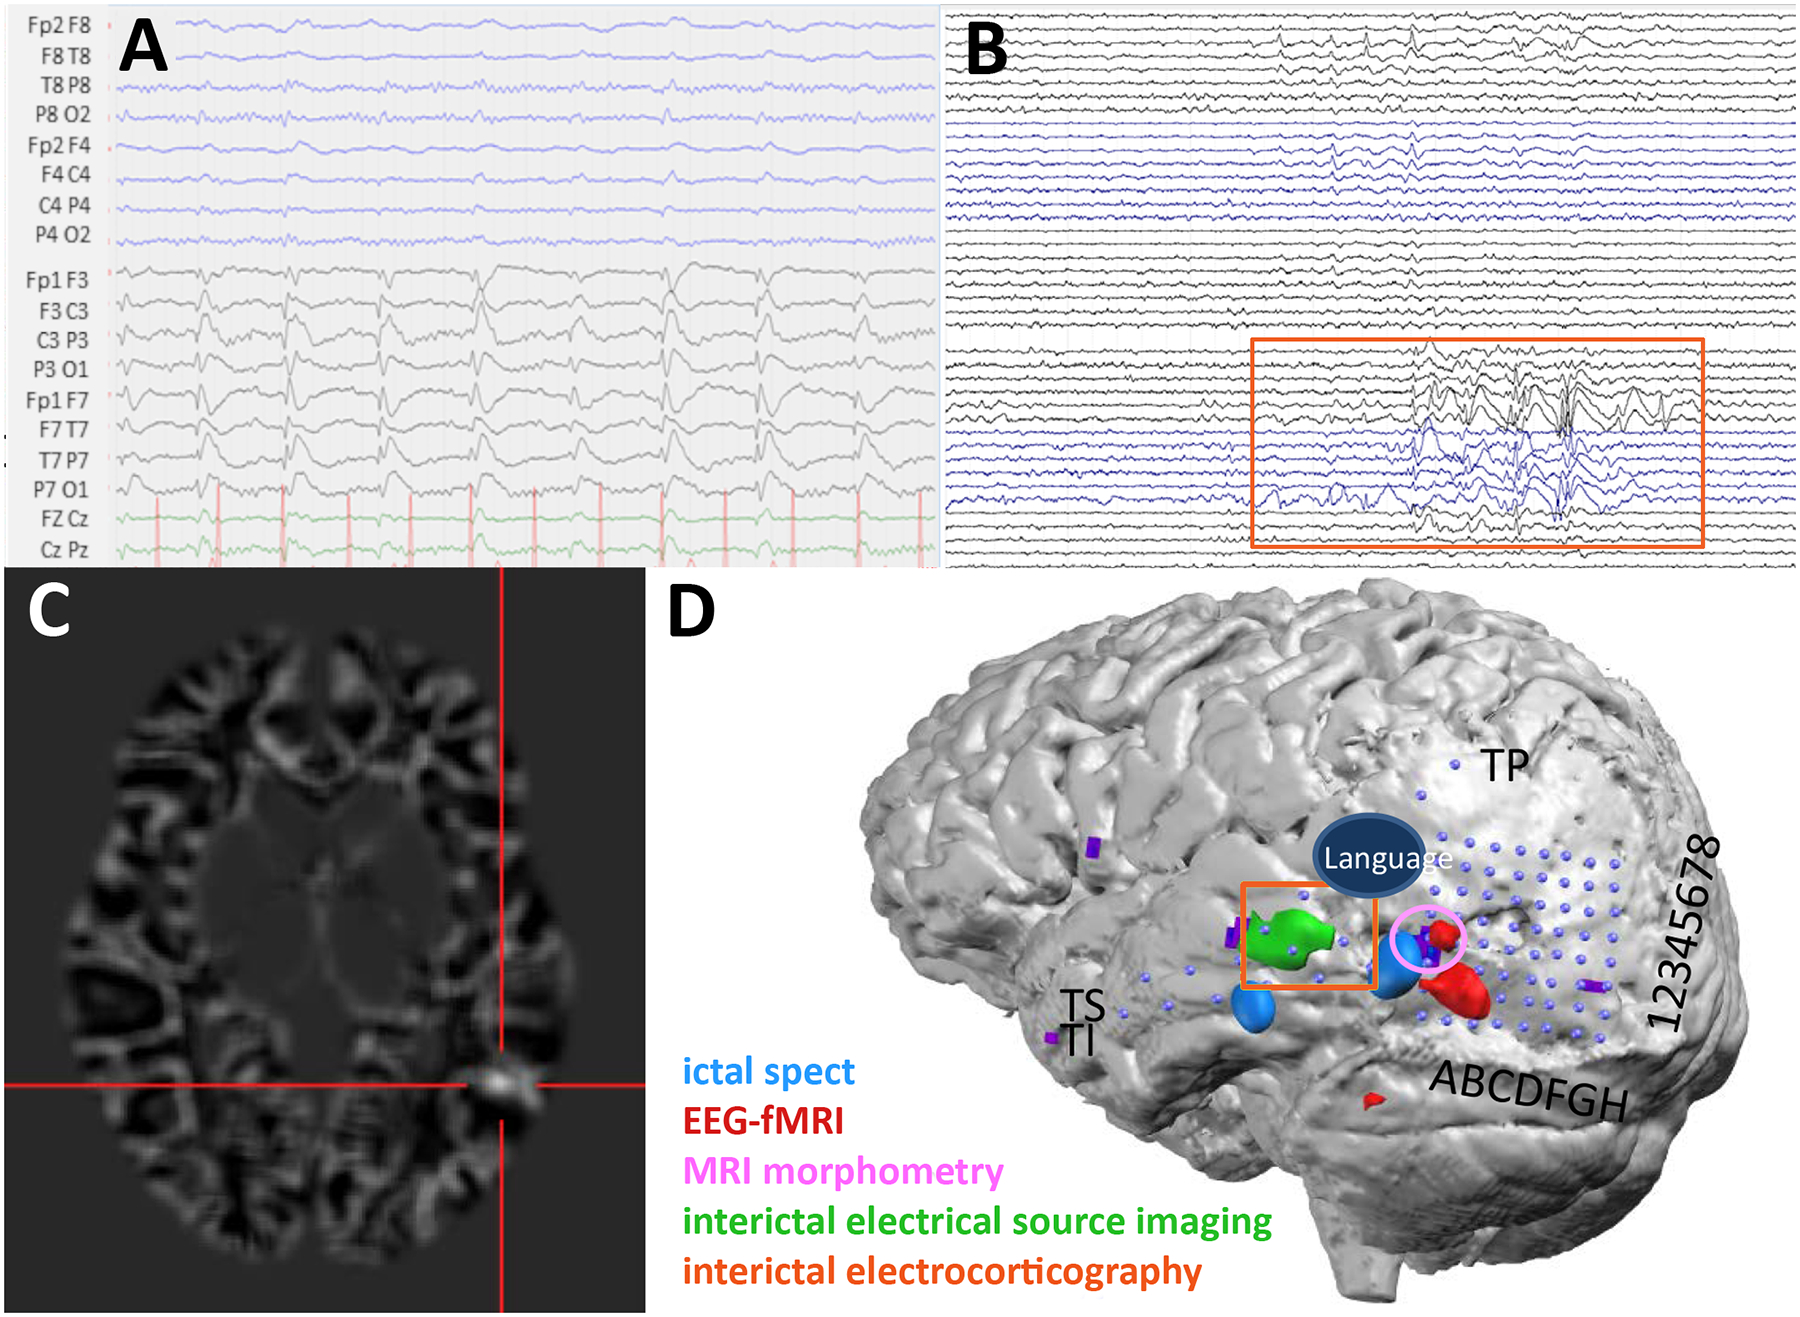
A) The patient’s LD-EEG recording showing representative IEDs over the left hemisphere. Data were bandpass filtered from 0.53 – 70 Hz. B) IEDs on invasive subdural grids. Orange box corresponds to the active channels and their location in D (TI4–6, TS4–6, TP1–2). Data were bandpass filtered from 5–500 Hz. C) Subtraction ictal SPECT co-registered with MRI identifies a focus in the left posterior middle and inferior temporal cortex. D) Co-registration image showing the placement of the subdural electrodes (blue dots) and localization of the eloquent language cortex using corticography and the epileptiform cortex using multiple modalities. Localization of IEDs using ESI on HD-EEG data co-localized with the invasive subdural recordings and was anterior to the cortical dysplasia.
The patient was admitted for a phase II study and implanted with subdural electrodes. Intracranial recordings of the IEDs and seizure onset (Figure 7B) co-localized with the HD-EEG ESI estimate with very good precision (Figure 7D). In some cases, as occurred here, lesions do not directly correspond to the seizure onset zone26. Here, the seizure onset zone, validated by the invasive subdural recordings, was accurately identified with ESI using HD-EEG and not any of the other non-invasive imaging modalities. Electrocorticography language mapping was completed and confirmed that the language area was superior to the focus and would not be an obstacle for surgery. The patient underwent resection of the recorded seizure onset zone as well as the subtle morphometry anomaly. She did not experience any language problems during the postoperative phase. The histopathology revealed a dysplasia type 2A. Carbamazepine was withdrawn and the patient has been seizure-free and on no AEDs, for over 2 years.
This case illustrates the role of HD-EEG in further guiding re-evaluation of structural data and guide placement of intracranial electrodes when other modalities, such as MRI and PET, are inconclusive. In this case, the ESI of the HD-EEG was essential in informing the decision to pursue surgical resection of the patient’s seizure focus.
Case 8. Novel applications: Identification of spike ripple events
A 9-year-old-boy presented with nocturnal sensorimotor facial seizures, at times with secondary generalization; these seizures occurred 2–4 times a week. Previous EEG had revealed bilateral independent sleep activated IEDs, and he was diagnosed with benign epilepsy with centrotemporal spikes (BECTS).
The patient underwent HD-EEG using a 70 channel electrode cap (Easycap, Vectorview, Elekta-Neuromag, Helsinki, Finland) with 2 more electrodes placed at T1 and T2; a 2035 Hz sampling rate was used. Electrooculogram and electrocardiogram were simultaneously collected to assist with the identification of artifacts. Visualization of the 10 minutes of recording EEG revealed 234 IEDs. Detailed analysis, including visualization of the unfiltered data, data band-passed filtered for high frequency oscillations 100–300 Hz, and spectrograms, identified ripple events on the rising slope of the IEDs in 74 cases. These events were not evident when the data was visualized using a standard LD-EEG montage (Figure 8), consistent with prior work demonstrating that ripple events are more spatially constrained than spikes27. Spike ripples have been associated with increased seizure risk in children with BECTS and may provide a novel biomarker to guide patient prognosis and care27–30.
Figure 8.
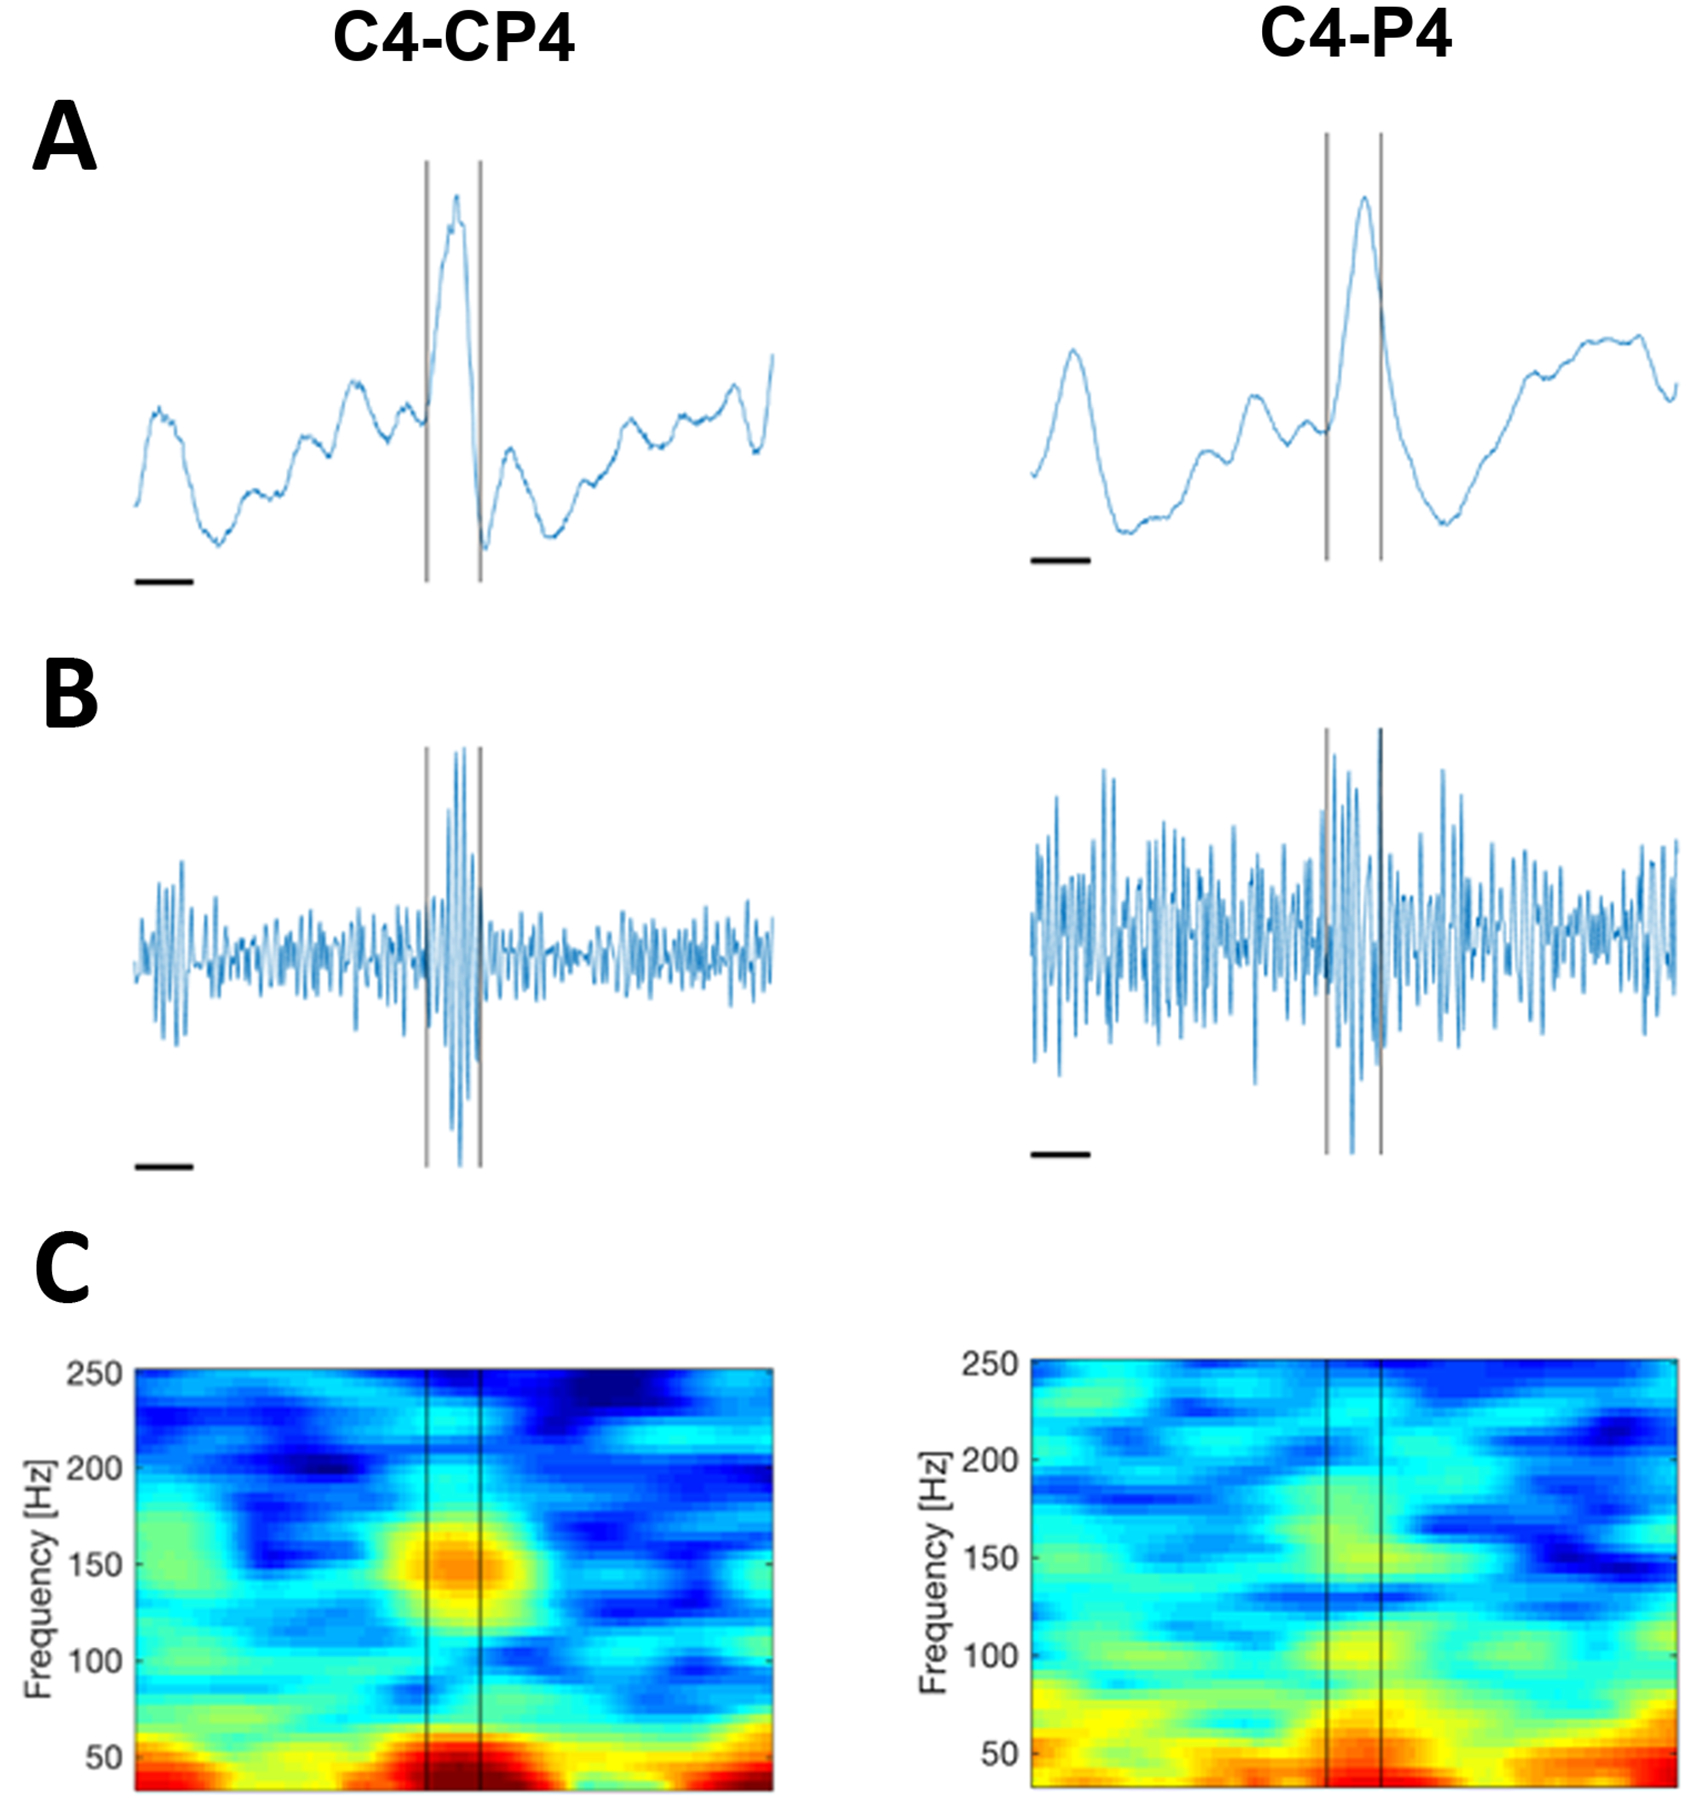
A) Unfiltered data showing the same example IED from the patient, visualized using a HD-EEG bipolar montage (left) and a standard LD-EEG bipolar montage (right) with equivalent sampling rates. The horizontal time scale bar indicates 50ms. Data were low pass filtered at 671.55Hz. The sampling rate was 2035Hz. A fast oscillation corresponding with the IED is evident on the HD-EEG recording only. B) Data band pass filtered (100–300 Hz) reveals a burst of high frequency activity evident in the HD EEG data (left) but not the LD-EEG data (right). C) Spectrogram reveals a clear spectral island centered at 150 Hz in the HD-EEG data; this is not clear in the LD-EEG.
The case demonstrates the utility of HD-EEG in identifying fast oscillations in a non-invasive way, potentially providing clinicians with an emerging biomarker for epileptogenicity.
Case 9. Novel applications: Functional language mapping
A 54-year-old female stroke survivor was recruited as part of an ongoing multi-site study on aphasia treatment. She had a chronic large encephalomalacic lesion in the territory of the left middle cerebral artery from an ischemic stroke 10 years prior (Figure 9A) and presented with chronic Broca’s aphasia at the time of assessment. She underwent identical naming task paradigms during 64-channel HD-EEG recordings and functional MRI (fMRI). The participant was instructed to name images showing concrete objects, and to remain silent for images showing abstract objects. Language mapping was performed using both HD-EEG and fMRI and results compared.
Figure 9.
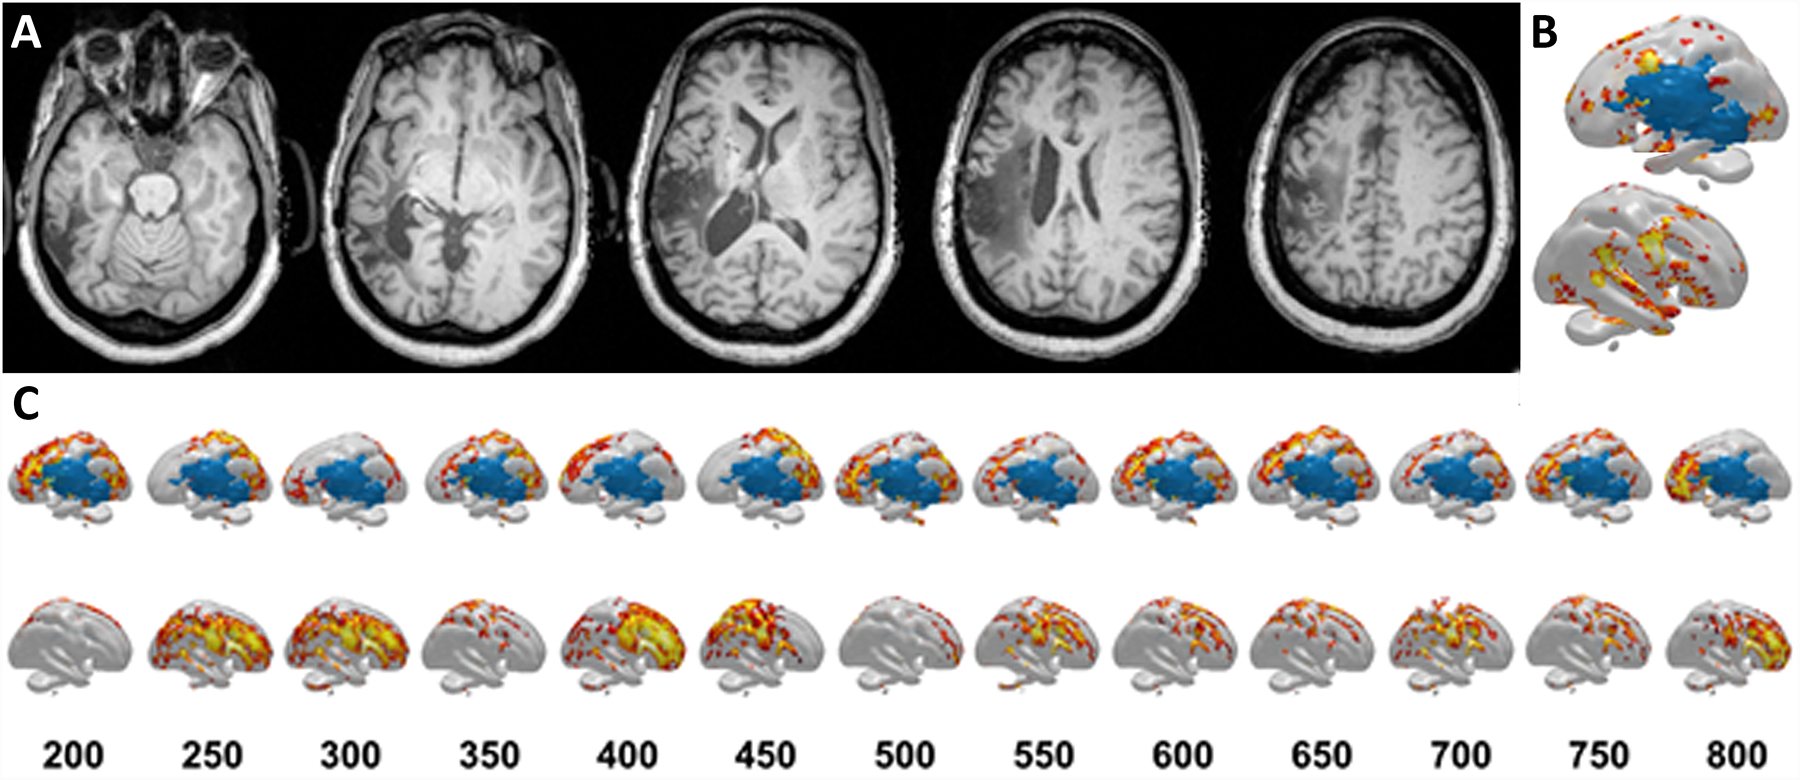
A) T1 axial views of the structural MRI 10 years after the subject’s stroke show the expected stroke lesion. B) Several sources for pre-articulatory BOLD responses were different between the concrete and abstract stimuli presentations based on fMRI scanning. Sources spanned from the frontal lobe (e.g. inferior frontal gyrus, precentral gyrus) to temporal lobe (e.g. superior temporal gyrus) to temporo-occipital regions, with few sources in the parietal lobe. Top=left hemisphere, Bottom=right hemisphere. C) Sources for pre-articulatory electrical activity based on HD-EEG recordings show shifting regions that were different between the concrete and abstract stimuli presentations. The numbers in the first row represent the time after stimulus presentation in milliseconds. Top=left hemisphere, Bottom=right hemisphere. At 200ms, source differences were mainly located in the frontal lobe; they then shifted to the parietal lobe They then shifted to perilesional regions involving all cortical lobes, then the parietal lobe, frontal lobe, and perilesional regions. Finally at 800ms, the source differences were found at the frontal lobe regions once again.
MRI images were acquired on a Siemens 3T Trio system (12-element head-coil). A three-dimensional T1-MRI was also acquired for co-registration and visualization of HD-EEG and fMRI. The fMRI data analysis was performed using SPM12 (https://www.fil.ion.ucl.ac.uk/spm/software/spm12/) and included the following procedures: motion correction; skull stripping; spatial smoothing, and intensity normalization. The BOLD hemodynamic response31 was modeled and used to compare concrete versus abstract items, focusing on the left hemisphere due to its language dominance32. The sources were widely spread across the left hemisphere, involving a diffuse network of different brain regions sparing the stroke region (Figure 9B).
CURRY software (Version 8, Compumedics Neuroscan, Germany) was used to process the participant’s HD-EEG recordings and the participant’s own structural MRI images, and to perform source reconstructions and analyses. Eye-blink activities and associated muscle artifacts were detected and removed using principal component analysis (PCA). A realistic head model was reconstructed using the patient’s T1-weighted MRI scan. This was done by applying bias field correction and manually adjusting autodetected thresholds for tissue, until the best cortical surface resolution was achieved. Using the processed EEG data, pre-articulatory brain activity was analyzed for every millisecond from 200ms to 800ms after stimulus presentation. This early range was chosen because of its association with language processing during naming33–36. Cortical source reconstruction was performed separately for concrete and abstract stimuli using sLORETA and found dynamic brain activation over time (Figure 9C) involving overlapping brain regions as observed in fMRI. fMRI and HD-EEG revealed similar brain areas engaged in pre-articulatory processing of naming objects but with additional dynamic temporal information revealed by HD-EEG compared to fMRI.
This case highlights the utility of HD-EEG as a lower cost alternative to fMRI. Moreover, it serves as a comprehensive tool that can provide additional spatiotemporal information and novel opportunities for function-to-brain mapping.
Discussion
One of the main challenges of standard clinical LD-EEG is that the low spatial resolution makes it difficult to visualize and accurately infer the anatomical correlates to observed sensor activity. By utilizing additional electrodes, HD-EEG provide increased spatial resolution on both visual and electrical source imaging (ESI) analyses, although it must be acknowledged that HD-EEG recordings do require extra effort, for data acquisition as well as for review and analysis. The additional steps required pose significant barriers to adoption unless clinical utility is clear. The cases described above offer examples from several centers that highlight areas of potential utility of HD-EEG recordings.
We have demonstrated that using both visual analysis and advanced techniques, HD-EEG can play an important role in clinical practice. On visual analysis alone, HD-EEG can help clinicians identify IEDs not visible in LD-EEG due to extended head coverage or spatial resolution37. In addition, HD-EEG visual analysis can assist in lateralizing or localizing falsely generalized activities on LD-EEG. Further, visual analysis provides opportunities to evaluate higher frequency activities, which may provide new targets for epileptogenic cortex.
Several different electrical source localization techniques are currently available with ongoing development expected. For each technique, there are multiple options for variance in recording and in the approach to analysis. These include use of differing numbers of electrodes2,38, the distribution of electrodes38, patient-specific and template head models39, forward and inverse models13,14,19,22, numbers of IEDs localized6,9,11, and IED time points selected for analysis40. Here we have shown that ESI using a variety of different techniques has provided clinically relevant and useful information that both impacts, and improves, patient care.
The cases shared here represent only a few examples of the utility of HD-EEG from institutions that have successfully implemented HD-EEG into clinical care. Further studies would be useful for assessing barriers for widespread adoption of this advanced, patient-friendly technology. Overall, the increased spatial resolution of HD-EEG is superior to that of LD-EEG, and allows for improvements in source localization as well as detection of epileptogenic activity that cannot be detected by LD-EEG. Population studies and cost-analyses are required to determine the clinical yield of this modality compared to routine clinical recordings and to identify patient cohorts that may stand to benefit the most from an expanded recording.
Table 1.
Case Summaries
| Case | Aim | Visual Analysis of LD-EEG | Visual Analysis of-EEG | Channel number | LD-EEG ESI | HD-EEG ESI | ESI method |
|---|---|---|---|---|---|---|---|
| 1 | Lateralization on of interictal discharges | Interictal discharges could not be lateralized | Clear lateralization on of interictal discharges | 128 | Inaccurate | Accurately lateralizes and localizes to epileptogenic lesion | sLORETA |
| 2 | Lateralization of ictal events | Ictal discharge could not be lateralized | Clear lateralization of ictal discharges | 128 | Inaccurate | Accurately lateralizes and localizes to epileptogenic lesion | MNE |
| 3 | Expansion of posterior recording field | The edge of the IED field observed on two channels | The center of the IED field is visualized | 122 | n/a | n/a | n/a |
| 4 | Expansion of frontal basal brain recording field | IEDs identified | IED field extends beyond LD EEG range | 256 | n/a | Accurately localizes to MEG source estimates | sLORETA |
| 5 | Identification on of subtle seizure onsets | Ictal activity not evident | Posterior inferior seizure visualized | 128 | Inaccurate | Accurately localizes to match subdural recordings | MNE |
| 6 | Localization of epileptogenic zone near eloquent motor cortex | Activity grossly localized | More accurate localization obtained | 76 | n/a | Accurately localizes to match subdural recordings | Dipole and sLORETA |
| 7 | Localization of epileptogenic zone near eloquent language cortex | Activity grossly localized | More accurate localization obtained | 256 | n/a | Accurately localizes to match subdural recordings | LAURA |
| 8 | Identification of spike-ripple events | No ripple events identified | Ripple events identified | 70 | n/a | n/a | n/a |
| 9 | Functional language mapping | . | . | 64 | n/a | Localizes to known language networks | sLORETA |
Acknowledgements:
The authors would like to acknowledge Kara Houghton, REEG, Kristy Nordstrom, REEG, and Brendan Thomas, REEG for their assistance with data collection and analysis for these cases.
Conflict of Interest and Funding Sources:
CJC is supported by NIH NINDS K23-NS092923 and NINDS R01NS119483 and consults for Biogen Inc and SleepMed Inc. LB’s research lab receives support from Medtronic. SV is supported by SNSF CRSII5_170873 and 192749. MS is supported by 163398 and CRS115–180365. MS and SV are advisors and shareholders of Epilog NV (Ghent, Belgium). JP consults for Philips Neuro. BB received non-financial research support from Medtronic and has licensed IP to Cadence Neurosciences. MH is supported by NIH NIBIB 5U01EB023820. All other authors have nothing to disclose (SMS, DMC, JW, MD).
References
- 1.Seeck M, Koessler L, Bast T, Leijten F, Michel C, Baumgartner C, He B, Beniczky S. The standardized EEG electrode array of the IFCN. Clin Neurophysiol. 2017;128:2070–2077. [DOI] [PubMed] [Google Scholar]
- 2.Sohrabpour A, Lu Y, Kankirawatana P, Blount J, Kim H, He B. Effect of EEG electrode number on epileptic source localization in pediatric patients. Clin Neurophysiol. 2015;126:472–480. [DOI] [PMC free article] [PubMed] [Google Scholar]
- 3.Lantz G, Grave de Peralta R, Spinelli L, Seeck M, Michel CM. Epileptic source localization with high density EEG: how many electrodes are needed? Clin Neurophysiol. 2003;114:63–69. [DOI] [PubMed] [Google Scholar]
- 4.Holmes MD, Brown M, Tucker DM, et al. Localization of extratemporal seizure with noninvasive dense-array EEG. Comparison with intracranial recordings. Pediatr Neurosurg. 2008;44:474–479. [DOI] [PubMed] [Google Scholar]
- 5.Holmes MD, Tucker DM, Quiring JM, Hakimian S, Miller JW, Ojemann JG. Comparing noninvasive dense array and intracranial electroencephalography for localization of seizures. Neurosurgery. 2010;66:354–362. [DOI] [PubMed] [Google Scholar]
- 6.Yamazaki M, Tucker DM, Terrill M, Fujimoto A, Yamamoto T. Dense array EEG source estimation in neocortical epilepsy. Front Neurol. 2013;4:42. [DOI] [PMC free article] [PubMed] [Google Scholar]
- 7.Storti SF, Boscolo Galazzo I, Del Felice A, et al. Combining ESI, ASL and PET for quantitative assessment of drug-resistant focal epilepsy. Neuroimage. 2014;102 Pt 1:49–59. [DOI] [PubMed] [Google Scholar]
- 8.Mégevand P, Spinelli L, Genetti M, et al. Electric source imaging of interictal activity accurately localises the seizure onset zone. J Neurol Neurosurg Psychiatry. 2014;85:38–43. [DOI] [PubMed] [Google Scholar]
- 9.Michel CM, Lantz G, Spinelli L, De Peralta RG, Landis T, Seeck M. 128-channel EEG source imaging in epilepsy: clinical yield and localization precision. J Clin Neurophysiol. 2004;21:71–83. [DOI] [PubMed] [Google Scholar]
- 10.Michel CM, Murray MM, Lantz G, Gonzalez S, Spinelli L, Grave de Peralta R. EEG source imaging. Clin Neurophysiol. 2004;115:2195–2222. [DOI] [PubMed] [Google Scholar]
- 11.Brodbeck V, Spinelli L, Lascano AM, et al. Electrical source imaging for presurgical focus localization in epilepsy patients with normal MRI. Epilepsia. 2010;51:583–591. [DOI] [PubMed] [Google Scholar]
- 12.Zumsteg D, Friedman A, Wennberg RA, Wieser HG. Source localization of mesial temporal interictal epileptiform discharges: correlation with intracranial foramen ovale electrode recordings. Clin Neurophysiol. 2005;116:2810–2818. [DOI] [PubMed] [Google Scholar]
- 13.Lantz G, Grave de Peralta Menendez R, Gonzalez Andino S, Michel CM. Noninvasive localization of electromagnetic epileptic activity. II. Demonstration of sublobar accuracy in patients with simultaneous surface and depth recordings. Brain Topogr. 2001;14:139–147. [DOI] [PubMed] [Google Scholar]
- 14.Brodbeck V, Lascano AM, Spinelli L, Seeck M, Michel CM. Accuracy of EEG source imaging of epileptic spikes in patients with large brain lesions. Clin Neurophysiol. 2009;120:679–685. [DOI] [PubMed] [Google Scholar]
- 15.Chu CJ. High density EEG—What do we have to lose? Clinical Neurophysiology. 2015;126:433–434. [DOI] [PMC free article] [PubMed] [Google Scholar]
- 16.Gramfort A, Luessi M, Larson E, et al. MNE software for processing MEG and EEG data. Neuroimage. 2014;86:446–460. [DOI] [PMC free article] [PubMed] [Google Scholar]
- 17.Hämäläinen MS, Sarvas J. Realistic conductivity geometry model of the human head for interpretation of neuromagnetic data. IEEE Trans Biomed Eng. 1989;36:165–171. [DOI] [PubMed] [Google Scholar]
- 18.Fischl B FreeSurfer. Neuroimage. 2012;62:774–781. [DOI] [PMC free article] [PubMed] [Google Scholar]
- 19.Jatoi MA, Kamel N, Malik AS, Faye I. EEG based brain source localization comparison of sLORETA and eLORETA. Australas Phys Eng Sci Med. 2014;37:713–721. [DOI] [PubMed] [Google Scholar]
- 20.Tucker DM. Spatial sampling of head electrical fields: the geodesic sensor net. Electroencephalography and Clinical Neurophysiology. 1993;87:154–163. [DOI] [PubMed] [Google Scholar]
- 21.Russell GS, Jeffrey Eriksen K, Poolman P, Luu P, Tucker DM. Geodesic photogrammetry for localizing sensor positions in dense-array EEG. Clin Neurophysiol. 2005;116:1130–1140. [DOI] [PubMed] [Google Scholar]
- 22.Jing L, Zhu S, He B. A finite difference method for solving the three-dimensional EEG forward problem. Conf Proc IEEE Eng Med Biol Soc. 2005;2:1540–1543. [DOI] [PubMed] [Google Scholar]
- 23.Dykstra AR, Chan AM, Quinn BT, et al. Individualized localization and cortical surface-based registration of intracranial electrodes. Neuroimage. 2012;59:3563–3570. [DOI] [PMC free article] [PubMed] [Google Scholar]
- 24.Wong-Kisiel LC, Tovar Quiroga DF, Kenney-Jung DL, et al. Morphometric analysis on T1-weighted MRI complements visual MRI review in focal cortical dysplasia. Epilepsy Res. 2018;140:184–191. [DOI] [PubMed] [Google Scholar]
- 25.Wagner J, Weber B, Urbach H, Elger CE, Huppertz H-J. Morphometric MRI analysis improves detection of focal cortical dysplasia type II. Brain. 2011;134:2844–2854. [DOI] [PubMed] [Google Scholar]
- 26.Jacobs J, LeVan P, Châtillon C, Olivier A, Dubeau F, Gotman J. High frequency oscillations in intracranial EEGs mark epileptogenicity rather than lesion type. Brain. 2009;132:1022–1037. [DOI] [PMC free article] [PubMed] [Google Scholar]
- 27.Kramer M, Ostrowski L, Song D, et al. Scalp recorded spike ripples predict seizure risk in childhood epilepsy better than spikes. Brain. In Press 2019. [DOI] [PMC free article] [PubMed] [Google Scholar]
- 28.Kobayashi K, Yoshinaga H, Toda Y, Inoue T, Oka M, Ohtsuka Y. High-frequency oscillations in idiopathic partial epilepsy of childhood. Epilepsia. 2011;52:1812–1819. [DOI] [PubMed] [Google Scholar]
- 29.van Klink NEC, van ’t Klooster MA, Leijten FSS, Jacobs J, Braun KPJ, Zijlmans M. Ripples on rolandic spikes: A marker of epilepsy severity. Epilepsia. 2016;57:1179–1189. [DOI] [PubMed] [Google Scholar]
- 30.Chu CJ, Chan A, Song D, Staley KJ, Stufflebeam SM, Kramer MA. A semi-automated method for rapid detection of ripple events on interictal voltage discharges in the scalp electroencephalogram. Journal of Neuroscience Methods. 2017;277:46–55. [DOI] [PMC free article] [PubMed] [Google Scholar]
- 31.Logothetis NK. The Underpinnings of the BOLD Functional Magnetic Resonance Imaging Signal. J Neurosci. 2003;23:3963–3971. [DOI] [PMC free article] [PubMed] [Google Scholar]
- 32.Fridriksson J, Richardson JD, Fillmore P, Cai B. Left hemisphere plasticity and aphasia recovery. Neuroimage. 2012;60:854–863. [DOI] [PMC free article] [PubMed] [Google Scholar]
- 33.Singh T, Phillip L, Behroozmand R, et al. Pre-articulatory electrical activity associated with correct naming in individuals with aphasia. Brain Lang. 2018;177–178:1–6. [DOI] [PMC free article] [PubMed] [Google Scholar]
- 34.Laganaro M, Morand S, Michel CM, Spinelli L, Schnider A. ERP correlates of word production before and after stroke in an aphasic patient. J Cogn Neurosci. 2011;23:374–381. [DOI] [PubMed] [Google Scholar]
- 35.Laganaro M, Morand S, Schnider A. Time course of evoked-potential changes in different forms of anomia in aphasia. J Cogn Neurosci. 2009;21:1499–1510. [DOI] [PubMed] [Google Scholar]
- 36.Indefrey P The Spatial and Temporal Signatures of Word Production Components: A Critical Update. Front Psychol. 2011;2. [DOI] [PMC free article] [PubMed] [Google Scholar]
- 37.Toscano G, Carboni M, Rubega M, Spinelli L, Pittau F, Bartoli A, Momjian S, Manni R, Terzaghi M, Vulliemoz S, Seeck M. Visual analysis of high density EEG: As good as electrical source imaging? Clin Neurophysiol Pract. 2019;5:16–22. [DOI] [PMC free article] [PubMed] [Google Scholar]
- 38.Song J, Davey C, Poulsen C, et al. EEG source localization: Sensor density and head surface coverage. Journal of Neuroscience Methods. 2015;256:9–21. [DOI] [PubMed] [Google Scholar]
- 39.Brodbeck V, Spinelli L, Lascano AM, et al. Electroencephalographic source imaging: a prospective study of 152 operated epileptic patients. Brain. 2011;134:2887–2897. [DOI] [PMC free article] [PubMed] [Google Scholar]
- 40.Lantz G, Spinelli L, Seeck M, de Peralta Menendez RG, Sottas CC, Michel CM. Propagation of interictal epileptiform activity can lead to erroneous source localizations: a 128-channel EEG mapping study. J Clin Neurophysiol. 2003;20:311–319. [DOI] [PubMed] [Google Scholar]


