

Abstract
Deuterium metabolic spectroscopy (DMS) and imaging (DMI) have recently been described as simple and robust MR-based methods to map metabolism with high temporal and/or spatial resolution. The metabolic fate of a wide range of suitable deuterated substrates, including glucose and acetate, can be monitored with deuterium MR methods in which the favorable MR characteristics of deuterium prevent many of the complications that hamper other techniques. The short T1 relaxation times lead to good MR sensitivity, while the low natural abundance prevents the need for water or lipid suppression. The sparsity of the deuterium spectra in combination with the low resonance frequency provides relative immunity to magnetic field inhomogeneity. Taken together, these features combine into a highly robust metabolic imaging method that has strong potential to become a dominant MR research tool and a viable clinical imaging modality. This perspective reviews the history of deuterium as a metabolic tracer, the use of NMR as a detection method for deuterium in vitro and in vivo and the recent development of DMS and DMI. Following a review of the NMR characteristics and the biological effects of deuterium, the promising future of DMI is outlined.
Keywords: Deuterium, metabolic imaging, glucose, label loss, relaxation
Graphical Abstract
Introduction
Non-invasive imaging is an essential part of modern medicine. Magnetic resonance imaging (MRI) is a commonly used modality due to its non-invasive nature, superb soft tissue contrast and wide array of unique contrast mechanisms that include, in addition to intrinsic NMR parameters (T1, T2), diffusion, perfusion, magnetic susceptibility and exchange. Despite the success of MRI in clinical decision making, the MRI signal ultimately reflects water and its properties and does not provide insight into metabolism. A number of pathologies, including cancer, neurodegenerative diseases and diabetes, are accompanied by changes in metabolism that can benefit from early detection or improved characterization with imaging techniques that are sensitive to metabolic processes. Although several metabolic imaging techniques are available, only fluorodeoxyglucose (FDG) positron emission tomography (PET) can be considered a routine clinical method. FDG-PET relies on the transport and subsequent accumulation of FDG into cells, in which image contrast is generated when pathological tissue accumulates FDG in larger amounts that the surrounding tissue. Whereas superb image contrast can be achieved for tumors throughout most of the human body, FDG-PET is somewhat limited in detecting and studying brain tumors where the high FDG uptake in normal brain tissue greatly reduces the image contrast.
A number of MR-based metabolic imaging techniques are available, including 1H MR spectroscopic imaging (MRSI), 13C MRS and hyperpolarized 13C MRSI. Proton MR provides the highest MR sensitivity and has been used to generate high-resolution metabolite-specific maps (1). While 1H MRSI can provide high-quality data in the hands of MR experts, it has never reached a level of robustness that is needed in a clinical setting. This is primarily caused by the technical challenges related to water and lipid suppression, magnetic field homogeneity and signal quantification. In addition, 1H MRSI-based metabolic maps visualize static metabolic pools that may not be reflective of underlying dynamic metabolic processes. 13C MRS, especially when used with 13C-enriched substrates, is the gold standard for non-invasive detection of metabolic pathways and fluxes (2). While 13C MRS remains an important research tool, it is not a clinically viable tool due to the low sensitivity and high technical complexity. Hyperpolarized 13C MRSI solves the sensitivity issues of conventional 13C MRS by creating and detecting a large non-equilibrium polarization. While there is a strong push, based on exciting preliminary results (3), to bring hyperpolarized 13C MR to the clinic, the technical challenges related to hyperpolarization, substrate administration and fast MRSI, the high costs as well as the supraphysiological 13C-labeled substrate doses are formidable hurdles that currently appear to prevent clinical integration.
Recently, deuterium (2H or D) metabolic spectroscopy (DMS) and metabolic imaging (DMI) have been demonstrated as simple, but powerful alternatives to 13C-based metabolic techniques (4,5). DMS and DMI are characterized by simple MR acquisition methods (pulse and acquire DMS, extended with phase-encoding for DMI), no need for water or lipid suppression, relatively high MR sensitivity and the availability of a wide range of affordable 2H-enriched substrates. While the clinical importance of DMI is, at this time, by no means certain and heavily relies on finding ‘killer applications’, this perspective makes the case that DMI is an intrinsically robust method that is ideally suited for translation from a research tool to a clinical environment.
The use of deuterium as a metabolic tracer for 2H studies in vivo was recognized early on in the previous century. However, initial studies on 2H lethality, the availability of other isotopes such as 13C and 15N and potentially large 2H kinetic isotope effects may all have contributed to the loss of interest in 2H as an isotopic tracer by the MR research community. Similarly, the advantages of 2H NMR were well known early on, although often dampened by apparent disadvantages regarding linewidths, resolution and sensitivity. The history that led up to the development of DMI is one of missed opportunities and misconceptions and represent an example of rediscovering lessons of the past. The title used for this Perspective therefore alludes to the knowledge available in the past about 2H NMR characteristics, as well as the realization of the potential – then and now – for use of 2H in future metabolic (imaging) studies.
Historical overview
The potential of 2H as a stable isotope tracer in studies of intermediary metabolism was recognized soon after its discovery by Urey et al. in 1932 (6). In a series of more than a dozen papers published between 1935 and 1938 (7–9), Rittenberg and Schoenheimer used 2H-enriched compounds to lay the foundation for studying dynamic metabolism, concluding with the statement that ‘the number of possible applications of this method appears to be almost unlimited’ (7). Despite this promise, the use of stable isotopes was soon overshadowed by the rise of radioactive isotopes such as 3H or 14C that were cheaper to prepare, administered at low tracer dosages and easier to detect with higher sensitivity using autoradiography. Concerns over the administration of radioisotopes to human subjects in conjunction with the development of sensitive detection methods for stable isotopes have re-energized the interest in the use of stable isotope tracers to study metabolism.
In 1939 Kellogg et al. (10) determined the nuclear magnetic moment of deuterium using molecular beam MR measurements. Following the discovery of NMR in bulk matter by Bloch (11) and Purcell (12) the relaxation properties of heavy water were briefly described by Bloembergen et al. (13) in their classic paper on relaxation. After these initial studies, the 2H NMR field was largely stagnant, presumably due to the apparent disadvantages related to quadrupolar line broadening, short relaxation times, low natural abundance and small chemical shift dispersion. The lack of significant early 2H NMR studies, in addition to the absence of high-quality solvent suppression methods, likely contributed to deuterium becoming the standard choice for non-protonated solvents and magnetic field locking. Since then 2H NMR has been used in the study of (partially) oriented molecules, membranes and complex formation as reviewed by Mantsch et al. (14).
The first use of deuterium NMR in vivo, to the best of our knowledge, did not appear until 1986 when Brereton et al. (15) studied 2H label incorporation in triglycerides during and following the administration of heavy water in mice. In 1989 this work was expanded by a more substantial report from the same group on 2H-detected lipid synthesis in obese and diabetic mice (16). Ackerman et al. (17) employed heavy water as a freely diffusible tracer to study blood flow and tissue perfusion. Around the same time as the first in vivo 2H MRS studies, Ewy et al. (18) and Muller and Seelig (19) described the first deuterium-based MR imaging experiments. Irving et al. (20) reported the insensitivity of 2H NMR towards paramagnetic contributions to the water linewidth, thereby allowing high-quality 2H MR spectra of the liver despite the presence of a high iron load.
London and coworkers (21,22) used deuterated methionine to study its catabolic pathways in rat liver. The deuterated methyl group provided excellent sensitivity and allowed the detection of multiple breakdown products, including sarcosine. Eng et al (23) used the high sensitivity provided by nine equivalent deuterons in 2H9-choline to study choline uptake and metabolism in rabbit kidney. Observed metabolic breakdown products included 2H9-betaine, whereas the high sensitivity afforded 2H MRI of the choline distribution across the kidney. Katz-Brull et al. (24) used 2H9-choline to study tumor metabolism in mice.
Taken together these early in vivo studies demonstrated some favorable features of 2H NMR, including insensitivity towards magnetic field inhomogeneity, enhanced sensitivity afforded by rapid signal averaging, sparsity of the 2H NMR spectrum and a technical simplicity. As succinctly expressed by London in an early review (25), ‘the major advantage of using deuterium as an in vivo tracer is the extreme technical ease with which studies can be carried out’. Despite the promise presented by these early studies, 2H NMR studies in vivo were published only sporadically, and were overshadowed by the success of 1H, 13C and 31P NMR studies of metabolism.
In parallel with 2H NMR reports using primarily heavy water in vivo, a small number of reports appeared on the use of 2H-labeled glucose to study metabolism in vitro. Barrow et al. (26) and Aguayo et al. (27) used 2H-labeled glucose to study bacterial metabolism. Aguayo et al. (28,29) and Berkowitz et al. (30) used 2H-labeled glucose to detect metabolism in retinas. Goodman et al. (31) used [6,6’−2H2]-glucose to study liver glycogen synthesis, whereas Hotchkiss et al. (32) focused on metabolism in red blood cells and its response to sepsis. Ben-Yoseph et al. (33) identified sources of 2H label loss during glycolysis when using [1-2H] and [6,6’−2H2]-glucose.
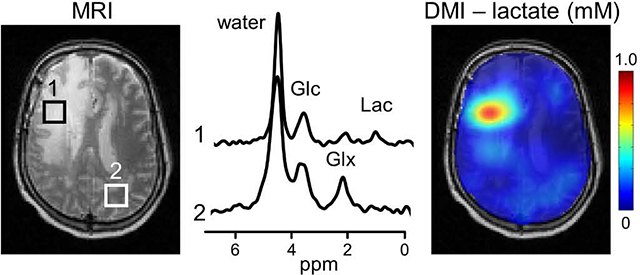
In 2017 Lu et al. (4) reported, following preliminary work of Mateescu et al. (34), the first in vivo 2H NMR study of [6,6’−2H2]-glucose metabolism in rat brain. At 16.4 T they were able to obtain high-quality 2H NMR spectra in just 15 seconds (TR 300 ms, 50 averages) that were used to acquire dynamic 2H MRS data during and following a bolus of [6,6’−2H2]-glucose. Using metabolic modeling the data yielded quantitative values for metabolic pathway fluxes, including the tricarboxylic acid cycle. As an alternative to dynamic MRS with high temporal resolution, De Feyter et al (5) used the high 2H MR sensitivity to generate steady-state metabolic maps of glucose, glutamate+glutamine (Glx) and lactate in rat and human brain (Fig. 1). The metabolic maps of lactate and Glx obtained with deuterium metabolic imaging, or DMI, were converted into a Warburg effect (Lac/Glx) map showing the relative dominance of non-oxidative over oxidative energy metabolism. The Warburg effect map showed high contrast-to-noise between tumor and normal tissue. These studies re-emphasized the robustness of 2H MR acquisitions in vivo due to their technical simplicity. In addition, with the advent of higher magnetic fields and improved RF coil and spectrometer configurations, the sensitivity of 2H MR is now high enough to 1) challenge and exceed the sensitivity of 13C NMR and 2) provide metabolic imaging at a spatial resolution sufficient for research and clinical applications.
Fig. 1.
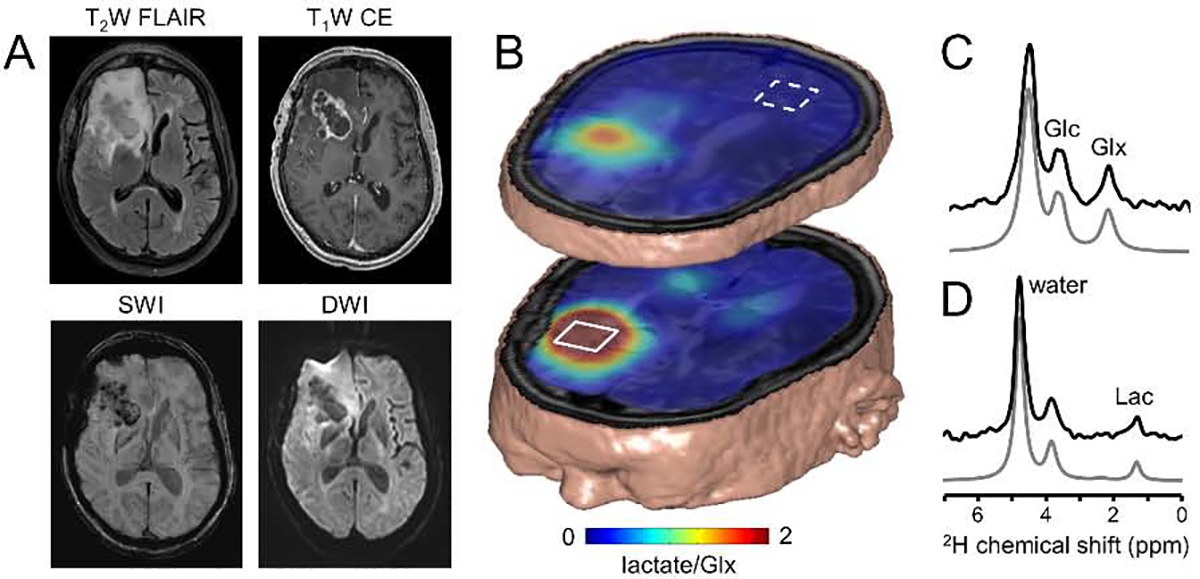
The future of deuterium metabolic imaging (DMI) as an integral part of MR-based clinical diagnosis. (A) Clinical MR images acquired as standard-of-care in a patient diagnosed with glioblastoma multiforme (GBM) in the right frontal lobe. MR images include T2-weighted fluid-attenuated inversion recovery (T2W FLAIR), T1-weighted contrast-enhanced imaging (T1W CE), susceptibility-weighted imaging (SWI) and diffusion-weighted imaging (DWI). (B) Metabolic image depicting the lactate/Glx ratio or Warburg effect ratio as calculated from DMI-based metabolic maps obtained circa 60–75 min following oral [6,60 −2H2]-glucose administration. The 3D DMI lactate/Glx ratio map is combined with a 3D T2W MRI. (C, D) Single-voxel 2H NMR spectra extracted from the 9 × 13 × 11 DMI data in (C) normal-appearing occipital lobe (white square, dotted line) and (D) within the lesion (white square, solid line). Glc, Glx and Lac refer to the administered metabolic substrate, [6,60 −2H2]-glucose, and the primary metabolic products, [4–2H]-glutamate + glutamine and [3–2H]-lactate, respectively. Original data and extended experimental details can be found in De Feyter et al, Sci. Adv. 4, eaat7314 (2018).
Since the first publications on DMS (4) and DMI (5), many researchers around the world are in the process of setting up 2H MR acquisitions at their local institution. This has resulted in 17 DMI-related abstracts at the 2019 and 2020 ISMRM annual meetings and seven DMI-related peer-reviewed publications in 2020 alone. de Graaf et al. (35) showed that the sensitivity of DMI scales supralinear with magnetic field strength, providing excellent 2H NMR spectra from human brain at 7 T from 1 mL voxels. Kreis et al (36) found a suitable trade-off between temporal and spatial resolution to map [6,6’−2H2]-glucose glycolytic flux dynamically in mouse flank tumors. Riis-Vestergaard et al. (37) used [6,6’−2H2]-glucose to discriminate between glucose uptake and metabolism in cold-acclimatized and thermoneutral brown adipose tissue in rats. Ye et al. (38) and Mahar et al. (39) used DMS and DMI to extract novel parameters on the underlying metabolic pathways. Rich et al. (40) used an inverse detection scheme in which the decrease in 1H MR signal is observed following the administration of [6,6’−2H2]-glucose. Von Morze et al. (41) compared hyperpolarized 13C MR of [1-13C]-pyruvate with DMI of [6,6’−2H2]-glucose in the characterization of cerebral energy metabolism. Straathof et al. (42) have demonstrated the utility of DMI in a rodent model of ischemic stroke.
MR characteristics of deuterium
T1 and T2 relaxation and sensitivity
Deuterium has a spin 1 with a Larmor frequency that is, at 6.55 MHz per tesla, circa 6.5 times lower than for proton. The quadrupolar moment of deuterium leads to relatively short T1 and T2 relaxation times. Figure 2 summarizes T1 and T2 relaxation times for deuterated compounds in brain tissue in vivo and phantoms in vitro (4,5). Overall the T1 relaxation times for water in vivo are around 350 ms with no significant dependence on the magnetic field strength (Fig. 2A). Glucose and Glx relax faster, with T1s around 50–60 ms and 150–200 ms, respectively. Lactate, as measured in postmortem brain tissue in situ, has a longer T1 of circa 300 ms. The T2 relaxation time constants in vivo are generally below 50–60 ms for metabolites and around 20–30 ms for water, respectively (Fig. 2B). The T2 relaxation time constants display a tendency to decrease with increasing magnetic field strength. The favorable T1/T2 ratio allows extensive signal averaging to improve the 2H MR sensitivity, while retaining a sufficiently high spectral resolution to allow the separation of water, glucose, Glx and lactate at magnetic field strengths suitable for in vivo NMR. In the DMS and DMI studies published to date a repetition time of 140 – 400 ms with excitation nutation angles of 50° – 90° have been used. While these settings produce fully-relaxed glucose signals, the signals from water, Glx and lactate will display partial signal saturation. When attempting quantitative DMS or DMI studies, this effect will need to be taken into account with a T1 and B1-dependent correction. The T1 and T2 relaxation time constants for water in vitro are similar around 400 ms as expected in the extreme narrowing limit (43). A long T2 relaxation time constant is typically undesirable for realistic phantoms aimed at mimicking the in vivo situation. The T2 relaxation of water can be dramatically shortened, with only a modest effect on the T1 relaxation, by mixing water with 1.5% agar or with 5 mM MnCl2 (Fig. 2C). The shorter relaxation times of deuterium are dominated by a quadrupolar relaxation mechanism, with a smaller contribution from dipolar relaxation with nearby protons and/or unpaired electrons. Since dipolar relaxation scales with the square of the gyromagnetic ratio, the dipolar contribution to deuterium relaxation is only ~2.4% of that contributing to proton relaxation. This is confirmed by the need for 5 mM (instead of 0.1 mM for protons) quantities of MnCl2 to achieve significant shortening of deuterium T1 and T2 relaxation time constants. Irving et al. (20) used this feature to measure liver iron overload. Whereas the high iron levels broadened 1H NMR spectra beyond recognition, 2H NMR provided high-quality water spectra. T1 measurements of deuterated water in vivo provided a correlation with iron levels. The T1 and T2 relaxation parameters of 2H are relatively independent of the magnetic field strength. The T1 relaxation shows a trend of modest increase with magnetic field, whereas the T2 relaxation displays a modest decrease with magnetic field. These trends are in overall agreement with metabolite proton T1 and T2 relaxation times (44), which is not surprising as the T1 and T2 dependence on the rotation correlation time and Larmor frequency has a similar functional form for dipolar and quadrupolar relaxation (43).
Fig. 2.
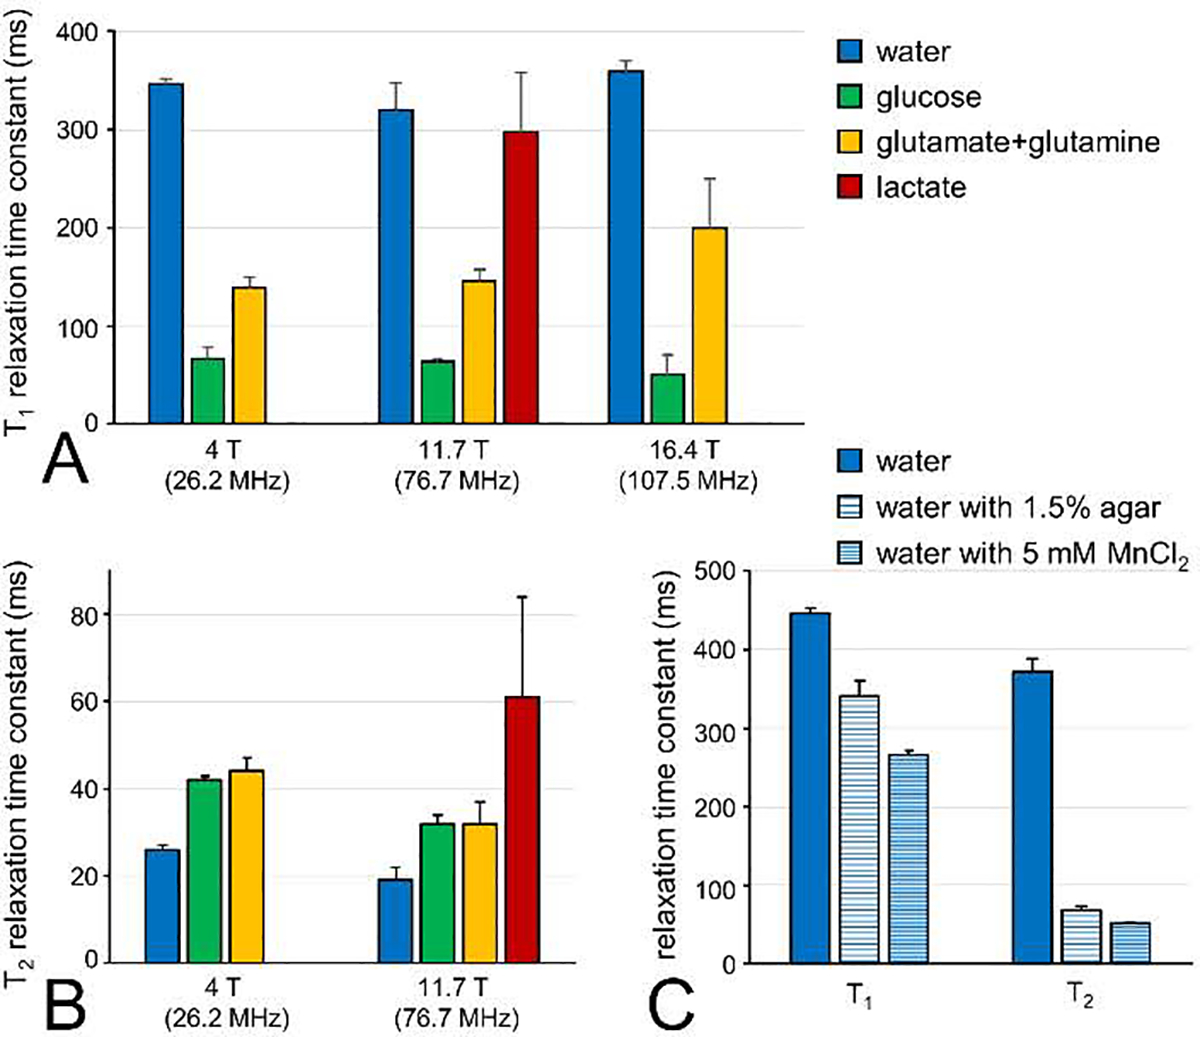
Deuterium T1 and T2 relaxation time constants in brain in vivo and phantoms in vitro. (A) 2HT1 relaxation time constants measured for natural abundance water,[6,60 −2H2]-glucose and [4–2H]-glutamate + glutamine in human (4 T) or rat brain (11.7 T and 16.4 T) in vivo and [3–2H]-lactate on rat brain post mortem (11.7 T). The inversion-recovery-based T1 values determined at 4 T/11.7 T and 16.4 T were reported by De Feyter et al (5) and Lu et al (4), respectively. (B) 2HT2 relaxation time constants measured for natural abundance water, [6,60 −2H2]-glucose and [4–2H]-glutamate + glutamine in human (4 T) or rat brain (11.7 T) in vivo and [3–2H]-lactate on rat brain post mortem (11.7 T). All T2 values were based on Hahn spin-echo measurements. (C) 2HT1 and T2 relaxation time constants for natural abundance water in vitro. Measurements were performed on deionized water, deionized water mixed with 1.5% agar and deionized water mixed with 5 mM MnCl2. All bars represent mean ± SD.
The 2H MR sensitivity scales supralinearly with the magnetic field strength B0 (35), close to the theoretical maximum for receive coils in which the noise is dominated by the RF coil (SNR ~ B01.75). A similar magnetic field dependence was demonstrated for small 30 mm diameter surface coils between 4.0 T and 11.7 T, as well as larger 80 mm diameter surface coils for human studies up to 7.0 T. The supralinear magnetic field dependence for 2H is similar to that of other lower frequency nuclei, such as 17O (45). The favorable SNR at higher magnetic fields would allow whole-brain DMI at 7.0 T with a spatial resolution of 1 mL. The resolution of metabolic imaging, including DMI, is necessarily several orders of magnitude lower than a corresponding MRI. Whereas MRI is primarily based on a water signal that represents circa 75 M of protons, metabolic measurements are based on metabolite signals representing up to 30 mM of protons. While considerations regarding T1 and T2 relaxation, gyromagnetic ratio and magnetic moment will change the balance slightly, the concentration difference between water and metabolites will always lead to a much lower spatial resolution for metabolic imaging. The lower spatial resolution leads to increased partial volume effects in which the spectroscopic volume covers multiple spatial regions visible in the MRI. Since the partial volume effect can dilute or even obscure the signal of interest (e.g., tumor lactate), it is important to set realistic expectations regarding the spatial resolution of the spectroscopic measurement relative to the size of the pathology under investigation. It should also be recognized that the nominal (cubic) MRSI voxel volume is always smaller than the actual MRSI voxel size dictated by the point spread function (44).
Chemical shifts and scalar couplings
The chemical shifts of 2H NMR are very similar to those observed with 1H NMR. For the majority of compounds only minor differences of up to 0.06 ppm can be observed (46). However, when the molecule has significant intramolecular hydrogen bonding, then substitution with 2H can lead to shifts up to 0.6 ppm (47). In addition, deuteration of compounds can have a small effect on the pKa (48) which can become relevant for compounds with a pKa close to the physiological pH of 7 (acetate, imidazole). When detecting the presence of 2H indirectly, two-bond isotope shifts of circa −0.017 ppm per deuteron can be observed with 1H NMR and one-bond shifts of circa −0.235 ppm per deuteron for 13C NMR (Fig. 3F).
Fig. 3.
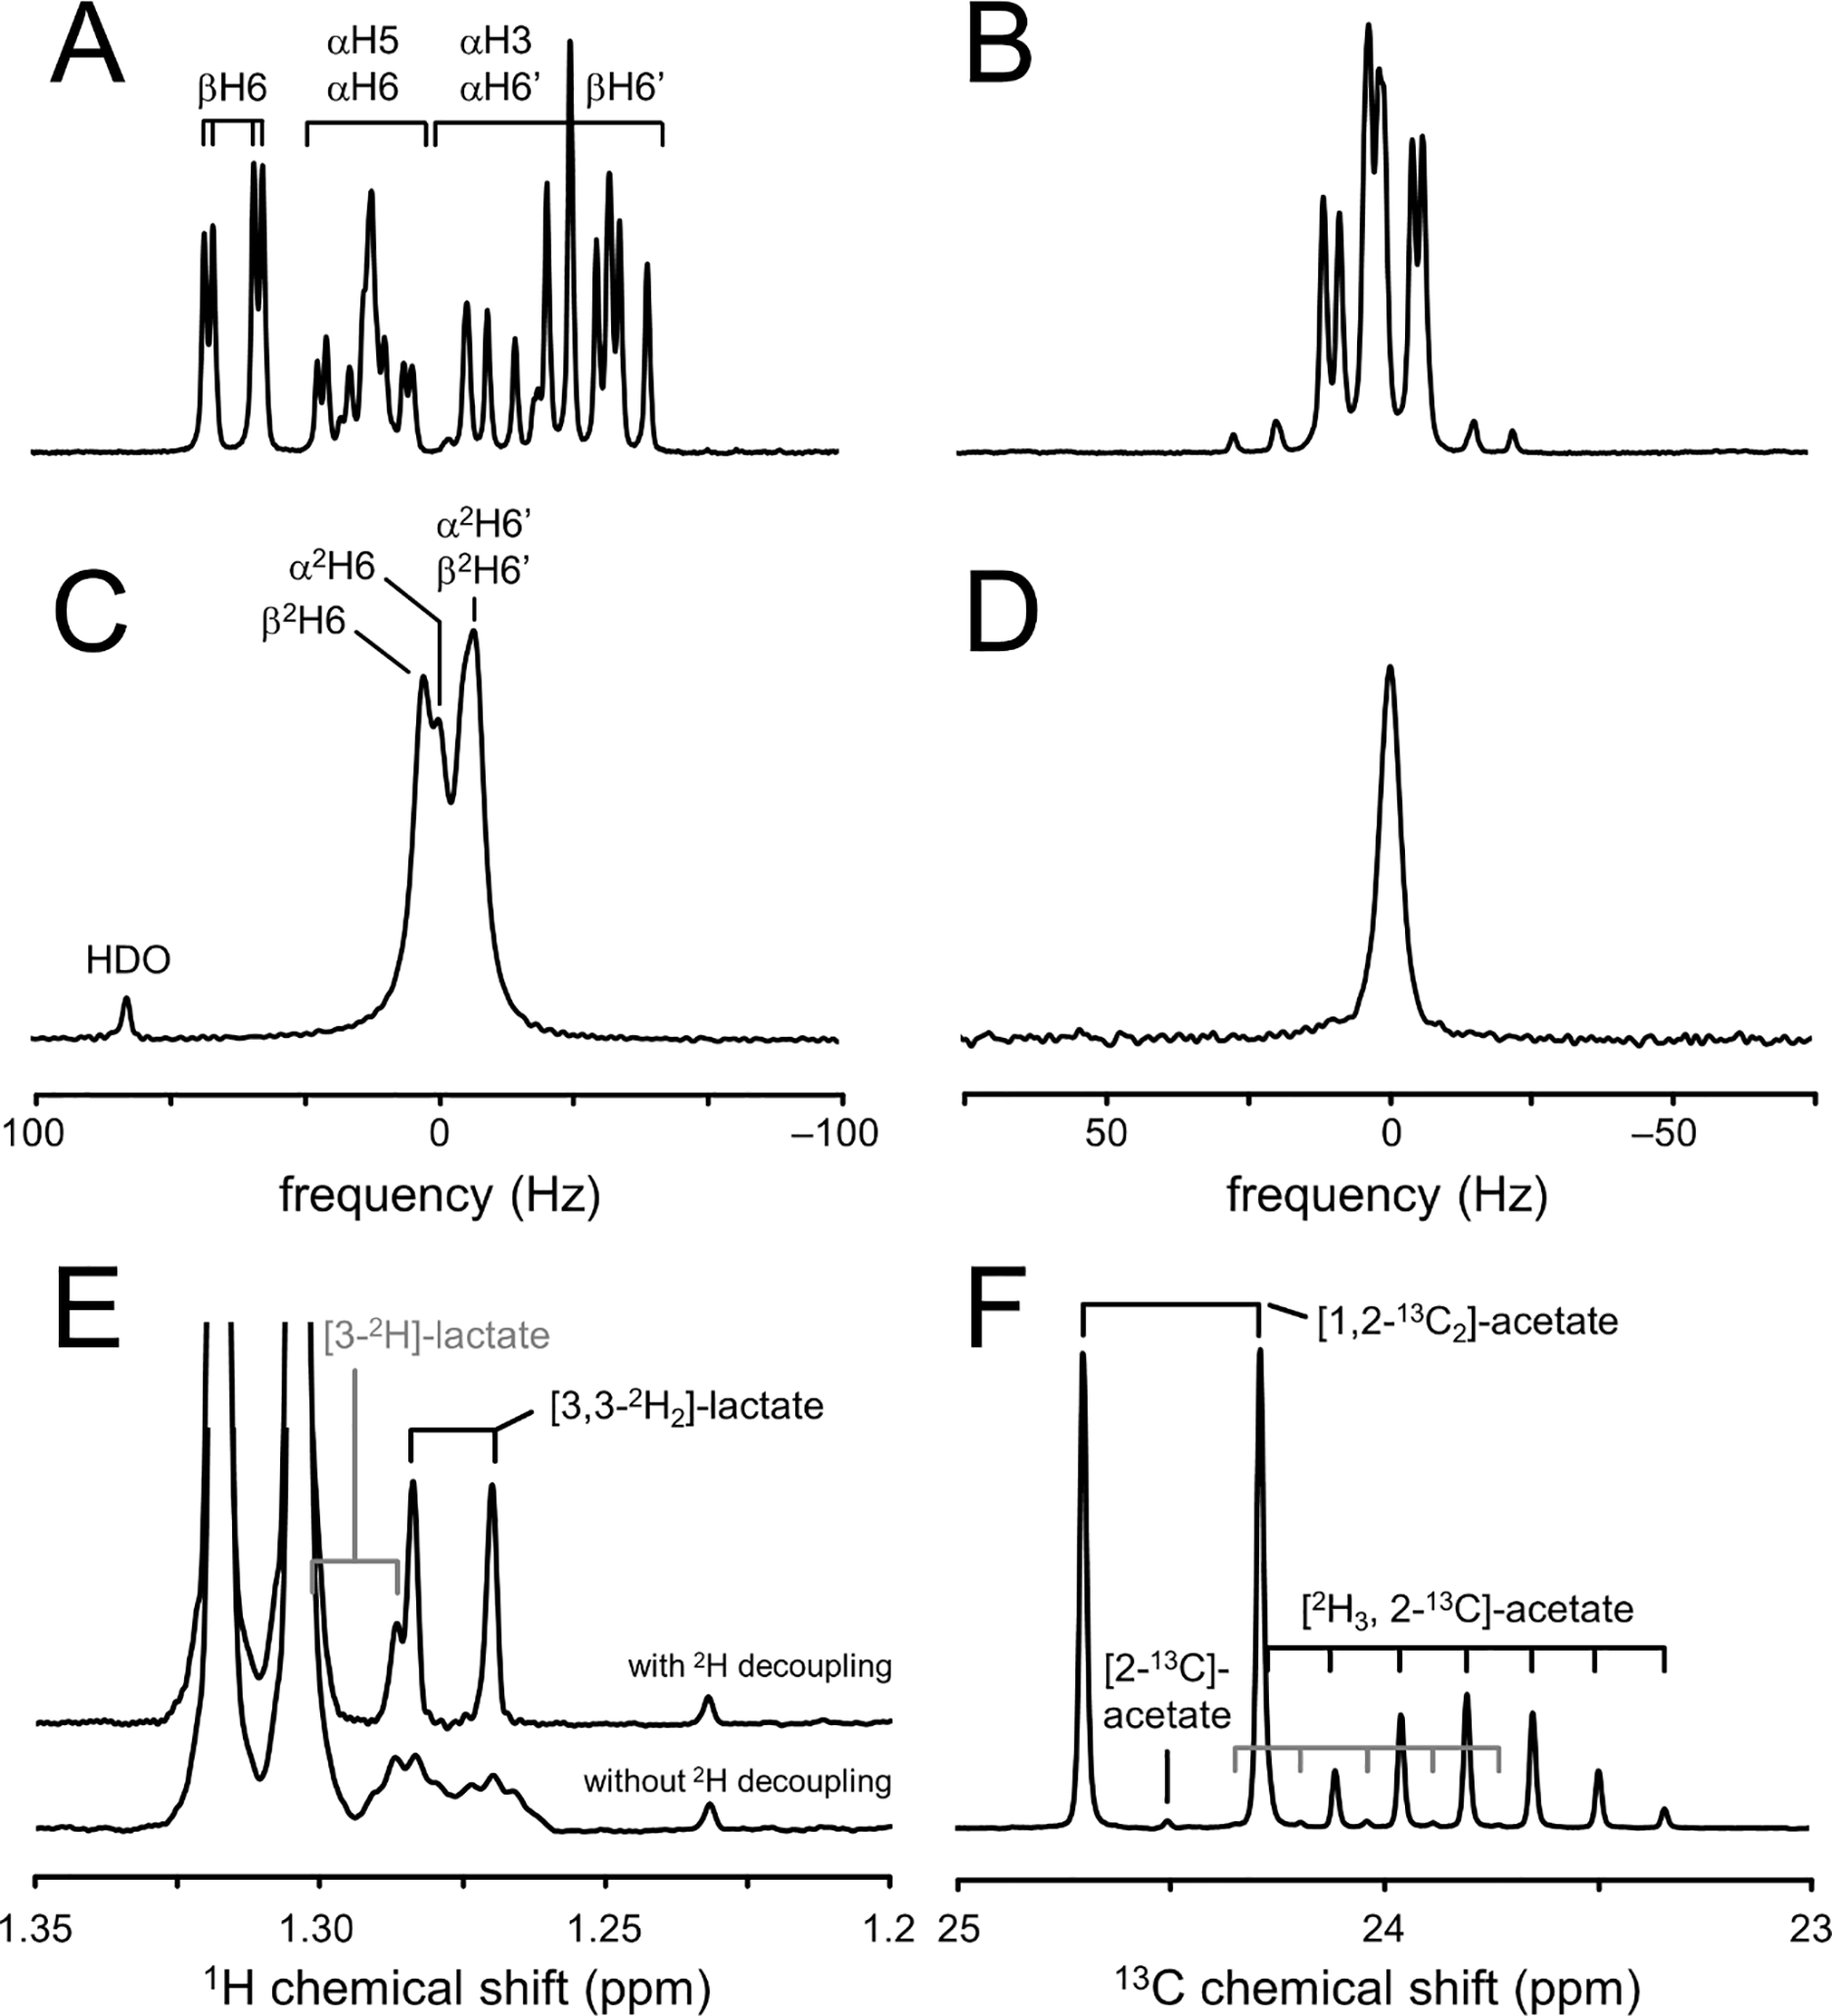
Chemical shift and scalar coupling effects in deuterated compounds. (A) 1H NMR spectrum of glucose in aqueous buffer (pH 7.0) shows a complex splitting pattern for the signals between 3.6 and 4.0 ppm due to extensive homonuclear scalar coupling and the anomeric forms of glucose. (B) 1H NMR spectrum of the H4/H40 protons in glutamate display a similarly complex pattern due to strong homonuclear scalar coupling. (C, D) 2H NMR spectra of (C) [6,60 −2H2]-glucose and (D) [2,4,40 −2H3]-glutamate in aqueous buffer. The complex 1H NMR patterns have essentially collapsed to singlet resonances for [2–2H]-glutamate (not shown) and [4,40 −2H2]-glutamate and a four-peak spectrum for [6,60 −2H2]-glucose due to the anomeric forms and the different chemical shifts for the 2H6 and 2H60 positions. Note that all spectra in (A-D) are in units of hertz, allowing a direct comparison between the 1H and 2H line widths. (E) 1H NMR spectrum of rat brain extract obtained two hours following the intravenous infusion of [6,60 −2H2]-glucose. The lactate signals at circa 1.3 ppm are dominated by non-deuterated lactate with smaller contributions from single and double-deuterated forms. Without 2H decoupling (lower trace) the deuterated lactate signals are broad and difficult to quantify due line broadening as a result of 1H–2H scalar coupling (2J(1H–2H) ~ 1 Hz). 2H decoupling (upper trace) effectively removes the effects of 1H–2H scalar coupling, thus reducing the lactate multiplets to doublets. Lactate, [3–2H]-lactate and [3,30 −2H2]-lactate can be separately quantified due to the deuterium isotope shift of circa −17 ppb per attached deuteron. (F) 13C NMR spectrum with broadband 1H decoupling of a solution containing 100 mM [1,2–13C2]-acetate and 100 mM [2H3,2–13C]-acetate in aqueous buffer. The triple deuterated acetate signal is characterized by a large isotope shift of circa −235 ppb per deuteron and extensive 2H–13C scalar coupling (1J(2H–13C) ~ 20 Hz) that gives rise to a 1:3:6:7:6:3:1 septet multiplet. A small amount of double-deuterated acetate contamination can be observed as a 1:2:3:2:1 quintet signal (gray lines). All data was acquired at 11.7 T, providing Larmor frequencies of 500.1, 76.7 and 125.7 MHz for 1H, 2H and 13C, respectively.
Scalar coupling interactions are generally scaled by the gyromagnetic ratio of the nuclei involved. Scalar couplings involving deuterium (e.g., 1H-2H) are therefore circa 6.5 times smaller than the corresponding scalar coupling involving protons (i.e., 1H-1H). 2H-2H scalar couplings are about 42 times smaller than a corresponding 1H-1H coupling. Since most 1H-1H couplings are smaller than ~20 Hz, the corresponding 2H-2H couplings are generally below 0.5 Hz and not observable. Fig. 3A–D shows 1H and 2H spectra of glucose and glutamate in aqueous buffer (pH 7.0). The 1H NMR spectra (Fig. 3A/B) are characterized by extensive and often strong 1H-1H scalar couplings within glucose and glutamate. In the corresponding 2H NMR spectra (Fig. 3C/D) the 1H-2H and 2H-2H scalar couplings are not resolved, leading to a minor line broadening only. Proton decoupling could be used to remove the 1H-2H scalar couplings, although this has not produced significant signal enhancement in vivo (unpublished results). The spectral simplification achieved by the absence of significant scalar coupling improves both the sensitivity and simplicity of 2H NMR spectra. The 1H-2H scalar coupling can also be observed with 1H NMR, where the small coupling typically manifests itself as a line broadening. 2H decoupling during 1H NMR signal acquisition can remove the 1H-2H scalar coupling, thereby reducing the effect of deuterium to an isotope shift (Fig. 3F). Scalar coupling between 2H and 13C is readily observable in both 2H and 13C NMR spectra. The one-bond 2H-13C scalar coupling is generally in the range of 20–30 Hz and manifest itself as a doublet splitting in 2H NMR spectra. As deuterium is a spin-1 nucleus, the scalar coupling pattern for a 2H-13C spin-system in 13C NMR is a 1 : 1 : 1 triplet. Additional splitting due to the presence of two or three deuterons is given by successive splitting of the triplet structure, providing quintet and septet multiplets with relative intensities of 1 : 2 : 3 : 2 : 1 and 1 : 3 : 6 : 7 : 6 : 3 : 1, respectively (Fig. 3F).
Natural abundance of deuterium
2H NMR spectra from tissues in vivo are characterized by a water signal originating from the natural abundance deuterium content (Fig. 4C). Depending on the tissue, signal from natural abundance lipids may also be detected. The deuterated water signal is small enough to eliminate the need for water suppression and presents a convenient internal concentration reference, provided that the tissue water content and natural abundance of deuterium are known.
Fig. 4.
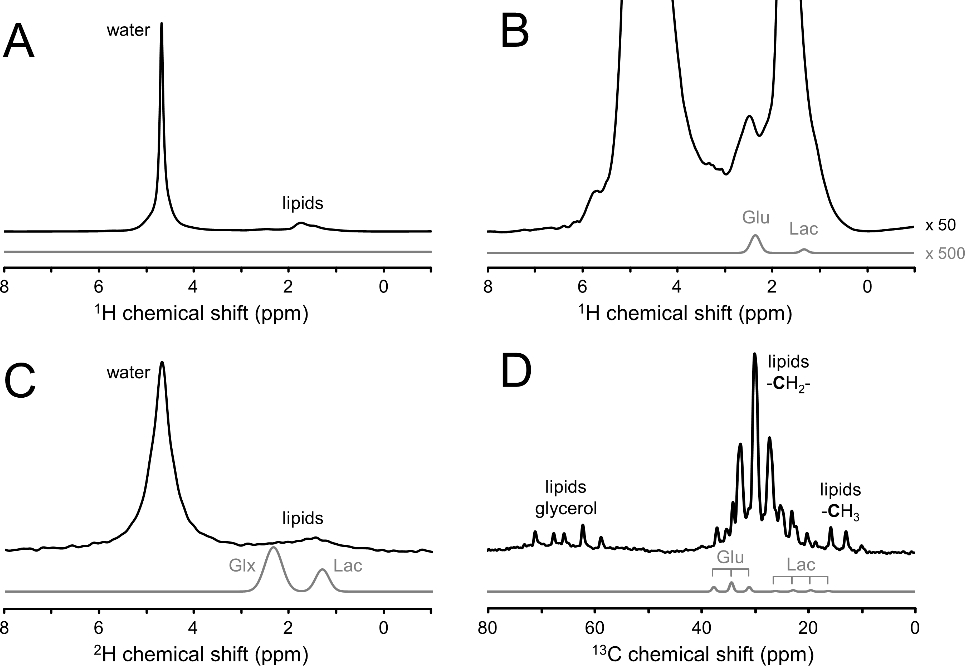
Dynamic range difference between signals of interest (glutamate and lactate) and interfering signals (water and lipids) in 1H, 2H and 13C NMR spectra of the human head. All experimental signals are obtained with transmit-receive surface coils (circa 90 mm diameter) tuned to the Larmor frequency under investigation and acquired with a pulse-acquire method. The transmit power of the excitation pulse was adjusted to approximately match the detection volumes for 1H, 2H and 13C NMR. Experimental (A, B) 1H NMR spectrum (black line, TR = 3000 ms, 1 average), (C) 2H NMR spectrum (black line, TR = 333 ms, 180 averages) and (D) 13C NMR spectrum (black line, TR = 3000 ms, 128 averages) obtained from human head. The signals of interest (glutamate and lactate for 1H and 13C, and glutamate + glutamine (Glx) and lactate for 2H) are indicated by light gray lines as Gaussian lines with the amplitudes scaled to approximate natural abundance for 1H and a steady-state enrichment for 2H and 13C following the administration of [6,60 −2H2]-glucose or [1–13C]-glucose, respectively. Note that experimental and simulated spectra have the same vertical scale, except in (B) where the experimental and simulated 1H spectra are scaled by 50 and 500, respectively, as compared to (A).
The deuterium natural abundance in water has traditionally been determined on standard mean oceanic water (SMOW) with an average value of 156 ppm (49), although variation up to 15% can be seen across water from different parts of the globe. Geographic and seasonal variations in 2H content are caused by isotopic fractionation associated with evaporation and condensation during the global water cycle that involves oceans, clouds, rainfall and rivers. Rossman and Taylor (50) define the representative deuterium isotopic content in fresh water in temperate climates and specify a value of 115 ppm, which was subsequently adopted by the IUPAC recommendations on NMR nomenclature (51). Depending on the exact natural abundance value used, the concentration of water deuterons in tissue with a 70% water content ranges between 8.9 and 12.1 mM. In addition to the global variation in 2H natural abundance, a DMI study will raise the water 2H content. Given enough time, essentially all the deuterium from administrated [6,6’−2H2]-glucose will end up in the body water pool, raising the HDO level by as much as 50% above natural abundance. If the tissue water signal is to be used as a quantitative concentration reference, the tissue 2H content will need to be established. As the 2H content of water is generally assumed to be constant throughout the body, a measurement of 2H content in readily accessible body fluids provides an easy route. In addition to other methods, like GC-MS, NMR itself is an excellent method to determine 2H isotopic content in biofluids (52). Over time the body water 2H enrichment will gradually return to natural abundance levels as water is continually excreted and ingested. For humans, baseline levels will be reached in 4–5 weeks (53), whereas in mice the time period is reduced to less than 2 weeks (16).
Practical considerations for in vivo 2H NMR
Even though early in vivo NMR studies showed the potential of 2H NMR, it was not until 25 years later that the stagnant in vivo 2H NMR field became re-energized by studies on high-field DMS (4) and DMI (5). To understand the current interest in DMS and DMI it is informative to compare 2H-based metabolic imaging to other MR-based methods.
Proton MRS and MRSI has long been the primary target for metabolic imaging due to the high intrinsic sensitivity and high information content. In the hands of an expert MR spectroscopist, 1H MRSI can provide metabolic maps of more than a dozen metabolites, across the entire human brain at a sub-milliliter spatial resolution (1). However, in a more routine, clinical setting there are many potential problems and artifacts that can diminish the quality and usefulness of 1H MRSI. 1H MRS in general is characterized by water and lipid signals that are orders of magnitude larger than the metabolites of interest (Fig. 4A/B). Even though a wide range of water and lipid suppression techniques exist (44), they are usually only as good as the MR operator controlling their settings. Small errors in the placement of lipid suppression modules quickly overwhelm the metabolite signals rendering the metabolic image useless. Due to the higher gyromagnetic ratio, 1H NMR is highly sensitive to magnetic field inhomogeneity, which is still a standing challenge in a clinical setting. The lack of robustness is a main reason that 1H MRSI is not a major clinical metabolic imaging technique.
Chemical shift saturation transfer (CEST) MRI is becoming a popular alternative to direct 1H MR spectroscopic investigations (54). During CEST-MRI, the magnetization of metabolites is transferred to the large water signal through the use of specific saturation schemes. The high sensitivity afforded by the water signal allows high-resolution, ‘metabolite-weighted’ images without the complications (water, lipid suppression) associated with 1H MRSI. Unfortunately, the CEST effect is only sufficiently strong for a limited number of metabolites (e.g., glutamate, creatine, glucose), while limited specificity and multiple exchange mechanisms complicate interpretation of CEST-MRI results.
Carbon-13 NMR has long been the primary MR technique for isotopic labeling studies. While 13C NMR does not require water suppression, it is still affected by large lipid signals that, even at 1.1% natural abundance, can quickly overwhelm smaller metabolite signals (Fig. 4D). In addition to the required spatial localization, 13C NMR is often executed with advanced MR methods (nuclear Overhauser enhancement, polarization transfer) to increase the intrinsically low sensitivity. Significant sensitivity enhancement and spectral simplification occurs with broadband proton decoupling during 13C MR acquisition. Despite the sensitivity enhancement methods, 13C NMR is typically still acquired from large volumes (> 50 mL in human brain) to achieve sufficient SNR. While being an important and powerful research tool (2), the complicated, RF-power-intensive acquisition methods combined with the low sensitivity, have prevented 13C NMR from having clinical impact. More recently, hyperpolarized 13C MR has been developed as a metabolic imaging technique (3). By hyperpolarizing specific compounds (e.g., [1-13C]-pyruvate), the method overcomes the sensitivity limitations, albeit only for a few minutes as the hyperpolarized spins relax back to thermal equilibrium. Impressive results have been obtained in a limited number of expert research laboratories (3). Due to the complicated technical setup, supraphysiological substrate levels and limited lifetime of the hyperpolarized spin state, it remains to be seen if hyperpolarized 13C metabolic imaging will reach status of a clinically relevant technique.
Unlike the acquisition of 1H, 13C or hyperpolarized 13C MRS(I), the acquisition of 2H DMS or DMI is extremely simple, involving the most basic pulse-acquire MR sequence. The simplicity is in large part based on the low 2H natural abundance that reduces the signal from concentrated, interfering compounds such as water and lipids, relative to the signal of 2H-enriched metabolites of interest (Fig. 4C). As a result, the 2H MR signal from lipids is often at or below the noise level in global 2H MR spectra (Fig. 4C). While 1H and 2H NMR are equally sensitive to magnetic field inhomogeneity (in ppm), the lack of large signals and the sparsity of 2H MR spectra make such effects much less detrimental. A decreased magnetic field homogeneity quickly leads to poor water suppression and increased spectral overlap in dense 1H MR spectra. The same inhomogeneity during DMI will only lead to some line broadening. These statements are supported by the observation of high-quality 2H MR spectra from the rat olfactory bulb region and the human frontal cortex (5), areas that are notoriously inhomogeneous.
The simple DMI acquisition methods also lead to low RF power deposition, a consideration that always plays a role with 1H and 13C MR studies where extensive outer volume suppression modules, refocusing pulses and broadband decoupling can make it challenging to adhere to the specific absorption rate (SAR) safety guidelines. In addition, the long wavelength inherent to the low frequency of 2H MR guarantees that standing wave effects, that complicate human 1H MR studies at high magnetic fields, do not play a role. Taken together, all these features make DMS and DMI extremely robust against experimental imperfections and essentially provides good quality data on every subject. Notwithstanding problems not directly related to 2H MR (e.g., ventilation, infusion lines), DMI acquired on 15 human subjects and over 100 rodents have resulted in close to 100% success rate with 90+% of the data within the brain deemed useful. This level of robustness, which essentially mirrors that of MRI, is an important feature for DMI to attain clinical significance.
Biological effects of deuterium
Soon after the discovery of deuterium by Urey (6), researchers became intrigued about its biological effects. Initial studies focused on the compatibility of life in the presence of high levels of deuterated water. While some microorganisms flourished in ≥ 90% D2O, the majority of vertebrate life did not survive in the presence of 2H water enrichments in excess of 50%. While the exact mechanisms were never fully deduced, very high deuterium levels resulted in multiple organ failure (55). These early studies likely contributed to the misconception that drinking heavy water is poisonous. However, subsequent research in animals and humans at 2H enrichments below 15% has revealed little or no adverse biological effects and has been reviewed in multiple papers (55–59).
Human studies involving deuterated water can be found in the areas of whole body metabolism, cell proliferation and DNA synthesis (60–62). In a typical study the subject drinks 50 mL of D2O for several days to weeks, in which the body 2H enrichment can reach 0.5 – 1.5 %. These doses and enrichments, as well as experiences with heavy water in humans in general, have been deemed safe with no adverse effects. The only known acute side effect is transient vertigo or nausea which may occur following the initial D2O intake. These symptoms are apparently due to the hair cells of the inner ear vestibular apparatus detecting differences in bulk flow properties of water during the transient period of changing 2H enrichment. Administering the D2O slowly or using lower enriched D2O can further reduce these symptoms (60). In a typical DMI study involving human subjects, [6,6’−2H2]-glucose is administered at a dose of 0.75 g per kg body weight. A dose of 60 g corresponds to 330 mmol glucose or 660 mmol 2H. An 80 kg human subject with a 70% water content contains 716 mmol natural abundance 2H (0.0115 %). The deuterons from [6,6’−2H2]-glucose will, via metabolic breakdown, primarily end up in the body water, so that the body water 2H content rises from 716 mmol to 1376 mmol or equivalently from 115 ppm to 221 ppm enrichment. The relatively small amount of 2H associated with DMI studies based on [6,6’−2H2]-glucose therefore raises the 2H enrichment by only a modest amount. Performing 5 DMI scans longitudinally keeps the overall body 2H enrichment well below 0.1%, even when assuming that no 2H leaves the body throughout the longitudinal study.
While all human studies that involve deuterium keep the overall body 2H enrichment well below 1%, the use of deuterated substrates such as [6,6’−2H2]-glucose can raise the blood substrate 2H enrichment during and shortly after administration to levels well in excess of 15%. Depending on the exact route of administration (intravenously or oral) and starting plasma glucose levels, the 2H enrichment of blood glucose can reach 60 – 75%. It is well known that the replacement of protons with deuterons can lead to a large kinetic isotope effect (KIE) in which reaction rates in the presence of deuterium (kD) are reduced relative to those involving only protons (kH). Even though a KIE can be expected for any isotope, the large relative mass increase during the replacement of 1H with 2H leads to the theoretically largest KIE = kH/kD of > 7, depending on the type of chemical bond and the temperature (63). While large deuterium KIEs can be observed for select chemical reactions, the majority of in vitro reactions are characterized by KIEs closer to unity (55,64). A KIE for an individual enzyme will only have a large effect on the flux through an entire metabolic pathway in vivo if that the enzyme is rate-limiting. While KIE measurements in vivo are sparse, data from Funk et al. (65) on KIEs of [U-2H7]-glucose in rat heart and our own data on KIEs of [6,6’−2H2]-glucose in rat brain and tumor cells (66) all indicate a very small KIE for glycolytic glucose metabolism. While the KIEs for deuterated glucose in vivo appear small, they need to be established for every unique substrate and possibly even for each position within a substrate. Despite the presence of a small KIE, the safety of deuterated glucose for human use is well established by extensive studies of human body metabolism (67), as well as studies in infants (68).
2H label loss or 2H solvent exchange processes
Label loss is common to all isotope tracer methods. For example, the metabolic fate of [U-13C6]-glucose breakdown through glycolysis and the tricarboxylic acid (TCA) cycle can be followed with 13C NMR. Whereas the majority of 13C label ends up in TCA cycle intermediates, the 13C label in the glucose C3 and C4 position is ‘lost’ as carbon dioxide in the conversion from pyruvate to acetyl-CoA by pyruvate dehydrogenase. The 13C label is considered ‘lost’ as it becomes part of a large carbon dioxide or bicarbonate pool that no longer provides information on specific metabolic pathways. The 13C label from the C1, C2, C5 and C6 glucose positions is transferred to TCA cycle intermediates, glutamate, glutamine and other compounds and provides a rich and powerful window into glucose metabolism. Given enough time however, the 13C label from all glucose positions ends up, via multiple turns of the TCA cycle, in the non-specific carbon dioxide pool.
DMS and DMI studies have to deal with loss of 2H isotope label to the non-specific water pool. Most forms of 2H label loss can be deduced from the overall stoichiometry of the chemical reactions involved, occurring when the number of protons on a given carbon position is reduced (Fig. 5). For example, during the conversion of glyceraldehyde-3-phosphate (GADP) to 1,3-bisphosphateglycerate (1,3-BPG) an aldehyde group is oxidized and phosphorylated leading to the removal of a proton (or deuteron) that originally came from the glucose C3 or C4 position. The fact that phosphoenolpyruvate (PEP) has no protons on the C1 and C2 positions means that the 2H label loss from the C2, C3, C4 and C5 positions of glucose is 100% during glycolysis. To study glycolysis and other downstream pathways, glucose should be deuterated in the C1, C6 or both positions. Other sources of 2H label loss are less obvious and do not follow directly from the overall reaction stoichiometry. For example, pyruvate can exist in both enol and keto forms (Fig. 6A), in which the conversion involves the removal or addition of a proton from water. The enol-keto tautomer equilibrium can lead to 2H label loss in the C3 position of pyruvate. Additional signal loss specific for the C1 position of glucose occurs in the presence of pentose phosphate pathway (PPP) activity. Phosphomannose isomerase (PMI) activity further increases the 2H label loss from the glucose C1 position. To label metabolites downstream from pyruvate, i.e., lactate and glutamate, the best substrate is [6,6’−2H2]-glucose. [U-2H7]-glucose will provide a slightly higher SNR due to the 2H label on the C1 position, but will also generate a lot more deuterated water signal. Knowledge on the exact amount of 2H label loss is required to quantitatively model 2H label flow through metabolic pathways to determine absolute metabolite fluxes. 2H label loss can be determined with 1H or 13C NMR as shown in Fig. 3E and F, in which the loss of a deuteron leads to a different isotope shift and/or scalar coupling pattern. Fig. 6B/C summarizes the 2H label distribution in the end product of anaerobic glycolysis (lactate or ethanol (yeast)) when using [6,6’−2H2]-glucose (5,69) or [U-2H7]-glucose (39,65). Despite being measured in a number of different systems (cancer cells, rat brain and yeast), the label distribution is very similar, indicating that the label loss is specific for the underlying metabolic pathways and not the organism. The 2H label distribution in lactate when using [U-2H7]-glucose is different due to the additional 2H label loss mechanisms for the C1 position of glucose. However, the label distribution is again very similar for identical metabolic pathways in heart (65) and in tumor cells (39). When working with a closed system (e.g., cancer cells in a cell culture medium flask) the 2H-labeled water can function as a sensitive readout of the underlying metabolic pathways (39). For in vivo systems, however, the metabolically generated D2O in the local tissue of interest quickly exchanges with the large body water pool. The rise in D2O signal during an in vivo [6,6’−2H2]-glucose or [U-2H7]-glucose study is thus largely reflective of whole-body metabolism.
Fig. 5.
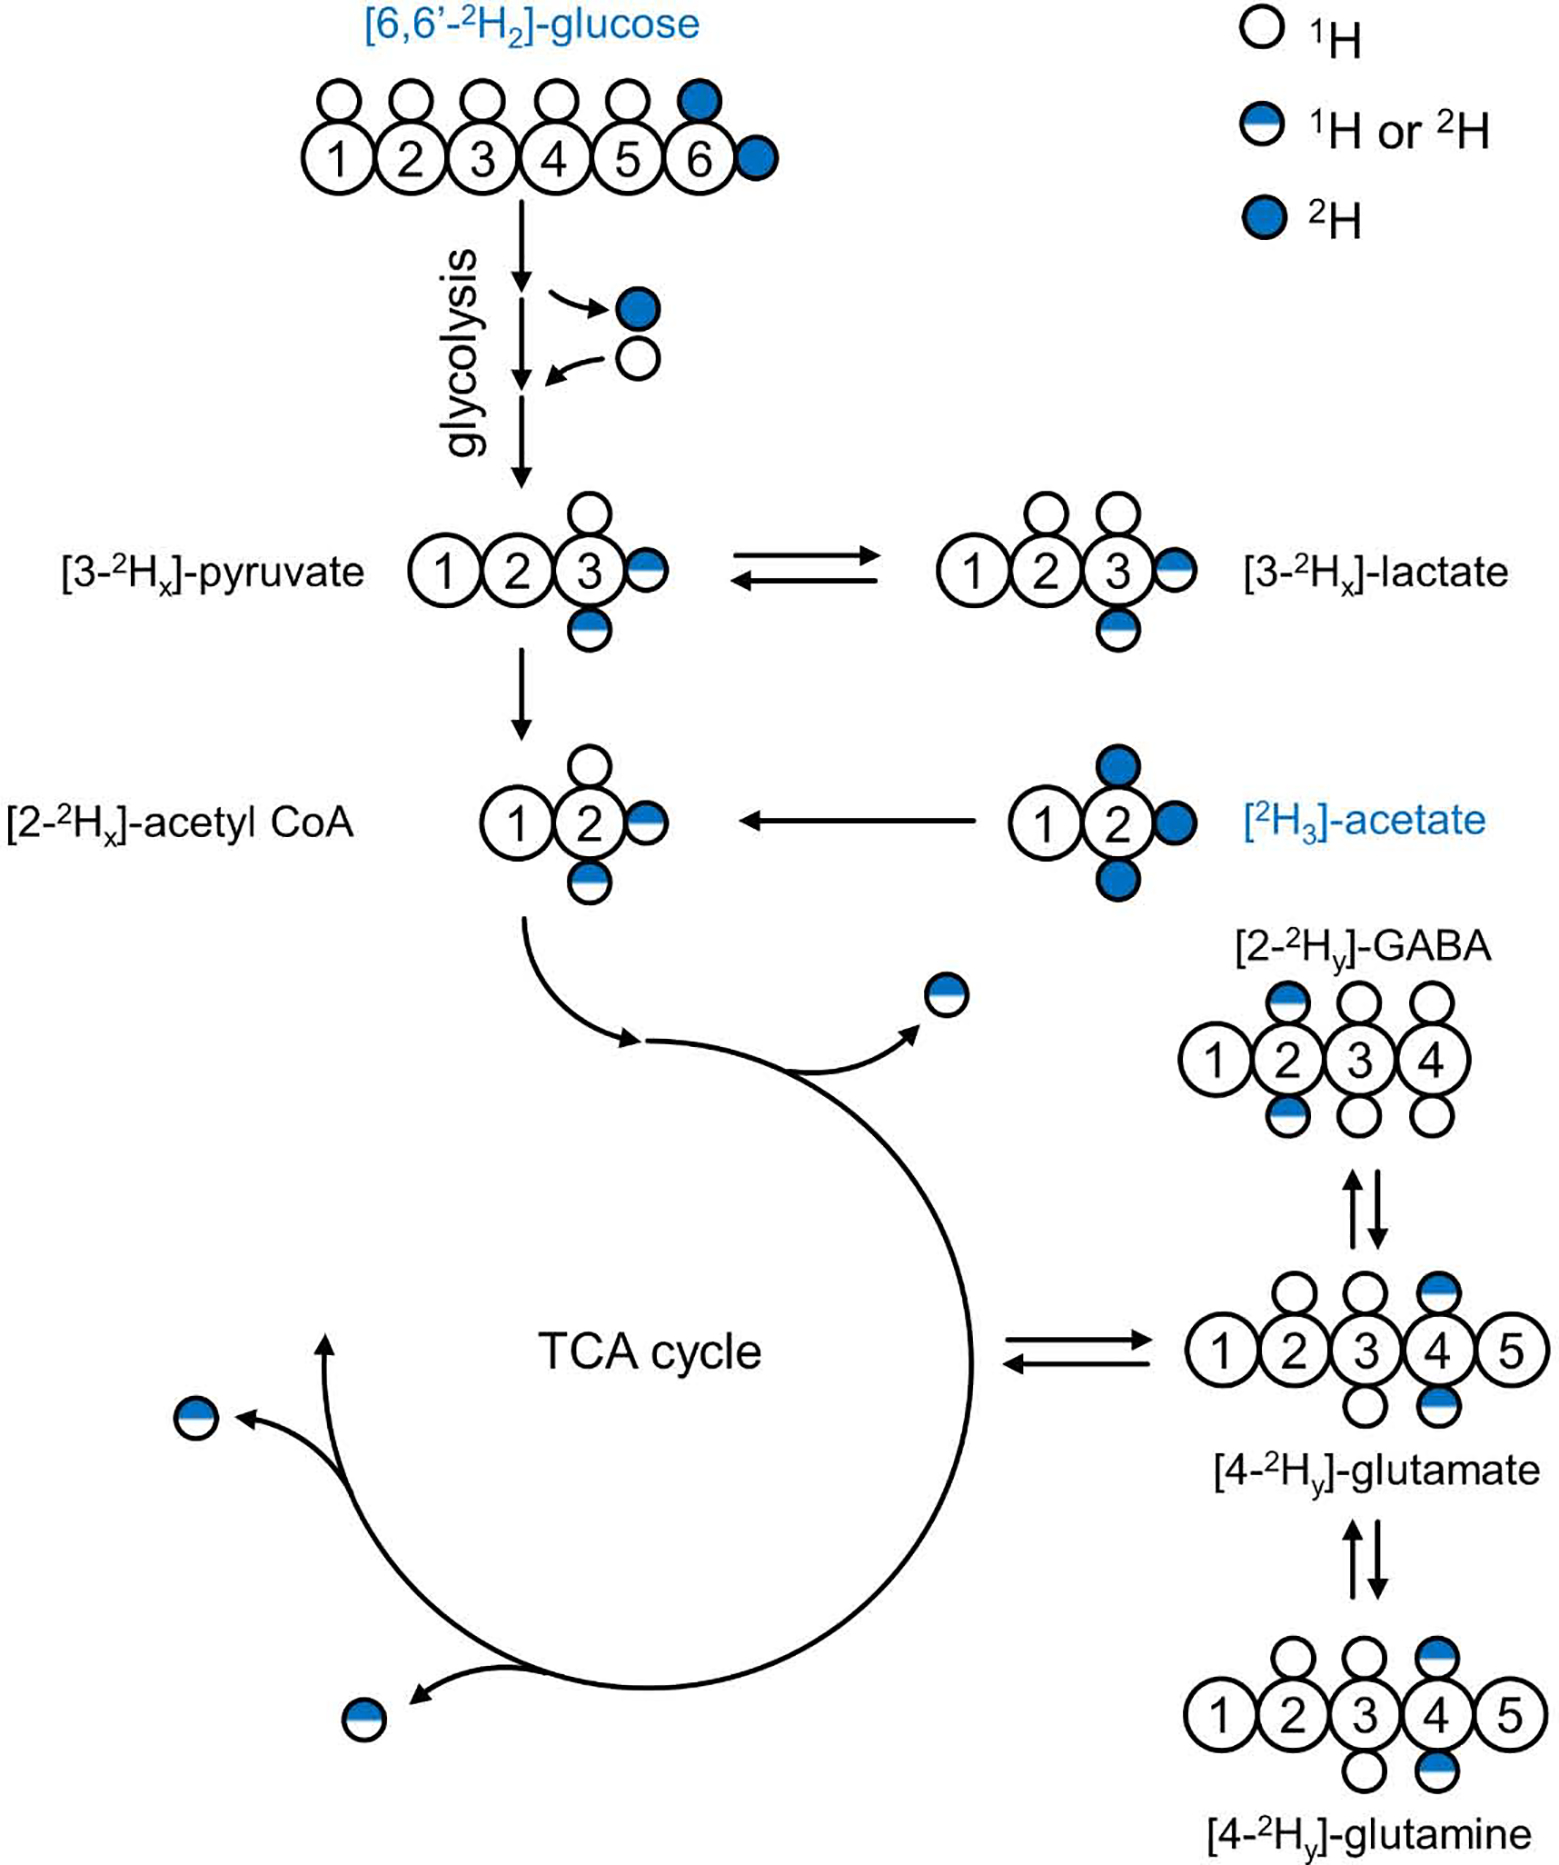
Deuterium label flow through glycolysis and the TCA cycle. Using [6,60 −2H2]-glucose as metabolic substrate results in 2H label transfer, via the glycolytic pathway, to the methyl groups of pyruvate, lactate and acetyl-CoA. Several glycolytic conversion and exchange reactions (see text for details) lead to loss of 2H label to the large, non-specific water pool, resulting in a non-stoichiometric relation between 2H-labeled substrate and product (i.e., 0 < x < 2). Following entry into the TCA cycle additional 2H label loss occurs after which the 2H label ends up in the H4/40 position of glutamate and glutamine and the H2/H20 position of GABA (0 < y < x). Continuing down the TCA cycle will lead to complete 2H label loss (see also Fig. 6). The substrate [2H3]-acetate enters the metabolic pathways at the level of acetyl-CoA, thus bypassing glycolysis and the associated 2H label losses. Note that the amount of 2H label, y, in downstream products is generally not the same when using [6,60 −2H2]-glucose or [2H3]-acetate as substrate.
Fig. 6.
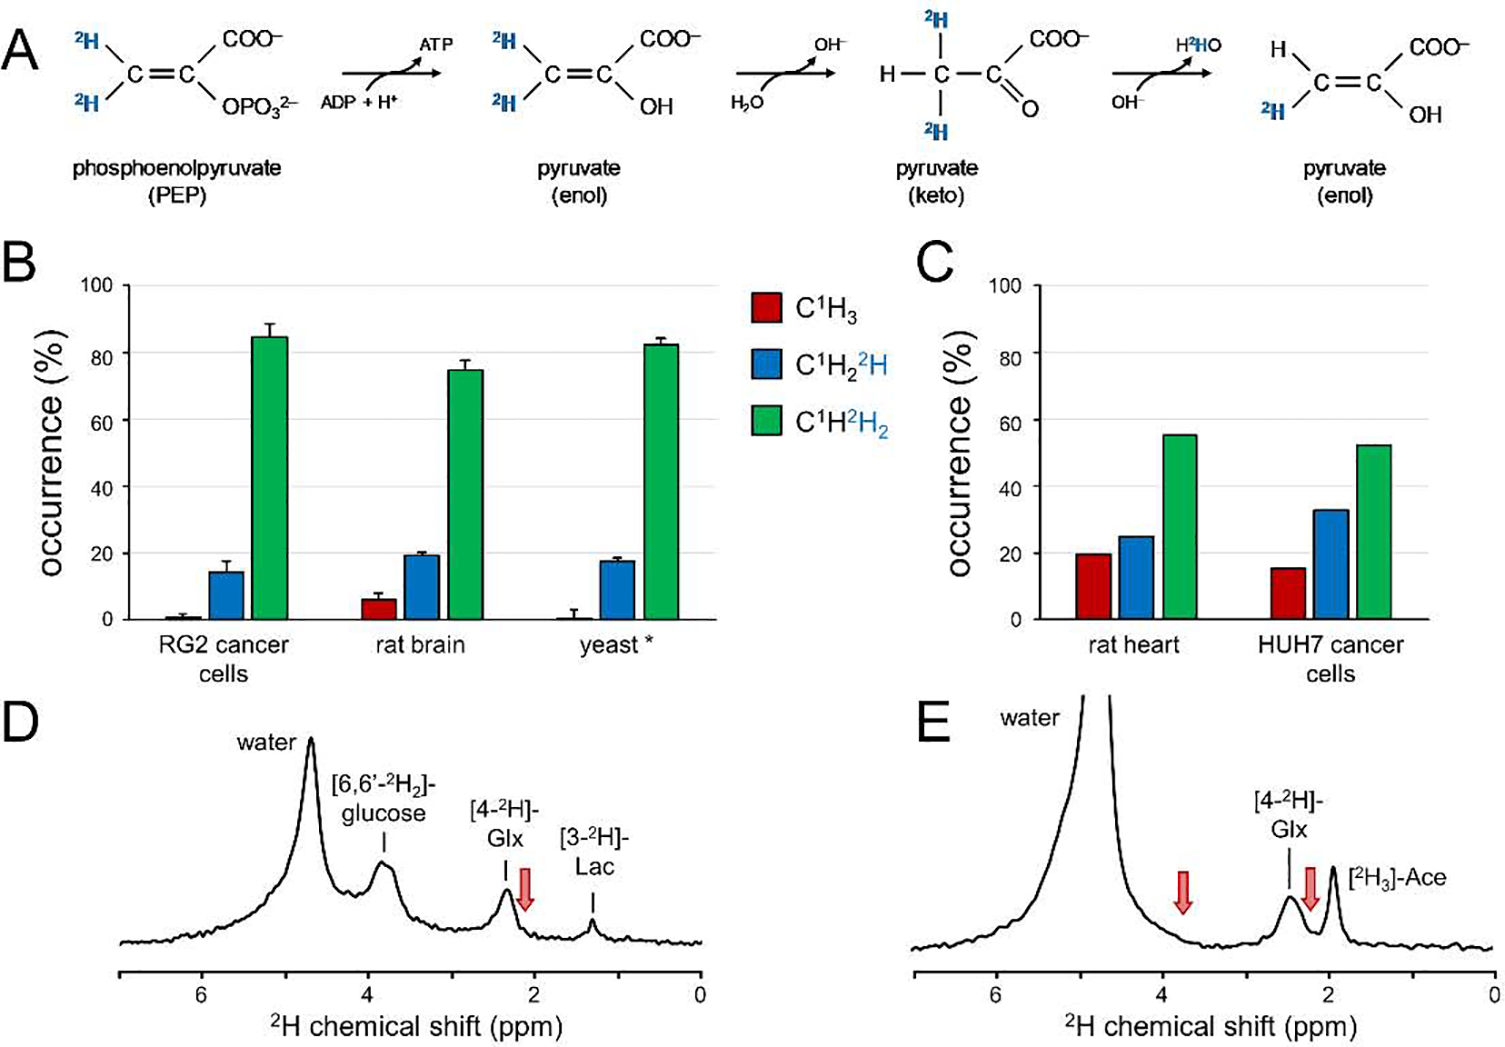
Deuterium label loss in 2H isotope labeling studies. (A) 2H label loss due to enol-keto tautomerism of pyruvate. (B, C) 2H label distribution in lactate of different organisms when using (B) [6,60 −2H2]-glucose or (C) [U-2H7]-glucose as metabolic substrate. * The 2H label distribution in yeast reflects that in the methyl group of ethanol, the product of anaerobic glycolysis during fermentation. See text for details and references. (D, E) Global 2H MR spectra (TR 333 ms, 180 averages, 11.7 T) of rat brain in vivo 90 min following the intravenous infusion of (D) [6,60 −2H2]-glucose or (E) [2H3]-acetate (Ace). 2H label accumulates primarily in the H4/H40 position of glutamate and glutamine with a clear absence of labeling in the glutamate + glutamine H3/H30 (at ~ 2.1 ppm) and H2 (at ~ 3.7 ppm) positions (red arrows). Note that the water signal is substantially higher in (E) since a typical [2H3]-acetate infusion delivers circa three times more 2H label to the animal as compared to a [6,60 −2H2]-glucose study. (For interpretation of the references to colour in this figure legend, the reader is referred to the web version of this article.)
Accumulation of 2H label in Glx (Fig. 1) is direct experimental evidence that at least part of the 2H label is retained during the first four steps of the TCA cycle, from acetyl-CoA to α-ketoglutarate. Part of the 2H label is lost during the conversion from citrate to cis-aconitate with further losses linked to the conversion from iso-citrate to α-ketoglutarate. Further downstream in the TCA cycle, 2H label losses continue to accumulate, leading to a complete elimination of 2H label at the beginning of the second turn of the TCA cycle. Unlike 13C NMR where continued label accumulation in subsequent turns of the TCA cycle leads to 13C-13C isotopomers with labeling in adjacent carbon positions, 2H label does not appear in positions other than the C4 position of Glx (Fig. 6D/E). The C2 position of Glx is never deuterated since the precursor, α-ketoglutarate, is proton-free in the corresponding position. Similarly, the C3 position of Glx is unable to receive deuterons since the TCA cycle intermediates citrate and cis-aconitate are proton-free in that position. The lack of labeling in the C2 and C3 positions of Glx excludes the use of DMI in the study of certain metabolic pathways, such as pyruvate carboxylation during astroglial anaplerosis.
Deuterium-based metabolic studies can be performed dynamically to capture the time-dependent incorporation of 2H label into a range of downstream metabolites or be performed once metabolic steady-state has been achieved. A steady-state measurement provides insight into the presence of active metabolic pathways, whereas a dynamic measurement can also provide the metabolic flux through those pathways. Whereas a dynamic study provides a higher information content and inherently includes the steady-state measurement, it is accompanied by increased DMI acquisition and processing demands, increased logistical complexity and potentially reduced subject compliance. The acquisition of dynamic DMI data automatically means that spatial resolution needs to be traded for increased time resolution, leading to reduced spatial resolution and increased partial volume effects. Extracting metabolic fluxes from the dynamic data requires a quantitative metabolic model that includes 2H label losses for the 2H-labeled substrate and products under investigation. While research is now appearing to establish 2H label loss for several substrates and organisms (e.g., Fig. 5), more research is needed to verify that 2H label losses are pathway-specific, independent of the organism or condition. Dynamic studies are logistically more complex due to the need for additional personnel and equipment to achieve intravenous substrate infusion and blood sampling. While oral substrate administration can be used, an optimized intravenous infusion that achieves a rapid increase in blood substrate concentration and enrichment will lead to the most accurate metabolic flux determination (70). Blood sampling is typically required to ensure safe and stable blood substrate levels and to characterize the arterial input function for quantitative metabolic modeling. Since metabolic flux determinations need to span both the dynamic and steady-state periods of 2H label accumulation, a dynamic DMI scan would generally be longer and challenge patient compliance more than a steady-state DMI scan. While the determination of absolute metabolic fluxes has intrinsic value, it seems likely that practicality favors a steady-state measurement with oral glucose administration in clinical settings.
DMI can utilize a large number of 2H-labeled substrates to probe a wide range of metabolic processes. Deuterated glucose, acetate, choline and methionine have previously been used to probe in vivo metabolism. The metabolic substrates used for conventional and hyperpolarized 13C MR studies can, with some caveats, also be used for DMI. The main considerations in switching from 13C to 2H are (1) retention of the 2H label and (2) spectral resolution to separate signals from substrate and metabolic products. For example, [2-13C]-glucose has been used as a substrate to study the flux through anaplerosis. The corresponding deuterated analog, [2-2H]-glucose, is unsuitable for this purpose as all deuterons in the C2 through C5 positions of glucose are lost during glycolysis. 2H9-choline provides a strong singlet resonance that is readily detectable with 2H MR methods. Unfortunately, the small 2H chemical shift dispersion does not allow the in vivo separation of 2H9-choline and signals originating from possible metabolic products, including phosphocholine and glycerophosphocholine. However, despite these limitations it seems likely that new compounds will continue to be explored given the availability of affordable and biologically relevant deuterated substrates.
Perspective and conclusion
In the era of personalized medicine, it becomes increasingly important to utilize non-invasive imaging methods that are tailored to specific diseases and pathologies and to support the customized treatment for an individual. The power and flexibility of MRI provides an excellent starting point as it can be sensitized to a wide range of physiological relevant parameters, like perfusion, diffusion and oxygenation. It is becoming increasingly clear that in a number of pathologies early changes, as well as therapeutic interventions, are reflected in metabolism. Whereas the sensitivity of MRI towards metabolic processes is low, there are a number of MR-based metabolic imaging methods that have shown potential to fill this opportunity. Unfortunately, low MR sensitivity and technical complexity have prevented MR-based metabolic imaging from reaching the status of a clinically viable technique that is comparable to FDG-PET.
Deuterium metabolic imaging or DMI is ‘the new kid on the block’ in the world of MR-based metabolic imaging. Unlike previous MR methods, DMI has a number of intrinsic characteristics that immediately puts it ahead of other metabolic imaging methods. First and foremost, DMI utilizes simple MR methods that makes it intrinsically robust and independent of MR operator expertise. The robustness is further enhanced by the absence of water and lipid suppression. The low gyromagnetic ratio in combination with the sparsity of the MR spectrum makes DMI minimally impacted by magnetic field inhomogeneity. Finally, the favorable T1 and T2 relaxation times afford high sensitivity while retaining a sufficiently high spectral resolution.
As with all other metabolic imaging methods, DMI has demonstrated good preliminary data (Fig. 1) in a clinically relevant setting. While this is certainly the first step towards becoming a clinically viable method, DMI still has many technological and clinical hurdles to overcome. Most important is to find and define applications and/or pathologies for which the information provided by DMI adds significant value for the clinical decision making process. While it is too early to hone in on specific applications, areas for which DMI is likely to provide novel information include cancer, diabetes, neurological diseases and essentially any pathology with a metabolic component. Illustrating DMI’s clinical potential will require the collaboration of researchers, clinicians, and ideally also industry partners to make the method available clinically. MR systems will need to be equipped with non-proton amplifiers and 1H/X RF coils. While this is largely a monetary, non-technical hurdle, it has prevented many other non-proton MR methods from being implemented on clinical MR scanners. Compared to the extensive infrastructure required for routine FDG-PET, implementing DMI on clinical scanners appears trivial. Offering DMI capabilities on clinical scanners would certainly increase the speed at which the true value of DMI for different applications can be established. Research-focused sites can and will continue to improve the methods and explore various applications. But if clinicians have no access to the technology, DMI will remain a research-specific method only.
While a direct DMI / FDG-PET comparison has not been reported yet, the information content of DMI using [6,6’−2H2]-glucose is at least similar, but likely more detailed than FDG-PET. In combination with an appropriate metabolic model, the appearance of [6,6’−2H2]-glucose in the tissue under investigation is indicative of glucose transport, whereas formation of downstream 2H-labeled metabolic products (e.g., glutamate, lactate) provides additional information of glucose metabolism. The choice of DMI over FDG-PET will likely come down to availability, practicality and specific applications. While PET is relatively common, it is not as widespread as MRI so that in many hospital settings DMI may be the only available option. In addition, FDG-PET provides relatively low contrast for brain tumors due to the high normal glucose uptake in surrounding brain tissue. DMI provides high-contrast metabolic images in brain (Fig. 1) due to its ability to detect specific downstream metabolites. Yet, in tissues without high background glucose uptake, FDG-PET will normally outperform DMI for detection of small lesions. Other substrates than glucose (e.g., acetate, choline) can also be used. These substrates are also available as a PET imaging agent, but often rely on the short-lived 11C, which require an on-site cyclotron. The currently commercially available 2H-labeled substrates, combined with the possibility of detecting downstream metabolites expand the opportunity for finding unique metabolic markers specific for a given condition, using DMI.
If DMI does not reach the status of a clinical method, it is likely that DMI will become an important metabolic imaging method in basic and clinical research. Areas that require further technical exploration include optimization of the temporal, spatial and spectral resolution of DMI, combining DMI with other MR-based metabolic imaging methods and extending the number of deuterated substrates of interest. Due to the favorable magnetic field dependence, DMI has the potential to excel at 7 T without the many complications that accompany proton MR at high field. The additional or complementary information content that DMI provides compared to a standard 1H MRSI is still an open question. While it is likely that DMI will provide complementary information, DMI still has the advantage of technical robustness even when the information content would be comparable. Whereas this review has largely focused on deuterated glucose as metabolic substrate, DMI can be combined with a wide range of affordable deuterated substrates that include acetate, choline, methionine and potentially ketone bodies as well.
The characteristics of 2H have been known since the early days of NMR. Yet, despite the widespread use of 2H as a label for metabolic studies, the concept of combining 2H-labeled substrates with in vivo MRS(I) has only recently started to generate significant interest. With several groups further investigating basic aspects of deuterium’s use, as well as ongoing efforts to explore (pre)-clinical applications of metabolic imaging, the future of DMI looks very bright.
The promise of deuterium as a metabolic tracer was recognized soon after the discovery of chemical isotopes.
Deuterium NMR has only seen sporadic applications due to apparent downsides related to relaxation and resolution.
The short relaxation times, low natural abundance and sparsity of the spectra are advantages for in vivo deuterium NMR.
Deuterium metabolic imaging (DMI) is a robust method to map metabolism of deuterated substrates non-invasively in 3D.
Acknowledgements
We like to thank Kevin Behar, Zachary Corbin, Graeme Mason and Douglas Rothman for stimulating discussions. Monique Thomas is thanked for her assistance with sample preparations. This work was funded in part by NIH grant R01-EB025840.
Footnotes
Declaration of interests
The authors declare that they have no known competing financial interests or personal relationships that could have appeared to influence the work reported in this paper.
Publisher's Disclaimer: This is a PDF file of an unedited manuscript that has been accepted for publication. As a service to our customers we are providing this early version of the manuscript. The manuscript will undergo copyediting, typesetting, and review of the resulting proof before it is published in its final form. Please note that during the production process errors may be discovered which could affect the content, and all legal disclaimers that apply to the journal pertain.
References
- 1.Maudsley AA, Andronesi OC, Barker PB, Bizzi A, Bogner W, Henning A, Nelson SJ, Posse S, Shungu DC, Soher BJ. Advanced magnetic resonance spectroscopic neuroimaging: Experts’ consensus recommendations. NMR Biomed 2020:e4309. [DOI] [PMC free article] [PubMed] [Google Scholar]
- 2.Rothman DL, de Graaf RA, Hyder F, Mason GF, Behar KL, De Feyter HM. In vivo 13C and 1H-[13C] MRS studies of neuroenergetics and neurotransmitter cycling, applications to neurological and psychiatric disease and brain cancer. NMR Biomed 2019;32(10):e4172. [DOI] [PubMed] [Google Scholar]
- 3.Nelson SJ, Kurhanewicz J, Vigneron DB, Larson PE, Harzstark AL, Ferrone M, van Criekinge M, Chang JW, Bok R, Park I, Reed G, Carvajal L, Small EJ, Munster P, Weinberg VK, Ardenkjaer-Larsen JH, Chen AP, Hurd RE, Odegardstuen LI, Robb FJ, Tropp J, Murray JA. Metabolic imaging of patients with prostate cancer using hyperpolarized [1-13C]pyruvate. Science translational medicine 2013;5:198ra108. [DOI] [PMC free article] [PubMed] [Google Scholar]
- 4.Lu M, Zhu XH, Zhang Y, Mateescu G, Chen W. Quantitative assessment of brain glucose metabolic rates using in vivo deuterium magnetic resonance spectroscopy. J Cereb Blood Flow Metab 2017;37:3518–3530. [DOI] [PMC free article] [PubMed] [Google Scholar]
- 5.De Feyter HM, Behar KL, Corbin ZA, Fulbright RK, Brown PB, McIntyre S, Nixon TW, Rothman DL, de Graaf RA. Deuterium metabolic imaging (DMI) for MRI-based 3D mapping of metabolism in vivo. Sci Adv 2018;4(8):eaat7314. [DOI] [PMC free article] [PubMed] [Google Scholar]
- 6.Urey HC, Brickwedde FG, Murphy GM. A hydrogen isotope of mass 2 and its concentration. Phys Rev 1932;40:1–15. [Google Scholar]
- 7.Schoenheimer R, Rittenberg D. Deuterium as an indicator in the study of intermediary metabolism. Science 1935;82:156–157. [DOI] [PubMed] [Google Scholar]
- 8.Schoenheimer R, Rittenberg D. Deuterium as an indicator in the study of intermediary metabolism I-XI. J Biol Chem 1935;111:163–168. [DOI] [PubMed] [Google Scholar]
- 9.Schoenheimer R, Rittenberg D. The application of isotopes to the study of intermediary metabolism. Science 1938;87:221–226. [DOI] [PubMed] [Google Scholar]
- 10.Kellogg JMB, Rabi II, Ramsey NF, Zacharias JR. The magnetic moments of the proton and the deuteron. The radiofrequency spectrum of H2 in various magnetic fields. Phys Rev 1939;56:728–743. [Google Scholar]
- 11.Bloch F, Hansen WW, Packard ME. Nuclear induction. Phys Rev 1946;69:127. [Google Scholar]
- 12.Purcell EM, Torrey HC, Pound RV. Resonance absorption by nuclear magnetic moments in a solid. Phys Rev 1946;69:37–38. [Google Scholar]
- 13.Bloembergen N, Purcell EM, Pound RV. Relaxation effects in nuclear magnetic resonance absorption. Phys Rev 1948;73:679–712. [Google Scholar]
- 14.Mantsch HH, Saito H, Smith ICP. Deuterium magnetic resonance, applications in chemistry, physics and biology. Prog NMR Spectroscopy 1977;11:211–271. [Google Scholar]
- 15.Brereton IM, Irving MG, Field J, Doddrell DM. Preliminary studies on the potential of in vivo deuterium NMR spectroscopy. Biochem Biophys Res Commun 1986;137:579–584. [DOI] [PubMed] [Google Scholar]
- 16.Brereton IM, Doddrell DM, Oakenfull SM, Moss D, Irving MG. The use of in vivo 2H NMR spectroscopy to investigate the effects of obesity and diabetes mellitus upon lipid metabolism in mice. NMR Biomed 1989;2:55–60. [DOI] [PubMed] [Google Scholar]
- 17.Ackerman JJ, Ewy CS, Becker NN, Shalwitz RA. Deuterium nuclear magnetic resonance measurements of blood flow and tissue perfusion employing 2H2O as a freely diffusible tracer. Proc Natl Acad Sci U S A 1987;84:4099–4102. [DOI] [PMC free article] [PubMed] [Google Scholar]
- 18.Ewy CS, Ackerman JJ, Balaban RS. Deuterium NMR cerebral imaging in situ. Magn Reson Med 1988;8:35–44. [DOI] [PubMed] [Google Scholar]
- 19.Muller S, Seelig J. In vivo NMR imaging of deuterium. J Magn Reson 1987;72:456–466. [Google Scholar]
- 20.Irving MG, Brereton IM, Field J, Doddrell DM. In vivo determination of body iron stores by natural-abundance deuterium magnetic resonance spectroscopy. Magn Reson Med 1987;4:88–92. [DOI] [PubMed] [Google Scholar]
- 21.London RE, Gabel SA, Funk A. Metabolism of excess methionine in the liver of intact rat: an in vivo 2H NMR study. Biochemistry 1987;26:7166–7172. [DOI] [PubMed] [Google Scholar]
- 22.London RE, Gabel SA. A deuterium surface coil NMR study of the metabolism of D-methionine in the liver of the anesthetized rat. Biochemistry 1988;27:7864–7869. [DOI] [PubMed] [Google Scholar]
- 23.Eng J, Berkowitz BA, Balaban RS. Renal distribution and metabolism of [2H9]choline. A 2H NMR and MRI study. NMR Biomed 1990;3:173–177. [DOI] [PubMed] [Google Scholar]
- 24.Katz-Brull R, Margalit R, Bendel P, Degani H. Choline metabolism in breast cancer; 2H-, 13C- and 31P-NMR studies of cells and tumors. MAGMA 1998;6:44–52. [DOI] [PubMed] [Google Scholar]
- 25.London RE. In vivo2H NMR studies of cellular metabolism. In: Berliner LJ, Reuben J, editors. Biological Magnetic Resonance, Volume 11: In Vivo Spectroscopy. New York: Plenum Press; 1992. p 277–306. [Google Scholar]
- 26.Barrow KD, Rogers PL, Smith GM. NMR studies of [1-2H]glucose metabolism in Zymomonas mobilis. Eur J Biochem 1986;157:195–202. [DOI] [PubMed] [Google Scholar]
- 27.Aguayo JB, Gamcsik MP, Dick JD. High resolution deuterium NMR studies of bacterial metabolism. J Biol Chem 1988;263:19552–19557. [PubMed] [Google Scholar]
- 28.Aguayo JB, McLennan IJ, Aguiar E, Cheng HM. The study of diabetic cataractogenesis in the intact rabbit lens by deuterium NMR spectroscopy. Biochem Biophys Res Commun 1987;142:359–366. [DOI] [PubMed] [Google Scholar]
- 29.Aguayo JB, McLennan IJ, Graham C Jr., Cheng HM. Dynamic monitoring of corneal carbohydrate metabolism using high-resolution deuterium NMR spectroscopy. Exp Eye Res 1988;47:337–343. [DOI] [PubMed] [Google Scholar]
- 30.Berkowitz BA, Garner MH, Wilson CA, Corbett RJ. Nondestructive measurement of retinal glucose transport and consumption in vivo using NMR spectroscopy. J Neurochem 1995;64:2325–2331. [DOI] [PubMed] [Google Scholar]
- 31.Goodman MN, Masuoka LK, deRopp JS, Jones AD. Use of deuterium labelled glucose in evaluating the pathway of hepatic glycogen synthesis. Biochem Biophys Res Commun 1989;159:522–527. [DOI] [PubMed] [Google Scholar]
- 32.Hotchkiss RS, Song SK, Ling CS, Ackerman JJ, Karl IE. Sepsis does not alter red blood cell glucose metabolism or Na+ concentration: a 2H-, 23Na-NMR study. Am J Physiol 1990;258:R21–31. [DOI] [PubMed] [Google Scholar]
- 33.Ben-Yoseph O, Kingsley PB, Ross BD. Metabolic loss of deuterium from isotopically labeled glucose. Magn Reson Med 1994;32:405–409. [DOI] [PubMed] [Google Scholar]
- 34.Mateescu GD, Ye A, Flask CA, Erokwu B, Duerk JL. In vivo assessment of oxygen consumption via Deuterium Magnetic Resonance. Adv Exp Med Biol 2011;701:193–199. [DOI] [PubMed] [Google Scholar]
- 35.de Graaf RA, Hendriks AD, Klomp DWJ, Kumaragamage C, Welting D, Arteaga de Castro CS, Brown PB, McIntyre S, Nixon TW, Prompers JJ, De Feyter HM. On the magnetic field dependence of deuterium metabolic imaging. NMR Biomed 2020;33:e4235. [DOI] [PMC free article] [PubMed] [Google Scholar]
- 36.Kreis F, Wright AJ, Hesse F, Fala M, Hu DE, Brindle KM. Measuring tumor glycolytic flux in vivo by using fast deuterium MRI. Radiology 2020;294:289–296. [DOI] [PubMed] [Google Scholar]
- 37.Riis-Vestergaard MJ, Laustsen C, Mariager C, Schulte RF, Pedersen SB, Richelsen B. Glucose metabolism in brown adipose tissue determined by deuterium metabolic imaging in rats. Int J Obes (Lond) 2020;44:1417–1427. [DOI] [PubMed] [Google Scholar]
- 38.Ye A, Erokwu B, Twieg M, Flask CA, Mateescu G. New in vivo glucose test by localized dynamic deuterium nuclear magnetic resonance. Rev Roum Chim 2020;65:39–42. [Google Scholar]
- 39.Mahar R, Donabedian PL, Merritt ME. HDO production from [2H7]glucose quantitatively identifies Warburg metabolism. Sci Rep 2020;10:8885. [DOI] [PMC free article] [PubMed] [Google Scholar]
- 40.Rich LJ, Bagga P, Wilson NE, Schnall MD, Detre JA, Haris M, Reddy R. 1H magnetic resonance spectroscopy of 2H-to-1H exchange quantifies the dynamics of cellular metabolism in vivo. Nat Biomed Eng 2020;4:335–342. [DOI] [PMC free article] [PubMed] [Google Scholar]
- 41.von Morze C, Engelbach JA, Blazey T, Quirk JD, Reed GD, Ippolito JE, Garbow JR. Comparison of hyperpolarized 13C and non-hyperpolarized deuterium MRI approaches for imaging cerebral glucose metabolism at 4.7 T. Magn Reson Med 2020. [DOI] [PMC free article] [PubMed] [Google Scholar]
- 42.Straathof M, Meerwaldt AE, De Feyter HM, de Graaf RA, Dijkhuizen RM. Deuterium metabolic imaging of the healthy and diseased brain. Neuroscience 2021. [DOI] [PMC free article] [PubMed] [Google Scholar]
- 43.Abragam A The Principles of Nuclear Magnetism. London: Oxford University Press; 1961. [Google Scholar]
- 44.de Graaf RA. In Vivo NMR Spectroscopy. Principles and Techniques. Chichester: John Wiley; 2019. [Google Scholar]
- 45.Zhu X, Merkle H, Kwag J, Ugurbil K, Chen W. 17O relaxation time and NMR sensitivity of cerebral water and their field dependence. Magn Reson Med 2001;45:543–549. [DOI] [PubMed] [Google Scholar]
- 46.Diehl P, Leipert T. Deuteronen-KernResonanzspektroskopie. Helv Chim Acta 1964;47:545–557. [Google Scholar]
- 47.Gunnarsson G, Wennerstrom H, Egan W, Forsen S. Proton and deuterium NMR of hydrogen bonds: relationship between isotope effects and the hydrogen bond potential. Chem Phys Lett 1976;38:96–99. [Google Scholar]
- 48.Perrin CL, Dong Y. Secondary deuterium isotope effects on the acidity of carboxylic acids and phenols. J Am Chem Soc 2007;129:4490–4497. [DOI] [PubMed] [Google Scholar]
- 49.Hagemann R, Nief G, Roth E. Absolute isotopic scale for deuterium analysis of natural waters. Absolute D/H ratio for SMOW. Tellus 1970;22:712–715. [Google Scholar]
- 50.Rosman KJR, Taylor PDP. Isotopic compositions of the elements 1997. Pure Appl Chem 1998;70:217–235. [Google Scholar]
- 51.Harris RK, Becker ED, Cabral de Menezes SM, Goodfellow R, Granger P. NMR nomenclature: nuclear spin properties and conventions for chemical shifts. IUPAC recommendations 2001. Pure Appl Chem 2001;73:1795–1818. [DOI] [PubMed] [Google Scholar]
- 52.Jones JG, Merritt M, Malloy C. Quantifying tracer levels of 2H2O enrichment from microliter amounts of plasma and urine by 2H NMR. Magn Reson Med 2001;45:156–158. [DOI] [PubMed] [Google Scholar]
- 53.Péronnet F, Mignault D, du Souich P, Vergne S, Le Bellego L, Jimenez L, Rabasa-Lhoret R. Pharmacokinetic analysis of absorption, distribution and disappearance of ingested water labeled with D₂O in humans. Eur J Appl Physiol 2012;112:2213–2222. [DOI] [PMC free article] [PubMed] [Google Scholar]
- 54.van Zijl PC, Yadav NN. Chemical exchange saturation transfer (CEST): what is in a name and what isn’t? Magn Reson Med 2011;65:927–948. [DOI] [PMC free article] [PubMed] [Google Scholar]
- 55.Thomson JF. Biological effects of deuterium. Alexander P, Bacq ZM, editors. New York: The Macmillan Company; 1963. [Google Scholar]
- 56.Klein PD, Klein ER. Stable isotopes: origins and safety. J Clin Pharmacol 1986;26:378–382. [DOI] [PubMed] [Google Scholar]
- 57.Jones PJ, Leatherdale ST. Stable isotopes in clinical research: safety reaffirmed. Clin Sci (Lond) 1991;80:277–280. [DOI] [PubMed] [Google Scholar]
- 58.Koletzko B, Sauerwald T, Demmelmair H. Safety of stable isotope use. Eur J Pediatr 1997;156 Suppl 1:S12–17. [DOI] [PubMed] [Google Scholar]
- 59.Davies PSW. Stable isotopes: their use and safety in human nutrition studies. Eur J Clin Nutr 2020;74:362–365. [DOI] [PMC free article] [PubMed] [Google Scholar]
- 60.Busch R, Neese RA, Awada M, Hayes GM, Hellerstein MK. Measurement of cell proliferation by heavy water labeling. Nat Protoc 2007;2:3045–3057. [DOI] [PubMed] [Google Scholar]
- 61.Decaris ML, Li KW, Emson CL, Gatmaitan M, Liu S, Wang Y, Nyangau E, Colangelo M, Angel TE, Beysen C, Cui J, Hernandez C, Lazaro L, Brenner DA, Turner SM, Hellerstein MK, Loomba R. Identifying nonalcoholic fatty liver disease patients with active fibrosis by measuring extracellular matrix remodeling rates in tissue and blood. Hepatology 2017;65:78–88. [DOI] [PMC free article] [PubMed] [Google Scholar]
- 62.Landau BR, Wahren J, Chandramouli V, Schumann WC, Ekberg K, Kalhan SC. Use of 2H2O for estimating rates of gluconeogenesis. Application to the fasted state. J Clin Invest 1995;95(1):172–178. [DOI] [PMC free article] [PubMed] [Google Scholar]
- 63.Wiberg KB. The deuterium isotope effect. Chemical reviews 1955;55:713–743. [Google Scholar]
- 64.Westheimer FH. The magnitude of the primary kinetic isotope effect for compounds of hydrogen and deuterium. Chemical reviews 1961;61:265–273. [Google Scholar]
- 65.Funk AM, Anderson BL, Wen X, Hever T, Khemtong C, Kovacs Z, Sherry AD, Malloy CR. The rate of lactate production from glucose in hearts is not altered by per-deuteration of glucose. J Magn Reson 2017;284:86–93. [DOI] [PMC free article] [PubMed] [Google Scholar]
- 66.de Graaf RA, Thomas MA, Behar KL, De Feyter HM. Characterization of kinetic isotope effects and label loss in deuterium-based isotopic labeling studies. ACS Chem Neurosci 2021;12:234–243. [DOI] [PMC free article] [PubMed] [Google Scholar]
- 67.Macallan DC, Asquith B, Zhang Y, de Lara C, Ghattas H, Defoiche J, Beverley PC. Measurement of proliferation and disappearance of rapid turnover cell populations in human studies using deuterium-labeled glucose. Nat Protoc 2009;4:1313–1327. [DOI] [PubMed] [Google Scholar]
- 68.Bier DM, Leake RD, Haymond MW, Arnold KJ, Gruenke LD, Sperling MA, Kipnis DM. Measurement of “true” glucose production rates in infancy and childhood with 6,6-dideuteroglucose. Diabetes 1977;26:1016–1023. [DOI] [PubMed] [Google Scholar]
- 69.Saur WK, Crespi HL, Halevi EA, Katz JJ. Deuterium isotope effects in the fermentation of hexoses to ethanol by Saccharomyces cerevisiae. I. Hydrogen exchange in the glycolytic pathway. Biochemistry 1968;7:3529–3536. [DOI] [PubMed] [Google Scholar]
- 70.Mason GF, Falk Petersen K, de Graaf RA, Kanamatsu T, Otsuki T, Rothman DL. A comparison of 13C NMR measurements of the rates of glutamine synthesis and the tricarboxylic acid cycle during oral and intravenous administration of [1-13C]glucose. Brain Res Brain Res Protoc 2003;10:181–190. [DOI] [PubMed] [Google Scholar]