

Abstract
Background:
An increasing body of studies has investigated that genetic polymorphisms in microRNA (miRNA) may be related to susceptibility to rheumatoid arthritis (RA) and systemic lupus erythematosus (SLE). However, some results remain controversial. Thus, a meta-analysis was embarked on assessing whether some miRNA polymorphisms are associated with the risk of RA and SLE.
Methods:
Relevant studies were acquired on PubMed, Web of Science, Cochrane Library, CNKI, and Embase electronic databases from inception to December 2019. The strength of the association of miRNA polymorphisms with the risk of RA and SLE was assessed by odds ratios (ORs) and 95% confidence intervals (CIs).
Results:
Eligible 20 articles (36 studies) involving 5 miRNAs were enrolled in the meta-analysis. For RA, the polled result showed that there was no significant relationship between miR-146a rs2910164 and RA, but subgroup analysis based on ethnicity demonstrated that CC genotype may be a genetic protect factor for RA in Caucasians (CC vs CG+GG, OR = 0.825, 95% CI: 0.684–0.996, Pz = .045, Ph = .166). Besides, statistical significance of miR-499 rs3746444 (T/C) with susceptibility to RA was observed as well in the overall population, and the association was only significant in Caucasians but not Asians. For SLE, the associations of miR-146a rs2431697 T allele/T-carrier with increased risk of SLE were observed.
Conclusions:
Our results highlight that miR-499 rs3746444 may contribute to RA susceptibility, particularly in Caucasians. In addition, CC genotype in miR-146a rs2910164 may act as a protector of RA in Caucasians. For SLE, miR-146a rs2431697 (C/T) is most likely to the increased the risk of SLE. These findings do not support the genetic association between miR-196a2 rs11614913 and RA/SLE susceptibility, as well as the association of miR-146a rs2910164, miR-146a rs57095329, miR-499 rs3746444 with SLE.
Keywords: meta-analysis, microRNA, rheumatoid arthritis, single nucleotide polymorphisms, systemic lupus erythematosus
1. Introduction
Rheumatoid arthritis (RA) and systemic lupus erythematosus (SLE) are common prevalently autoimmune diseases with a significantly higher incidence in women than men. RA is one of the most prevalent chronic inflammatory diseases characterized by damage to cartilage and bone leading to disability.[1] SLE is a prolonged autoimmune disease with intricate etiology and multi-organ system involvement, including skin, joints, kidneys, and central nerves system.[2] At present, the etiology of RA and SLE is unclear, but it has been confirmed that genetic factors were crucial in the pathogenesis and progress. Microarray analysis of microRNA (miRNA) expression in peripheral mononuclear blood cells (PBMCs) revealed that there was a difference in the expression level of miRNAs in RA[3] or SLE.[4]
miRNAs are a class of non-coding RNA molecules (19–25 length), capacity of regulating protein-encoding genes[5] by binding to the 3 ’untranslated region of the target mRNAs.[6] Previous functional studies have reported miRNA-mediated gene regulation plays an important role in normal cellular functions such as proliferation, apoptosis, differentiation, immune response, and inflammation.[7,8] It has been clarified in molecular mechanism that miRNAs have a force to be reckoned with regulating immune and inflammatory responses through the negative feedback loop of molecules downstream of Toll/interleukin-1 (il-1) receptor signaling.[9] For instance, miRNA-146a could control the expression of interleukin (IL)-1 receptor-associated kinase (IRAK1), IRAK2, and targets tumor necrosis factor (TNF) receptor-associated factor 6, which are regulators of the TNF-α signaling pathway.[10] Another miRNA-146a may represent possible mediators of oxidative stress induced by visfatin and resistin via NF-κB pathway in human synovial fibroblasts.[11] The miRNA-499 gene targets Interleukin-17 receptor B, IL-2RB, IL-6, B and T lymphocyte attenuator, and peptidyl arginine deiminase 4.[12] With the emergence of precision medicine, the role of single nucleotide polymorphism (SNP) in targeted therapy has been paid more and more attention. The association of polymorphisms in genes of miRNAs, including miR-146a (rs2910164, rs57095329, rs2431697), miR-196a2 rs11614913, miR-499 rs3746444 with the risk of RA and SLE has been widely investigated. However, current data regarding genetic predisposition was controversial. For instance, some studies demonstrated the association between miR-499 rs3746444 polymorphism and risk of RA[13] and SLE,[14] while a new case-control study drew a different conclusion with RA.[15] Thus, we reviewed the related studies and conducted a meta-analysis to verify whether 5 miRNA polymorphism confers susceptibility to SLE and RA and give a further reference for seeking optimal biomarkers and possible therapeutic targets.
2. Materials and methods
2.1. Search strategy
We independently searched for published studies indexed in PubMed, Web of Science, Cochrane Library, CNKI, and Embase databases from inception to December 2019. The keyword terms were as follows: (“miRNA OR microRNA OR microRNAs”) AND (“variant OR variants OR mutation OR polymorphism OR polymorphisms”) AND (“systemic lupus erythematosus OR rheumatoid arthritis”). Only English language publications and human subject studies were included. This meta-analysis was performed following the guidelines for the Preferred Reporting Items for Systematic Review and Meta-analysis statement. Ethical approval and patient consent were not required owing to all the results were collected from previously published studies.
2.2. Inclusion and exclusion criteria
Eligible studies were listed as:
-
1.
The association between miR-146a (rs2910164 (G/C), rs57095329 (A/G), rs2431697 (C/T)), miR-196a2 rs11614913 (C/T), miR-499 rs3746444 (T/C) and SLE or RA susceptibility was assessed;
-
2.
case-control studies only; and
-
3.
genotype distribution was provided for calculating odds ratios (ORs) and 95% confidence intervals (CIs).
The major exclusion included:
-
1.
cross-sectional studies and cohort studies
-
2.
case reports, conference papers, abstracts, meta-analysis, review and editorial;
-
3.
insufficient data; and
-
4.
duplicate publications.
2.3. Data extraction
Based on each eligible literature, we used standardized forms and manual checks to evaluate and extract the original data, then, recorded contained the following aspects: first author, year of publication, country of origin, ethnicity, control source, number of cases and controls, genotyping method, genotype distributions. Studies were evaluated for eligibility based on a presuppose set of criteria. And any data discrepancy was resolved by backing up the original article and further discussion to reach a consensus.
2.4. Quality assessment
The quality of a single study was independently assessed by each investigator by using the Newcastle–Ottawa Scale (NOS).[16] The NOS has a ranking from zero to 9, and the score of more than 7 are considered high quality. Any discrepancy was resolved by mutual consensus.
2.5. Statistical analysis
The strength of association between miRNA-SNPs and 2 autoimmune diseases (RA and SLE) susceptibility was analyzed assuming allelic, homozygote, dominant, and recessive models. The heterogeneity in these studies was quantified by using Cochran's Q statistic and I2 test.[17] When P value >.10 and I2 < 50%, a fixed-effect model was selected (the Mantel-Haenszel method), otherwise a random-effect model was adopted (DerSimonian and Laird method). The Hardy–Weinberg Equilibrium (HWE) was tested for each study by Chi-square test in control groups, and P value <.05 was considered to not comply with HWE.
Stratified comparisons based on the disease were performed to further explore the potential heterogeneity according to controls in HWE, ethnicity, genotyping method, control source, quality score of studies. Galbraith plot was utilized to further determine the source of the heterogeneity. Sensitivity analysis was conducted to assess the impact of a single study on the overall results by sequentially deleting one study at a time. Begger Funnel plot and Egger test were used to evaluate the potential publication bias. All statistical analysis was performed by Stata software package version 12.0 (Stata Corporation, College Station, TX, USA) and Meta Genyo, a web tool for meta-analysis in genetic association studies.[18]
3. Results
3.1. Study characteristics
We retrieved 287 publications from PubMed, Web of Science, Cochrane Library, CNKI, and Embase databases. After a primary filtrate, 162 duplicated articles were excluded. After selection of studies based on title and abstract review, 89 of 125 publications were excluded, 36 remained for the full review. Finally, 20 eligible articles were included in our research. The process of study selection was shown in Figure 1. Among the 20 articles that were included in the meta-analysis, there were 5 microRNA-SNPs: miR-146a (rs2910164, rs57095329, rs2431697), miR-196a2 rs11614913, miR-499 rs3746444, and 2 autoimmune disorders (RA and SLE). Namely, there were 18 studies on miR-146a rs2910164 (G/C) (including: 13 following RA,[12,13,19–28] 5 following SLE,[14,21,25,29,30]) 1 study on miR-146a rs57095329 (A/G) focusing on SLE,[30] 2 study on miR-146a rs2431697 (C/T) focusing on SLE,[30,31] 12 studies on miR-499 rs3746444 (T/C) (including:10 focusing on RA,[12,13,15,19,21,24,26,32–34] 2 focusing on SLE[14,21]), 3 studies on miR-196a2 rs11614913 (C/T) (including: 2 focusing on RA,[21,33] 1 focusing on SLE[21]). All studies recruited in this meta-analysis met the HWE except 3 studies by El-Shal et al, Toraih et al, and Hashemi et al.[12,24,33] After excluding one that did not conform to HWE expectations, the results remain stable. The basic characteristics of the included studies were summarized in Table 1.
Figure 1.
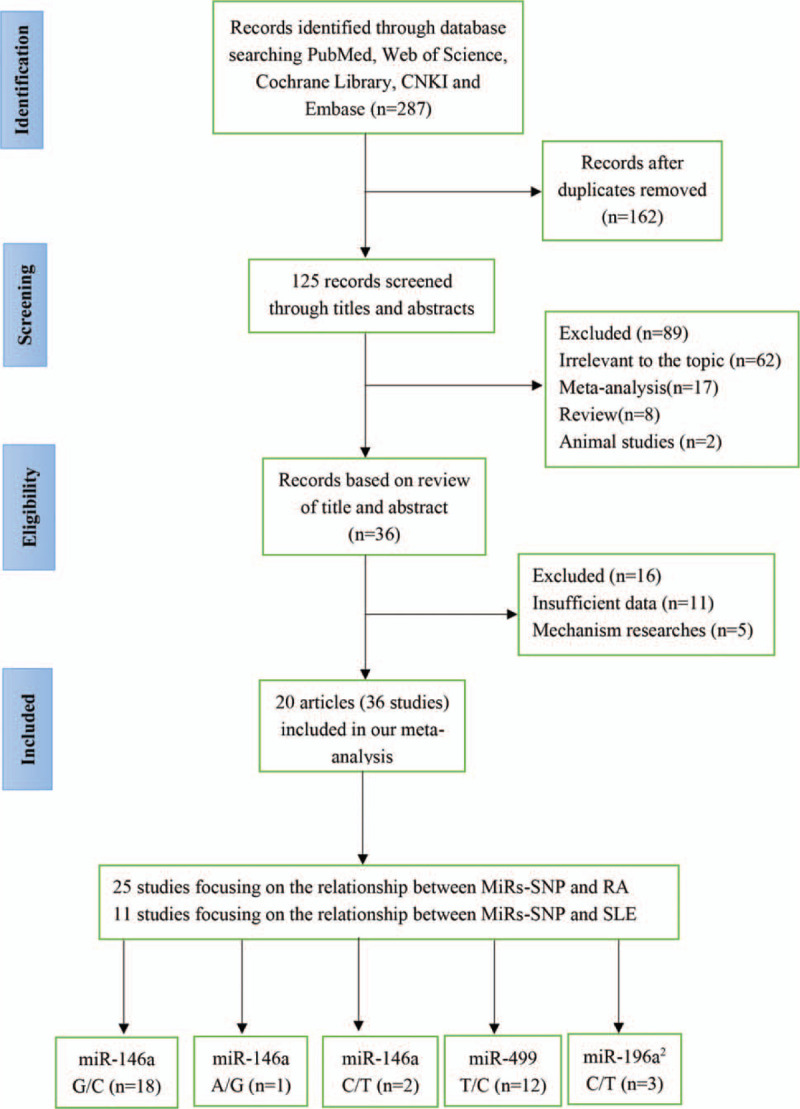
Flow chart of the study selection process.
Table 1.
Main characteristics of studies included in the current meta-analysis.
| Study name | Country | Ethnicity | Disease | Control source | Genotyping method | Sample size | HWE | Quality score |
| miR-146a rs2910164 (G/C) | ||||||||
| Shakera (2018) | Egypt | Caucasian | RA | HB | TaqMan | 104/112 | 0.122 | 8 |
| Ayeldeen (2018) | Egypt | Caucasian | RA | PB | RT-PCR | 52/56 | 0.274 | 8 |
| Alemán-ávila (2017) | Mexico | Caucasian | RA | PB | Sequence | 410/486 | 0.328 | 5 |
| Hassine (2017) | Tunisia | Caucasian | RA | PB | PCR-RFLP | 165/150 | 0.441 | 8 |
| Ciccacci (2016) | Italy | Caucasian | RA | PB | TaqMan | 192/278 | 0.836 | 8 |
| Bogunia-Kubik (2016) | Poland | Caucasian | RA | HB | PCR–RFLP | 111/130 | 0.361 | 5 |
| Zhou (2015) | China | Asian | RA | HB | MALDI-TOF MS | 598/821 | 0.296 | 8 |
| El-Shal (2013) | Egypt | Caucasian | RA | PB | PCR-RFLP | 217/245 | 0.021 | 8 |
| Hashemi (2013) | Iran | Caucasian | RA | PB | T-ARMS-PCR | 104/110 | 0.280 | 7 |
| Qian (2012) | China | Asian | RA | HB | TaqMan | 123/220 | 0.694 | 8 |
| Jiménez-Morales (2012) | Mexico | Caucasian | RA | PB | TaqMan | 367/531 | 0.369 | 7 |
| Yang (2011) | China | Asian | RA | PB | PCR-RFLP | 208/240 | 0.529 | 8 |
| Chatzikyriakidou (2010) | Greece | Caucasian | RA | PB | PCR-RFLP | 136/147 | 0.240 | 8 |
| Labib (2019) | Egypt | Caucasian | SLE | HB | RT-PCR | 80/120 | 0.531 | 8 |
| Alemán-ávila (2017) | Mexico | Caucasian | SLE | PB | TaqMan | 407/486 | 0.328 | 5 |
| Lofgren (2012) | European | Caucasian | SLE | PB | TaqMan | 1109/1428 | 0.503 | 7 |
| Jiménez-Morales (2012) | Mexico | Caucasian | SLE | PB | TaqMan | 367/531 | 0.369 | 7 |
| Zhang (2011) | China | Asian | SLE | PB | PCR-RFLP | 213/209 | 0.268 | 7 |
| miR-146a rs57095329 (A/G) | ||||||||
| Lofgren (2012) | European | Caucasian | SLE | PB | Taqman | 1108/1410 | 0.325 | 7 |
| miR-146a rs2431697 (C/T) | ||||||||
| Tang (2015) | China | Asian | SLE | HB | PCR-RFLP | 322/353 | 0.804 | 8 |
| Lofgren (2012) | European | Caucasian | SLE | PB | TaqMan | 1104/1392 | 0.052 | 7 |
| miR-196a2 rs11614913 (C/T) | ||||||||
| Alemán-ávila (2017) | Mexico | Caucasian | RA | PB | TaqMan | 412/486 | 0.924 | 5 |
| Toraih (2016) | Egypt | Caucasian | RA | PB | TaqMan | 95/200 | 0.001 | 8 |
| Alemán-ávila (2017) | Mexico | Caucasian | SLE | PB | TaqMan | 405/486 | 0.924 | 5 |
| miR-499 rs3746444 (T/C) | ||||||||
| Shakera (2018) | Egypt | Caucasian | RA | HB | TaqMan | 104/112 | 0.839 | 8 |
| Ayeldeen (2018) | Egypt | Caucasian | RA | PB | RT-PCR | 52/56 | 0.887 | 8 |
| Alemán-ávila (2017) | Mexico | Caucasian | RA | PB | Sequence | 410/486 | 0.458 | 5 |
| Yang (2017) | China | Asian | RA | PB | TaqMan | 386/576 | 0.807 | 8 |
| Fattah (2017) | Egypt | Caucasian | RA | PB | PCR-RFLP | 100/100 | 0.742 | 8 |
| Toraih (2016) | Egypt | Caucasian | RA | PB | TaqMan | 95/200 | 0.001 | 8 |
| El-Shal (2013) | Egypt | Caucasian | RA | PB | PCR-RFLP | 217/245 | 0.841 | 8 |
| Hashemi (2013) | Iran | Caucasian | RA | PB | T-ARMS-PCR | 104/110 | 0.001 | 7 |
| Zhang (2013) | China | Asian | RA | PB | MALDI-TOF–MS | 206/466 | 0.719 | 8 |
| Yang (2011) | China | Asian | RA | PB | PCR-RFLP | 208/240 | 0.624 | 8 |
| Alemán-ávila (2017) | Mexico | Caucasian | SLE | PB | Sequence | 407/486 | 0.458 | 5 |
| Zhang (2011) | China | Asian | SLE | PB | PCR-RFLP | 213/209 | 0.214 | 7 |
3.2. Quantitative data synthesis
3.2.1. MiR-146a
A general summary of the association between miR-146a polymorphisms and RA or SLE was provided in Table 2. Specifically, the miR-146a rs2910164 (G/C) polymorphism was not related to the overall risk of RA and SLE (Fig. 2A). However, the rs2431697 T-allele and T-carrier genotypes were associated with an significantly increased risk of SLE (T vs C, OR = 1.263, 95% CI: 1.135–1.404, Pz < .001; TT vs CC, OR = 1.517, 95% CI: 1.200–1.919, Pz = .001; TC+TT vs CC, OR = 1.280, 95% CI: 1.033–1.584, Pz = .024; TT vs TC+CC, OR = 1.400, 95% CI: 1.207–1.624, Pz < .001, respectively). Besides, to assess the heterogeneity in the outcomes and draw inferences from the study, stratified analysis was also carried out on ethnicity, control source, genotyping method, and quality score (Table 2). For ethnicity, a significant association was observed between miR-146a rs2910164 (G/C) polymorphism and RA in Caucasians assuming the recessive model (CC vs CG+GG, OR = 0.825, 95% CI: 0.684–0.996, Pz = .045) (Fig. 3). Furthermore, our outcome revealed the association of miR-146a rs2910164 (G/C) polymorphism with RAin the PCR-RFLP group or quality score >7 points group.
Table 2.
Summary of overall results and subgroup for the association between the miRNAs genes polymorphisms and RA and SLE risk.
| Allelic | model | Homozygote | model | Dominant | model | Recessive | model | ||||||||
| Diseases | Subgroups | NO. | Sample size | OR (95% CI) | Pz | Ph | OR (95% CI) | Pz | Ph | OR (95% CI) | Pz | Ph | OR (95% CI) | Pz | Ph |
| miR-146a | rs2910164 (G/C) | ||||||||||||||
| RA | All studies | 13 | 2631/3526 | 0.894 (0.791–1.010) | .072 | .010 | 0.772 (0.58–1.027) | .075 | .007 | 0.858 (0.711–1.035) | .110 | .012 | 0.905 (0.795–1.029) | .127 | .249 |
| Controls in HWE | 12 | 0.913 (0.806–1.035) | .156 | .018 | 0.835 (0.634–1.099) | .199 | .029 | 0.905 (0.761–1.076) | .259 | .053 | 0.926 (0.807–1.062) | .273 | .238 | ||
| Ethnicity | |||||||||||||||
| Caucasian | 10 | 0.846 (0.714–1.003) | .054 | .004 | 0.664 (0.44–1.003) | .052 | .003 | 0.796 (0.621–1.02) | .071 | .004 | 0.825 (0.684–0.996) | .045 | .166 | ||
| Asian | 3 | 0.987 (0.874–1.115) | .835 | .863 | 0.973 (0.756–1.251) | .828 | .803 | 0.985 (0.786–1.235) | .898 | .705 | 0.982 (0.822–1.172) | .840 | .867 | ||
| Quality score | |||||||||||||||
| ≤7 points | 4 | 1.060 (0.924–1.215) | .405 | .628 | 1.147 (0.844–1.558) | .380 | .833 | 1.051 (0.878–1.258) | .587 | .464 | 1.145 (0.854–1.534) | .365 | .943 | ||
| >7points | 9 | 0.825 (0.706–0.963) | .015 | .015 | 0.629 (0.429–0.922) | .018 | .006 | 0.747 (0.573–0.972) | .030 | .017 | 0.855 (0.741–0.987) | .033 | .176 | ||
| Control source | |||||||||||||||
| PB | 9 | 0.894 (0.776–1.031) | .124 | .049 | 0.764 (0.546–1.07) | .117 | .044 | 0.842 (0.676–1.049) | .125 | .054 | 0.917 (0.767–1.096) | .960 | .415 | ||
| HB | 4 | 0.888 (0.664–1.188) | .425 | .014 | 0.771 (0.388–1.534) | .459 | .010 | 0.873 (0.555–1.374) | .557 | .133 | 0.839 (0.581–1.212) | .350 | .085 | ||
| Genotyping method | |||||||||||||||
| PCR-RFLP | 5 | 0.866 (0.749–1.002) | .053 | .157 | 0.678 (0.481–0.955) | .026 | .150 | 0.789 (0.563–1.106) | .170 | .080 | 0.874 (0.689–1.108) | .265 | .474 | ||
| other | 8 | 0.901 (0.766–1.059) | .206 | .010 | 0.817 (0.569–1.173) | .273 | .010 | 0.900 (0.715–1.133) | .371 | .029 | 0.887 (0.709–1.111) | .297 | .129 | ||
| SLE | 5 | 0.904 (0.724–1.130) | .376 | .001 | 0.784 (0.461–1.333) | .369 | .000 | 0.922 (0.732–1.162) | .490 | .027 | 0.870 (0.568–1.334) | .524 | .001 | ||
| Asia | 1 | 0.855 (0.641–1.142) | .330 | / | 0.671 (0.363–1.243) | .205 | / | 0.674 (0.381–1.193) | .176 | / | 0.913 (0.616–1.353) | .650 | / | ||
| Caucasian | 4 | 0.910 (0.699–1.184) | .480 | .000 | 0.801 (0.425–1.511) | .493 | .000 | 0.961 (0.756–1.223) | .749 | .000 | 0.836 (0.473–1.476) | .536 | .000 | ||
| rs57095329 (A/G) | |||||||||||||||
| SLE | 1 | 1.172 (0.835–1.644) | .359 | / | 6.407 (0.307–133.605) | .231 | / | 1.139 (0.806–1.611) | .461 | / | 6.374 (0.306–132.896) | .232 | / | ||
| rs2431697 (C/T) | |||||||||||||||
| SLE | 2 | 1.263 (1.135–1.404) | .000 | .294 | 1.517 (1.200–1.919) | .001 | .530 | 1.280 (1.033–1.584) | .024 | .453 | 1.400 (1.207–1.624) | .000 | .585 | ||
| miR-499 | rs3746444 (T/C) | ||||||||||||||
| RA | All studies | 10 | 1882/2591 | 1.350 (1.097–1.661) | .005 | .001 | 1.787 (1.35–2.366) | .000 | .107 | 1.331 (1.025–1.729) | .032 | .001 | 1.781 (1.362–2.328) | .000 | .460 |
| Controls in HWE | 9 | 1.414 (1.144–1.748) | 0.001 | 0.003 | 2.227 (1.604–3.092) | .000 | .339 | 1.360 (1.179–1.569) | .000 | .008 | 1.932 (1.417–2.636) | .000 | .468 | ||
| Ethnicity | |||||||||||||||
| Caucasian | 7 | 1.544 (1.207–1.976) | .001 | .010 | 2.056 (1.501–2.818) | 0.000 | 0.093 | 1.546 (1.078–2.217) | .018 | .002 | 1.983 (1.476–2.665) | .000 | .556 | ||
| Asian | 3 | 1.039 (0.863–1.251) | .686 | .351 | 1.028 (0.525–2.012) | .935 | .598 | 1.046 (0.851–1.286) | .670 | .312 | 1.027 (0.526–2.006) | .938 | .592 | ||
| Quality score | |||||||||||||||
| ≤7 points | 2 | 1.725 (0.853–3.49) | .129 | .012 | 3.780 (1.784–8.011) | .001 | .968 | 1.708 (0.796–3.663) | .169 | .023 | 3.057 (1.481–6.308) | .003 | .889 | ||
| >7points | 8 | 1.273 (1.03–1.574) | .026 | .008 | 1.585 (1.164–2.156) | .003 | .157 | 1.255 (0.936–1.683) | .129 | .002 | 1.619 (1.211–2.165) | .001 | .515 | ||
| Control source | |||||||||||||||
| PB | 9 | 1.308 (1.051–1.629) | .016 | .001 | 1.653 (1.219–2.242) | .001 | .132 | 1.295 (0.98–1.711) | .069 | .000 | 1.644 (1.226–2.204) | .001 | .530 | ||
| HB | 1 | 1.801 (1.228–2.641) | .003 | / | 3.231 (1.49–7.007) | .003 | / | 1.800 (1.002–3.234) | .049 | / | 2.667 (1.36–5.229) | .004 | / | ||
| Genotyping method | |||||||||||||||
| PCR-RFLP | 5 | 1.408 (1.04–1.906) | .027 | .134 | 1.936 (1.09–3.437) | .024 | .935 | 1.538 (0.951–2.487) | .079 | .036 | 1.544 (0.886–2.692) | .125 | .987 | ||
| other | 7 | 1.335 (1.012–1.762) | .041 | .001 | 1.858 (1.039–3.321) | .037 | .022 | 1.249 (0.908–1.719) | .172 | .003 | 1.861 (1.371–2.526) | .000 | .210 | ||
| SLE | 2 | 1.245 (0.958–1.616) | .101 | .327 | 0.897 (0.307 −2.620) | .843 | .616 | 1.306 (0.984–1.733) | .064 | .328 | 0.871 (0.300–2.531) | .799 | .602 | ||
| miR-196a2 | rs11614913 (C/T) | ||||||||||||||
| RA | 2 | 507/686 | 0.990 (0.834–1.175) | .905 | .300 | 0.649 (0.217–1.938) | .439 | .085 | 1.096 (0.863–1.392) | .454 | .574 | 0.602 (0.210–1.721) | .344 | .090 | |
| SLE | 1 | 1.021 (0.841–1.239) | .833 | / | 0.968 (0.648–1.445) | .873 | / | 0.966 (0.736–1.267) | .801 | / | 0.987 (0.683–1.426) | .946 | / | ||
Figure 2.
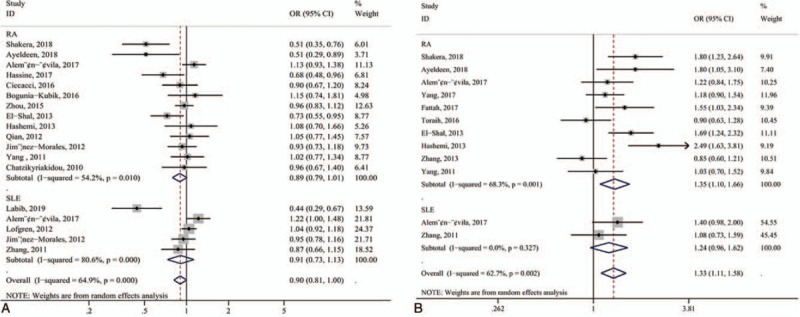
Forest plot. (A) miR-146a rs2910164 (G/C) polymorphism and risk of RA and SLE in the overall population (allelic contrast: C-allele vs G-allele); (B) miR-499 rs3746444 (T/C) polymorphism and risk of RA and SLE (allelic contrast: C-allele vs T-allele).
Figure 3.
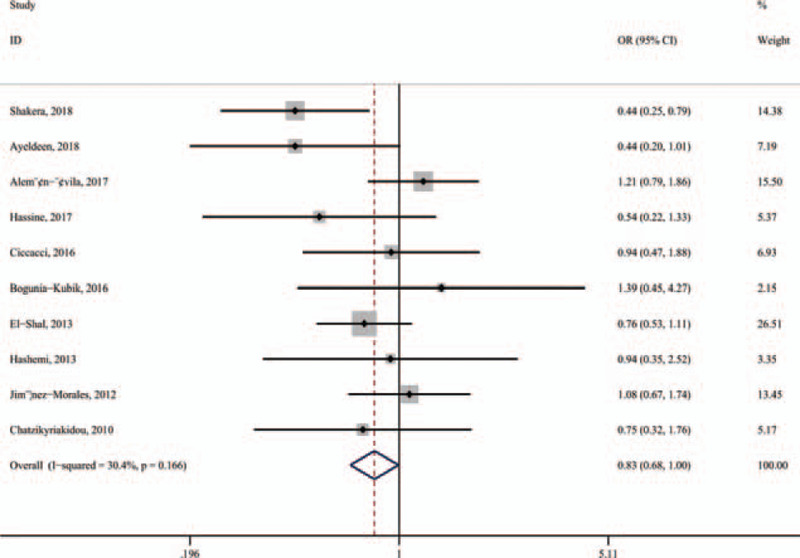
Subgroup meta-analysis was held by ethnicity for the association between miRNA-146a rs2910164 polymorphism and RA in Caucasians (recessive model: CC vs CG+GG).
3.2.2. MiR-499 rs3746444
Twelve studies investigated the association between miR-499 rs3746444 gene polymorphism and the risk of RA and SLE. 10 studies, consisting of 1882 cases and 2591 controls, emphasized the association between miR-499 rs3746444 (T/C) polymorphism and risk of RA, while only 2 studies focused on the association of polymorphism in miR-499 (T/C) with SLE. Our results demonstrated that miR-499 rs3746444 was significant associated with increased risk of RA in genetic models (allele model: OR = 1.350, 95% CI: 1.097–1.661, Pz = .005; homozygote model: OR = 1.872, 95% CI: 1.258–2.785, Pz = .002; dominant model: OR = 1.331, 95% CI: 1.025–1.729, Pz = .032; recessive model: OR = 1.781, 95% CI: 1.362–2.328, Pz < .001) (Fig. 2B). Based on ethnicity, an increased risk of RA was found in the Caucasian population, but not statistically associated with RA in the Asian population under any of the models. When stratified by control source or quality score or genotyping method, statistical significance was observed in any groups. However, there is no significant correlation between miR-499 rs3746444 polymorphism and susceptibility to SLE (Table 2).
3.2.3. MiR-196a2 rs11614913
The miR-196a2 rs11614913 (C/T) was investigated only in 3 studies. Of 2 studies, consisting of 507 cases and 686 controls assessed the association of miR-196a2 rs11614913 (T/C) polymorphism with risk of RA, 1 followed the polymorphism in miR-196a2 rs11614913 (T/C) and association with SLE. Regardless of the models, the miR-196a2 rs11614913 (T/C) polymorphism was not associated with the risk of RA and SLE.
3.3. Heterogeneity
Significant heterogeneity was identified in the overall and major subgroup analyses. Then, we performed Galbraith plots analysis to further determine the heterogeneity source among studies in the allelic model. The Galbraith plot analysis showed that 2 studies fell outside the 95% CI for RA[13,19] (Fig. 4A), 1 study was an outlier for SLE in miR-146a rs2910164[29] (Fig. 4B), 3 studies fell outside the 95% CI for RA in miR-499[24,33,34] (Fig. 4C).
Figure 4.
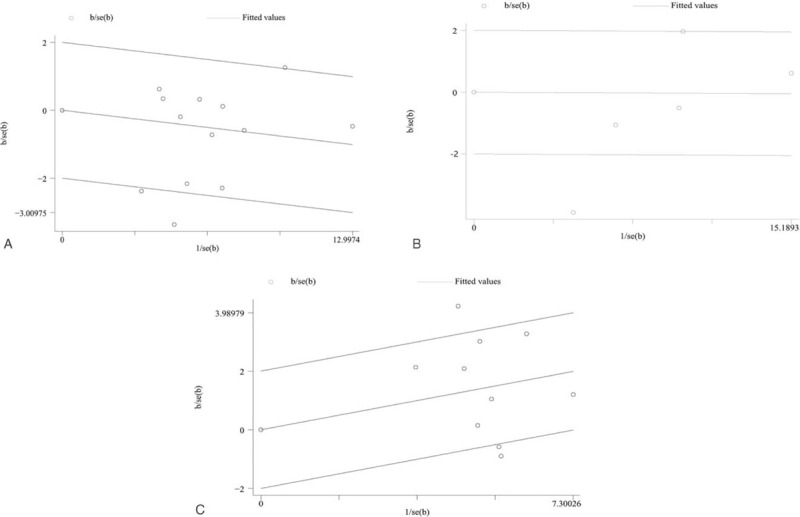
Galbraith radial plot in allelic contrast. (A) miR-146a rs2910164 (G/C) polymorphism and risk of RA; (B) miRNA-146a rs2910164 (G/C) polymorphism and risk of SLE; (C) miR-499 rs3746444 (T/C) polymorphism and risk of RA.
3.4. Sensitivity analysis
Since the lacking number of included studies for SLE, we only conducted sensitivity analysis on the included RA studies. Sensitivity analysis by deleting a single study in turn to estimate the contribution of each study. Our finding showed that the pooled ORs were not materially altered, suggesting the reliability of our meta-analysis (Fig. 5A-B).
Figure 5.
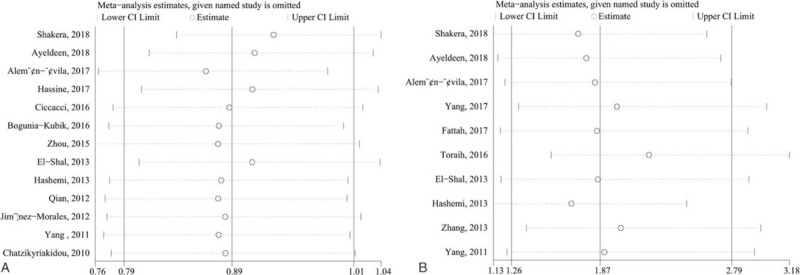
Sensitivity analysis (A) miR-146a rs2910164 (G/C) polymorphism and risk of RA (C-allele vs G-allele); (B) miR-499 rs3746444 (T/C) polymorphism and risk of RA (CC vs GG).
3.5. Publication bias
In this meta-analysis, we also performed the available Begg’ Funnel plot and Egger regression intercept test for the potential effect of publication bias. Similarly, since the lacking number of included studies for SLE, we only conducted publication bias tests on the included RA studies. Asymmetry of Funnel plots (Fig. 6A-B) and Egger test showed no statistically significant results (miR-146a rs2910164 (G/C): allelic contrasts: P = .140, homozygote model: P = .096, heterozygous model: P = .291, dominant model: P = .286, recessive model: P = .054; miR-499 rs3746444 (T/C): allelic model: P = .274, homozygote model: P = .694, heterozygous model: P = .301, dominant model: P = .777, recessive model: P = .401).
Figure 6.
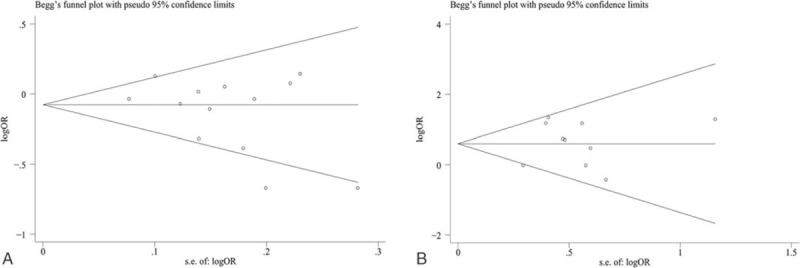
Funnel plot was performed for publication bias. (A) miR-146a rs2910164 (G/C) polymorphism and risk of RA (C-allele vs G-allele); (B) miR-499 rs3746444 (T/C) polymorphism and risk of RA (CC vs GG).
4. Discussion
miRNAs have been confirmed to play a pivotal role in autoimmune responses and autoimmune disorders such as SLE, RA.[35,36] An increasing piece of evidence emerged to discuss whether there was any association between miRNA polymorphisms and risk of RA or SLE. However, the sample capacity was relatively small that it was too underpowered to detect the small effects of the gene polymorphism. Thus, our objective in conducting this meta-analysis was to better understand the association between this polymorphism and susceptibility to RA and SLE based on increased sample size and statistical capacity. In the present study, we have addressed the association between 5 genetic polymorphisms in miRNA polymorphisms and susceptibility to SLE or RA.
We found that miR-146a rs2910164 polymorphism was not associated with the overall risk of RA, it was similar to previous meta-analysis.[37–39] However, the result was not consistent with the result of functional studies. Previous functional studies have also reported that levels of miR-146a in PBMCs are strongly up-regulated in RA and was positively associated with RA activity.[3,13] Up-regulation of miR-146a expression may lead to a continuous increase in TNF-α, ultimately, ending up in osteoclast production and bone destruction.[40] To further explore the potential causes, subgroup analysis was carried out in terms of ethnicity. Interestingly, it showed individuals who carried CC genotype in miR-146a rs2910164 was found to confer protection against RA in Caucasians. which was a far cry from previous studies.[37,39] The reason for the inconsistency may be that 1 statistically significant study in Caucasians was enlisted in our meta-analysis,[13] which has decreased the probability of larger P values and narrower CIs. Compared with G allele carriers, the level of miR-146a was higher in C allele carriers,[13,19] we might speculate that the C-allele miR-146a could decrease the expression of miR-146a and may serve as a specific biomarker to monitor the activity of patients with RA in Caucasians. For SLE, we observed an association of miR-146a rs2431697 with increased risk of SLE, which was in agreement with previous works.[41,42] A previous study in function showed that the expression of miR-146a in PBMCs of SLE patients was decreased compared with healthy controls, and expression of miR-146a in SLE patients negatively correlates with clinical disease activity and IFN scores.[43] Decreased expression of miR-146a in patients with SLE would lead to accumulation of its target proteins and result in overproduction of type I IFNs and enhanced activation of type I IFN signaling.[41] It is worth mentioning that additional large-sample studies and genetic models were required, as this association was based on a small number of studies and insufficient genotype distributions.
For miR-499 rs3746444 (T/C), we observed an increased overall risk of RA, which can reflect the results of functional studies.[12] The previous study has uncovered that The TC, CC genotypes and C allele frequencies were significantly associated with disease severity as they had high rheumatoid factor. Also, CC genotype has a higher level of anti-cyclic citrullinated peptide than TT genotype.[15] Our results were in agreement with early meta-analyses,[32,37,44,45] but were not consistent with Yang et al.[32] The reason for the inconsistency may be that the sample size was small and only 1 statistically significant study was included in Yang et al research. Further subgroup analysis based on ethnicities detected that rs3746444 significantly increased susceptibility to RA in the Caucasian population, whereas no statistical significance was observed in Asians, which was similar to previous meta-analyses.[32,38,44,46] It may confer that the difference in race and the living environment may also be a risk factor. In a way, the distribution of genes varies by ethnicity and living environment. Therefore, based on the available meta-analyses and present meta-analysis, we believed that miR-499 rs3746444 (T/C) may be a susceptibility factor for RA, especially in the Caucasian population, and may serve as a specific biomarker for RA prognosis.
The main difference compared with the previous meta-analyses was that we included the most updated publication and more miRNA-SNPs, especially, we provide a more comprehensive statistical analysis for the relationship of miR-146a (rs2910164, rs57095329, rs2431697) with the risk of SLE.[38,41] Besides, the advantages of our meta-analysis were as follows:
-
1.
P value of overall and subgroup heterogeneity was provided at any of models so that to clarify the source of heterogeneity,
-
2.
to explore heterogeneity, we conducted subgroup analyses and Galbraith plot analysis, and
-
3.
publication bias, and sensitivity analysis were carried out to determine if the current evidence was reliable and conclusive.
Some limitations for the present pooled analysis should also be notable. Firstly, in some genetic models, heterogeneity was noted, and performed the random-effects model to obtain the ORs and wider CIs, which might weaken the reliability of outcomes. Secondly, without enough data, we could not investigate analysis on complex interactions among gene × gene, environmental factors, and gene × environment. Lastly, we had a pretty limited sample size in several studies. Further studies are required to make the result convincing.
5. Conclusions
In summary, our result suggests that miR-499 rs3746444 may upgrade the risk of RA, particularly in Caucasians. While miR-146a rs2910164 (G/C) is not associated with the overall risk of RA but CC genotype may act as a protector of RA in Caucasians. For SLE, miR-146a rs2431697 (C/T) is most likely to the increased the risk of SLE.
Author contributions
Conceptualization: Fengzhen Liu, Yu Zhao, Chunquan Zhang, Yahang Liang.
Data curation: Fengzhen Liu, Lili Chen, Xiaolin Wang, Chunquan Zhang, Yahang Liang, Yu Zhao.
Funding acquisition: Chunquan Zhang.
Methodology: Fengzhen Liu, Yahang Liang, Yu Zhao, Lili Chen, Xiaolin Wang, Chunquan Zhang.
Software: Fengzhen Liu, Xiaolin Wang.
Visualization: Chunquan Zhang.
Writing – original draft: Fengzhen Liu, Chunquan Zhang, Yahang Liang, Yu Zhao, Lili Chen, Xiaolin Wang.
Writing – review & editing: Fengzhen Liu, Yahang Liang, Yu Zhao, Lili Chen, Xiaolin Wang, Chunquan Zhang.
Footnotes
Abbreviations: CI = confidence intervals, HWE = Hardy–Weinberg Equilibrium, MiRNA = microRNA, OR = odds ratio, PBMC = peripheral blood mononuclear cell, RA = rheumatoid arthritis, SLE = systemic lupus erythematosus, SNP = single nucleotide polymorphism, TNF = tumor necrosis factor.
How to cite this article: Liu F, Liang Y, Zhao Y, Chen L, Wang X, Zhang C. Meta-analysis of association of microRNAs genetic variants with susceptibility to rheumatoid arthritis and systemic lupus erythematosus. Medicine. 2021;100:17(e25689).
The authors have no funding and conflicts of interests to disclose.
The datasets generated during and/or analyzed during the current study are publicly available.
OR = odds ratio, CI = confidence interval, HWE = Hardy–Weinberg equilibrium, RA = rheumatoid arthritis, SLE = systemic lupus erythematosus, HB = hospital-based, PB = population-based, PCR = polymerase chain reaction, PFLP = restriction fragment length polymorphism, RT = reverse transcription, MALDI-TOF–MS = matrix-assisted laser desorption/ionization time-of-flight mass spectrometry.
CI = confidence interval, HB = hospital-based, PB = population-based, HWE = Hardy–Weinberg equilibrium, OR = odds ratio, PCR = polymerase chain reaction, PFLP = restriction fragment length polymorphism, Ph = P value for heterogeneity, Pz = P value for Z test, RA = rheumatoid arthritis, SLE = systemic lupus erythematosus.
miR-146a rs2910164 (G/C), Allelic model (C vs G); Homozygote model, (CC vs GG); Dominant model, (CC+GC vs GG); Recessive model, (CC vs GC+GG).
miR-146a rs57095329 (A/G), Allelic model (G vs A); Homozygote model, (GG vs AA); Dominant model, (GA+GG vs AA); Recessive model, (GG vs GA+AA).
miR-146a rs2431697 (C/T), Allelic model (T vs C); Homozygote model, (TT vs CC); Dominant model, (CT+TT vs CC); Recessive model, (TT vs CT+CC).
miR-196a2 rs11614913 (C/T), Allelic model (T vs C); Homozygote model, (TT vs CC); Dominant model, (CT+TT vs CC); Recessive model, (TT vs CT+CC).
miR-499 rs3746444 (T/C), Allelic model (C vs T); Homozygote model: (CC vs TT); Dominant model, (CT+CC vs TT); Recessive model, (CC vs CT+TT.
References
- [1].Smolen JS, Aletaha D, Koeller M, et al. New therapies for treatment of rheumatoid arthritis. Lancet (London, England) 2007;370:1861–74. [DOI] [PubMed] [Google Scholar]
- [2].Stinton LM, Fritzler MJ. A clinical approach to autoantibody testing in systemic autoimmune rheumatic disorders. Autoimmun Rev 2007;7:77–84. [DOI] [PubMed] [Google Scholar]
- [3].Pauley KM, Satoh M, Chan AL, et al. Upregulated miR-146a expression in peripheral blood mononuclear cells from rheumatoid arthritis patients. Arthritis Res Ther 2008;10:R101. [DOI] [PMC free article] [PubMed] [Google Scholar]
- [4].Dai Y, Huang YS, Tang M, et al. Microarray analysis of microRNA expression in peripheral blood cells of systemic lupus erythematosus patients. Lupus 2007;16:939–46. [DOI] [PubMed] [Google Scholar]
- [5].Bartel DP. MicroRNAs: genomics, biogenesis, mechanism, and function. Cell 2004;116:281–97. [DOI] [PubMed] [Google Scholar]
- [6].Filipowicz W, Bhattacharyya SN, Sonenberg N. Mechanisms of post-transcriptional regulation by microRNAs: are the answers in sight? Nat Rev Genet 2008;9:102–14. [DOI] [PubMed] [Google Scholar]
- [7].Velu VK, Ramesh R, Srinivasan AR. Circulating MicroRNAs as biomarkers in health and disease. J Clin Diagn Res 2012;6:1791–5. [DOI] [PMC free article] [PubMed] [Google Scholar]
- [8].Qu Z, Li W, Fu B. MicroRNAs in autoimmune diseases. Biomed Res Int 2014;2014:527895. [DOI] [PMC free article] [PubMed] [Google Scholar]
- [9].Tsitsiou E, Lindsay MA. microRNAs and the immune response. Curr Opin Pharmacol 2009;9:514–20. [DOI] [PMC free article] [PubMed] [Google Scholar]
- [10].Baxter D, McInnes IB, Kurowska-Stolarska M. Novel regulatory mechanisms in inflammatory arthritis: a role for microRNA. Immunol Cell Biol 2012;90:288–92. [DOI] [PubMed] [Google Scholar]
- [11].Cheleschi S, Gallo I, Barbarino M, et al. MicroRNA mediate visfatin and resistin induction of oxidative stress in human osteoarthritic synovial fibroblasts via NF-(B Pathway. Int J Mole Sci 2019;20:5200. [DOI] [PMC free article] [PubMed] [Google Scholar]
- [12].El-Shal AS, Aly NM, Galil SM, et al. Association of microRNAs genes polymorphisms with rheumatoid arthritis in Egyptian female patients. Joint Bone Spine 2013;80:626–31. [DOI] [PubMed] [Google Scholar]
- [13].Shaker OG, El Boghdady NA, El Sayed AE. Association of MiRNA-146a, MiRNA-499, IRAK1, and PADI4 polymorphisms with rheumatoid arthritis in Egyptian population. Cell Physiol Biochem 2018;46:2239–49. [DOI] [PubMed] [Google Scholar]
- [14].Zhang J, Yang B, Ying B, et al. Association of pre-microRNAs genetic variants with susceptibility in systemic lupus erythematosus. Mol Biol Rep 2011;38:1463–8. [DOI] [PubMed] [Google Scholar]
- [15].Fattah SA, Ghattas MH, Saleh SM, et al. Pre-micro RNA-499 gene polymorphism rs3746444 T/C is associated with susceptibility to rheumatoid arthritis in Egyptian population. Indian J Clin Biochem 2018;33:96–101. [DOI] [PMC free article] [PubMed] [Google Scholar]
- [16].Stang A. Critical evaluation of the Newcastle-Ottawa scale for the assessment of the quality of nonrandomized studies in meta-analyses. Eur J Epidemiol 2010;25:603–5. [DOI] [PubMed] [Google Scholar]
- [17].Higgins JP, Altman DG, Gotzsche PC, et al. The Cochrane Collaboration's tool for assessing risk of bias in randomised trials. BMJ 2011;343:d5928. [DOI] [PMC free article] [PubMed] [Google Scholar]
- [18].Martorell-Marugan J, Toro-Dominguez D, Alarcon-Riquelme ME, et al. MetaGenyo: a web tool for meta-analysis of genetic association studies. BMC Bioinformatics 2017;18:563. [DOI] [PMC free article] [PubMed] [Google Scholar]
- [19].Ayeldeen G, Nassar Y, Ahmed H, et al. Possible use of miRNAs-146a and -499 expression and their polymorphisms as diagnostic markers for rheumatoid arthritis. Mol Cell Biochem 2018;449:145–56. [DOI] [PubMed] [Google Scholar]
- [20].Hassine HB, Boumiza A, Sghiri R, et al. Micro RNA-146a But Not IRAK1 is associated with rheumatoid arthritis in the Tunisian population. Genet Test Mol Biomarkers 2017;21:92–6. [DOI] [PubMed] [Google Scholar]
- [21].Aleman-Avila I, Jimenez-Morales M, Beltran-Ramirez O, et al. Functional polymorphisms in pre-miR146a and pre-miR499 are associated with systemic lupus erythematosus but not with rheumatoid arthritis or Graves’ disease in Mexican patients. Oncotarget 2017;8:91876–86. [DOI] [PMC free article] [PubMed] [Google Scholar]
- [22].Bogunia-Kubik K, Wysoczanska B, Piatek D, et al. Significance of polymorphism and expression of miR-146a and NFkB1 genetic variants in patients with rheumatoid arthritis. Arch Immunol Ther Exp (Warsz) 2016;64: Suppl 1: 131–6. [DOI] [PMC free article] [PubMed] [Google Scholar]
- [23].Zhou X, Zhu J, Zhang H, et al. Is the microRNA-146a (rs2910164) polymorphism associated with rheumatoid arthritis? Association of microRNA-146a (rs2910164) polymorphism and rheumatoid arthritis could depend on gender. Joint Bone Spine 2015;82:166–71. [DOI] [PubMed] [Google Scholar]
- [24].Hashemi M, Eskandari-Nasab E, Zakeri Z, et al. Association of pre-miRNA-146a rs2910164 and premiRNA-499 rs3746444 polymorphisms and susceptibility to rheumatoid arthritis. Mol Med Rep 2013;7:287–91. [DOI] [PubMed] [Google Scholar]
- [25].Jimenez-Morales S, Gamboa-Becerra R, Baca V, et al. MiR-146a polymorphism is associated with asthma but not with systemic lupus erythematosus and juvenile rheumatoid arthritis in Mexican patients. Tissue Antigens 2012;80:317–21. [DOI] [PubMed] [Google Scholar]
- [26].Yang B, Zhang JL, Shi YY, et al. Association study of single nucleotide polymorphisms in pre-miRNA and rheumatoid arthritis in a Han Chinese population. Mol Biol Rep 2011;38:4913–9. [DOI] [PubMed] [Google Scholar]
- [27].Chatzikyriakidou A, Voulgari PV, Georgiou I, et al. A polymorphism in the 3’-UTR of interleukin-1 receptor-associated kinase (IRAK1), a target gene of miR-146a, is associated with rheumatoid arthritis susceptibility. Joint Bone Spine 2010;77:411–3. [DOI] [PubMed] [Google Scholar]
- [28].Qian L, Gao DW, Wang GS, et al. Relationship between the single nucleotide polymorphisims in pre-miR-146a rs2910164 and expression of miR-146a in rheumatoid arthritis. Chin J Microbiol Immunol 2012;32:253–7. [Google Scholar]
- [29].Labib DA, Shaker OG, El Refai RM, et al. Association between miRNA-146a and polymorphisms of its target gene, IRAK1, regarding susceptibility to and clinical features of systemic lupus erythematous and multiple sclerosis. Lab Med 2019;50:34–41. [DOI] [PubMed] [Google Scholar]
- [30].Lofgren SE, Frostegard J, Truedsson L, et al. Genetic association of miRNA-146a with systemic lupus erythematosus in Europeans through decreased expression of the gene. Genes Immun 2012;13:268–74. [DOI] [PMC free article] [PubMed] [Google Scholar]
- [31].Tang ZM, Wang P, Chang PP, et al. Association between rs2431697 T allele on 5q33.3 and systemic lupus erythematosus: case-control study and meta-analysis. Clin Rheumatol 2015;34:1893–902. [DOI] [PMC free article] [PubMed] [Google Scholar]
- [32].Yang XK, Li P, Zhang C, et al. Association between IRAK1 rs3027898 and miRNA-499 rs3746444 polymorphisms and rheumatoid arthritis: a case control study and meta-analysis. Zeitschrift fur Rheumatologie 2017;76:622–9. [DOI] [PubMed] [Google Scholar]
- [33].Toraih EA, Ismail NM, Toraih AA, et al. Precursor miR-499a variant but not miR-196a2 is associated with rheumatoid arthritis susceptibility in an Egyptian population. Mol Diagn Ther 2016;20:279–95. [DOI] [PubMed] [Google Scholar]
- [34].Zhang H, Pu J, Wang X, et al. IRAK1 rs3027898 C/A polymorphism is associated with risk of rheumatoid arthritis. Rheumatol Int 2013;33:369–75. [DOI] [PubMed] [Google Scholar]
- [35].Xu WD, Lu MM, Pan HF, et al. Association of MicroRNA-146a with autoimmune diseases. Inflammation 2012;35:1525–9. [DOI] [PubMed] [Google Scholar]
- [36].Pauley KM, Cha S, Chan EK. MicroRNA in autoimmunity and autoimmune diseases. J Autoimmun 2009;32:189–94. [DOI] [PMC free article] [PubMed] [Google Scholar]
- [37].Xiao Y, Liu H, Chen L, et al. Association of microRNAs genes polymorphisms with arthritis: a systematic review and meta-analysis. Biosci Rep 2019;39:BSR20190298. [DOI] [PMC free article] [PubMed] [Google Scholar]
- [38].Fu L, Jin L, Yan L, et al. Comprehensive review of genetic association studies and meta-analysis on miRNA polymorphisms and rheumatoid arthritis and systemic lupus erythematosus susceptibility. Hum Immunol 2016;77:01–6. [DOI] [PubMed] [Google Scholar]
- [39].Zhou M, Jiang B, Xiong M, et al. An updated meta-analysis of the associations between MicroRNA polymorphisms and susceptibility to rheumatoid arthritis. Front Physiol 2018;9:1604. [DOI] [PMC free article] [PubMed] [Google Scholar]
- [40].Taganov KD, Boldin MP, Chang KJ, et al. NF-kappaB-dependent induction of microRNA miR-146, an inhibitor targeted to signaling proteins of innate immune responses. Proc Natl Acad Sci U S A 2006;103:12481–6. [DOI] [PMC free article] [PubMed] [Google Scholar]
- [41].Ji JD, Cha ES, Lee WJ. Association of miR-146a polymorphisms with systemic lupus erythematosus: a meta-analysis. Lupus 2014;23:1023–30. [DOI] [PubMed] [Google Scholar]
- [42].Park R, Lee WJ, Ji JD. Association between the three functional miR-146a single-nucleotide polymorphisms, rs2910164, rs57095329, and rs2431697, and autoimmune disease susceptibility: a meta-analysis. Autoimmunity 2016;49:451–8. [DOI] [PubMed] [Google Scholar]
- [43].Tang Y, Luo X, Cui H, et al. MicroRNA-146A contributes to abnormal activation of the type I interferon pathway in human lupus by targeting the key signaling proteins. Arthritis Rheum 2009;60:1065–75. [DOI] [PubMed] [Google Scholar]
- [44].Lu L, Tu Y, Liu L, et al. MicroRNA-499 rs3746444 polymorphism and autoimmune diseases risk: a meta-analysis. Mol Diagn Ther 2014;18:237–42. [DOI] [PubMed] [Google Scholar]
- [45].Song GG, Bae SC, Seo YH, et al. The association between susceptibility to inflammatory arthritis and miR-146a, miR-499 and IRAK1 polymorphisms. A meta-analysis. Z Rheumatol 2015;74:637–45. [DOI] [PubMed] [Google Scholar]
- [46].Li K, Tie H, Hu N, et al. Association of two polymorphisms rs2910164 in miRNA-146a and rs3746444 in miRNA-499 with rheumatoid arthritis: a meta-analysis. Hum Immuno 2014;75:602–8. [DOI] [PubMed] [Google Scholar]