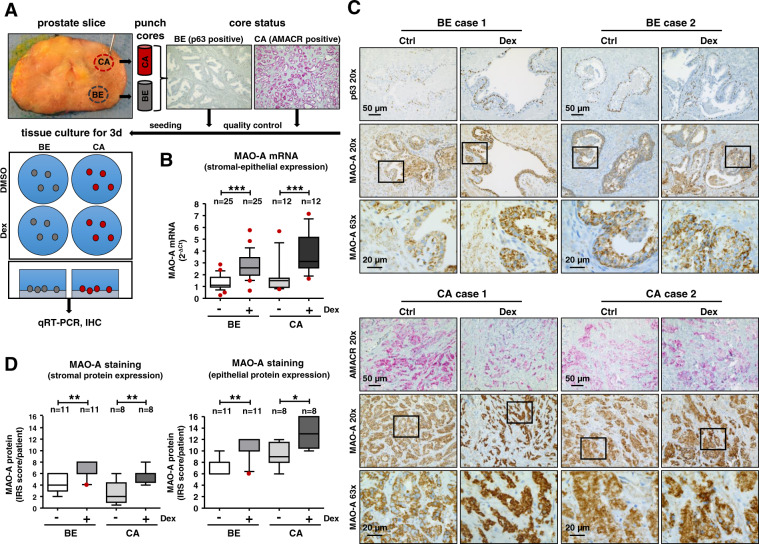
Fig. 3. Evaluation of MAO-A expression in benign and cancerous tissue cores of RPE patients after GC treatment.
A Schematic illustration of the ex vivo tissue culture. Punching, quality control by IHC staining for benign epithelium (p63) and for tumor tissue (AMACR) and cultivation of processed prostate tissue pieces in 6-well tissue culture plates. B MAO-A mRNA expression after 72 h incubation with 100 nM Dex. Data represent mean + SE from 25 benign and 12 cancerous screened tissue cores (one-way ANOVA and correction for multiple testing using Bonferroni´s comparison test; *, P < 0.05; ***, P < 0.001; Box Whisker Plot with 10–90 percentile). C Representative microscopy images of p63-AMACR and MAO-A staining of benign and cancerous tissue cores. Magnification: 20× (scale bar = 50 µm) and 63× (scale bar = 20 µm). D Quantification of MAO-A IRS after IHC staining of the epithelial and stromal compartment within benign and cancerous tissue cores (Kruskal–Wallis test and correction for multiple testing using Dunn´s comparison test; *, P < 0.05; **, P < 0.01; Box Whisker Plot with 10–90 percentile).

