

Abstract
Policymakers need decision tools to determine when to use physical distancing interventions to maximize the control of COVID-19 while minimizing the economic and social costs of these interventions. We describe a pragmatic decision tool to characterize adaptive policies that combine real-time surveillance data with clear decision rules to guide when to trigger, continue, or stop physical distancing interventions during the current pandemic. In model-based experiments, we find that adaptive policies characterized by our proposed approach prevent more deaths and require a shorter overall duration of physical distancing than alternative physical distancing policies. Our proposed approach can readily be extended to more complex models and interventions.
Introduction
The health and economic costs of the ongoing SARS-CoV-2 pandemic are staggering [1, 2]. In the absence of an effective vaccine or other pharmaceutical interventions, physical distancing (PD) measures have been the primary means to reduce the speed of epidemic growth, to relieve pressure on the health care system, and to buy scientists time to develop new prevention and treatment strategies. Model-based analysis of previous pandemics [3] as well as current models of the COVID-19 pandemic suggest that these PD interventions will need to be maintained for weeks to months in the United States to minimize risks of overwhelming hospital capacity and to avoid epidemic rebound [4–6]. However, PD measures also impose an immense economic and social burden [7, 8]. Indeed, it is clear that a single uninterrupted period of strict PD cannot be practically sustained to achieve eradication. Accordingly, policymakers require tools to help them determine when PD interventions should be started and stopped to optimize health and economic outcomes.
Here, we describe a method for adaptive decision making during the ongoing pandemic that explicitly accounts for the tradeoffs between the health benefits and economic costs of PD interventions. We demonstrate how this decision model can assemble the necessary evidence to characterize policies that use surveillance data to inform real-time determination of starting, continuation, or stopping of PD interventions. Using a simulation model of the COVID-19 pandemic, we show that these types of adaptive policies can avert more deaths while requiring a shorter total duration of PD compared to alternative policies, including pre-determined periodic interventions and those that focus on ensuring available ICU capacity is not surpassed [4–6].
Methods
A model for adaptive decision making
To illustrate our decision model, we assume that a policymaker’s objectives are to minimize both the number of deaths associated with COVID-19 and the duration of physical distancing interventions as a proxy for the harm inflicted by shutdowns on the economy. We quantify the trade-off between these objectives using the net monetary benefit (NMB) framework [9–11], expressed as , where T is the number of weeks the epidemic lasts; qk is the number of deaths due to COVID-19 that occur in week k; and ak = 1 if physical distancing is in effect during week k, and ak = 0, otherwise. We note that in the NMB function defined above, qk and ak can be expanded to represent more comprehensive measures of health and cost outcomes. For example, qk could also include other measures of the health impact of infection such as the quality-adjusted life-years lost due to COVID-19 during week k; variable ak could also include diagnosis and treatment costs incurred due to COVID-19 and economic costs due to physical distancing measures in place during week k. In this analysis, however, we use simpler measures of health benefits and costs (i.e. the number of deaths associated with COVID-19 and the duration of physical distancing interventions) to maintain focus on the presentation of the proposed decision model.
In the objective function described above, ω represents how a specific policymaker weighs the number of COVID-19 deaths per 100,000 population against the duration of PD. For example, a policymaker with trade-off value ω = 0.1 weeks per COVID-19 death averted is willing to keep PD in place for one additional week if it could prevent 10 deaths related to COVID-19 per 100,000 population. Higher values of ω indicate a higher tolerance for paying the economic and social costs of PD interventions in the interest of reducing COVID-19-related mortality.
An adaptive policy for informing PD interventions uses surveillance data available at the start of week k to recommend whether PD should be started, continued, or stopped during week k. One example of such a policy would recommend triggering PD when the estimated prevalence of infection surpasses 375 cases per 100,000 people and stopping PD when this epidemiological measure falls below 100 cases per 100,000 people [4]. As data such as the weekly number of COVID-19 patients requiring critical care (Ck) may be more easily observed than prevalence of infection, we focus on adaptive policies that use Ck to guide the use of PD interventions during the next week.
For a trade-off value ω, this policy (denoted by (T1(ω), T2(ω))) recommends to turn on the physical distancing intervention during the next week if Ck ≥ T1(ω), and to turn off the physical distancing intervention during the next week if Ck < T2(ω). To find (T1, T2) for a given trade-off value ω, we solve the following optimization problem:
| (1) |
where random variables qk(T1, T2) and ak (T1, T2) denote, respectively, the deaths related to COVID-19 and weeks closed under an adaptive policy with parameter (T1, T2) compared to the base strategy where physical distancing is never employed. The objective function (1) can be (approximately) optimized using a stochastic approximation algorithm described in §S2 of the Supplement.
A model of SARS-CoV-2 transmission
To evaluate the objective function (1) for different values of (T1, T2), we use a simple SEIR model of SARS-CoV-2 transmission in a population of size 1,000,000 (Fig. 1). Informed by data from the COVID-19 pandemic in U.S. [12], the model projects the weekly incidence of cases, patients requiring hospitalization and/or critical care, and deaths due to COVID-19 (qk). We assumed that COVID-related death occurs only among ICU patients. If a patient requires intensive care when no ICU bed is available, they will join an ICU queue (compartment “Waiting for ICU” in Fig. 1) where they will experience a higher risk of COVID-related death. We further assume that the PD intervention reduces the population contact rate by 70% with uncertainty interval of [60% − 80%] [4]. Additional details are provided in the Supplement.
Figure 1.
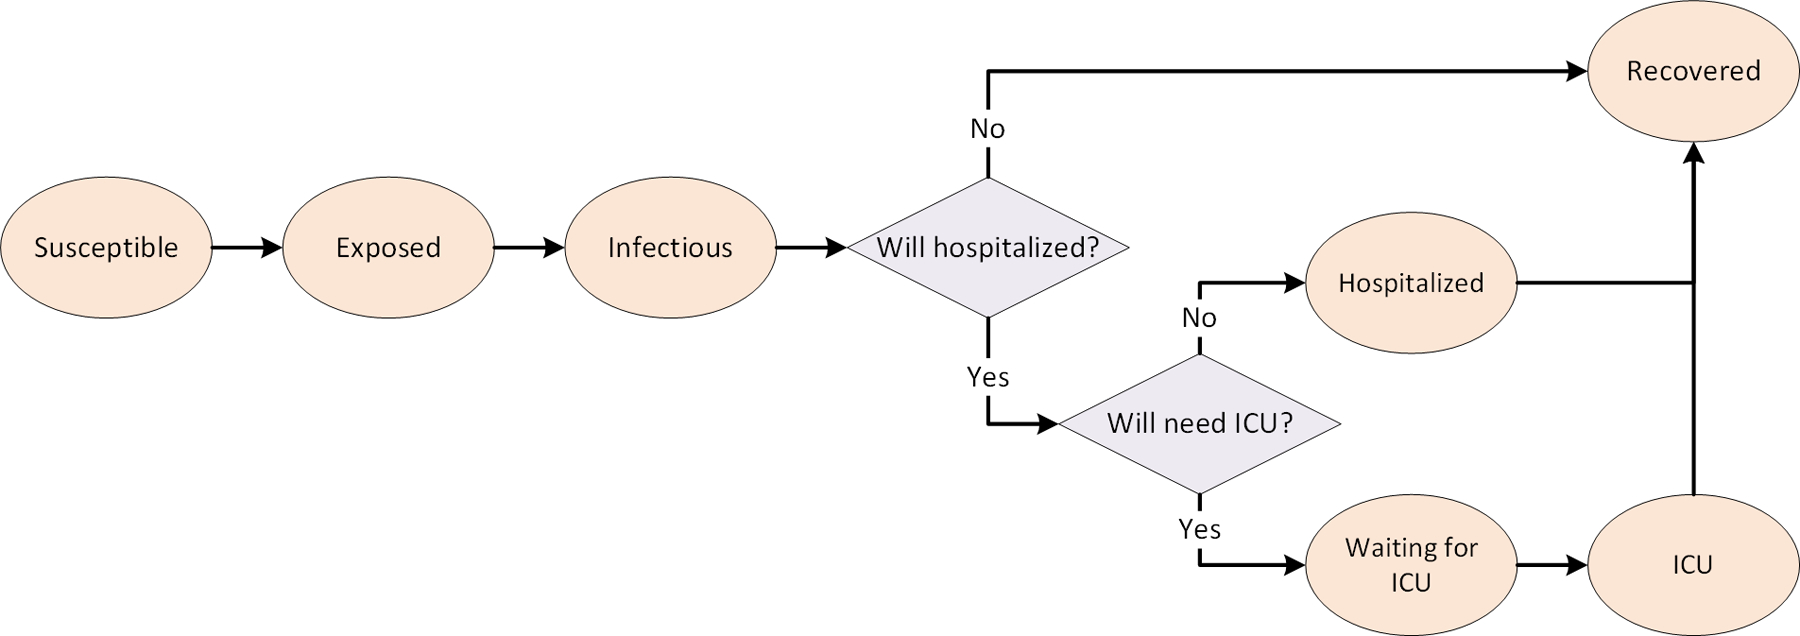
A stochastic transmission model of SARS-CoV-2
Alternative policies to guide the use of PD interventions
We compare the performance of policies characterized by optimizing the objective function (1), referred to as “Adaptive: Minimize Loss of NMB,” with two alternative PD policies: 1) “Static: Periodic” policy that employs the periodic use of PD at pre-defined durations and frequencies (e.g. every 2 weeks for 2 weeks, every 4 weeks for 4 weeks, etc.), and 2) ‘Adaptive: ICU Capacity’ policy which is similar to policies proposed by [4–6] where the on/off PD thresholds are determined to ensure that the expected probability of surpassing available ICU capacity is below a certain value (e.g. 90%). To determine (T1, T2) for this policy, we assumed T1 = 3T2 and varied T2 to find a policy with the expected probability of surpassing available ICU capacity equal to 70%, 80%, 90%, 95%, 99%, and 100%. We use the transmission model describe above to simulate COVID-related deaths and weeks with PD interventions in effect under each policy.
Results
Fig. 2 presents an adaptive policy which uses Ck to guide weekly decisions about the use of PD and minimizes the loss in the population NMB (i.e. the objective function (1)). At a trade-off value ω = 0.03 weeks per death averted per 100,000 persons, for example, this policy suggests that the PD intervention should be started when Ck exceeds a threshold 12.7 per 100,000 persons (Fig. 2A) and stopped when Ck falls below 11.8 per 100,000 persons (Fig. 2B).
Figure 2. A policy that uses the number of COVID-19 patients who need critical care at the beginning of a given week to inform whether the physical distancing interventions should be turned on or off during the following week.
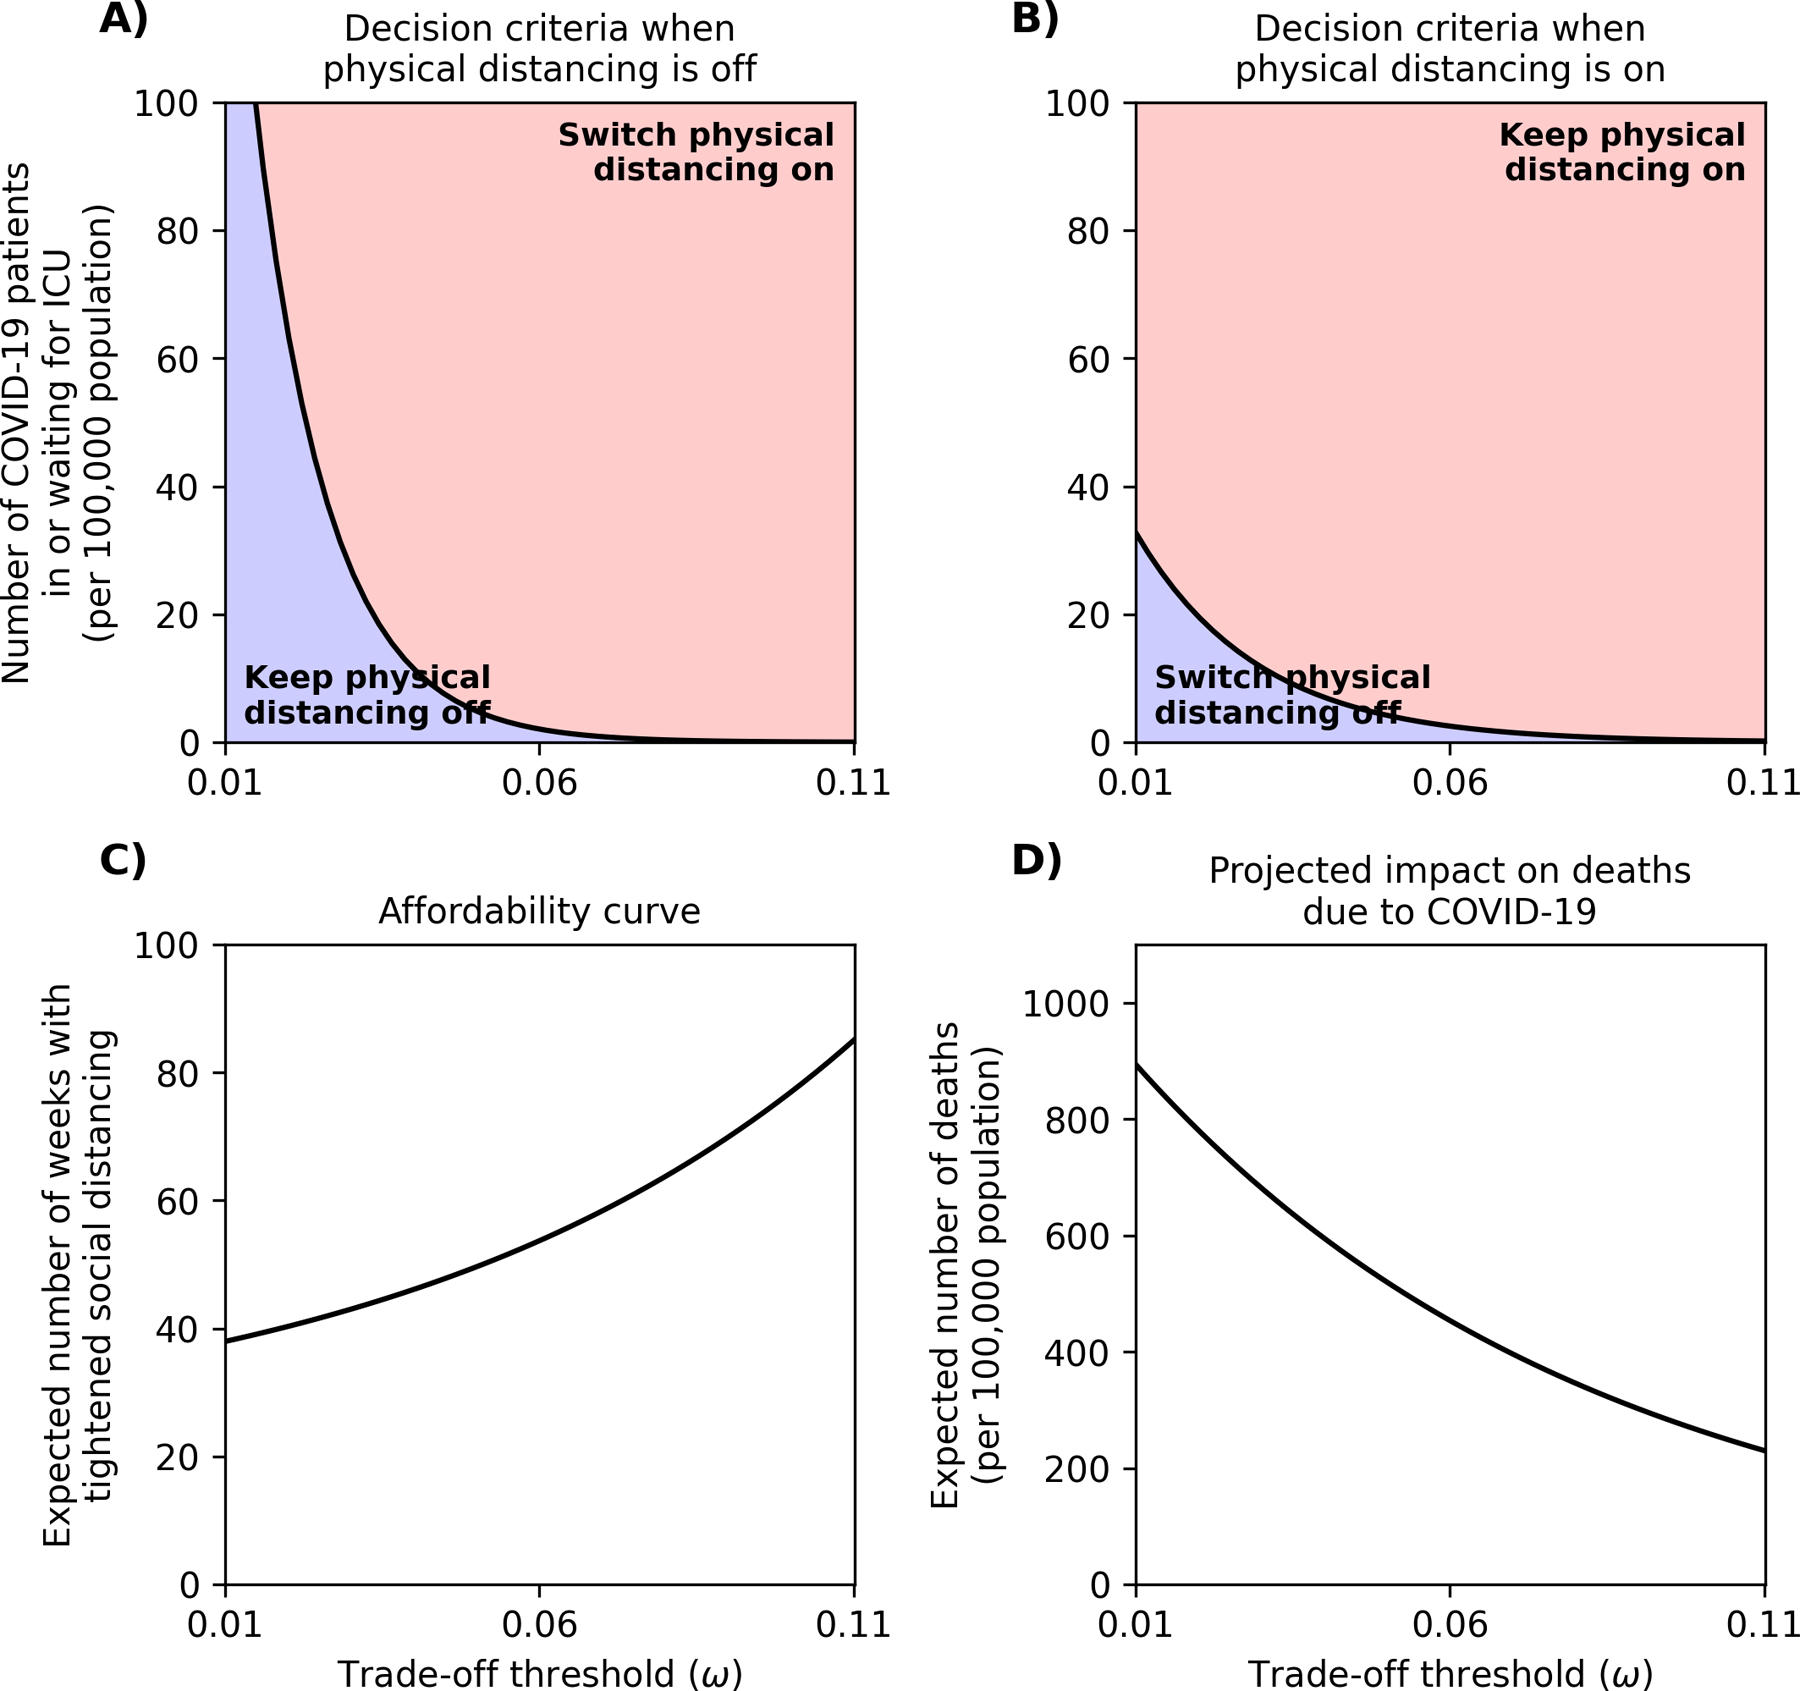
Panel A displays the decision rule to be used when the physical distancing intervention is currently off and panel B displays the decision rule when the physical distancing intervention is currently on. Panel C returns the accumulated number of weeks during which physical distancing is expected to be used, and Panel D displays the number of deaths per 100,000 population expected to occur due to COVID-19 under adaptive policies that correspond with different trade-off values (Panels A-B).
For a policymaker with an uncertain trade-off value ω, Fig. 2 presents an affordability curve (Fig. 2C), which returns the cumulative number of weeks for which PD interventions are expected to be used for different values of ω. A policymaker with a maximum tolerance for the overall number of weeks of PD can consult Fig. 2C to select a trade-off threshold that satisfies this constraint in expectation. The policymaker can then use Fig. 2A–B to make real-time decisions given their selected trade-off threshold. We note that higher trade-off values lead to lower thresholds of Ck at which to start PD interventions (Fig. 2A–B), more weeks during which PD is used (Fig. 2C) and a lower expected number of deaths due to COVID-19 over the course of the pandemic (Fig. 2D).
The differential performance of the PD policies considered here in terms of COVID-related deaths averted and weeks with tightened PD interventions is displayed in Fig. 3. The adaptive policies that seek to minimize the loss in NMB can be designed to dominate (i.e. prevent more deaths and require shorter duration of PD as) other policies described above. For any given number of weeks the policy maker is willing to maintain the PD intervention, the horizonal distance between the green curve and other curves in Fig. 3 represents how many deaths could be prevented by using an adaptive policy designed to minimize the loss in NMB, as compared to one of the other two approaches.
Figure 3. Comparing the performance of difference physical distancing (PD) policies.
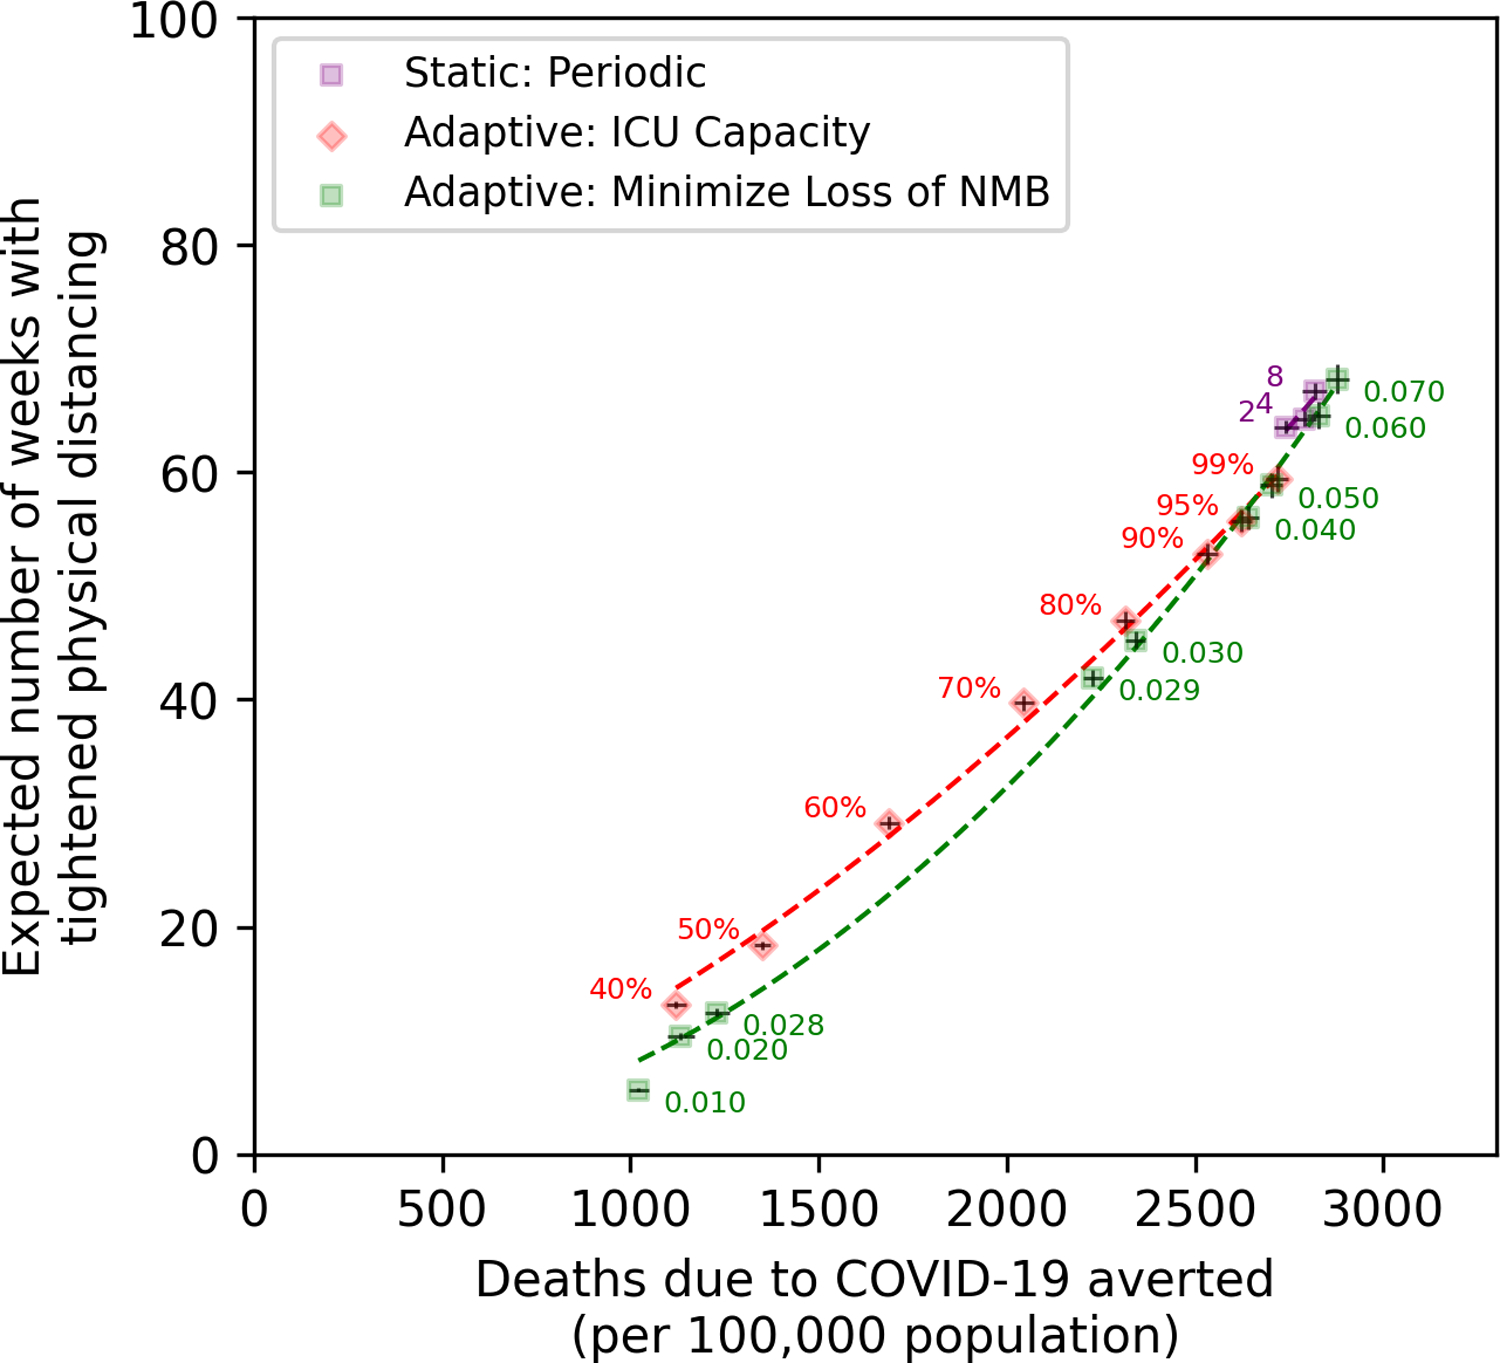
The origin in this figure corresponds to a counterfactual scenario where PD is not used at all, which is expected to result in 1,391 deaths per 100,000 population. The curve ‘Static: Periodic’ corresponds to policies that recommend using PD every 2 weeks for 2 weeks, every 4 weeks for 4 weeks, and so on. The numbers on the red curve (‘Adaptive: ICU Capacity’) represent the probability that a COVID-19 patient who requires critical care would get admitted to ICU. The numbers on the green curve (‘Adaptive: Minimize Loss of NMB’) represent the trade-off thresholds of policies selected from Fig. 2A–B. The bars represent the 95% confidence interval of projections using 200 simulated trajectories (note that the error bars are difficult to see because they are contained in the markers). NMB: net monetary benefit.
Discussion
As we have shown in previous studies of epidemics, the performance of policies to guide decision-making depends on how they use surveillance data to inform decisions [13–15]. Adaptive polices (such as ‘Adaptive: ICU Capacity’ and ‘Adaptive: Minimize Loss of NMB’ in our analysis), which use surveillance data to inform decisions, are expected to outperform static policies (such as ‘Static: Periodic’), which prespecify the timing of future actions [13, 14]. Furthermore, the performance of adaptive policies is affected by how their parameters (e.g. thresholds to switch on/off PD interventions in our analysis) are determined. We demonstrated that adaptive policies that are designed to minimize the loss in the population NMB are expected to outperform adaptive policies that ensure the probability of surpassing available ICU capacity remains below a certain value (e.g. 90%).
The results presented here highlight the need for several specific data items to promote better decision-making during this pandemic. First, we need the best data possible to understand the natural history of the pathogen (e.g. duration of immunity, infectiousness, role of asymptomatic transmission, mortality), the current epidemiology (e.g. the prevalence of hospitalized patients and those requiring critical care), and the effectiveness (e.g. reduction in contact rate) of PD interventions [16–18]. Second, we need better data on the economic costs of physical distancing interventions [19, 20]. Third, and most difficult, is the need for policymakers to establish what economic tradeoffs we are willing to make to preserve the health of the population. In the absence of clearly established guidelines on societal willingness-to-pay for health, policymakers may choose some proxies for the consumption of societal resources such as the number of weeks over which PD interventions are expected to be used (Fig. 2C) to choose an efficient PD policy to follow.
This paper presents a simple model of the COVID-19 pandemic to facilitate the exposition and discussion of the proposed decision model. As such, we have made a number of assumptions. We average across many important sources of heterogeneity. Additional details (e.g. age and socio-economic structure, risk-group membership, asymptomatic transmission, access to tests, lags in the reporting of test results, and population compliance with different PD interventions over time) will need to be added to allow for context-specific usage and to allow for simulation of more complex interventions (e.g. contact tracing, age-specific relaxation of PD rules, use of serological tests to establish which individuals should not be limited by PD interventions). Many of these complexities are addressed in recent models of COVID-19 pandemic [21–23]. One limitation of our simple approach is that we have assumed that deaths occur only amongst ICU patients. This omits mortality that is likely to be occurring in the community, particularly amongst lower socio-economic status groups who have limited access to healthcare, and particularly perhaps in the United States.
Furthermore, we used crude estimates to project health loss associated with the COVID-19 pandemic ignoring comorbidities and downstream health consequences of unemployment during tightened PD interventions. These factors could also be incorporated, depending on the availability of data, in the objective function we described above. The effectiveness of different PD interventions may not be known a priori, and our simple approach for modeling PD ignores the complexities in which mobility may change over the course of the epidemic regardless of the PD policy adopted. New data on the relationship between mobility, contact patterns, and the types of PD interventions guidelines in place can help improve the usefulness of these models.[24, 25] Finally, we have used simple measures of health and cost outcomes to illustrate the development of our proposed decision model. The objective function defined in Eq. (1) based on the net monetary benefit framework could incorporate more comprehensive measures of health outcome (e.g. quality-adjusted life-years) and resources consumed (e.g. short-term and long-term societal cost of physical distancing measures).
The decision tool we present here provides a flexible framework for using real-time observations to guide the use of PD interventions. The algorithm we propose to optimize PD policies does not restrict the type of epidemic model used to project the health and economic outcomes of the COVID-19 pandemic. Various frameworks, including compartmental, agent-based, or network models may be used as needed to relax the simplifying assumptions of our model. Furthermore, our proposed approach can also incorporate delays in reporting of data and uncertainties in surveillance estimates (due to limited sample size) [13, 15].
Supplementary Material
Acknowledgements
This work was partially funded by a Yale School of Public Health COVID-19 Rapid Response Grant to RY. RY was supported by K01AI119603, and TC by R01AI112438 and R01AI146555, all from the National Institute of Allergy and Infectious Diseases. GG was supported by DP2DA49282 and ADP by R37DA015612 both from the National Institute on Drug Abuse.
Footnotes
Competing interests
RY, NAM, GG, JS, ADP and TC report receiving funding from the National Institutes of Health (NIH) and the Centers for Disease Control and Prevention (CDC).
References
- [1].McKibbin WJ, Fernando R. The global macroeconomic impacts of COVID-19: Seven scenarios2020. Available from: https://www.brookings.edu/wp-content/uploads/2020/03/20200302_COVID19.pdf
- [2].Fernandes N Economic effects of coronavirus outbreak (COVID-19) on the world economy. Available at SSRN 3557504. 2020.
- [3].Bootsma MC, Ferguson NM. The effect of public health measures on the 1918 influenza pandemic in U.S. cities. Proc Natl Acad Sci U S A. 2007; 104(18):7588–93. [DOI] [PMC free article] [PubMed] [Google Scholar]
- [4].Kissler SM, Tedijanto C, Goldstein E, Grad YH, Lipsitch M. Projecting the transmission dynamics of SARS-CoV-2 through the postpandemic period. Science. 2020. [DOI] [PMC free article] [PubMed]
- [5].Ferguson NM, Laydon D, Nedjati-Gilani G, Imai N, Ainslie K, Baguelin M, et al. Impact of non-pharmaceutical interventions (NPIs) to reduce COVID-19 mortality and healthcare demand: Imperial College; 2020. Available from: https://www.imperial.ac.uk/media/imperial-college/medicine/sph/ide/gida-fellowships/Imperial-College-COVID19-NPI-modelling-16-03-2020.pdf [DOI] [PMC free article] [PubMed]
- [6].Walker PGT, Whittaker C, Watson OJ, Baguelin M, Winskill P, Hamlet A, et al. The impact of COVID-19 and strategies for mitigation and suppression in low- and middle-income countries. Science. 2020; 369(6502):413–22. [DOI] [PMC free article] [PubMed] [Google Scholar]
- [7].Barnett-Howell Z, Mobarak AM. The Benefits and Costs of Social Distancing in Rich and Poor Countries. arXiv preprint arXiv:200404867. 2020.
- [8].Greenstone M, Nigam V. Does social distancing matter? University of Chicago, Becker Friedman Institute for Economics Working Paper. 2020; (2020–26).
- [9].Sanders GD, Neumann PJ, Basu A, Brock DW, Feeny D, Krahn M, et al. Recommendations for Conduct, Methodological Practices, and Reporting of Cost-effectiveness Analyses: Second Panel on Cost-Effectiveness in Health and Medicine. JAMA. 2016; 316(10):1093–103. [DOI] [PubMed] [Google Scholar]
- [10].Stinnett AA, Mullahy J. Net health benefits: a new framework for the analysis of uncertainty in cost-effectiveness analysis. Med Decis Making. 1998; 18(2 Suppl):S68–80. [DOI] [PubMed] [Google Scholar]
- [11].Maharaj S, Kleczkowski A. Controlling epidemic spread by social distancing: do it well or not at all. BMC Public Health. 2012; 12:679. [DOI] [PMC free article] [PubMed] [Google Scholar]
- [12].CDC Covid- Response Team. Severe Outcomes Among Patients with Coronavirus Disease 2019 (COVID-19) - United States, February 12-March 16, 2020. MMWR Morb Mortal Wkly Rep. 2020; 69(12):343–6. [DOI] [PMC free article] [PubMed] [Google Scholar]
- [13].Yaesoubi R, Cohen T. Identifying dynamic tuberculosis case-finding policies for HIV/TB coepidemics. Proc Natl Acad Sci U S A. 2013; 110(23):9457–62. [DOI] [PMC free article] [PubMed] [Google Scholar]
- [14].Yaesoubi R, Cohen T. Identifying cost-effective dynamic policies to control epidemics. Stat Med. 2016; 35(28):5189–209. [DOI] [PMC free article] [PubMed] [Google Scholar]
- [15].Yaesoubi R, Cohen T, Hsu K, Gift TL, Chesson H, Salomon JA, et al. Adaptive guidelines for the treatment of gonorrhea to increase the effective life span of antibiotics among men who have sex with men in the United States: A mathematical modeling study. PLoS Med. 2020; 17(4):e1003077. [DOI] [PMC free article] [PubMed] [Google Scholar]
- [16].Chu DK, Akl EA, Duda S, Solo K, Yaacoub S, Schunemann HJ, et al. Physical distancing, face masks, and eye protection to prevent person-to-person transmission of SARS-CoV-2 and COVID-19: a systematic review and meta-analysis. Lancet. 2020; 395(10242):1973–87. [DOI] [PMC free article] [PubMed] [Google Scholar]
- [17].Zhang J, Litvinova M, Liang Y, Wang Y, Wang W, Zhao S, et al. Changes in contact patterns shape the dynamics of the COVID-19 outbreak in China. Science. 2020; 368(6498):1481–6. [DOI] [PMC free article] [PubMed] [Google Scholar]
- [18].Jarvis CI, Van Zandvoort K, Gimma A, Prem K, group CC-w, Klepac P, et al. Quantifying the impact of physical distance measures on the transmission of COVID-19 in the UK. BMC Med. 2020; 18(1):124. [DOI] [PMC free article] [PubMed] [Google Scholar]
- [19].Newbold SC, Finnoff D, Thunstrom L, Ashworth M, Shogren JF. Effects of Physical Distancing to Control COVID-19 on Public Health, the Economy, and the Environment. Environ Resour Econ (Dordr). 2020:1–25. [DOI] [PMC free article] [PubMed]
- [20].Fenichel EP. Economic considerations for social distancing and behavioral based policies during an epidemic. J Health Econ. 2013; 32(2):440–51. [DOI] [PMC free article] [PubMed] [Google Scholar]
- [21].MGH Institute for Technology Assessment - Harvard Medical School. COVID-19 Simulator. 2020. Available from: https://www.covid19sim.org/
- [22].MRC Centre for Global Infectious Disease Analysis ICL. COVID-19 Scenario Analysis Tool. 2020. Available from: https://covidsim.org/
- [23].Chiu WA, Fischer R, Ndeffo-Mbah ML. State-level needs for social distancing and contact tracing to contain COVID-19 in the United States. Nature Human Behaviour. 2020. [DOI] [PMC free article] [PubMed]
- [24].Flaxman S, Mishra S, Gandy A, Unwin HJT, Mellan TA, Coupland H, et al. Estimating the effects of non-pharmaceutical interventions on COVID-19 in Europe. Nature. 2020; 584(7820):257–61. [DOI] [PubMed] [Google Scholar]
- [25].Hsiang S, Allen D, Annan-Phan S, Bell K, Bolliger I, Chong T, et al. The effect of large-scale anti-contagion policies on the COVID-19 pandemic. Nature. 2020; 584(7820):262–7. [DOI] [PubMed] [Google Scholar]
Associated Data
This section collects any data citations, data availability statements, or supplementary materials included in this article.