

Abstract
Background and Purpose:
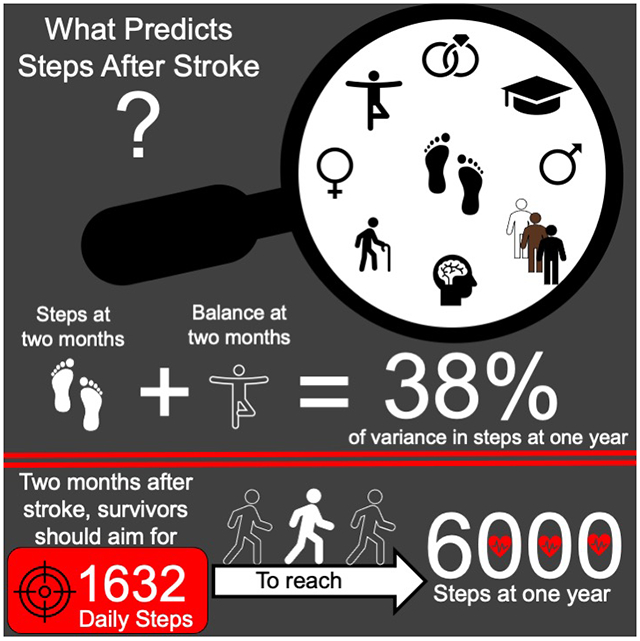
Walking has the potential to improve endurance and community participation after stroke. Obtaining ≥6000 daily steps can decrease subsequent stroke risk. Early identification of those prone to low daily steps could facilitate interventions that lead to increased walking and improved health. The purpose of this study was to 1) determine which factors at two months post-stroke can predict daily step counts at one year, and 2) determine what step count at two months corresponds to obtaining ≥6000 daily steps at one year post-stroke.
Methods:
This was a secondary analysis of data from the Locomotor Experience Applied Post Stroke trial, which enrolled participants with walking speeds <0.80 m/s at two months post-stroke. Daily steps were assessed at two months and one year post-stroke. Linear regression was used to predict daily step counts at one year based on factors including age, gender, race and/or ethnicity, stroke severity, walking speed, endurance, fitness, motor function, balance and balance confidence. A Receiver Operating Characteristic (ROC) curve determined which step count corresponded to reaching ≥6000 steps at one year.
Results:
Data from 206 participants, mean age=63 (13) years, 43% female, mean baseline daily step count=2922 (2749) steps, were analyzed. The final model to predict daily steps at one year post-stroke contained daily steps at two months and balance (Berg Balance Scale score); these factors explained 38% of the variability in daily steps at one year (p=<0.001). Participants obtaining ≥1632 daily steps at two months were 1.86 (95% CI 1.52 to 2.27) times more likely to reach ≥6000 daily steps at one year post-stroke.
Conclusions:
Daily steps and balance at two months post-stroke were the strongest predictors of future daily steps. Improving daily physical activity and targeting balance early after stroke may be necessary to increase physical activity at one year post-stroke.
Graphical Abstract
INTRODUCTION
Improving walking ability is a predominant goal for people after stroke,1 and is a primary focus of rehabilitation.2 While components of walking, including speed and endurance, improve in response to interventions,3-5 there has recently been an increased interest in daily living walking behavior, as measured by daily step counts.6-8 Unlike walking speed or endurance, daily steps are thought to represent participation outside the clinical environment and thus offer a unique insight into physical activity (PA) and walking behavior.3,9 Daily steps may even predict future health outcomes, with attainment of ≥6000 steps related to a decreased risk for subsequent cardiovascular disease in adults with stroke.10 Decreasing disease risk in adults with stroke is paramount considering nearly one in four survivors will experience a second stroke,11 which is often more debilitating and deadly than their initial stroke.12,13
Examination of what contributes to daily steps after stroke is needed in order to inform interventions aimed at increasing PA through walking. A 2018 meta-analysis,14 which examined correlates of PA (including daily steps) in people with stroke, found that modifiable correlates including cardiorespiratory fitness, fatigue, falls and balance self-efficacy, depression and health-related quality of life were all significantly associated with PA, in addition to the nonmodifiable correlates of age and sex. Limitations to this meta-analysis were that the majority of the included studies were cross sectional, used subjective measures (i.e. participant-reports) of PA, or included only those in the chronic (i.e. ≥ 6 months) phase of stroke. Ideally, identification of people with stroke at risk for leading insufficiently active lifestyles would be done as early after stroke as possible. Early identification of physical inactivity risk factors could lead to pre-emptive individualized education and behavioral interventions for those most at risk for physical inactivity and associated poor health outcomes.
The purpose of the present study was twofold: 1) determine which factors (both nonmodifiable and modifiable) at two months post-stroke can predict daily step counts at one year post-stroke and 2) determine a daily step threshold at two months post stroke that corresponds to obtaining ≥6000 daily steps at one year post-stroke.
METHODS
Study Design and Participants
The present study is a secondary analysis of deidentified data from the National Institute of Neurologic Disease and Stroke’s (NINDS) Archived Clinical Research data (Locomotor Experience Applied Post-Stroke [LEAPS], Pamela W. Duncan, PhD, PT, NCT00243919) received from the Archived Clinical Research Dataset website. The LEAPS trial was a three arm, single blinded, phase III randomized controlled trial, which examined the effects of three interventions (early body weight–supported treadmill training at two months post-stroke, late body weight–supported treadmill training at six months post-stroke, and a progressive supervised home exercise program) on self-selected walking speed.4 Adults were screened between 5 and 30 days after experiencing an initial stroke and, after a baseline assessment at two months post-stroke, randomized to one of the three groups. Each intervention consisted of 36 sessions lasting 90 minutes each and performed for a total of 12 to 16 weeks. Results demonstrated no superiority of any treatment group, with 52% of all participants improving their walking speed and attaining clinically meaningful improvements in daily steps at one year post-stroke. Ethical approval for the LEAPS trial was obtained from associated institutional review boards and participants provided informed consent prior to participation.4 The secondary analysis used in the present study was not considered human subjects research and received exemption from the University of South Carolina’s institutional review board.
Criteria for inclusion and exclusion in the LEAPS trial have been reported.4,15 To be included in the trial, participants had to have a first time diagnosis of ischemic or hemorrhagic stroke, be able to walk at least 3m with or without help from another person and have a self-selected walking speed of <0.80m/s. Participant data was collected at multiple time points during the trial but the present study analyzed only data at baseline (two months post-stroke) and one year post-stroke. The six month post-stroke assessment was not included because at this point the late body-weight supported training group had not undergone the intervention and also we aimed to see what factors early after stroke predicted daily steps at one year-post stroke, when spontaneous recovery is less likely.16
Daily Step Counts
Daily steps were measured on two consecutive days at baseline and at one year post-stroke using the highly reliable17 and valid7 StepWatch Activity Monitor (Orthocare Innovations, Oklahoma City, OK, USA). Participants were instructed to wear the monitor on the non-paretic ankle during all waking hours with the exception of water-based activities (e.g., bathing or swimming).18 For step data to be considered valid for the present study, participants needed two days of monitoring19 with an overall average monitor wear time of at least 10 hours20 at both timepoints. The average daily step count for the two days of monitoring was used for analysis. Participants without valid step data were excluded.
Candidate Predictors of Daily Steps – Nonmodifiable
Nonmodifiable factors previously found to be associated with PA in people with stroke were examined as potential predictors of daily steps. These factors included age and gender (males accumulating more PA than females),14 race and/or ethnicity (Hispanics and non-Hispanic black adults obtaining less PA than non-Hispanic whites),21 and initial stroke severity22 (measured at the initial screen using the National Institutes of Health Stroke Scale [NIHSS]).23,24
Candidate Predictors of Daily Steps – Modifiable
Modifiable factors previously found to be associated with PA in people with stroke14 were also examined as potential predictors of daily steps and included:
Walking speed was measured at self-selected25 and fast paced24 speeds. Participants were timed during a 10 m walking section with an untimed 3 m section both preceding and following the timed 10 m section.15
Walking endurance was measured by The Six Minute Walk test,26 which had participants walk as far as they could in 6 minutes using a standardized protocol.27
Lower extremity impairment was measured by the Lower extremity Fugl-Meyer Assessment.28 Scores range from 0 to 34, with higher scores indicating less impairment.
Balance was measured by the Berg Balance Scale (BBS).29 This scale consists of 14-items scored 0 to 4 with a maximum score of 56 (indicative of better balance and mobility).
Cardiorespiratory fitness was measured by an exercise tolerance test (stationary bicycle) performed just prior to randomization.15 Participants began pedaling at 40-60 revolutions per minute with increasing workload increments of 10 watts per minute. The test was stopped when maximum effort was reached (defined as reaching 90% of age predicted maximum heart rate or a rating of perceived exertion30 of 18/20 in those taking beta blockers) or if symptoms limited completion of the test (e.g. a blood pressure reading that warranted cessation of exercise). Exercise duration during the test was recorded and used for analysis.
Participant-perceived balance confidence was measured by the Activities Specific Balance Confidence Scale,31 which asks participants to rank their level of confidence for performing 16 different tasks (e.g. walk around the house and walk up and down a ramp). Scores range from 0 to 100% with higher scores indicating greater balance confidence.
The presence and severity of depressive symptoms were measured using the Patient Health Questionnaire (PHQ-9),32 which consists of 9 items. A score >10 is suggestive of major depression.
Participant-reported mobility was measured by the Stroke Impact Scale (mobility and participation dimensions),33 which examines disability and health related quality of life. Higher scores indicate less disability and greater quality of life.
Daily Steps at two-months post-stroke was also examined as a candidate predictor of future PA and was measured via activity monitor.
Additionally, in older adults, being married,34 employed, and having a higher level of education has also been associated with increased PA35 and were considered candidate predictors of daily steps.
Data Analysis
A priori power analysis using G*Power36 was performed to determine the sample size needed to achieve an R2 value of 0.25 (effect size f2 of 0.33), with 18 tested predictors and power set at 0.80. An R2 value of 0.25 was chosen based on a meta-analysis which showed that most factors explained <30% of the variance in PA in people with stroke.14 The minimum sample size needed to conduct the analysis was determined to be 77 participants.
Demographic variables were reported and compared between participants with valid step data and those without using independent t-tests (age, walking speed) or Mann-Whitney U tests (walking endurance, cardiorespiratory fitness, motor function, balance, balance confidence, participant reported mobility and participation, participant reported depressive symptoms, initial stroke severity) and chi-squared tests (gender, race and/or ethnicity, marital status, employment, education level, stroke type, stroke location, side of stroke). Bonferroni correction was applied due to multiple comparisons.
Univariate analysis using Pearson’s r (or Spearman’s rho [rs] for ordinal data) was performed to determine the association between candidate predictors (independent variables assessed at two months post-stroke) and average daily step counts at one year (dependent variable). Candidate predictors found to be statistically significantly associated (p<0.05) with daily step counts were entered into multivariate analysis with dummy coding applied for categorical predictors. Forward selection stepwise regression determined the strongest predictors (i.e. largest R2 values) of daily steps at one year post-stroke, using a probability of ≤0.05 for a predictor to enter the model and >0.10 for a predictor to be removed. Forward selection was used to minimize the number of predictors in the model and make assessment of such predictors more clinically feasible (i.e. clinicians will need to assess fewer factors to gain insight into future PA levels). If present, factors exhibiting multicollinearity (determined as a variance inflation factor, VIF, >5)37 were removed from model.
Step data at one year post-stroke was used to classify participants into two groups (participants with <6000 and participants with ≥6000 daily steps) and descriptive statistics were calculated. A step count of 6000 was chosen as it has been found to be related to a decreased risk for subsequent cardiovascular disease (i.e. stroke and myocardial infarction) in people with stroke.10 Demographic variables between the two groups were compared through independent t-tests (age, walking speed, daily steps, activity monitor wear time) or Mann-Whitney U tests (walking endurance, cardiorespiratory fitness, motor function, balance, balance confidence, participant reported mobility and participation, participant reported depressive symptoms, initial stroke severity) and chi-squared tests (gender, race and/or ethnicity, marital status, employment, education level, stroke type, stroke location, side of stroke). Bonferroni correction was applied due to multiple comparisons.
To determine a daily step threshold at two months post-stroke (independent variable) which corresponds to obtaining ≥6000 steps at one year post-stroke (dependent variable), receiver operating characteristic (ROC) curves, including the area under the curve (AUC) were generated.38 Sensitivity, specificity, likelihood ratios and Youden’s index (J)39 were calculated. J can be used to identify optimal thresholds for diagnostic tests.40 The highest J value was chosen as the optimal threshold to accurately classify participants as obtaining <6000 or ≥6000 daily steps. All data were analyzed using IBM SPSS Statistics for Macintosh, Version 26.0 (IBM SPSS, Chicago, IL, USA). The present study utilized STROBE reporting guidelines41 (Supplemental Materials).
RESULTS
A flow diagram of how participant data were used is displayed in Figure 1. After removal of participants with invalid data (n=201) and a single outlier (in terms of daily steps), data from 206 participants were analyzed (in Table 1). Included participants averaged 63 years of age with a median self-selected walking speed of 0.42m/s and an average of 2922 daily steps. Participants with valid step data (i.e. included participants) had greater balance (BBS) than those without (i.e. excluded participants) (Table 1).
Figure 1. Flow Diagram of Participant Data.
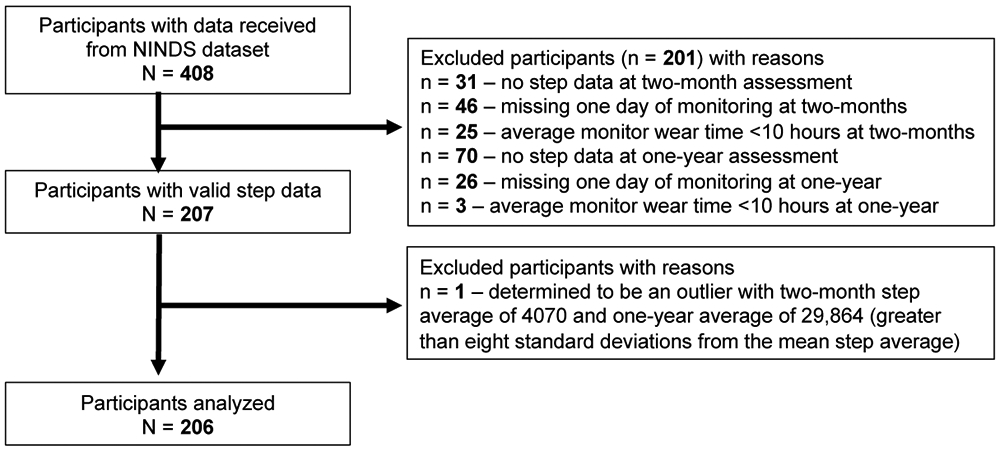
Abbreviations: NINDS, National Institute of Neurologic Disorders and Stroke.
Table 1.
Participant Descriptors At Two Months Post-Strokea
| Descriptor | Participants With Valid Step Data (N=206) |
Participants Without Valid Step Data (N = 201) |
P |
|---|---|---|---|
| Age, years, mean (SD) | 63 (12.7) | 61 (12.6) | 0.083b |
| Male, n (%) | 118 (57.3) | 105 (52.2) | 0.307c |
| Non-Hispanic White, n (%) | 101 (49) | 88 (43.8) | 0.976c |
| Married, n (%) | 128 (62.1) | 104 (51.7) | 0.034c |
| Employed at least part time, n (%) | 104 (50.5) | 107 (53.2) | 0.577c |
| Completed at least some college, n (%) | 117 (56.8) | 87 (43.3) | 0.006c |
| Self-selected walking speed, m/s | 0.42 [0, 0.78] (0.37) | 0.33 [0, 0.78] (.37) | 0.009b |
| Fast walking speed, m/s | 0.55 [0, 1.22] (0.49) | 0.45 [0, 1.23] (0.56) | 0.030b |
| Walking endurance (Six Minute Walk Test), m |
136.5 [0, 315] (113.5) | 108 [0, 324] (125.5) | 0.011d |
| Cardiorespiratory fitness (maximal exercise test), test duration, minutes | 6 [1.5, 14.4] (3.1) | 5.6 [1.3, 13.8] (2.8) | 0.451d |
| Daily steps, mean (SD) | 2922 (2749) | - | - |
| Activity monitor wear time, hours, mean (SD) | 20.8 (4.8) | - | - |
| Motor function (Lower extremity Fugl-Meyer) | 26 [8, 34] (9.2) | 26 [6, 34] (9.4) | 0.696d |
| Balance (Berg Balance Scale) | 41 [0, 56] (18) | 37 [3, 55] (20) | <0.003d |
| Balance confidence (Activities Specific Balance Confidence Scale), % | 48.5 [0, 100] (34.1) | 42.2 [0, 98.7] (32.8) | 0.047d |
| Participant-reported mobility (Stroke Impact Scale) | 61.1 [2.8, 100] (28.5) | 58.3 [2.8, 100] (30.6) | 0.014d |
| Participant-reported participation (Stroke Impact Scale) | 43.8 [0, 100] (32) | 43.8 [0, 100] (33.5) | 0.694d |
| Patient Health Questionnaire (PHQ-9)32 | 3 [0, 24] (5) | 3 [0, 27] (6) | 0.183d |
| Initial stroke severity (NIHSS) | 6 [0, 20] (5) | 7 [2, 18] (5) | 0.030d |
| Stroke type – ischemic, n (%) | 165 (80.1) | 162 (80.6) | 0.867c |
| Stroke location, n (%) | 0.673c | ||
| Right hemisphere | 98 (47.6) | 99 (49.3) | |
| Left hemisphere | 77 (37.4) | 65 (32.3) | |
| Brainstem | 28 (13.6) | 34 (16.9) | |
| Bilateral | 3 (1.5) | 3 (1.5) | |
| Side of stroke – left, n (%) | 89 (43.2) | 74 (36.8) | 0.631c |
Abbreviations: m/s, meters per second; m, meters; NIHSS, National Institutes of Health Stroke Scale
Data presented as median [minimum, maximum] (IQR) unless otherwise stated. Boldface indicates significant after Bonferroni correction, p ≤0.003.
Independent samples t-test, 2-sided
Pearson Chi-Square, 2-sided
Independent samples, Mann-Whitney U test
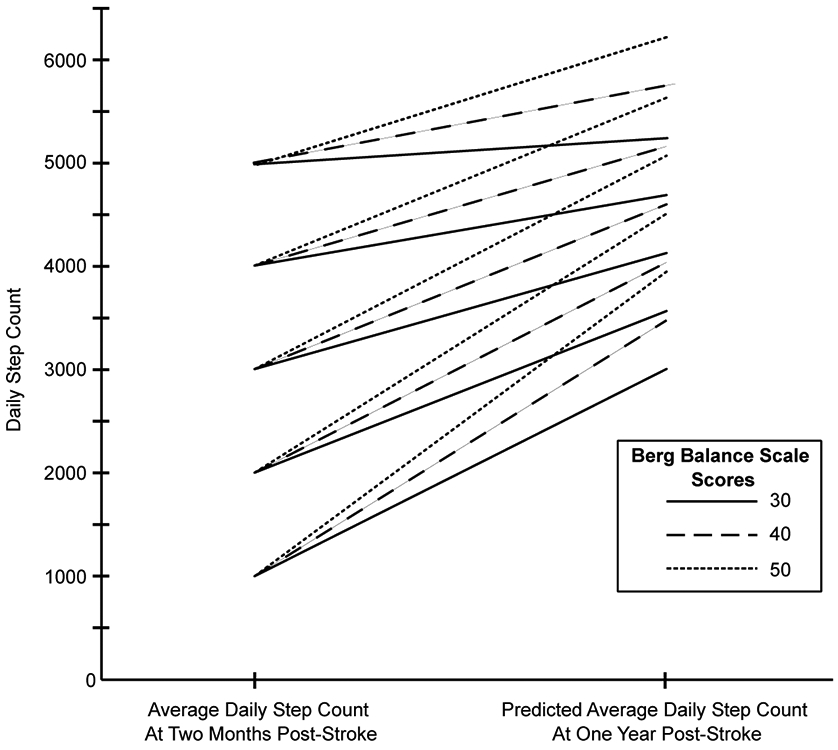
Nine modifiable factors at two months post-stroke were found to be significantly (p=<0.001) associated with daily steps at one year post-stroke: self-selected (r=.371) and fast paced (r=.401) walking speed, walking endurance (r=.476), cardiorespiratory fitness (r=.259), lower extremity impairment (rs=.308), balance (rs=.473), average daily steps at two-months (r=.598), participant reported mobility (rs=.257), and balance confidence (r=.231). The only nonmodifiable factor significantly associated with daily steps at one year post-stroke was initial stroke severity (rs=−.333, p=<0.001). Forward selection regression was performed using these ten factors. The first to enter in the model was average daily steps at two months post-stroke which yielded an adjusted R2 of 0.35. The final model added balance (BBS) and increased the adjusted R2 to 0.38; both models were significant (p=<0.001). No other factors significantly increased R2 and no multicollinearity was observed. Unadjusted scatter plots displaying the relationship between steps at two months, balance and steps at one year are displayed in Figure 2. The final regression equation is below and a graphical representation of the equation is shown in Figure 3.
Figure 2. Relationship Between Daily Steps At One Year Post-Stroke and (A) Daily Steps At Two Months Post-Stroke and (B) Berg Balance Scale Scores.
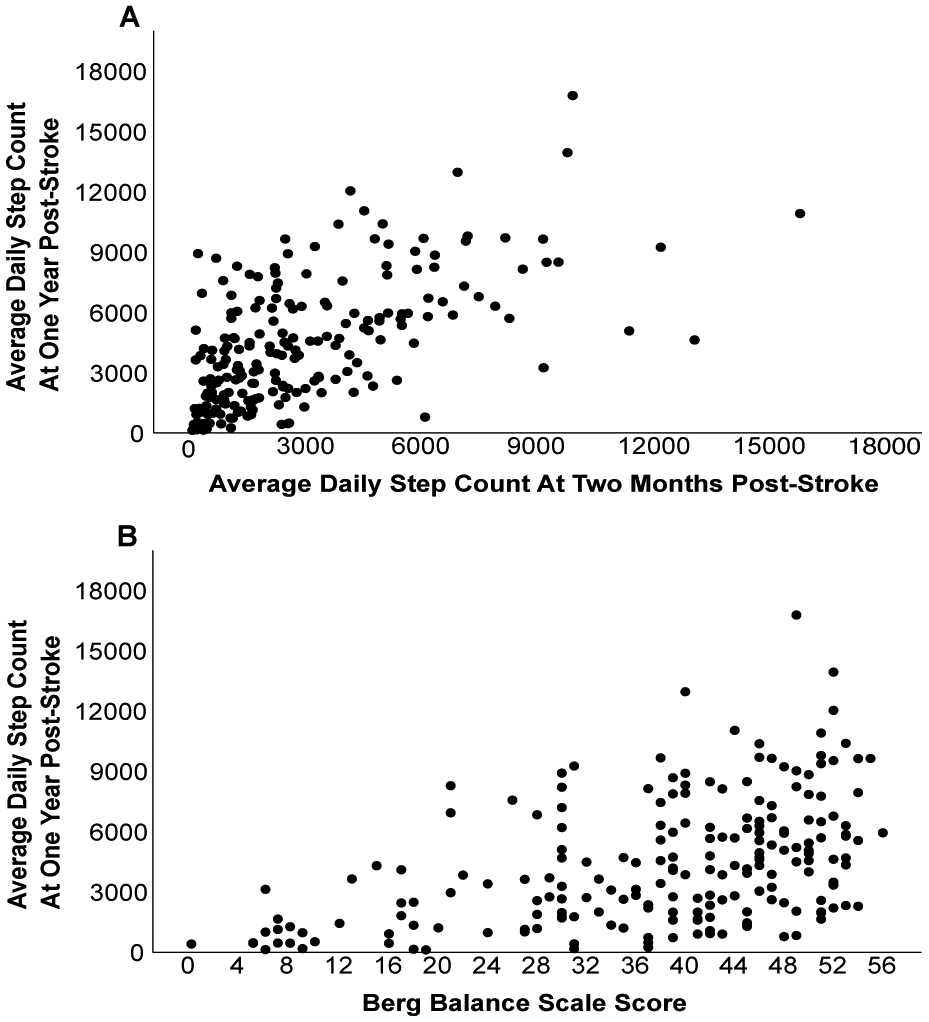
Scatterplots show unadjusted relationships and each dot represents a single participant.
Figure 3. Predicted Average Daily Steps At One Year Post-Stroke Based On Steps At Two Months and Berg Balance Scale Score.
Descriptive data and a comparison of participants with <6000 and ≥6000 daily steps at one year post-stroke is displayed in Table 2. Participants with <6000 daily steps at one year had slower walking speeds, less walking endurance, greater lower extremity impairment, greater balance impairment, less balance confidence, greater self-reported mobility limitations and an increased initial stroke severity at two months post-stroke as compared to those with ≥6000 daily steps. The step count with the highest J value was 1632 steps, which had a corresponding sensitivity of 86% and specificity of 54% (Table 3).
Table 2.
Comparison of Descriptors At Two Months Post-Stroke Between Those With <6000 and ≥6000 Daily Steps At One Year Post-Stroke.a
| Descriptor | Participants With <6000 Daily Steps (n=149) |
Participants With ≥6000 Daily Steps (n=57) |
P |
|---|---|---|---|
| Age, years, mean (SD) | 64 (13) | 61 (12) | 0.151b |
| Male, n (%) | 82 (55) | 36 (63) | 0.292c |
| Non-Hispanic White, n (%) | 75 (50) | 26 (46) | 0.544c |
| Married, n (%) | 89 (60) | 39 (68) | 0.250c |
| Employed at least part time, n (%) | 71 (48) | 33 (58) | 0.188c |
| Completed at least some college, n (%) | 84 (56) | 33 (58) | 0.844c |
| Self-selected walking speed, m/s | 0.38 [0, 0.78] (0.38) | 0.49 [0.10, 0.77] (0.30) | 0.001b |
| Fast walking speed, m/s | 0.49 [0, 1.11] (0.50) | 0.71 [0.14, 1.22] (0.40) | <0.001b |
| Walking endurance (Six Minute Walk Test), m | 121 [0, 315] (103) | 178 [0, 306] (108) | <0.001d |
| Cardiorespiratory fitness (maximal exercise test), test duration, minutes | 5.9 [1.5, 10.7] (3.1) | 6.6 [2.2, 14.4] (3.2) | 0.025d |
| Daily steps at two months post-stroke, mean (SD) | 2218 (2151) | 4761 (3267) | <0.001b |
| Daily steps at one year post-stroke, mean (SD) | 2870 (1704) | 8503 (2059) | <0.001b |
| Activity monitor wear time, hours, mean (SD) | 21.1 (4.7) | 20.1 (5.2) | 0.170b |
| Motor function (Lower extremity Fugl-Meyer) | 25 [9, 34] (10) | 27 [8, 34] (8) | 0.036d |
| Balance (Berg Balance Scale) | 39 [0, 56] (18) | 46 [21, 55] (12) | <0.001d |
| Balance confidence (Activities Specific Balance Confidence Scale), % | 44 [0, 99] (33) | 57 [6, 100] (41)) | 0.020d |
| Participant-reported mobility (Stroke Impact Scale) | 61 [3, 100] (28) | 67 [8, 100] (26) | 0.043d |
| Participant-reported participation (Stroke Impact Scale) | 44 [0, 100] (34) | 44 [6, 100] (30) | 0.838d |
| Patient Health Questionnaire (PHQ-9)32 | 3 [0, 24] (6) | 2 [0, 18] (5) | 0.664d |
| Initial stroke severity (NIHSS) | 7 [0, 20] (4) | 5 [0, 19] (4) | 0.017d |
| Stroke type – ischemic, n (%) | 123 (82.6) | 42 (73.7) | 0.329c |
| Stroke location, n (%) | 0.286c | ||
| Right hemisphere | 70 (47) | 28 (49.1) | |
| Left hemisphere | 59 (39.6) | 18 (31.6) | |
| Brainstem | 17 (11.4) | 11 (19.3) | |
| Bilateral | 3 (2) | 0 | |
| Side of stroke – left, n (%) | 68 (45.6) | 21 (36.8) | 0.301c |
Abbreviations: m/s, meters per second; m, meters; NIHSS, National Institutes of Health Stroke Scale
Data presented as median [minimum, maximum] unless otherwise stated. Boldface indicates significant after Bonferroni correction, p ≤0.002.
Independent samples t-test, 2-sided
Pearson Chi-Square, 2-sided
Independent samples, Mann-Whitney U test.
Table 3.
Accuracy of Daily Step Count At Two-Months Post-Stroke To Classify Who Will Reach ≥6000 Steps At One Year Post-Stroke.a
| Threshold | AUCb (95% CI) |
Sensitivity | Specificity | +LR (95% CI) |
−LR (95% CI) |
|---|---|---|---|---|---|
| Daily Steps 1632 | 0.76 (0.69 to 0.83) | 86% | 54% | 1.86 (1.52 to 2.27) | 0.26 (0.13 to 0.50) |
Abbreviations: AUC, area under the receiver operating characteristics curve; 95% CI, 95% confidence interval; +LR, positive likelihood ratio; −LR, negative likelihood ratio
Using the daily step count threshold of 1632 steps correctly classified 86% (sensitivity) of participants who obtained ≥6000 daily steps at one year post-stroke and 54% (specificity) of participants who did not. Participants who obtained ≥6000 steps at one year were between 1.52 and 2.27 times more likely to average at least 1632 steps at two months post-stroke compared to those who did not obtain 6000 steps. Boldface indicates significant at p <0.001.
An AUC value of 1.0 indicates a perfect diagnostic test, whereas an AUC of 0.5 is equal to chance.
DISCUSSION
The present study utilized longitudinal data from the LEAPS trial to determine which factors present early after stroke were predictive of future PA (i.e. daily steps). A total of 18 nonmodifiable and modifiable factors were examined as potential predictors of daily steps at one year post-stroke, ten of which had significant associations with daily steps. Only daily steps and balance (BBS) at two months post-stroke remained in the final prediction model, which accounted for 38% of the variance in daily steps at one year post-stroke.
A twelve month exercise intervention study found that walking endurance, balance and health related quality of life explained 33% of the variance in daily steps one year later.42 While an R2 value of 33% is similar to our 38%, the previous study involved individuals with chronic stroke as opposed to our study which followed individuals from the subacute (i.e. between two weeks and six months post-stroke) to chronic (i.e. ≥six months post-stroke) phase of stroke.43 While walking ability can be improved years after stroke onset,44 the majority of recovery happens within the first six months.16 Thus, our results may be more pertinent for providers treating individuals with stroke in the sub-acute phase. Evidence supports assessment of both walking ability and balance early and often during stroke recovery. However, if PA is the primary outcome of interest, our results suggest that PA levels should be assessed to gain insight into future PA. While not all providers will have the resources needed to track patients’ PA levels, the assessment of daily steps is becoming easier with the use of commercially available wearables45 that provide users with a single metric that may be used to set goals and track progress with PA.
While participants’ balance scores explained only an additional 3% of the variance in daily steps at one year post-stroke, balance is consistently related to daily steps post-stroke and therefore important to assess. Numerous studies have found that greater balance is related to greater PA, including daily steps.42,46-48 In our sample, participants who did not reach at least 6000 daily steps at one year post-stroke had poorer balance scores (median of 39/56) than those who did reach 6000 steps (median of 46/56) (Table 2). Both elderly adults and individuals with acute stroke who score <45 on the BBS are at a heightened risk for falls49 and this could have negatively impacted PA levels. Previous falls and a fear of falling are associated with reduced daily steps in older adults.50 This finding is supported by the significantly decreased balance confidence scores found for participants with less than 6000 daily steps. Collectively, balance is an important metric to measure after stroke, not only to assess fall risk but also to gain additional insight into future PA levels.
PA is immensely beneficial in all stages of stroke recovery, with performance of additional PA providing additional health benefits.51 Unfortunately, nearly three quarters of our participants did not obtain at least 6000 daily steps at one year-post stroke. The daily step count found in the present study is consistent with other literature52 but also surprising considering our participants engaged in 36 sessions of supervised, structured and progressive exercise. At the six month assessment in the LEAPS trial (the assessment point which was not included in the present study), participants in the supervised home exercise group had greater daily step counts than the other two groups but at one year there were no differences in steps.4 This finding implies that regardless of the intervention, at one year post-stroke the majority of people will exhibit an increase in daily steps, though the magnitude of which may not be sufficient for decreasing cardiovascular events. Importantly, the LEAPS trial’s main purpose was to increase walking speed, not daily walking behavior, and this emphasis may help explain the relatively low levels of walking at one year. There is growing evidence that combining structured exercise (i.e. walking) with a behavioral intervention (i.e. setting daily step goals) improves PA levels after stroke.6 These findings remain to be seen in the acute and subacute phases of rehabilitation, where providers are focused on restoring patient function, perhaps more so than improving overall fitness or PA levels.53 For providers working with individuals in the subacute phase of stroke, encouraging ≥1632 daily steps could serve as a preliminary target that increases the likelihood of reaching ≥6000 daily steps at one year. Future research should examine the effects of having providers during the subacute phase of stroke target ≥1632 daily steps to see if it corresponds to reaching ≥6000 daily steps at one year.
Daily step counts can provide valuable insight into future health outcomes but much of our understanding comes from populations without cardiovascular disease. For example, in adults at risk for type 2 diabetes, increasing daily steps by 2000 was associated with an 8% reduction in cardiovascular events.54 To our knowledge, only one study to date has examined the relationship between step count and subsequent cardiovascular events in people with stroke. Kono et al.10 assessed participants’ daily steps at three months and again at three years post-stroke and found that obtaining less than 6000 daily steps was predictive of future cardiovascular events. Their sample, however, consisted of higher functioning individuals with mild disability from stroke. In contrast, the present sample consisted of participants with a variety of functional levels and only followed participants up to one year-poststroke. As a result, long-term outcomes, such as cardiovascular events could not be assessed. Additional longitudinal studies with longer follow up periods will be required to determine the role daily steps play in terms of subsequent stroke risk, which is a stroke research priority.55
The present study has several limitations. First, potential predictors of PA were limited to those collected in the LEAPS trial. Additional measures (such as less time-consuming balance tests) may have led to more clinically feasible predictors. Factors known to be associated with PA such as motivation46 or fatigue56 were not examined in the LEAPS trial, nor were qualitative components such as outcomes expectations or social support.57 In addition, daily steps was the only measure of PA, which does not encompass other forms of PA nor participant-reported PA. Our findings only apply to participants who adhered to wearing the activity monitor at both timepoints. Because of non-adherence, the original LEAPS sample size of 408 was reduced to 206 for the current analysis. Finally, we chose 6000 daily steps as a metric of a positive outcome (i.e. reduced risk of subsequent cardiovascular event) but this number was based on a single study. Thus, our resulting threshold of 1632 daily steps (at two months post-stroke) that corresponds to obtaining ≥ 6000 steps at one year post-stroke should be used with caution.
CONCLUSION
In summary, the present study found that the strongest predictors of daily steps at one year post-stroke were daily steps and BBS scores assessed at two-months post-stroke. When working with individuals with stroke in the subacute phase, promotion of daily walking, in addition to targeted balance interventions, may lead to future increases in PA. Though there is no consensus as to how many daily steps people with stroke should be taking, a preliminary target for those two months post-stroke is at least 1632 steps per day. Further research examining daily steps in people with stroke is needed to determine effective methods of increasing walking and the role daily steps play in health outcomes.
Supplementary Material
ACKNOWLEDGEMENTS
The authors thank all of the parties involved in the LEAPS trial.
SOURCES OF FUNDING
R.H. is supported by the Promotion of Doctoral Studies - Level I Scholarship from the Foundation for Physical Therapy Research and the Arnold Fellowship from the Arnold School of Public Health, University of South Carolina. E.W.R is supported by the American Heart Association Predoctoral fellowship, the American Physical Therapy Association Health Policy and Administration Section, and the University of South Carolina Office of the V.P. of Research (SPARC). G.H. is supported by the University of South Carolina Behavioral-Biomedical Interface Program (NIGMS/NIH-T32). S.L.F. is supported by the American Physical Therapy Association Health Policy and Administration Section, NIH (NIA) 1R01AG067395-01, NIH (NIA) 1R41AG059475-01A1, NIH (NINDS) 1U01NS102353-01A1. The funders played no role in study design, implementation or reporting of the study. The LEAPS trial was supported by National Institute of Neurological Disorders and Stroke and the National Center for Medical Rehabilitation Research (RO1 NS050506).
NON-STANDARD ABBREVIATIOINIS AND ACRONYMS:
- BBS
Berg Balance Scale
- LEAPS
Locomotor Experience Applied Post-Stroke
- PA
Physical Activity
Footnotes
Disclosures: None
SOCIAL MEDIA: Facebook – ACHE School of Physical Therapy
Contributor Information
Reed Handlery, Arkansas Colleges of Health Education, School of Physical Therapy, 7006 Chad Colley Blvd, Fort Smith, AR 72916 (USA)..
Elizabeth W. Regan, University of South Carolina, Department of Exercise Science, Physical Therapy Program..
Jill C. Stewart, University of South Carolina, Department of Exercise Science, Physical Therapy Program..
Christine Pellegrini, University of South Carolina, Department of Exercise Science..
Courtney Monroe, University of South Carolina, Department of Health Promotion, Education, and Behavior..
Garrett Hainline, University of South Carolina, Department of Exercise Science, Physical Therapy Program..
Kaci Handlery, Arkansas Colleges of Health Education, School of Physical Therapy..
Stacy L. Fritz, University of South Carolina, Department of Exercise Science, Physical Therapy Program..
REFERENCES
- 1.Bohannon RW, Andrews AW, Smith MB. Rehabilitation goals of patients with hemiplegia. Int J Rehabil Res. 1988;11:181–184. [Google Scholar]
- 2.Latham NK, Jette DU, Slavin M, Richards LG, Procino A, Smout RJ, Horn SD. Physical therapy during stroke rehabilitation for people with different walking abilities. Arch Phys Med Rehabil. 2005;86:41–50. [DOI] [PubMed] [Google Scholar]
- 3.Eng JJ, Tang P-F. Gait training strategies to optimize walking ability in people with stroke: a synthesis of the evidence. Expert Rev Neurother. 2007;7:1417–1436. [DOI] [PMC free article] [PubMed] [Google Scholar]
- 4.Duncan PW, Sullivan KJ, Behrman AL, Azen SP, Wu SS, Nadeau SE, Dobkin BH, Rose DK, Tilson JK, Cen S. Body-weight–supported treadmill rehabilitation after stroke. N Engl J Med. 2011;364:2026–2036. [DOI] [PMC free article] [PubMed] [Google Scholar]
- 5.Pang MY, Eng JJ, Dawson AS, Gylfadóttir S. The use of aerobic exercise training in improving aerobic capacity in individuals with stroke: a meta-analysis. Clin Rehabil. 2006;20:97–111. doi: 10.1191/0269215506cr926oa [DOI] [PMC free article] [PubMed] [Google Scholar]
- 6.Danks KA, Pohlig R, Reisman DS. Combining Fast-Walking Training and a Step Activity Monitoring Program to Improve Daily Walking Activity After Stroke: A Preliminary Study. Arch Phys Med Rehabil. 2016;97:S185–93. doi: 10.1016/j.apmr.2016.01.039 [DOI] [PMC free article] [PubMed] [Google Scholar]
- 7.Fulk GD, Combs SA, Danks KA, Nirider CD, Raja B, Reisman DS. Accuracy of 2 activity monitors in detecting steps in people with stroke and traumatic brain injury. Phys Ther. 2014;94:222–229. doi: 10.2522/ptj.20120525 [DOI] [PubMed] [Google Scholar]
- 8.Holleran CL, Bland MD, Reisman DS, Ellis TD, Earhart GM, Lang CE. Day-to-Day Variability of Walking Performance Measures in Individuals Poststroke and Individuals With Parkinson Disease. J Neurol Phys Ther. 2020;44:241–247. [DOI] [PMC free article] [PubMed] [Google Scholar]
- 9.Shaughnessy M, Michael KM, Sorkin JD, Macko RF. Steps after stroke: capturing ambulatory recovery. Stroke. 2005;36:1305–1307. doi: 10.1161/01.STR.0000166202.00669.d2 [DOI] [PubMed] [Google Scholar]
- 10.Kono Y, Kawajiri H, Kamisaka K, Kamiya K, Akao K, Asai C, Inuzuka K, Yamada S. Predictive impact of daily physical activity on new vascular events in patients with mild ischemic stroke. Int J Stroke. 2015;10:219–223. [DOI] [PubMed] [Google Scholar]
- 11.Pennlert J, Eriksson M, Carlberg B, Wiklund P-G. Long-Term Risk and Predictors of Recurrent Stroke Beyond the Acute Phase. Stroke. 2014;45:1839–1841. doi: 10.1161/STROKEAHA.114.005060 [DOI] [PubMed] [Google Scholar]
- 12.Aarnio K, Haapaniemi E, Melkas S, Kaste M, Tatlisumak T, Putaala J. Long-term mortality after first-ever and recurrent stroke in young adults. Stroke. 2014;45:2670–2676. [DOI] [PubMed] [Google Scholar]
- 13.Lee BI, Nam HS, Heo JH, Kim DI. Yonsei stroke registry. Cerebrovasc Dis. 2001;12:145–151. [DOI] [PubMed] [Google Scholar]
- 14.Thilarajah S, Mentiplay BF, Bower KJ, Tan D, Pua YH, Williams G, Koh G, Clark RA. Factors associated with post-stroke physical activity: a systematic review and meta-analysis. Arch Phys Med Rehabil. 2018;99:1876–1889. [DOI] [PubMed] [Google Scholar]
- 15.Duncan PW, Sullivan KJ, Behrman AL, Azen SP, Wu SS, Nadeau SE, Dobkin BH, Rose DK, Tilson JK. Protocol for the Locomotor Experience Applied Post-stroke (LEAPS) trial: a randomized controlled trial. BMC Neurol. 2007;7:39. doi: 10.1186/1471-2377-7-39 [DOI] [PMC free article] [PubMed] [Google Scholar]
- 16.Kwakkel G, Kollen B, Lindeman E. Understanding the pattern of functional recovery after stroke: facts and theories. Restor Neurol Neurosci. 2004;22:281–299. [PubMed] [Google Scholar]
- 17.Mudge S, Stott NS. Test—retest reliability of the StepWatch Activity Monitor outputs in individuals with chronic stroke. Clin Rehabil. 2008;22:871–877. doi: 10.1177/0269215508092822 [DOI] [PubMed] [Google Scholar]
- 18.Barak S, Wu SS, Dai Y, Duncan PW, Behrman AL. Adherence to Accelerometry Measurement of Community Ambulation Poststroke. Phys Ther. 2014;94:101–110. doi: 10.2522/ptj.20120473 [DOI] [PMC free article] [PubMed] [Google Scholar]
- 19.Fini NA, Burge AT, Bernhardt J, Holland AE. Two days of measurement provides reliable estimates of physical activity poststroke: an observational study. Arch Phys Med Rehabil. 2019;100:883–890. [DOI] [PubMed] [Google Scholar]
- 20.Colley R, Gorber SC, Tremblay MS. Quality control and data reduction procedures for accelerometry-derived measures of physical activity. Heal reports. 2010;21:63. [PubMed] [Google Scholar]
- 21.Watson KB, Carlson SA, Gunn JP, Galuska DA, O’Connor A, Greenlund KJ, Fulton JE. Physical inactivity among adults aged 50 years and older—United States, 2014. Morb Mortal Wkly Rep. 2016;65:954–958. [DOI] [PubMed] [Google Scholar]
- 22.Jørgensen HS, Nakayama H, Raaschou HO, Vive-Larsen J, Støier M, Olsen TS. Outcome and time course of recovery in stroke. Part I: Outcome. The Copenhagen stroke study. Arch Phys Med Rehabil. 1995;5:399–405. [DOI] [PubMed] [Google Scholar]
- 23.Brott T, Adams HP Jr, Olinger CP, Marler JR, Barsan WG, Biller J, Spilker J, Holleran R, Eberle R, Hertzberg V. Measurements of acute cerebral infarction: a clinical examination scale. Stroke. 1989;20:864–870. [DOI] [PubMed] [Google Scholar]
- 24.Goldstein LB, Bertels C, Davis JN. Interrater reliability of the NIH stroke scale. Arch Neurol. 1989;46:660–662. [DOI] [PubMed] [Google Scholar]
- 25.Green J, Forster A, Young J. Reliability of gait speed measured by a timed walking test in patients one year after stroke. Clin Rehabil. 2002;16:306–314. [DOI] [PubMed] [Google Scholar]
- 26.Eng JJ, Dawson AS, Chu KS. Submaximal exercise in persons with stroke: test-retest reliability and concurrent validity with maximal oxygen consumption1. Arch Phys Med Rehabil. 2004;85:113–118. [DOI] [PMC free article] [PubMed] [Google Scholar]
- 27.Pohl PS, Duncan PW, Perera S, Liu W, Lai SM, Studenski S, Long J. Influence of stroke-related impairments on performance in 6-minute walk test. J Rehabil Res Dev. 2002;39:439–444. [PubMed] [Google Scholar]
- 28.Sanford J, Moreland J, Swanson LR, Stratford PW, Gowland C. Reliability of the Fugl-Meyer assessment for testing motor performance in patients following stroke. Phys Ther. 1993;73:447–454. [DOI] [PubMed] [Google Scholar]
- 29.Tyson SF, DeSouza LH. Reliability and validity of functional balance tests post stroke. Clin Rehabil. 2004;18:916–923. [DOI] [PubMed] [Google Scholar]
- 30.Borg G Borg’s Perceived Exertion and Pain Scales. Human kinetics; 1998. [Google Scholar]
- 31.Powell LE, Myers AM. The activities-specific balance confidence (ABC) scale. Journals Gerontol Ser A Biol Sci Med Sci. 1995;50:M28–M34. [DOI] [PubMed] [Google Scholar]
- 32.Kroenke K, Spitzer RL, Williams JBW. The PHQ-9: validity of a brief depression severity measure. J Gen Intern Med. 2001;16:606–613. [DOI] [PMC free article] [PubMed] [Google Scholar]
- 33.Duncan PW, Wallace D, Lai SM, Johnson D, Embretson S, Laster LJ. The stroke impact scale version 2.0: evaluation of reliability, validity, and sensitivity to change. Stroke. 1999;30:2131–2140. [DOI] [PubMed] [Google Scholar]
- 34.Pettee K, Brach J, Kriska A, Boudreau R, Richardson C, Colbert L, Satterfield S, Visser M, Harris T, Ayonayon H. Influence of marital status on physical activity levels among older adults. Med Sci Sport Exerc. 2006;38:541–546. [DOI] [PubMed] [Google Scholar]
- 35.Lim K, Taylor L. Factors associated with physical activity among older people—a population-based study. Prev Med (Baltim). 2005;40:33–40. [DOI] [PubMed] [Google Scholar]
- 36.Faul F, Erdfelder E, Lang A-G, Buchner A. G* Power 3: A flexible statistical power analysis program for the social, behavioral, and biomedical sciences. Behav Res Methods. 2007;39:175–191. [DOI] [PubMed] [Google Scholar]
- 37.Kutner MH, Nachtsheim CJ, Neter J, Li W. Applied Linear Statistical Models. Vol 103. [Google Scholar]
- 38.Hanley JA, McNeil BJ. The meaning and use of the area under a receiver operating characteristic (ROC) curve. Radiology. 1982;143:29–36. [DOI] [PubMed] [Google Scholar]
- 39.Youden WJ. Index for rating diagnostic tests. Cancer. 1950;3:32–35. [DOI] [PubMed] [Google Scholar]
- 40.Aoki K, Misumi J, Kimura T, Zhao W, Xie T. Evaluation of cutoff levels for screening of gastric cancer using serum pepsinogens and distributions of levels of serum pepsinogen I, II and of PG I/PG II ratios in a gastric cancer case-control study. J Epidemiol. 1997;7:143–151. [DOI] [PubMed] [Google Scholar]
- 41.Von Elm E, Altman DG, Egger M, Pocock SJ, Gøtzsche PC, Vandenbroucke JP. The Strengthening the Reporting of Observational Studies in Epidemiology (STROBE) statement: guidelines for reporting observational studies. Ann Intern Med. 2007;147:573–577. [DOI] [PubMed] [Google Scholar]
- 42.Tiedemann A, Sherrington C, Dean CM, Rissel C, Lord SR, Kirkham C, O’Rourke SD. Predictors of Adherence to a Structured Exercise Program and Physical Activity Participation in Community Dwellers after Stroke. Stroke Res Treat. 2012;2012:1–8. doi: 10.1155/2012/136525 [DOI] [PMC free article] [PubMed] [Google Scholar]
- 43.Kiran S What is the nature of poststroke language recovery and reorganization? Int Sch Res Not. 2012;2012. [DOI] [PMC free article] [PubMed] [Google Scholar]
- 44.Peurala SH, Karttunen AH, Sjögren T, Paltamaa J, Heinonen A. Evidence for the effectiveness of walking training on walking and self-care after stroke: a systematic review and meta-analysis of randomized controlled trials. J Rehabil Med. 2014;46:387–399. [DOI] [PubMed] [Google Scholar]
- 45.Schaffer SD, Holzapfel SD, Fulk G, Bosch PR. Step count accuracy and reliability of two activity tracking devices in people after stroke. Physiother Theory Pract. 2017;33:788–796. doi: 10.1080/09593985.2017.1354412 [DOI] [PubMed] [Google Scholar]
- 46.Thilarajah S, Bower KJ, Pua Y-H, Tan D, Williams G, Larik A, Bok C-W, Koh G, Clark RA. Modifiable Factors Associated With Poststroke Physical Activity at Discharge From Rehabilitation: Prospective Cohort Study. Phys Ther. 2020;100:818–828. [DOI] [PubMed] [Google Scholar]
- 47.Fulk GD, He Y, Boyne P, Dunning K. Predicting Home and Community Walking Activity Poststroke. Stroke. 2017;48:406–411. doi: 10.1161/STROKEAHA.116.015309 [DOI] [PubMed] [Google Scholar]
- 48.Michael KM, Allen JK, Macko RF. Reduced ambulatory activity after stroke: the role of balance, gait, and cardiovascular fitness. Arch Phys Med Rehabil. 2005;86:1552–1556. [DOI] [PubMed] [Google Scholar]
- 49.Berg K, Wood-Dauphinee S, Williams JI. The Balance Scale: reliability assessment with elderly residents and patients with an acute stroke. Scand J Rehabil Med. 1995;27:27–36. [PubMed] [Google Scholar]
- 50.Jefferis BJ, Iliffe S, Kendrick D, Kerse N, Trost S, Lennon LT, Ash S, Sartini C, Morris RW, Wannamethee SG et al. How are falls and fear of falling associated with objectively measured physical activity in a cohort of community-dwelling older men? BMC Geriatr. 2014;14:114. doi: 10.1186/1471-2318-14-114 [DOI] [PMC free article] [PubMed] [Google Scholar]
- 51.Billinger SA, Arena R, Bernhardt J, Eng JJ, Franklin BA, Johnson CM, MacKay-Lyons M, Macko RF, Mead GE, Roth EJ et al. Physical Activity and Exercise Recommendations for Stroke Survivors. Stroke. 2014;45:2532–2553. doi: 10.1161/STR.0000000000000022 [DOI] [PubMed] [Google Scholar]
- 52.Fini NA, Holland AE, Keating J, Simek J, Bernhardt J. How Physically Active Are People Following Stroke? Systematic Review and Quantitative Synthesis. Phys Ther. 2017;97:707–717. doi: 10.1093/ptj/pzx038 [DOI] [PubMed] [Google Scholar]
- 53.Jette DU, Latham NK, Smout RJ, Gassaway J, Slavin MD, Horn SD. Physical therapy interventions for patients with stroke in inpatient rehabilitation facilities. Phys Ther. 2005;85:238–248. [PubMed] [Google Scholar]
- 54.Yates T, Haffner SM, Schulte PJ, Thomas L, Huffman KM, Bales CW, Califf RM, Holman RR, McMurray JJ V, Bethel MA et al. Association between change in daily ambulatory activity and cardiovascular events in people with impaired glucose tolerance (NAVIGATOR trial): a cohort analysis. Lancet (London, England). 2014;383:1059–1066. doi: 10.1016/S0140-6736(13)62061-9 [DOI] [PubMed] [Google Scholar]
- 55.Pollock A, St George B, Fenton M, Firkins L. Top ten research priorities relating to life after stroke. Lancet Neurol. 2012;11:209. [DOI] [PubMed] [Google Scholar]
- 56.Braaten RS, Askim T, Gunnes M, Indredavik B. Fatigue and activity after stroke. Secondary results from the Life After Stroke study. Physiother Res Int.:e1851. [DOI] [PubMed] [Google Scholar]
- 57.Bailey R Examining daily physical activity in community-dwelling adults with stroke using social cognitive theory: an exploratory, qualitative study. Disabil Rehabil. Published online 2019:1–9. [DOI] [PMC free article] [PubMed] [Google Scholar]
Associated Data
This section collects any data citations, data availability statements, or supplementary materials included in this article.