

Abstract
Rationale:
In recent years, it has been demonstrated that a pathological change in the gut microbiota, termed gut dysbiosis, can be an underlying factor for the development of hypertension. Prevention of this dysbiosis can attenuate or abolish hypertension. Translational mechanisms to prevent gut dysbiosis as well as understanding of the mechanisms linking gut dysbiosis to hypertension are lacking.
Objective:
We first examined the efficacy of intermittent fasting (IF) in altering the gut microbiota and lowering blood pressure (BP). Next, we utilized a multi-omics approach to examine microbial influenced metabolites that may serve as the link between the gut microbiota and host BP regulation.
Methods and Results:
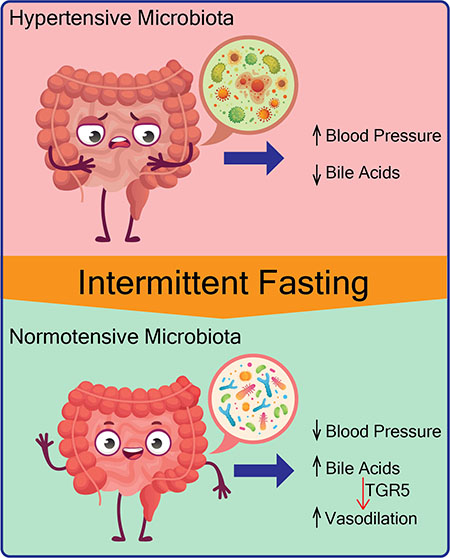
We demonstrate that IF significantly altered the makeup of the gut microbiota, cecal and plasma metabolome, and prevented the development of hypertension in the spontaneously hypertensive stroke-prone rat (SHRSP). The beneficial effects of IF were shown to be due to alterations of the gut microbiota through germ-free (GF) transplantation studies. GF rats receiving microbiota from IF SHRSP had significantly lower BP as compared to GF rats receiving microbiota from ad libitum fed SHRSPs. Through whole genome shotgun sequence analysis of the microbiota and untargeted metabolomics of cecal content and plasma we identified bile acid (BA) metabolism as a potential mediator in BP regulation. Finally, we show supplementation with cholic acid, or activation of the G protein-coupled BA receptor (TGR5), significantly reduced BP of the SHRSP.
Conclusions:
These studies demonstrate the BP lowering effects of IF involves manipulation of the gut microbiota and metabolome, and implicates disrupted BA signaling as novel mechanisms by which gut dysbiosis contributes to hypertension.
Keywords: microbiota, dysbiosis, metabolomics, bile acids, intermittent fasting, Hypertension, Diet and nutrition, Physiology, Animal models of human disease, Basic science research
Graphical Abstract
Introduction
Emerging evidence suggests that disruption of the gut microbiota, termed gut dysbiosis, can have adverse effects beyond the gastrointestinal tract. Our laboratory and others have demonstrated gut dysbiosis in animal models of hypertension (HT)1–5. Furthermore, transplant of dysbiotic gut microbiota from hypertensive subjects and animal models to normotensive animals increases blood pressure (BP) in the recipients, demonstrating a causal role of gut dysbiosis in the development of hypertension6,7. With this understanding, researching mechanisms to manipulate the microbiota in order to improve host BP has become a major focus of the field. One particular interesting therapy, intermittent fasting (IF), has been shown to alter the gut microbiota. In this publication, we test the hypothesis that IF reduces BP in the spontaneously hypertensive stroke-prone rat (SHRSP) by altering the makeup of the gut microbiota. If this hypothesis were found to be true, we sought to examine microbial metabolites that may serve as the link between the gut microbiota and BP regulation.
IF has been shown to have multiple beneficial effects in metabolic disorders, cancer and aging8–12. With the understanding that diet, both in terms of composition and feeding pattern, influences the composition of the gut microbiota, recent studies have begun to consider whether the beneficial effects of IF are mediated through the microbiota11,13,14. It has been suggested that IF modulation of the gut microbiota is involved in adipose tissue browning, reducing insulin resistance, and preventing CNS inflammation in obese and diabetic animal models14–16. Clinical studies evaluating the long-term effects of IF and cardiovascular health are limited, but overall IF appears to be beneficial. IF has been shown to reduce body weight, LDL cholesterol, BP, and risk of coronary artery disease17,18. However, the mechanisms underlying the beneficial effects of IF on BP are unknown.
To gain a thorough understanding of the meta-organismal effects of IF we employed a multi-omics approach of whole genome shotgun sequencing of the gut microbiota and untargeted metabolomics of host plasma and cecal content. We demonstrate that every other day fasting (EODF) significantly shifts the makeup of the gut microbiota, cecal metabolome and plasma metabolome of Wister-Kyoto rat (WKY) and SHRSP, which is associated with the prevention of HT in SHRSPs. We identify bile acids (BAs) as potential mediators in the microbe-host interactome involved in BP regulation. Targeted measurement of BAs in plasma revealed significantly lower concentrations of several BAs in SHRSP as compared to WKY. Methods to increase plasma BAs, including EODF and cholic acid supplementation reduced SHRSP systolic BP (SBP). BAs in the systemic circulation act as hormones by stimulating BA receptors, such as the G protein-coupled BA receptor (TGR5), on a variety of cell types. We demonstrate that an agonist of TGR5, oleanolic acid (OA), improved vascular function and reduced SBP of SHRSP. These studies examine the molecular underpinnings of the effects of IF on the microbiota and BP. We identify impaired BA metabolism in the SHRSP that, when manipulated, can improve BP.
Methods
The data that support the findings of this study are available from the corresponding author upon reasonable request. The whole-genome shotgun raw sequence data are available from NCBI Sequence Read Archive under BioProject PRJNA692044. An expanded Materials and Methods section can be found in the Online Supplement.
Results
Every other day fasting attenuates elevated BP in SHRSP
At 5 weeks of age, WKY and SHRSP rats were randomized to ad libitum feeding (control) or EODF groups. EODF rats were exposed to alternating 24-hours of ad libitum food access followed by 24-hours of no food access (Fig. 1A). Food intake, daily and cumulative, were not different between WKY and SHRSP control groups (Fig. 1B and C). On days of feeding, WKY and SHRSP EODF groups consumed more food than their respective control groups, and SHRSP EODF consumed significantly more than WKY EODF (Fig. 1B). Throughout the 10-week protocol SHRSP EODF had significantly greater food intake as compared to WKY EODF (Fig. 1C). Total food consumed at completion of the study was significantly reduced by EODF in WKY (35% reduction) and SHRSP (27% reduction), relative to their respective controls (Fig. 1C). This reduced food intake resulted in significantly lower body weight in WKY and SHRSP EODF groups, relative to controls. However, despite similar food intake of SHRSP vs. WKY controls, SHRSP controls had significantly lower body weights. This observation is in line with previous studies demonstrating metabolic dysfunction in SHRSPs43.
Figure. 1. EODF attenuates elevated BP in SHRSP.
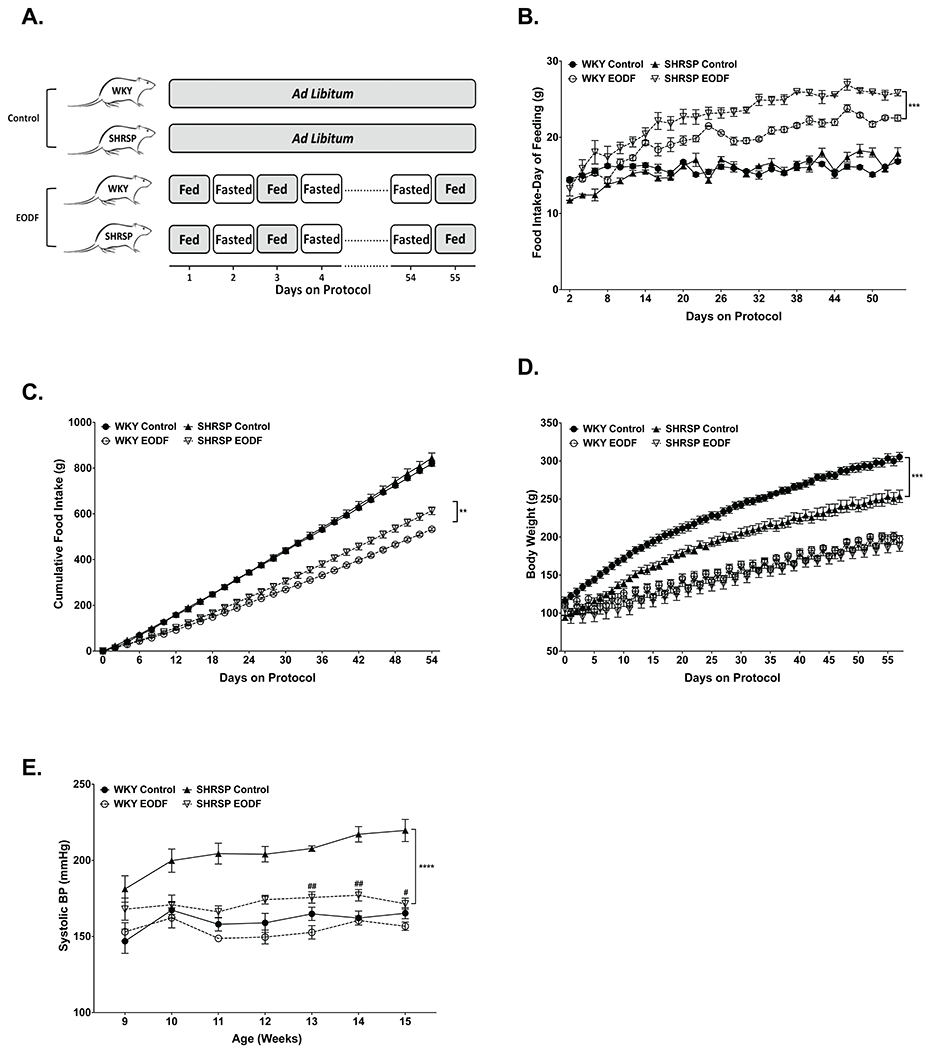
(a) Diagram depicting feeding schedule for control and EODF groups. (b)Daily and (c) cumulative food intake. (d) Body weights were measured daily over the course of the study. (e) Weekly SBP of WKY and SHRSP fed ad libitum or EODF. Data presented as mean ± SEM. Three-way ANOVA with Tukey’s multiple comparisons test. Main effects of strain, feeding group, age, age x strain, age x diet, age x strain x feeding group p≤0.05 for all (b-d). n=6-8, **p≤0.01, ***p≤0.0005, ****p≤0.0001, #p≤0.05 vs SHRSP Control, ##p≤0.005 vs SHRSP Control
Beginning at 9 weeks old, SBP was measured weekly in all groups. SHRSP control showed significantly higher SBP when compared to WKY controls. However, EODF significantly reduced SBP in SHRSPs, with an average 40mmHg decrease over the final 3 weeks of the study as compared to SHRSP controls (Fig. 1E). Three-way ANOVA followed by multiple comparisons showed SBP of SHRSP EODF was not significantly different from WKY control at any time point. EODF had no significant effect on the SBP of WKY rats (Fig. 1E). To examine if EODF prevented end organ damage in SHRSPs, we measured expression levels of the inflammatory markers Il6 and Ccl2 in the kidney and brain. We found no significant difference between WKY and SHRSP controls for either marker in kidney or brain (Online Figure I). This is likely due to the young age of these rats (15 weeks old) and the fact that these rats were not salt loaded. Despite this a main effect of diet was observed for Il6 in the kidney and Ccl2 in the brain, with lower expression of each in EODF groups. These data may suggest a protective effect of EODF if continued to a more advanced age.
Restructuring of the gut microbiota by EODF
Models of IF, including EODF, have been shown to cause alterations to the microbiota as well as host physiology11. In order to determine if the effects of EODF on SBP can be attributed to the microbiota alone, cecal contents collected from WKY and SHRSP control and EODF groups were transplanted into germ-free (GF) rats by oral gavage. Three-way ANOVA showed no significant effect of donor strain or feeding regimen on recipient body weight (Fig. 2A).
Figure. 2. EODF prevents elevated SBP in SHRSPs through manipulation of the gut microbiota.
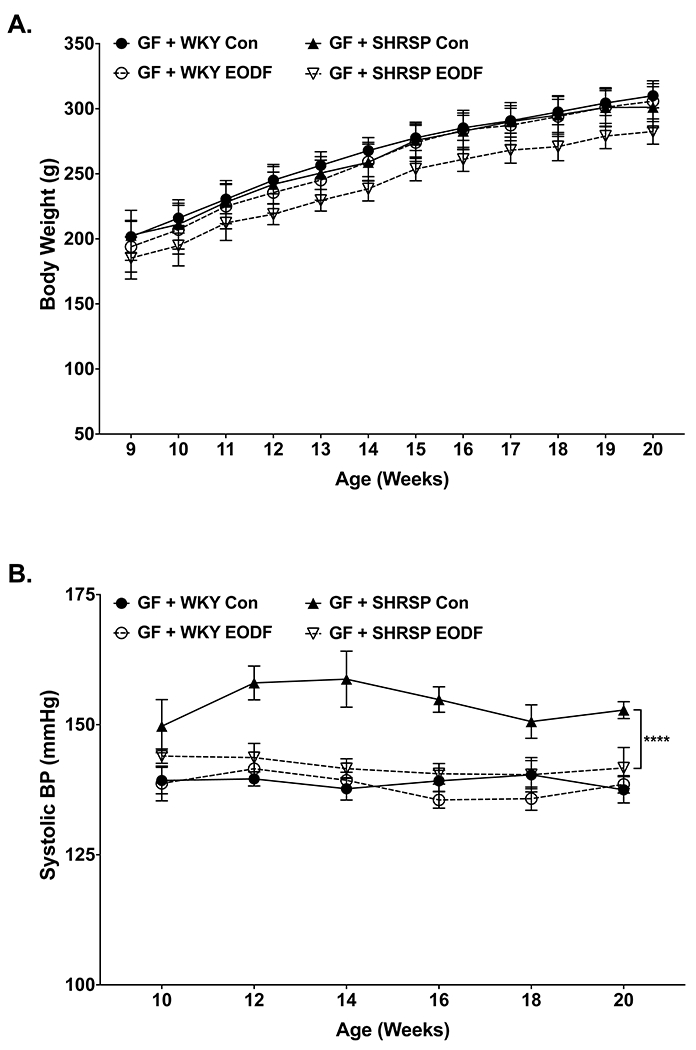
Weekly (a) body weight and (b) SBP of germ-free rats transplanted with microbiota from WKY and SHRSP controls or EODF. Data presented as mean ± SEM. Three-way ANOVA with Tukey’s multiple comparisons test. Main effects of strain, feeding group, strain x feeding group p≤0.0001 for (b). n=6-8, ****p≤0.0001
Beta-diversity of donors and recipients are presented in Online Figure II. Panels in A demonstrate the largest separation between groups on the PC1 axis is due to donor versus recipient differences, with donor rats segregating to the right in both panels. We also observed that community structure was significantly different between germ-free rats that received microbiota from SHRSP control versus SHRSP EODF (Online Figure IIB right panel). These data demonstrate that transfer of microbiota to germ-free rats did not completely recapitulate the community structure observed in donor rats. However, communities were still significantly different based on donor genotype and feeding regimen.
Similar to their microbiota donors, GF rats receiving SHRSP control microbiota exhibited significantly higher SBP as compared to those that received WKY control microbiota (Fig 2B). GF rats receiving SHRSP EODF microbiota exhibited significantly lower SBP as compared to SHRSP control recipients and were not significantly different from WKY control recipients (Fig. 2B). These findings demonstrate alterations to the SHRSP microbiota induced by EODF are sufficient to elicit the SBP lowering effect of EODF.
To examine differences between the WKY and SHRSP microbiota and the effects of EODF we performed whole genome shotgun sequencing (WGS) on cecal content isolated from rats after 10 weeks of control or EODF feeding regimens. Measures of alpha diversity showed no significant differences between groups (Online Figure IIIC–D). Bacterial load in the cecum was significantly increased in SHRSP versus WKY control, and not changed by EODF (Online Figure IIIE).
Bray-Curtis dissimilarity analysis identified significant differences in the community structure of the four groups (Fig. 3A). The left panel of Figure 3A includes all four groups and shows the rat strain contributes greater to community differences than the feeding regimen. Note that SHRSP control (red) were segregated and removed from the WKY (blue and purple), and that SHRSP EODF (green) were clustered closer to WKY. However, the middle and right panels of Figure 3A show that EODF significantly alters the community structure of WKY and SHRSP, respectively. Comparison of the major phyla between the four groups showed a significant main effect of strain for Actinobacteria, Bacteroidetes, Firmicutes, and Proteobacteria (Fig. 3B and Online Figure IV). In control fed rats, Bacteroidetes were significantly reduced in SHRSP as compared to WKY. Conversely, Proteobacteria, and Actinobacteria were significantly increased in SHRSP control versus WKY control rats. Of particular interest, the increased abundance of Proteobacteria observed in SHRSP controls was significantly reduced by EODF (Fig. 3B and Online Figure IVA). The reduction of Proteobacteria in SHRSP by EODF was largely driven by decreased abundance of the genus Parasutterella (Online Figure IVB).
Figure. 3. The dysbiotic gut microbiota of SHRSP is altered by EODF.
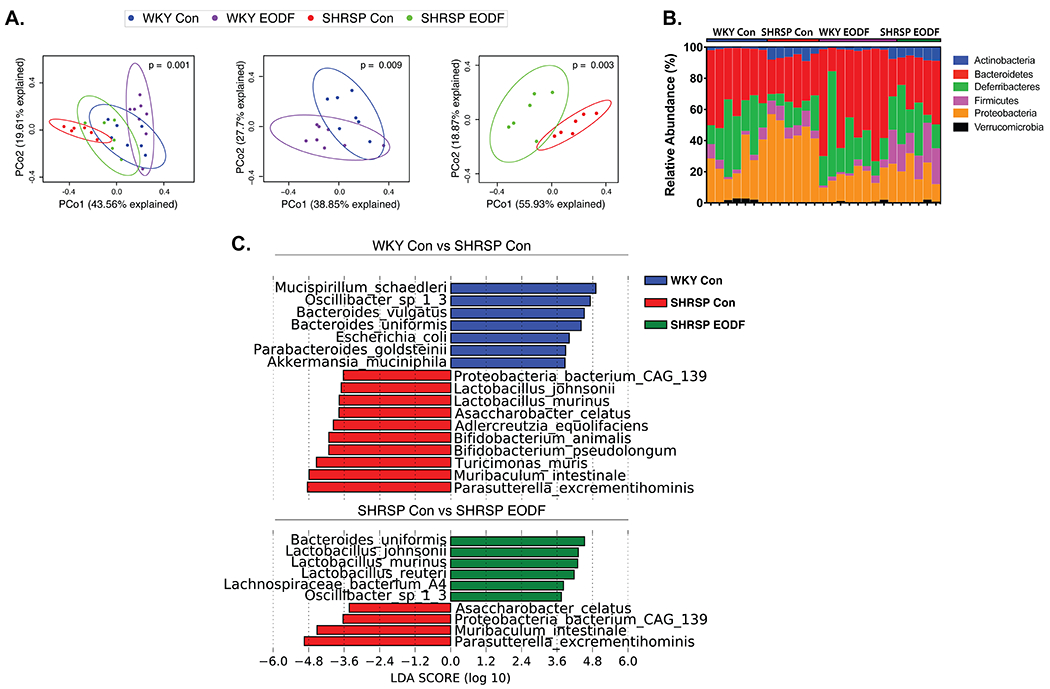
(a) Principal Coordinate Analysis plots of Bray-Curtis dissimilarity of four groups (left), WKY (middle), and SHRSP (right). (b) Relative abundance of taxa at phyla level for individual samples. (c) LEfSe plots to identify species that characterize control groups (top) and effects of EODF on SHRSP (bottom). n=6-8
To identify species that characterize WKY control vs. SHRSP control, or SHRSP control vs. SHRSP EODF, we performed linear discriminate effect size (LEfSe) analysis (Fig. 3C). Somewhat surprisingly, SHRSP controls were characterized by a number of species belonging to genera traditionally classified as beneficial microbes including Lactobacillus and Bifidobacterium. Interestingly, several species found to be significantly different between WKY and SHRSP controls, or EODF-related, are known to play a role in BA metabolism including L.johnsonii, L.murinis, L.reuteri, B.animalis, B.pseudolongum, B.vulgatus, B. uniformis, and P.excrementehominis44–49.
Given the significant differences in cecal microbial communities between the four groups, we examined the architecture of the cecum wall and markers of inflammation in the ileum and colon wall. We observed no significant effect of genotype or feeding regimen on cecum goblet cell numbers or mucosa layer thickness (Online Figure VA and B). In the ileum, a significant main effect of genotype was observed for Muc2, Tlr2, Il1a, Cyba, and Cldn4 mRNA levels (Online Figure VC). Tlr2 was higher in SHRSP control ileum compared to WKY control, and was significantly reduced in SHRSP by EODF. In the colon, a main effect of genotype was found for Muc2, Tlr2, Il1α, Il1β, and Ncf1 (Online Figure VD). These findings suggest differences in the inflammatory state of WKY and SHRSP controls, with potentially increased inflammation in the ileum, and decreased inflammation in the colon. EODF tended to decrease markers of inflammation in both ileum and colon.
Restructuring of the cecal and plasma metabolome by EODF
Gut-derived metabolites serve as key components underlying the interactions between the gut microbiota and host. Previous investigations of potential links between gut dysbiosis and HT has identified a number of microbial products and metabolites that may influence BP, including short-chain fatty acids, endotoxins, and uremic toxins5,50–53. However, these studies have used a targeted approach of examining the role of a few select microbial products5,50–53. It is estimated that the microbiota is responsible for generating or modifying over 100 different metabolites present in plasma54. Therefore, it is likely that a large number of microbial metabolites involved in BP regulation have gone unidentified. To gain a more comprehensive understanding of metabolites that may contribute to host BP regulation we performed untargeted metabolomics of plasma and cecal content of all four groups.
To examine the validity of analyzing relationships between our WGS and metabolomics datasets we used Data Integration Analysis for Biomarker discovery using Latent variable approaches for ‘Omics studies (DIABLO). Using this integrated multi-omics approach, we identified high correlations between taxonomic profiles, microbial function, and plasma and cecal metabolomes (bottom diagonals of Fig. 4A). For each omics dataset, the first principal component that maximized the variation of the dataset was calculated. When the first component for each dataset was plotted against the first component of every other dataset, SHRSP control demonstrated distinct correlation profiles, and EODF shifted SHRSP in all cases to resemble that of WKY control and EODF (top diagonals of Fig. 4A). These results indicate a strong relationship between the microbiota and metabolome and demonstrate the value of studying microbial metabolites as a link for microbe-host interaction.
Figure. 4. Multi-omics integration of WGS and untargeted metabolomics.
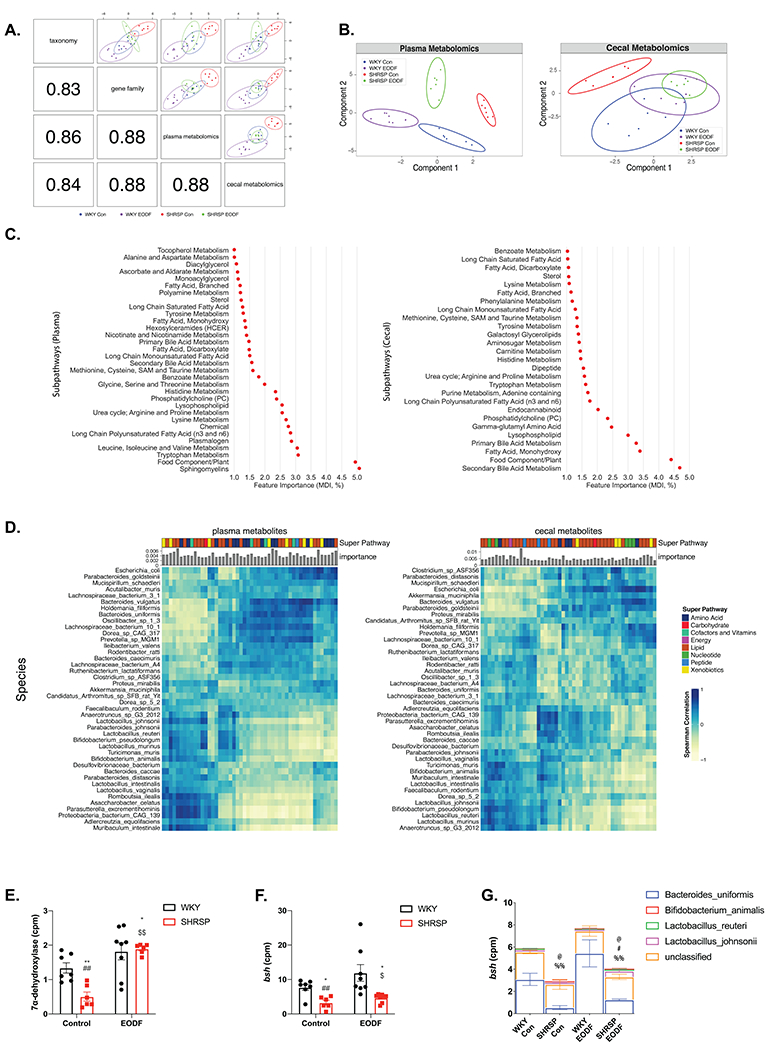
(a) Pearson correlation between component one of each dataset (bottom-left) and Sparse partial least squares discriminant analysis (sPLS-DA) of two omics (top-right). (b) Sparse partial least squares discriminant analysis (sPLS-DA) of plasma (left) and cecal (right) metabolites in four groups. (c) Plasma (left) and cecal (right) metabolite sub pathways identified by random forest classification as important for four group separation (Gini index as feature importance). (d) Spearman correlation between the top 50 most important metabolites (left:plasma, right:cecal) and species. Bar graphs indicate metabolite importance, and color blocks indicate super pathways. Comparison of total counts per millions of (e) 7α-dehydroxylase and (f) bile salt hydrolase (bsh). (g) Species stratified counts per million (cpm) of bsh gene. Two-way ANOVA with robust estimator followed by Mann-Whitney U test with Benjamin-Hochberg post hoc correction. Main effects of treatment p<0.0001. and interaction p= 0.0267 for (e). Main effects of genotype p=0.0267 for (f). Main effect of genotype for B.uniformis p=0.0083. Main effect of interaction for L.reuteri p=0.0345. Main effect of genotype p=0.0134 and interaction p=0.0334 for L.johnsonii. n=6-8. * p<0.05 vs WKY Con; ** p<0.01 vs WKY Con; ## p<0.01 vs WKY EODF; $ p<0.05 vs SHRSP Con; $$ p<0.01 vs SHRSP Con; @ p<0.05 vs WKY Con (B.uniformis); # p<0.05 vs SHRSP Con (B.uniformis); %% p<0.01 vs WKY EODF (B.uniformis)
While the plasma metabolomes were distinct among the four groups, EODF shifted the SHRSP metabolome to more closely resemble that of WKY control as seen by a left-ward shift on the PC1 axis (Fig. 4B left panel). A permutation test based on 5-fold cross-validation also showed significant differences between the makeup of the cecal metabolome among the four groups. Again, EODF shifted the SHRSP cecal metabolome to more closely resemble that of WKY as seen by a right-ward shift on the PC1 axis (Fig. 4B right panel). To identify metabolites potentially involved in the development of HT and affected by EODF, we performed random forest classification to identify metabolites important in distinguishing the four groups. The importance of each metabolite was calculated by Gini Index or Mean Decrease in Impurity (MDI), which is defined as the total reduction in impurity averaged over all trees of the random forest model55. We found that a number of the metabolite pathways identified are known to be influenced by the gut microbiota including tryptophan metabolism, branched-chain amino acids, histidine metabolism, and BA metabolism (Fig. 4C). Primary and secondary BA metabolism were identified in plasma and cecal metabolomes. Online figure VI A–B shows the comparison of WKY and SHRSP control plasma and cecal metabolomes to examine differences of genotype alone. Plasma and cecal metabolomes were significantly different between WKY and SHRSP controls, and BA metabolism was again identified by random forest classification as a key factor in distinguishing between genotypes. Online figure VI C–D shows the comparison of SHRSP control and SHRSP EODF plasma and cecal metabolomes to examine differences of the diet regimen. Plasma and cecal metabolomes were significantly different between SHRSP controls and SHRSP EODF, and BA metabolism was again identified by random forest classification as a key factor in distinguishing between SHRSP feeding regimens.
To further investigate the effects of microbes on metabolites, we examined the correlation between species abundance and metabolites identified by random forest classification to distinguish the four groups (Fig. 4D). Pathways that are associated with microbial metabolism, such as amino acids, vitamins, and lipid metabolism, showed a high correlation with gut microbiota. Lipid metabolism, which is influenced by primary and secondary BAs, was the largest group of metabolites that showed both high feature importance and Spearman correlation.
We next examined the effects of genotype and EODF on microbial metagenomes that might influence the observed differences in metabolites. From WGS analysis, we found 1068/1786 EC annotated genes were significant with main effects, including 495 genes different between WKY control and SHRSP control, and 110 genes different between SHRSP control and SHRSP EODF (Online Table II). Two major microbial BA metabolism genes, 7α-dehydroxylase and bile salt hydrolase (bsh), were significantly reduced in SHRSP control, and increased by EODF (Fig. 4E and F). Among the identified contributors to the bacterial bsh gene, Bacteroides uniformis were the main driver for the reduced presence of bsh in SHRSP controls (Fig. 4G). This is consistent with previous LEfSe analysis, where Bacteroides uniformis were more represented in WKY control and SHRSP EODF compared to SHRSP control (Fig. 3C).
Reduced plasma BA levels in SHRSP are partially restored by EODF
Plasma and cecal metabolomics analysis revealed BA metabolism as important in separating the four treatment groups. (Fig. 4). However, untargeted metabolomics does not detect all major BAs, and candidate pathways generated by untargeted analysis need to be verified. Therefore, we used targeted measurements to assess plasma levels of the major primary and secondary BAs. We first sought to examine if BAs were different between WKY and SHRSP controls (Fig. 5a). We found that of the 18 BA species measured in plasma 11 of them were significantly lower in SHRSP, as compared to WKY (Fig. 5A). Decreased SHRSP BAs were seen in each of the major BA subgroups including primary, secondary, conjugated, and unconjugated.
Figure. 5. Reduced bile acids in SHRSP are improved by EODF.
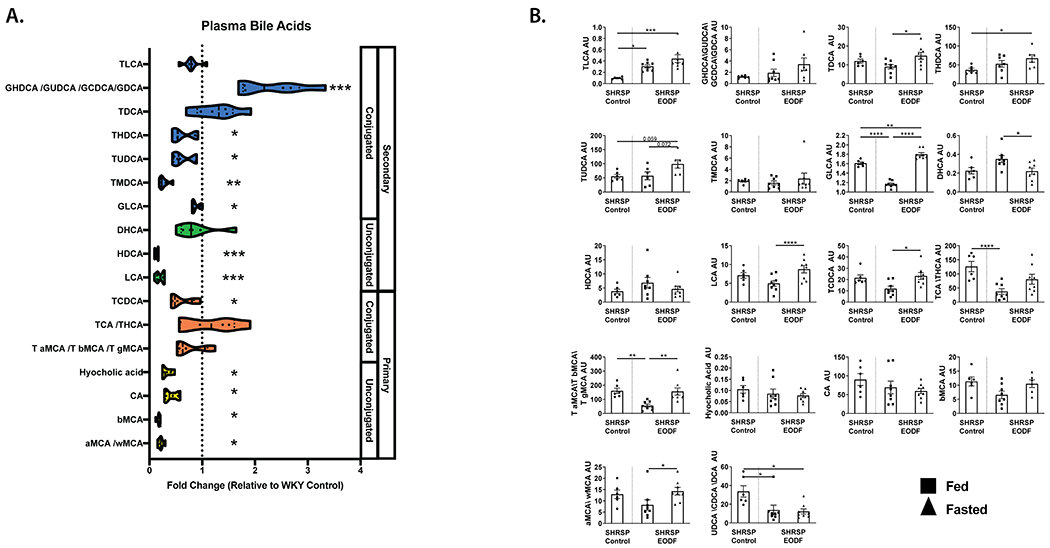
(a) SHRSP control plasma bile acid measurements relative to WKY controls. (b) SHRSP EODF plasma bile acids during fed and fasted states compared to SHRSP control levels. Mann-Whitney test with FDR correction (a), one-way ANOVA with Tukey’s multiple comparisons test or Kruskal-Wallis with Dunn’s multiple comparisons test (b). *p≤0.05 vs WKY Con, **p≤0.01 vs WKY Con ***p≤0.005 vs WKY Con, ****p≤0.001. n=6-8
Previous studies have shown that time-restricted feeding induces rhythmic changes in plasma BAs56. Therefore, we examined the effects of EODF on SHRSP plasma BAs during days of feeding vs. fasting. On a day of fasting, SHRSPs exhibited significantly elevated plasma TDCA, GLCA, LCA, TCDCA, tauro-conjugated MCAs, and αMCA/ωMCA as compared to a day of feeding. DHCA was the only BA significantly lower on a day of fasting (Fig. 5B). TLCA was significantly increased in SHRSP EODF on feeding and fasting days (Figure. 5B). Similarly, there was a trend for GHDCA/GUDCA/GCDCA/GDCA, THDCA, and TUDCA to be increased in SHRSP EODF as compared to SHRSPs fed ad libitum.
Somewhat surprisingly, plasma BAs were not different between any of the transplanted GF groups (Online Figure VII). This is likely due to the fact that the transfer of cecal content to GF rats did not result in a bacterial community that completely resembled the donor groups (Online Figure II). However, given that GF recipients receiving SHRSP control microbiota exhibited elevated SBP as compared to those receiving SHRSP EODF, suggests additional features of the SHRSP microbiota contribute to elevated SBP that can be lowered through EODF.
Cholic acid supplementation reduces BP in SHRSP
Cholic acid (CA) is significantly reduced in the plasma of SHRSP compared to WKY, and serves as a precursor to BAs found to be decreased in SHRSP plasma (Fig. 5A). Therefore, we supplemented WKY and SHRSP rats with 0.5% CA in the diet. CA supplementation for 14 weeks significantly increased plasma TLCA, GHDCA/GUDCA/GCDCA/GDCA, HDCA, HCA, CA, and αMCA/ωMCA (Fig 6A). This increase in plasma BAs was associated with a significant decrease in SBP of SHRSP CA as compared to SHRSP controls. While CA did not reduce SHRSP SBP to WKY levels, CA reduced SBP by an average 18 mmHg over the final 6 weeks of the study as compared to SHRSP control (Fig. 6B).
Figure. 6. Cholic acid supplementation attenuates elevated blood pressure in SHRSP.
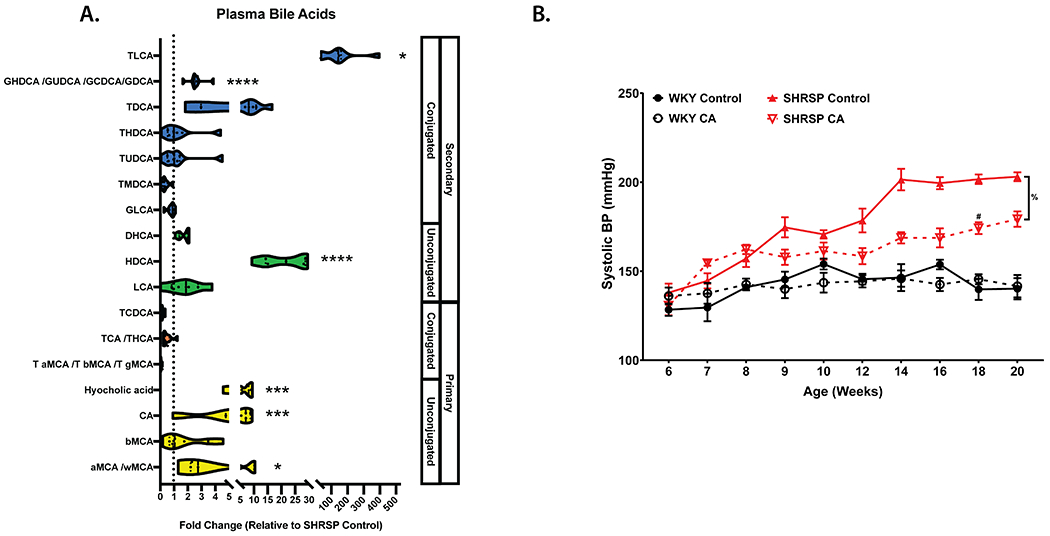
(a) SHRSP CA plasma bile acid measurements relative to SHRSP controls. (b) Weekly SBP measurements in WKY or SHRSP on control or 0.5% CA supplemented diet. Data presented as mean ± SEM. Mann-Whitney test with FDR correction (a), Three-way ANOVA with Tukey’s multiple comparisons test (b). Main effects of strain (p≤0.0001), diet (p=0.0014), age (p≤0.0001), age x strain (p≤0.0001), age x diet (p≤0.0001), strain x diet (p=0.0024),diet x strain x feeding group (p=0.0084). *p≤0.05, ***p≤0.005, ****p≤0.0001, %p=0.0003, #p≤0.05 vs SHRSP Control. n=6-8
Oleanolic acid (OA), a TGR5 agonist, reduces BP and improves vascular function in SHRSP
The BA receptor TGR5 has been identified on multiple cell types that play a role in BP regulation including endothelium, microglia, neurons, and immune cells. Additionally, we identified a number of BAs known to activate TGR5 to be decreased in SHRSP plasma, or increased by EODF and CA treatment (Figs. 5 and 6). We therefore treated SHRSP rats with the TGR5 agonist OA daily by IP injection. While OA has been shown to activate TGR5, and not FXR, it should be noted that OA has also been shown to have anti-oxidant and anti-inflammatory effects57. Chronic OA treatment significantly reduced SBP. Over the final 6 weeks of the study, OA reduced SBP by an average of 15 mmHg as compared to vehicle-treated SHRSP (Fig. 7A). Following 15 weeks of vehicle or OA treatment, vascular function was assessed in isolated mesenteric arteries. Two-way ANOVA revealed a significant effect of OA on the vasodilatory response of SHRSP mesenteric arteries to increasing doses of acetylcholine. This resulted in a significant reduction of the EC50 value of OA versus vehicle-treated vessels (Fig. 7B).
Figure. 7. TGR5 agonism attenuates elevated blood pressure and improves vascular function in SHRSP.
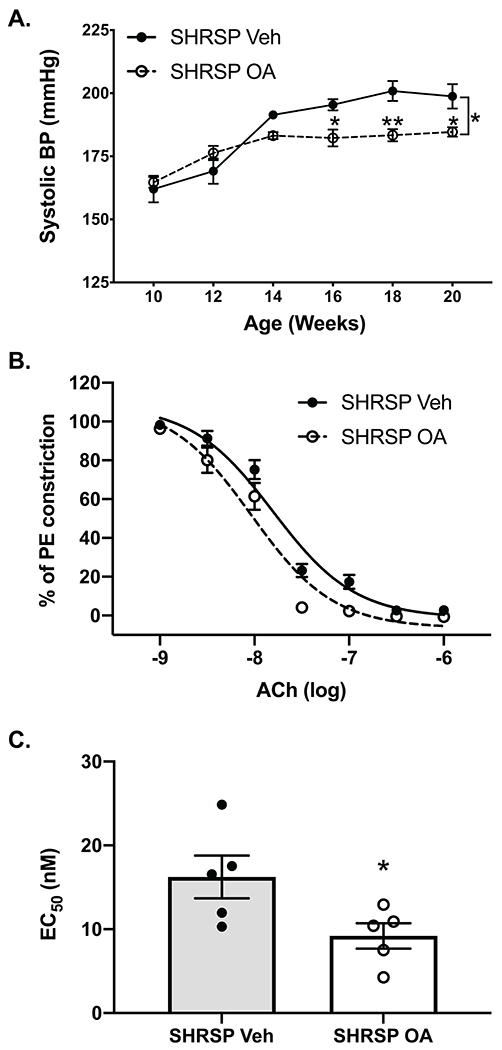
(a) SBP measurements in SHRSP injected daily with vehicle or the TGR5 agonist OA. (b) Acetylcholine (Ach_induced vasodilation of mesenteric arteries isolated from vehicle- or OA-treated SHRSPs. (c) Calculated EC50 values for acetylcholine induced vasodilation of mesenteric arteries isolated from vehicle or OA treated SHRSPs. Data presented as mean ± SEM. (a) Two-way ANOVA main effects of age (p<0.0001), treatment (p=0.0317), and age x treatment (p=0.0023). (b) Two-way ANOVA main effects of Ach dose p<0.0001, treatment p=0.0262, dose x treatment p=0.0125. (c) unpaired t-test. *p≤0.05 vs SHRSP vehicle, **p≤0.01 vs SHRSP vehicle, n=5-6
Discussion
Our hypothesis in the present study states that changes to the gut microbiota induced by EODF have a role in BP regulation. This hypothesis is based on two pertinent observations reported in the literature: (1) the gut microbiota can influence BP1–3, and (2) clinical studies, although limited, indicate that IF can have BP lowering effects9,11. Overall, the findings of this study demonstrate for the first time that EODF prevents the development of HT in the SHRSP model, and this effect is mediated by alteration of the gut microbiota. Furthermore, using a multi-omics approach to examine the composition and functionality of the microbiota and metabolome we identify impaired BA metabolism in the SHRSP model, which when manipulated by EODF or dietary intervention lowered BP.
The effects of IF on BP:
Assembling a clear understanding of the effects of IF on BP has been complicated by limited studies and various feeding protocols classified as IF. In clinical intervention studies the two most common forms of IF are EODF (alternating 24-hours of fasting and ad libitum) and periodic fasting (1-2 days fasting and 5-6 days/wk ad libitum), both of which show a significant BP-lowering effect in pre-hypertensive patients17,18. However, the mechanisms underlying the BP-lowering effects of IF are not well understood. There has also been a paucity of studies examining the effects of IF in animal models of HT. In the SHR/SHRSP model, prolonged fasting and caloric restriction have been shown to lower BP58–60. We utilized the clinically relevant model of EODF in SHRSP and WKY rats and demonstrate that EODF significantly attenuates SBP elevation in SHRSPs (Fig. 1).
The SHRSP model is classically described as a genetic model of hypertension. However, we and others have recently demonstrated that environmentally influenced factors, such as the gut microbiota, play an important role in BP regulation1,2,4,61. To test our hypothesis that the BP-lowering effects of EODF involved alterations to the gut microbiota, we transplanted cecal content from WKY and SHRSPs that had undergone 10 weeks of ad libitum feeding or EODF into GF rats. This experimental approach allowed for direct examination of the effects of the cecal content, presumably bacteria, in the absence of genetic differences between WKY and SHRSPs. In support of our hypothesis, we show that GF rats receiving microbiota from SHRSP EODF donors had significantly lower SBP as compared to those transplanted with SHRSP control microbiota (Fig. 2).
The effects of IF on the gut microbiome and metabolome:
In a recent set of studies, multiple groups have demonstrated the beneficial effects of IF in the diabetic db/db mouse model functions through manipulation of the gut microbiota and microbial metabolites16,62,63. These studies showed that IF significantly shifted the community structure of control and db/db mice, as assessed by beta-diversity. Similarly, we demonstrate that EODF significantly altered the community structure of WKY and SHRSP microbiota (Fig. 3).
To examine how the observed changes to the gut microbiota may translate to metabolite changes experienced by the host, we performed untargeted metabolomics analysis of the cecal and plasma metabolomes of the four groups. Sparse partial least squares discriminant analysis (sPLS-DA) showed significant differences in plasma and cecal metabolites between the four groups. In plasma and cecum, EODF shifted the metabolome of SHRSP to more closely resemble that of WKY controls (Fig. 4). Random forest classification of subpathways important for separation of the four groups revealed many pathways known to be influenced by the gut microbiota. Identification of microbial influenced metabolic pathways is not surprising in the cecal metabolome. However, identifying microbial-influenced pathways as key distinguishers of the plasma metabolomes further supports the idea that gut microbiota may influence host BP through circulating microbial metabolites. Identified pathways of particular interest in regard to BP regulation include tryptophan metabolism, histidine metabolism, and BA metabolism (Fig. 4). Worth pointing out is that these microbial pathways were also identified as important for distinguishing WKY control from SHRSP controls, suggesting these pathways are not only altered by EODF but are also possible candidates contributing to elevated BP in SHRSP (Online Figure IV). Tryptophan metabolism in the gut is well documented and its downstream metabolites, including serotonin and indole play important roles in BP regulation64,65. Additionally, L-histidine has been shown to have anti-hypertensive effects in the SHR model via central histamine H3 receptors66. These findings suggest that each of these pathways warrants further investigation to examine their potential role in BP regulation. Of note, our untargeted metabolomics did not capture short-chain fatty acids that have been implicated in BP regulation, and therefore cannot be ruled out as contributing to BP differences in this study5,51. Based on our untargeted metabolomics study, we chose to focus on the role of BA metabolism in SHRSP hypertension and the effects of EODF.
The potential role for BAs as microbial metabolites involved in host BP regulation:
Primary BAs are synthesized from cholesterol in the liver and stored in the gall bladder. Conjugated and unconjugated primary BAs are released into the small intestine where they emulsify dietary fats, thereby aiding in lipid absorption. The majority of primary BAs are reabsorbed in the ileum and are recirculated to the liver via the enterohepatic circulation. Alternatively, primary BAs can be deconjugated by microbial bile salt hydrolases and then converted to secondary BAs through microbial modifications, including 7 α-dehydroxylation, dehydrogenation, and epimerization67. A small fraction of primary and secondary BAs reach the systemic circulation where they can disperse throughout the body, and act as hormones by stimulating BA receptors, such as TGR5, on a variety of cell types. Therefore, changes to the composition of the gut microbiota can shift the composition of the BA pool in the gut and circulation having far reaching effects on host physiology.
Microbial functional analysis from WGS data revealed 7α-dehydroxylase and Bsh were reduced in SHRSP control, and increased by EODF (Fig. 4E and F). However, seeing as WGS functional analysis is only based on gene abundance, and BA concentrations are influenced by multiple factors including liver synthesis rates, microbiota conversion, epithelial translocation, and tissue utilization, we went on to perform targeted metabolomics of primary and secondary BAs to gain a clear picture of BAs in the circulation. We found significant reductions in several primary and secondary BAs in plasma of SHRSP including THDCA, TUDCA, TMDCA, GLCA, HDCA, LCA, TCDCA, HCA, CA, bMCA, and aMCA/wMCA (Fig. 5). We also observed that EODF increased TLCA, THDCA, TUDCA, and GLCA in the plasma of SHRSPs. Similarly, in the db/db mouse EODF was associated with elevations in circulating CA, DCA, MCA, TCDCA, and TUDCA62. Somewhat surprisingly, BA levels were not different between GF rats that received microbiota from the four donor groups. This is likely due to the inability to completely recreate the donor microbiota composition in GF recipients (Online Figure IIA). However, the fact that SBP was elevated in GF rats receiving SHRSP control microbiota as compared to those receiving SHRSP EODF microbiota suggests additional differences in the microbiota are influencing BP. In support of this is the observation that EODF completely prevented elevation of SHRSP SBP, while CA and OA treatment only attenuated SBP elevations. Additional candidates involved in SHRSP BP regulation identified by our metabolomics studies include histidine and tryptophan metabolism, which will require further investigation.
Limited studies on the effect of BA supplementation on BP have varied. Intravenous administration of the secondary BA DCA was shown to lower BP in the SHR model68. However, a separate study showed that continuous infusion of the primary BA CDCA significantly elevated BP of Sprague-Dawley rats69. Neither of these studies measured baseline or post-treatment BA levels in the models used, so it is unclear if the treatments were supplementing a deficient BA species. We chose to treat rats with CA in diet, as we had shown a deficiency of CA and CA derivatives in SHRSP plasma. We demonstrated that CA supplementation significantly attenuated the elevation of SBP in SHRSPs. This BP-lowering effect was associated with increased plasma TLCA, GHDCA/GUDCA/GCDCA/GDCA, HDCA, HCA, CA, and aMCA/wMCA (Fig. 6). Only TLCA, a potent TRG5 agonist, was elevated by both EODF and CA treatments.
Given the expression of the BA receptor TGR5 on multiple tissues involved in BP regulation, and decreased TGR5 activating BAs in SHRSP plasma, we examined TGR5 signaling as a potential mechanisms linking gut derived BAs to host BP regulation70,71. We found that treating SHRSP rats with OA significantly reduced SBP, and improved vascular function of mesenteric arteries. This is in line with previous studies demonstrating TGR5 agonism increased endothelial eNOS activity 70,72,73.
Study Limitations:
The approach of the current study allowed us to examine the effects of EODF on the development of hypertension. As such, the study design did not allow us to address the long-term consequences of hypertension such as end-organ damage and stroke. Studies in older animals, or addition of a second stress such as salt-loading, may be useful in examining the protective effects of EODF on end-organ damage. Additionally, all studies were performed in male rats. Now that the BA pathway has been implicated as a mediator between the microbiota and host BP regulation, studies to assess if BAs or TGR5 signaling is altered in female models of HT will be required. It should also be noted that in addition to activating TGR5, OA has been shown to improve insulin sensitivity and reduce oxidative stress and inflammation. While it cannot be ruled out that these effects are through the activation of TGR5, it also cannot be assumed. Therefore, it is possible the SBP lowering effects of OA function through TGR5-independent mechanisms57. We also acknowledge that individually some studies are unable to attribute direct causality. For example, when administered through the diet, CA could be converted to other BAs or alter the makeup of the microbiota, either of which could alter BP. However, by using multiple approaches to alter BA signaling (i.e., EODF, CA, OA), we believe we demonstrate an important role for BAs in BP regulation.
The current study demonstrates EODF lowers SBP in the SHRSP model by manipulation of the gut microbiota and modulation of gut-derived metabolites. We propose BAs serve as novel mediators between the gut microbiota and host, that when disrupted can contribute to the development of HT. We provide evidence for the involvement of the BA receptor TGR5. Overall, we provide further proof of the importance of the gut microbiota in BP regulation, and provide evidence that mechanisms to manipulate the microbiota, such as EODF, may serve as viable non-pharmacological methods for the treatment of HT.
Supplementary Material
Major Resources Table
| Animals (in vivo studies) | ||||
|---|---|---|---|---|
| Species | Vendor or Source | Background Strain | Sex | Persistent ID / URL |
| Spontaneously Hypertensive Stroke Prone (SHRSP) | Charles River (bred in-house) | M | https://www.criver.com/products-services/find-model/spontaneously-hypertensive-stroke-prone-shrsp-rat?region=3611 | |
| Wistar Kyoto (WKY) | Charles River (bred in-house) | M | https://www.criver.com/products-services/find-model/wistar-kyoto-wky-rat?region=3611 | |
| Antibodies | |||||
|---|---|---|---|---|---|
| Target antigen | Vendor or Source | Catalog # | Working concentration | Lot # (preferred but not required) | Persistent ID / URL |
Novelty and Significance.
What is known?
Disruption of the gut microbiota, termed gut dysbiosis, contributes to the development of hypertension.
Intermittent fasting has beneficial effects on cardiovascular health and can alter the makeup of the gut microbiota.
What new information does this article contribute?
Intermittent fasting prevents the development of hypertension in spontaneously hypertensive stroke-prone rats (SHRSP) by altering the composition of the gut microbiota.
The cecal and plasma metabolomes of SHRSP are significantly different from those of normotensive control Wistar-Kyoto (WKY) rats. Intermittent fasting alters the SHRSP cecal and plasma metabolomes to more closely resemble those of WKY.
SHRSP exhibit significantly decreased circulating bile acids as compared to WKY, which are increased following intermittent fasting.
Recent studies have demonstrated a causal role for gut dysbiosis in the development of hypertension in animal models and patients. Despite this understanding, little is known regarding 1) the mechanisms through which gut microbes influence host blood pressure regulation, or 2) whether manipulation of the gut microbiota offers an efficacious approach in the prevention or treatment of hypertension. In the current study, we aimed to address both of these areas by exposing WKY and SHRSP to intermittent fasting and using a multi-omics approach to examine the effects on the gut microbiota and metabolome. Our data reveal that intermittent fasting prevents the development of hypertension in SHRSP by altering the gut microbiota composition. Metabolomics analysis revealed a number of microbial modified bile acids that are decreased in the circulation of SHRSP and increased by intermittent fasting. Finally, approaches to increase systemic bile acid signaling (e.g. cholic acid or bile acid receptor agonist supplementation) reduced SHRSP blood pressure. These studies identify intermittent fasting as a mechanism to alter the gut microbiota and reduce blood pressure, which appears to be at least partially through normalizing bile acid signaling.
Acknowledgments
Sources of Funding:
This work was supported by Public Health under grants RO1HL134838 (DJD), R01NS102594 (RMB), and DK56338, which supports the Texas Medical Center Digestive Diseases Center (DJD). The Gnotobiotic Core is supported in part by the Texas Medical Center Digestive Diseases Center, an NIH-funded (P30DK056338) digestive disease research core. The Metabolomics Core is supported by the CPRIT Core Facility Support Award RP170005 “Proteomic and Metabolomics Core Facility,” NCI Cancer Center Support Grant P30CA125123, intramural funds from the Dan L. Duncan Cancer Center. HPCC is a shared resource of the biomedical informatics group, supported by National Cancer Institute Cancer Center Support Grant P30CA125123.
Non-standard Abbreviations and Acronyms
- BA
bile acid
- BP
blood pressure
- SBP
systolic blood pressure
- SHRSP
spontaneously hypertensive stroke-prone
- WKY
Wistar-Kyoto
- GF
germ-free
- HT
hypertension
- IF
intermittent fasting
- EODF
every other day fasting
- WGS
whole genome shotgun sequencing
Footnotes
Competing Interests Statement: The authors state no potential conflicts of interest with respect to the research, authorship, and/or publication of this article.
References
- 1.Durgan DJ, Ganesh BP, Cope JL, Ajami NJ, Phillips SC, Petrosino JF, Hollister EB, Bryan RM. Role of the Gut Microbiome in Obstructive Sleep Apnea-Induced Hypertension. Hypertension. 2016;67:469–474. [DOI] [PMC free article] [PubMed] [Google Scholar]
- 2.Raizada MK, Joe B, Bryan NS, Chang EB, Dewhirst FE, Borisy GG, Galis ZS, Henderson W, Jose PA, Ketchum CJ, et al. Report of the national heart, lung, and blood institute working group on the role of microbiota in blood pressure regulation: current status and future directions. Hypertension. 2017; [DOI] [PMC free article] [PubMed] [Google Scholar]
- 3.Yang T, Santisteban MM, Rodriguez V, Li E, Ahmari N, Carvajal JM, Zadeh M, Gong M, Qi Y, Zubcevic J, et al. Gut dysbiosis is linked to hypertension. Hypertension. 2015;65:1331–1340. [DOI] [PMC free article] [PubMed] [Google Scholar]
- 4.Toral M, Robles-Vera I, de la Visitación N, Romero M, Sánchez M, Gómez-Guzmán M, Rodriguez-Nogales A, Yang T, Jiménez R, Algieri F, Gálvez J, et al. Role of the immune system in vascular function and blood pressure control induced by fecal microbiota transplantation in rats. Acta Physiol (Oxf). 2019;e13285. [DOI] [PubMed] [Google Scholar]
- 5.Ganesh BP, Nelson JW, Eskew JR, Ganesan A, Ajami NJ, Petrosino JF, Bryan RM, Durgan DJ. Prebiotics, probiotics, and acetate supplementation prevent hypertension in a model of obstructive sleep apnea. Hypertension. 2018;72:1141–1150. [DOI] [PMC free article] [PubMed] [Google Scholar]
- 6.Adnan S, Nelson JW, Ajami NJ, Venna VR, Petrosino JF, Bryan RM, Durgan DJ. Alterations in the gut microbiota can elicit hypertension in rats. Physiol Genomics. 2017;49:96–104. [DOI] [PMC free article] [PubMed] [Google Scholar]
- 7.Li J, Zhao F, Wang Y, Chen J, Tao J, Tian G, Wu S, Liu W, Cui Q, Geng B, et al. Gut microbiota dysbiosis contributes to the development of hypertension. Microbiome. 2017;5:14. [DOI] [PMC free article] [PubMed] [Google Scholar]
- 8.Mattson MP, Longo VD, Harvie M. Impact of intermittent fasting on health and disease processes. Ageing Res Rev. 2017;39:46–58. [DOI] [PMC free article] [PubMed] [Google Scholar]
- 9.Stekovic S, Hofer SJ, Tripolt N, Aon MA, Royer P, Pein L, Stadler JT, Pendl T, Prietl B, Url J, et al. Alternate Day Fasting Improves Physiological and Molecular Markers of Aging in Healthy, Non-obese Humans. Cell Metab. 2019;30:462–476.e6. [DOI] [PubMed] [Google Scholar]
- 10.Di Francesco A, Di Germanio C, Bernier M, de Cabo R. A time to fast. Science. 2018;362:770–775. [DOI] [PMC free article] [PubMed] [Google Scholar]
- 11.de Cabo R, Mattson MP. Effects of intermittent fasting on health, aging, and disease. N Engl J Med. 2019;381:2541–2551. [DOI] [PubMed] [Google Scholar]
- 12.Chaix A, Manoogian ENC, Melkani GC, Panda S. Time-Restricted Eating to Prevent and Manage Chronic Metabolic Diseases. Annu Rev Nutr. 2019;39:291–315. [DOI] [PMC free article] [PubMed] [Google Scholar]
- 13.Cignarella F, Cantoni C, Ghezzi L, Salter A, Dorsett Y, Chen L, Phillips D, Weinstock GM, Fontana L, Cross AH, et al. Intermittent fasting confers protection in CNS autoimmunity by altering the gut microbiota. Cell Metab. 2018;27:1222–1235.e6. [DOI] [PMC free article] [PubMed] [Google Scholar]
- 14.Li G, Xie C, Lu S, Nichols RG, Tian Y, Li L, Patel D, Ma Y, Brocker CN, Yan T, et al. Intermittent fasting promotes white adipose browning and decreases obesity by shaping the gut microbiota. Cell Metab. 2017;26:672–685.e4. [DOI] [PMC free article] [PubMed] [Google Scholar]
- 15.Marinho T de S, Ornellas F, Barbosa-da-Silva S, Mandarim-de-Lacerda CA, Aguila MB. Beneficial effects of intermittent fasting on steatosis and inflammation of the liver in mice fed a high-fat or a high-fructose diet. Nutrition. 2019;65:103–112. [DOI] [PubMed] [Google Scholar]
- 16.Liu Z, Dai X, Zhang H, Shi R, Hui Y, Jin X, Zhang W, Wang L, Wang Q, Wang D, et al. Gut microbiota mediates intermittent-fasting alleviation of diabetes-induced cognitive impairment. Nat Commun. 2020;11:855. [DOI] [PMC free article] [PubMed] [Google Scholar]
- 17.St-Onge M-P, Ard J, Baskin ML, Chiuve SE, Johnson HM, Kris-Etherton P, Varady K, American Heart Association Obesity Committee of the Council on Lifestyle and Cardiometabolic Health; Council on Cardiovascular Disease in the Young; Council on Clinical Cardiology; and Stroke Council. Meal timing and frequency: implications for cardiovascular disease prevention: A scientific statement from the american heart association. Circulation. 2017;135:e96–e121. [DOI] [PMC free article] [PubMed] [Google Scholar]
- 18.D’Souza MS, Dong TA, Ragazzo G, Dhindsa DS, Mehta A, Sandesara PB, Freeman AM, Taub P, Sperling LS. From fad to fact: evaluating the impact of emerging diets on the prevention of cardiovascular disease. Am J Med. 2020; [DOI] [PubMed] [Google Scholar]
- 19.Watanabe M, Houten SM, Mataki C, Christoffolete MA, Kim BW, Sato H, Messaddeq N, Harney JW, Ezaki O, Kodama T, et al. Bile acids induce energy expenditure by promoting intracellular thyroid hormone activation. Nature. 2006;439:484–489. [DOI] [PubMed] [Google Scholar]
- 20.Eblimit Z, Thevananther S, Karpen SJ, Taegtmeyer H, Moore DD, Adorini L, Penny DJ, Desai MS. TGR5 activation induces cytoprotective changes in the heart and improves myocardial adaptability to physiologic, inotropic, and pressure-induced stress in mice. Cardiovasc Ther. 2018;36:e12462. [DOI] [PMC free article] [PubMed] [Google Scholar]
- 21.Feng M, Whitesall S, Zhang Y, Beibel M, D’Alecy L, DiPetrillo K. Validation of volume-pressure recording tail-cuff blood pressure measurements. Am J Hypertens. 2008;21:1288–1291. [DOI] [PubMed] [Google Scholar]
- 22.Lloyd EE, Crossland RF, Phillips SC, Marrelli SP, Reddy AK, Taffet GE, Hartley CJ, Bryan RM. Disruption of K(2P)6.1 produces vascular dysfunction and hypertension in mice. Hypertension. 2011;58:672–678. [DOI] [PMC free article] [PubMed] [Google Scholar]
- 23.Terunuma A, Putluri N, Mishra P, Mathé EA, Dorsey TH, Yi M, Wallace TA, Issaq HJ, Zhou M, Killian JK, et al. MYC-driven accumulation of 2-hydroxyglutarate is associated with breast cancer prognosis. J Clin Invest. 2014;124:398–412. [DOI] [PMC free article] [PubMed] [Google Scholar]
- 24.Amara CS, Ambati CR, Vantaku V, Badrajee Piyarathna DW, Donepudi SR, Ravi SS, Arnold JM, Putluri V, Chatta G, Guru KA, et al. Serum Metabolic Profiling Identified a Distinct Metabolic Signature in Bladder Cancer Smokers: A Key Metabolic Enzyme Associated with Patient Survival. Cancer Epidemiol Biomarkers Prev. 2019;28:770–781. [DOI] [PMC free article] [PubMed] [Google Scholar]
- 25.Mair P, Wilcox R. Robust statistical methods in R using the WRS2 package. Behav Res Methods. 2020;52:464–488. [DOI] [PubMed] [Google Scholar]
- 26.Human Microbiome Project Consortium. A framework for human microbiome research. Nature. 2012;486:215–221. [DOI] [PMC free article] [PubMed] [Google Scholar]
- 27.Human Microbiome Project Consortium. Structure, function and diversity of the healthy human microbiome. Nature. 2012;486:207–214. [DOI] [PMC free article] [PubMed] [Google Scholar]
- 28.Bushnell B, Rood J, Singer E. BBMerge - accurate paired shotgun read merging via overlap. PLoS One. 2017;12:e0185056. [DOI] [PMC free article] [PubMed] [Google Scholar]
- 29.Suzuki MT, Taylor LT, DeLong EF. Quantitative analysis of small-subunit rRNA genes in mixed microbial populations via 5’-nuclease assays. Appl Environ Microbiol. 2000;66:4605–4614. [DOI] [PMC free article] [PubMed] [Google Scholar]
- 30.Bridgewater BREA. High Resolution Mass Spectrometry Improves Data Quantity and Quality as Compared to Unit Mass Resolution Mass Spectrometry in High-Throughput Profiling Metabolomics. Metabolomics. 2014;04. [Google Scholar]
- 31.Evans AM, Mitchell MW, Dai H, DeHaven CD. Categorizing ion-features in liquid chromatography/mass spectrometry metabolomics data. Metabolomics. 2012;2:2153–0769. [Google Scholar]
- 32.Truong DT, Franzosa EA, Tickle TL, Scholz M, Weingart G, Pasolli E, Tett A, Huttenhower C, Segata N. MetaPh1An2 for enhanced metagenomic taxonomic profiling. Nat Methods. 2015;12:902–903. [DOI] [PubMed] [Google Scholar]
- 33.Franzosa EA, McIver LJ, Rahnavard G, Thompson LR, Schirmer M, Weingart G, Lipson KS, Knight R, Caporaso JG, Segata N, et al. Species-level functional profiling of metagenomes and metatranscriptomes. Nat Methods. 2018;15:962–968. [DOI] [PMC free article] [PubMed] [Google Scholar]
- 34.Huang K, Brady A, Mahurkar A, White O, Gevers D, Huttenhower C, Segata N. MetaRef: a pan-genomic database for comparative and community microbial genomics. Nucleic Acids Res. 2014;42:D617–24. [DOI] [PMC free article] [PubMed] [Google Scholar]
- 35.Suzek BE, Wang Y, Huang H, McGarvey PB, Wu CH, UniProt Consortium. UniRef clusters: a comprehensive and scalable alternative for improving sequence similarity searches. Bioinformatics. 2015;31:926–932. [DOI] [PMC free article] [PubMed] [Google Scholar]
- 36.Virtanen P, Gommers R, Oliphant TE, Haberland M, Reddy T, Cournapeau D, Burovski E, Peterson P, Weckesser W, Bright J, et al. SciPy 1.0: fundamental algorithms for scientific computing in Python. Nat Methods. 2020;17:261–272. [DOI] [PMC free article] [PubMed] [Google Scholar]
- 37.Callahan BJ, McMurdie PJ, Rosen MJ, Han AW, Johnson AJA, Holmes SP. DADA2: High-resolution sample inference from Illumina amplicon data. Nat Methods. 2016;13:581–583. [DOI] [PMC free article] [PubMed] [Google Scholar]
- 38.Team RC. R: A language and environment for statistical computing. 2013; [Google Scholar]
- 39.Quast C, Pruesse E, Yilmaz P, Gerken J, Schweer T, Yarza P, Peplies J, Glöckner FO. The SILVA ribosomal RNA gene database project: improved data processing and web-based tools. Nucleic Acids Res. 2013;41:D590–6. [DOI] [PMC free article] [PubMed] [Google Scholar]
- 40.Oksanen J, Blanchet FG, Friendly M, Kindt R, Legendre P, McGlinn D, Minchin PR, O’Hara RB, Simpson GL, Solymos P. vegan: Community Ecology Package. R package version 2.5–6. 2019. 2019; [Google Scholar]
- 41.Segata N, Izard J, Waldron L, Gevers D, Miropolsky L, Garrett WS, Huttenhower C. Metagenomic biomarker discovery and explanation. Genome Biol. 2011;12:R60. [DOI] [PMC free article] [PubMed] [Google Scholar]
- 42.Rohart F, Gautier B, Singh A, Lê Cao K-A. mixOmics: An R package for ’omics feature selection and multiple data integration. PLoS Comput Biol. 2017;13:e1005752. [DOI] [PMC free article] [PubMed] [Google Scholar]
- 43.Singh A, Zapata RC, Pezeshki A, Workentine ML, Chelikani PK. Host genetics and diet composition interact to modulate gut microbiota and predisposition to metabolic syndrome in spontaneously hypertensive stroke-prone rats. FASEB J. 2019;33:6748–6766. [DOI] [PubMed] [Google Scholar]
- 44.Ruiz L, Margolles A, Sánchez B. Bile resistance mechanisms in Lactobacillus and Bifidobacterium. Front Microbiol. 2013;4:396. [DOI] [PMC free article] [PubMed] [Google Scholar]
- 45.Heinken A, Ravcheev DA, Baldini F, Heirendt L, Fleming RMT, Thiele I. Systematic assessment of secondary bile acid metabolism in gut microbes reveals distinct metabolic capabilities in inflammatory bowel disease. Microbiome. 2019;7:75. [DOI] [PMC free article] [PubMed] [Google Scholar]
- 46.Jukes CA, Ijaz UZ, Buckley A, Spencer J, Irvine J, Candlish D, Li JV, Marchesi JR, Douce G. Bile salt metabolism is not the only factor contributing to Clostridioides (Clostridium) difficile disease severity in the murine model of disease. Gut Microbes. 2020;11:481–496. [DOI] [PMC free article] [PubMed] [Google Scholar]
- 47.Yao L, Seaton SC, Ndousse-Fetter S, Adhikari AA, DiBenedetto N, Mina AI, Banks AS, Bry L, Devlin AS. A selective gut bacterial bile salt hydrolase alters host metabolism. Elife. 2018;7. [DOI] [PMC free article] [PubMed] [Google Scholar]
- 48.Begley M, Hill C, Gahan CGM. Bile salt hydrolase activity in probiotics. Appl Environ Microbiol. 2006;72:1729–1738. [DOI] [PMC free article] [PubMed] [Google Scholar]
- 49.Ju T, Kong JY, Stothard P, Willing BP. Defining the role of Parasutterella, a previously uncharacterized member of the core gut microbiota. ISME J. 2019;13:1520–1534. [DOI] [PMC free article] [PubMed] [Google Scholar]
- 50.Pluznick JL. Microbial Short-Chain Fatty Acids and Blood Pressure Regulation. Curr Hypertens Rep. 2017;19:25. [DOI] [PMC free article] [PubMed] [Google Scholar]
- 51.Kim S, Goel R, Kumar A, Qi Y, Lobaton G, Hosaka K, Mohammed M, Handberg EM, Richards EM, Pepine CJ, et al. Imbalance of gut microbiome and intestinal epithelial barrier dysfunction in patients with high blood pressure. Clin Sci. 2018;132:701–718. [DOI] [PMC free article] [PubMed] [Google Scholar]
- 52.Ottosson F, Brunkwall L, Smith E, Orho-Melander M, Nilsson PM, Fernandez C, Melander O. The gut microbiota-related metabolite phenylacetylglutamine associates with increased risk of incident coronary artery disease. J Hypertens. 2020; [DOI] [PubMed] [Google Scholar]
- 53.Ufnal M, Jazwiec R, Dadlez M, Drapala A, Sikora M, Skrzypecki J. Trimethylamine-N-oxide: a carnitine-derived metabolite that prolongs the hypertensive effect of angiotensin II in rats. Can J Cardiol. 2014;30:1700–1705. [DOI] [PubMed] [Google Scholar]
- 54.Wikoff WR, Anfora AT, Liu J, Schultz PG, Lesley SA, Peters EC, Siuzdak G. Metabolomics analysis reveals large effects of gut microflora on mammalian blood metabolites. Proc Natl Acad Sci USA. 2009;106:3698–3703. [DOI] [PMC free article] [PubMed] [Google Scholar]
- 55.Pedregosa F, Varoquaux G, Gramfort A, Michel V, Thirion B, Grisel O, Blondel M, Prettenhofer P, Weiss R, Dubourg V, et al. Scikit-learn: Machine learning in Python. the Journal of machine Learning research. 2011;12:2825–2830. [Google Scholar]
- 56.Eggink HM, Oosterman JE, de Goede P, de Vries EM, Foppen E, Koehorst M, Groen AK, Boelen A, Romijn JA, la Fleur SE, et al. Complex interaction between circadian rhythm and diet on bile acid homeostasis in male rats. Chronobiol Int. 2017;34:1339–1353. [DOI] [PubMed] [Google Scholar]
- 57.Ayeleso TB, Matumba MG, Mukwevho E. Oleanolic acid and its derivatives: biological activities and therapeutic potential in chronic diseases. Molecules. 2017;22. [DOI] [PMC free article] [PubMed] [Google Scholar]
- 58.Dolinsky VW, Morton JS, Oka T, Robillard-Frayne I, Bagdan M, Lopaschuk GD, Des Rosiers C, Walsh K, Davidge ST, Dyck JRB. Calorie restriction prevents hypertension and cardiac hypertrophy in the spontaneously hypertensive rat. Hypertension. 2010;56:412–421. [DOI] [PubMed] [Google Scholar]
- 59.Williams TD, Chambers JB, May OL, Henderson RP, Rashotte ME, Overton JM. Concurrent reductions in blood pressure and metabolic rate during fasting in the unrestrained SHR. Am J Physiol Regul Integr Comp Physiol. 2000;278:R255–62. [DOI] [PubMed] [Google Scholar]
- 60.Fitzgerald S Rapid hypotensive response to fasting in spontaneously hypertensive rats. Am J Hypertens. 2001;14:1123–1127. [DOI] [PubMed] [Google Scholar]
- 61.Nelson JW, Phillips SC, Ganesh BP, Petrosino JF, Durgan DJ, Bryan RM. The Gut Microbiome Contributes to the Cerebral Small Vessel Disease Phenotype in Spontaneously Hypertensive Stroke Prone Rats. FASEB J. 2020; [DOI] [PMC free article] [PubMed] [Google Scholar]
- 62.Beli E, Yan Y, Moldovan L, Vieira CP, Gao R, Duan Y, Prasad R, Bhatwadekar A, White FA, Townsend SD, et al. Restructuring of the Gut Microbiome by Intermittent Fasting Prevents Retinopathy and Prolongs Survival in db/db Mice. Diabetes. 2018;67:1867–1879. [DOI] [PMC free article] [PubMed] [Google Scholar]
- 63.Zhang H, Zhang W, Yun D, Li L, Zhao W, Li Y, Liu X, Liu Z. Alternate-day fasting alleviates diabetes-induced glycolipid metabolism disorders: Roles of FGF21 and bile acids. J Nutr Biochem. 2020;108403. [DOI] [PubMed] [Google Scholar]
- 64.Huc T, Konop M, Onyszkiewicz M, Podsadni P, Szczepańska A, Turło J, Ufnal M. Colonic indole, gut bacteria metabolite of tryptophan, increases portal blood pressure in rats. Am J Physiol Regul Integr Comp Physiol. 2018;315:R646–R655. [DOI] [PubMed] [Google Scholar]
- 65.Fraer M, Kilic F. Serotonin: a different player in hypertension-associated thrombosis. Hypertension. 2015;65:942–948. [DOI] [PMC free article] [PubMed] [Google Scholar]
- 66.Toba H, Nakamori A, Tanaka Y, Yukiya R, Tatsuoka K, Narutaki M, Tokitaka M, Hariu H, Kobara M, Nakata T. Oral L-histidine exerts antihypertensive effects via central histamine H3 receptors and decreases nitric oxide content in the rostral ventrolateral medulla in spontaneously hypertensive rats. Clin Exp Pharmacol Physiol. 2010;37:62–68. [DOI] [PubMed] [Google Scholar]
- 67.Vital M, Rud T, Rath S, Pieper DH, Schlüter D. Diversity of Bacteria Exhibiting Bile Acid-inducible 7α-dehydroxylation Genes in the Human Gut. Comput Struct Biotechnol J. 2019;17:1016–1019. [DOI] [PMC free article] [PubMed] [Google Scholar]
- 68.Tominaga T, Suzuki H, Ogata Y, Imafuku T, Saruta T. Bile acids are able to reduce blood pressure by attenuating the vascular reactivity in spontaneously hypertensive rats. Life Sci. 1988;42:1861–1868. [DOI] [PubMed] [Google Scholar]
- 69.Morris DJ, Souness GW. Endogenous 11 beta-hydroxysteroid dehydrogenase inhibitors and their role in glucocorticoid Na+ retention and hypertension. Endocr Res. 1996;22:793–801. [DOI] [PubMed] [Google Scholar]
- 70.Duboc H, Taché Y, Hofmann AF. The bile acid TGR5 membrane receptor: from basic research to clinical application. Dig Liver Dis. 2014;46:302–312. [DOI] [PMC free article] [PubMed] [Google Scholar]
- 71.Wang Y-D, Chen W-D, Moore DD, Huang W. FXR: a metabolic regulator and cell protector. Cell Res. 2008;18:1087–1095. [DOI] [PubMed] [Google Scholar]
- 72.Yanguas-Casás N, Barreda-Manso MA, Nieto-Sampedro M, Romero-Ramírez L. TUDCA: An Agonist of the Bile Acid Receptor GPBAR1/TGR5 With Anti-Inflammatory Effects in Microglial Cells. J Cell Physiol. 2017;232:2231–2245. [DOI] [PubMed] [Google Scholar]
- 73.Kida T, Tsubosaka Y, Hori M, Ozaki H, Murata T. Bile acid receptor TGR5 agonism induces NO production and reduces monocyte adhesion in vascular endothelial cells. Arterioscler Thromb Vasc Biol. 2013;33:1663–1669. [DOI] [PubMed] [Google Scholar]
Associated Data
This section collects any data citations, data availability statements, or supplementary materials included in this article.