

There is a Blood Commentary on this article in this issue.
Key Points
Progression signature identified from in vivo disease modeling revealed clinical relevance in MM.
Abstract
Clonal evolution drives tumor progression, dissemination, and relapse in multiple myeloma (MM), with most patients dying of relapsed disease. This multistage process requires tumor cells to enter the circulation, extravasate, and colonize distant bone marrow (BM) sites. Here, we developed a fluorescent or DNA-barcode clone-tracking system on MM PrEDiCT (progression through evolution and dissemination of clonal tumor cells) xenograft mouse model to study clonal behavior within the BM microenvironment. We showed that only the few clones that successfully adapt to the BM microenvironment can enter the circulation and colonize distant BM sites. RNA sequencing of primary and distant-site MM tumor cells revealed a progression signature sequentially activated along human MM progression and significantly associated with overall survival when evaluated against patient data sets. A total of 28 genes were then computationally predicted to be master regulators (MRs) of MM progression. HMGA1 and PA2G4 were validated in vivo using CRISPR-Cas9 in the PrEDiCT model and were shown to be significantly depleted in distant BM sites, indicating their role in MM progression and dissemination. Loss of HMGA1 and PA2G4 also compromised the proliferation, migration, and adhesion abilities of MM cells in vitro. Overall, our model successfully recapitulates key characteristics of human MM disease progression and identified potential new therapeutic targets for MM.
Visual Abstract

Introduction
Cancer is a genetically complex evolutionary process whereby transformed cells continue to acquire genetic and/or epigenetic lesions, giving rise to heterogeneous populations of functionally distinct clones.1-3 The number of mutant clones per cancer can range from tens to hundreds (most commonly) or thousands, out of which only few clones are functionally relevant true drivers.1,3 Forced to compete for limited resources under natural selection, with the presence of microenvironmental and other constraints, the most resilient clones with best fitness to self-renew are selected for extensive proliferation, migration, and invasion.4 Ultimately, cancer cells that survive can go on to repopulate distant tumor microenvironments, possibly carrying new alterations that enhance their malignant potential.3,5,6
Multiple myeloma (MM), an incurable plasma cell malignancy of the bone marrow (BM), is a particularly heterogeneous type of cancer7-10 whose progression from the well-defined precursor stages of monoclonal gammopathy of undetermined significance (MGUS) and smoldering MM (SMM) is underlain by marked evolution.11-13 As such, although at the early stage of disease, a few clones with limited number of alterations are present, subsequent abnormalities are acquired as patients progress to overt disease, conferring fitness advantage and allowing for tumor expansion.8,14 Nevertheless, genetic/epigenetic aberrations are seldom enough to drive cancer progression by themselves; a permissive microenvironment and reciprocal interactions between tumor and microenvironmental cells are equally important.15,16 Multiple components in the tissue environment can influence cancer clonal evolution, and cancer cells in turn can also remodel the microenvironment for their competitive advantage.15,17,18 Thus, a model of MM progression with the presence of tumor microenvironment is crucial and can provide a unique platform to understand clonal heterogeneity, evolution, and dissemination mechanisms.
In this study, we describe a novel “bone chip” xenograft mouse model (MM PrEDiCT), which in combination with a fluorescent or DNA-barcodes system can be used to track and profile heterogeneous clonal evolution as they disseminate from the primary sites to peripheral blood and distant BM sites. Subsequently, we use this model to define an RNA expression signature of progression, which we find to correlate with disease progression and survival in MM patient data, confirming its relevance. Finally, we identify potential drivers of progression, HMGA1 and PA2G4, in our model and validate their significance in MM disease progression and dissemination through an in vivo CRISPR screen and in vitro assays.
Methods
Mouse studies and tumor transplantation
All mouse experiments were performed with an Institutional Animal Care and Use Committee–approved animal protocol at our facility (Dana-Farber Cancer Institute). Severe combined immunodeficiency (SCID)-beige mice (C.B-Igh-1b/GbmsTac-Prkdcscid-Lystbg N7) were obtained from Taconic. For tumor-bearing bone chip implantation, femurs were resected from 6- to 7-week-old female SCID-beige mice. Two million myeloma cells were injected into the BM cavity of femurs resected from donor mice and were then transplanted subcutaneously into syngeneic recipient mice of the same age.
RNA-sequencing analysis
For RNA sequencing, poly(A) selection and complementary DNA synthesis were performed, followed by library preparation using Illumina TruSeq RNA Sample Prep Kit, sequencing (75-bp paired reads), and sample identification for quality control. RNA-sequencing data were processed by Kallisto,19 a pseudoalignment tool used to quantify abundances of transcripts, which were represented as transcripts per million. Estimated counts were imported by R package tximport for downstream analysis. Differential expression analysis was performed by DESeq220 with a false discovery rate (FDR) cutoff of 5%.
Study approval
All mice were treated, monitored, and sacrificed in accordance with an approved protocol of the Dana-Farber Cancer Institute Animal Care and Use Committee.
BM samples from relapsed/refractory MM patients were obtained under the approval from the Dana-Farber Cancer Institute Institutional Review Board. Informed consent was obtained from all patients in accordance with the Declaration of Helsinki.
Statistical analysis
All statistical analysis was performed in R (https://www.r-project.org/), and multiple hypothesis testing was corrected using the Benjamini-Hochberg method.
Results
Generation and validation of MM PrEDiCT mouse model as a clone-tracking tool
To investigate the dynamics of clonal heterogeneity in vivo within the BM microenvironment, we developed a tumor dissemination xenograft model characterized by subcutaneous implantation of myeloma-bearing femur bone chips into syngeneic SCID-beige mice (supplemental Figure 1A, available on the Blood Web site). Two weeks following bone chip implantation, engraftment was assessed using confocal microscopy. At that point, functional vessels and bone remodeling could be observed, while myeloma cells had started colonizing the proximal vessel plexus, suggesting that the implanted bone chips had rapidly engrafted and were functioning as a permissive microenvironment for the growth and migration of myeloma cells (supplemental Figure 1B). Disseminated MM cells had colonized distant BM sites by week 6 (supplemental Figure 1C), while by weeks 8 to 10, host mice presented with limb paralysis, displaying multiple skeletal lytic lesions. We were able to reproducibly model distant BM dissemination of various myeloma cell lines using bone chip implants (supplemental Figure 1D), mimicking the human MM dissemination phenotype. In contrast, direct subcutaneous injection of MM.1S into SCID-beige mice did not reveal significant amount of disseminated GFP+ cells in the blood, BM, or spleen (supplemental Figure 2). These data suggest that MM cells alone are not sufficient for progression, and a permissive BM stromal environment is required for disease progression/dissemination. Thus, we named this model MM PrEDiCT (MM progression through evolution and dissemination of clonal tumor cells).
Subsequently, we took advantage of the fluorescent tagging system to generate a stable 15-color cell library with cells bearing fluorescence proteins encoding GFP, BFP, RFP, and iRFP (Figure 1A).21 These 15-color subpopulations can be flow-sorted, mixed in equal proportions (Figure 1), and “visually” tracked in the PrEDiCT model, hereafter referred to as the “rainbow” system.
Figure 1.
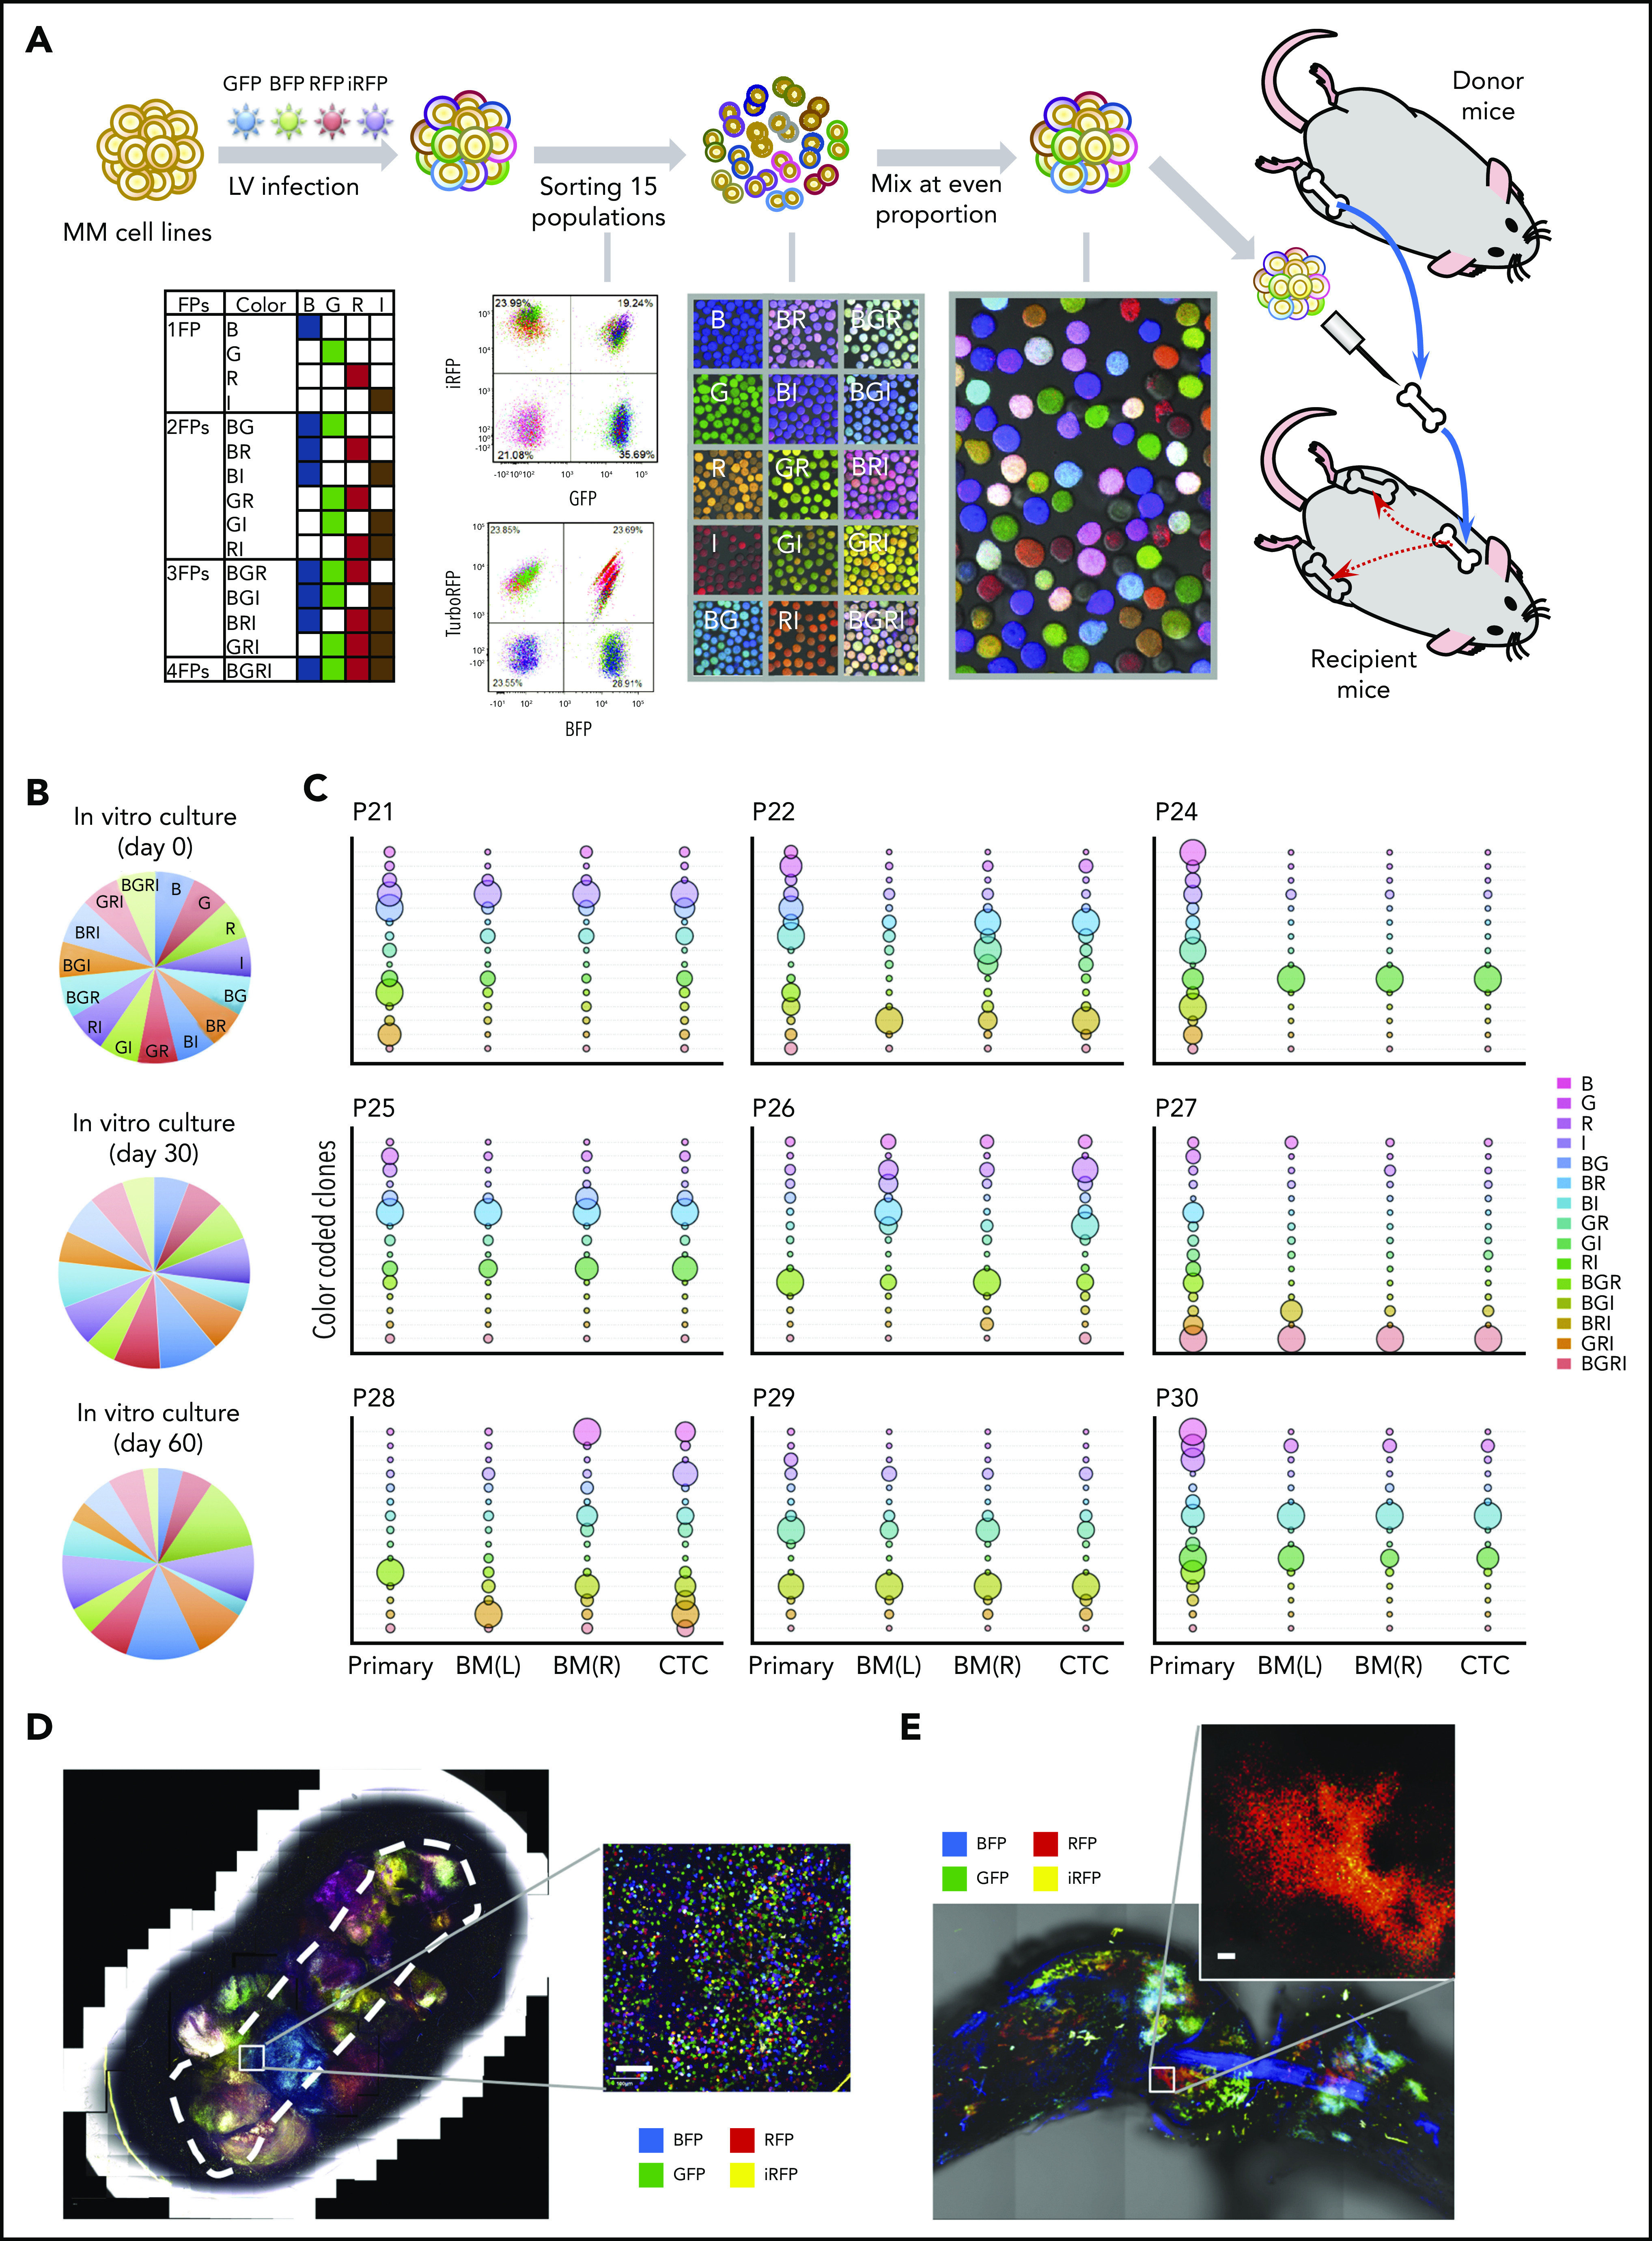
BM dissemination model with color-coded MM cells. (A) A schematic diagram illustrating the study procedures. MM cell lines were transduced with a lentiviral (LV) mixture carrying 4 fluorescent proteins (FPs; BFP [B], GFP [G], RFP [R], and iRFP [I]), generating 15 subpopulations with different fluorescence markers. Each cell population was sorted by flow cytometry, expanded in vitro, and then mixed together at an even proportion. Two million color-coded MM cells were injected into the BM cavity of femoral bones freshly resected from syngeneic donor mice. Then, myeloma-bearing bone chips were subcutaneously transplanted under the dorsal skin of recipient mice. (B) The proportion of each of the 15 subpopulations of cells passaged in vitro throughout the animal experiment did not change. (C) To assess in vivo clonal dynamics in animals during disease course, cells from the implanted bone chip (primary site), left and right femur BM (distant BM sites), and CTCs were analyzed upon symptoms of hindlimb paralysis. Each uniquely colored circle represents a single colored clone in an animal. The area of the circle is proportional to the size of each clone. The proportion of the 15 subpopulations of distant BM sites (left and right femurs) showed biased color distribution, compared with primary implanted sites. Color distributions of left and right femurs were similar to that of matched CTCs. (D-E) Confocal imaging of color-coded MM cells in the primary implanted bone (D) and femur BM (E). Scale bar, 100 μm.
In vivo tracking of rainbow cells reveals clonal selection in distant BM sites
Rainbow cell–bearing bone chips were implanted as described above. Approximately 60 days after transplantation, rainbow cells from in vitro culture, in vivo primary bone chips, and distant BM were isolated and analyzed by flow cytometry. Results revealed that both primary and distant tissues are composed of persistent and fluctuating clones. The fluorescence distribution of in vitro culture was approximately even at days 30 and 60 after transplantation (Figure 1B). By contrast, although all 15 subpopulations in the primary tumor could be detected at day 60, they showed uneven distributions in size, with some colors unequivocally overtaking others (Figure 1C), reflecting the existence of clonal competition even within the primary bone chip, where few “dominant” clones adapted quickly and were able to evolve and outcompete the rest. Upon disease progression, reduced clonal (color) diversity was observed in the distant BM and a few large clones, accounting for majority of all cells (Figure 1C; supplemental Figure 3A). Interestingly, clones that dominate the matched circulating tumor cell (CTC) population were also found to dominate distant BM sites (Figure 1C), consistent with certain clones locally invading the primary tumor parenchyma, intravasating into nearby microvessels, and seeding distant BM sites. Strikingly, although “dominant” clones exhibited intermouse variability, similar “dominant” clones were observed in the left and right femur of each mouse, with tightly correlated fluorescence distributions between matched femurs and CTCs (supplemental Figure 3B). These results suggest that following circulatory dissemination, the tumor microenvironment might be largely similar across different BM sites, allowing for expansion of similar clones with minimal site heterogeneity.
We next sought to understand the clonal architecture within each site by observing the implanted bone chip and distant BM sites with confocal microscopy. Tumor cells appeared to form multiple clusters in both sites. Interestingly, under high magnification, the primary site clusters appeared to comprise various cell subpopulations, as evidenced by the multitude of colors seen in those clusters (Figure 1D), whereas most of distant BM clusters comprised single-color populations (Figure 1E). These results demonstrate the existence of significant spatial heterogeneity within each distant BM site, with clear demarcation of each clone’s area of residence.
Monitoring clonal evolution in vivo at the single-cell level
To improve clone-tracking depth and accuracy, we developed a lentiviral DNA-barcoding system with a 12-base random sequence tag that can generate ≤16 million unique and inheritable barcodes detectable by next-generation sequencing.22 Two million barcoded cells were injected into femurs as described above. As expected, while the pretransplantation pool showed no major clonal bias (Figure 2B), primary tumors, disseminated cells, and CTCs exhibited clonal selection, with distant sites demonstrating much less diversity (Figure 2C). In addition, within each mouse, left/right femurs and CTCs exhibited the same “dominant” clones (Figure 2C), while clonal distributions in different mice were distinct, as evidenced by strong shifts in the respective cumulative distribution rankings (Figure 2D). These results further confirm that clonal competition, in the context of tumor heterogeneity, started at an early stage, and only a small number of clones that can adapt to the environment and evolve quickly to compete with other clones have the ability to successfully disseminate.
Figure 2.
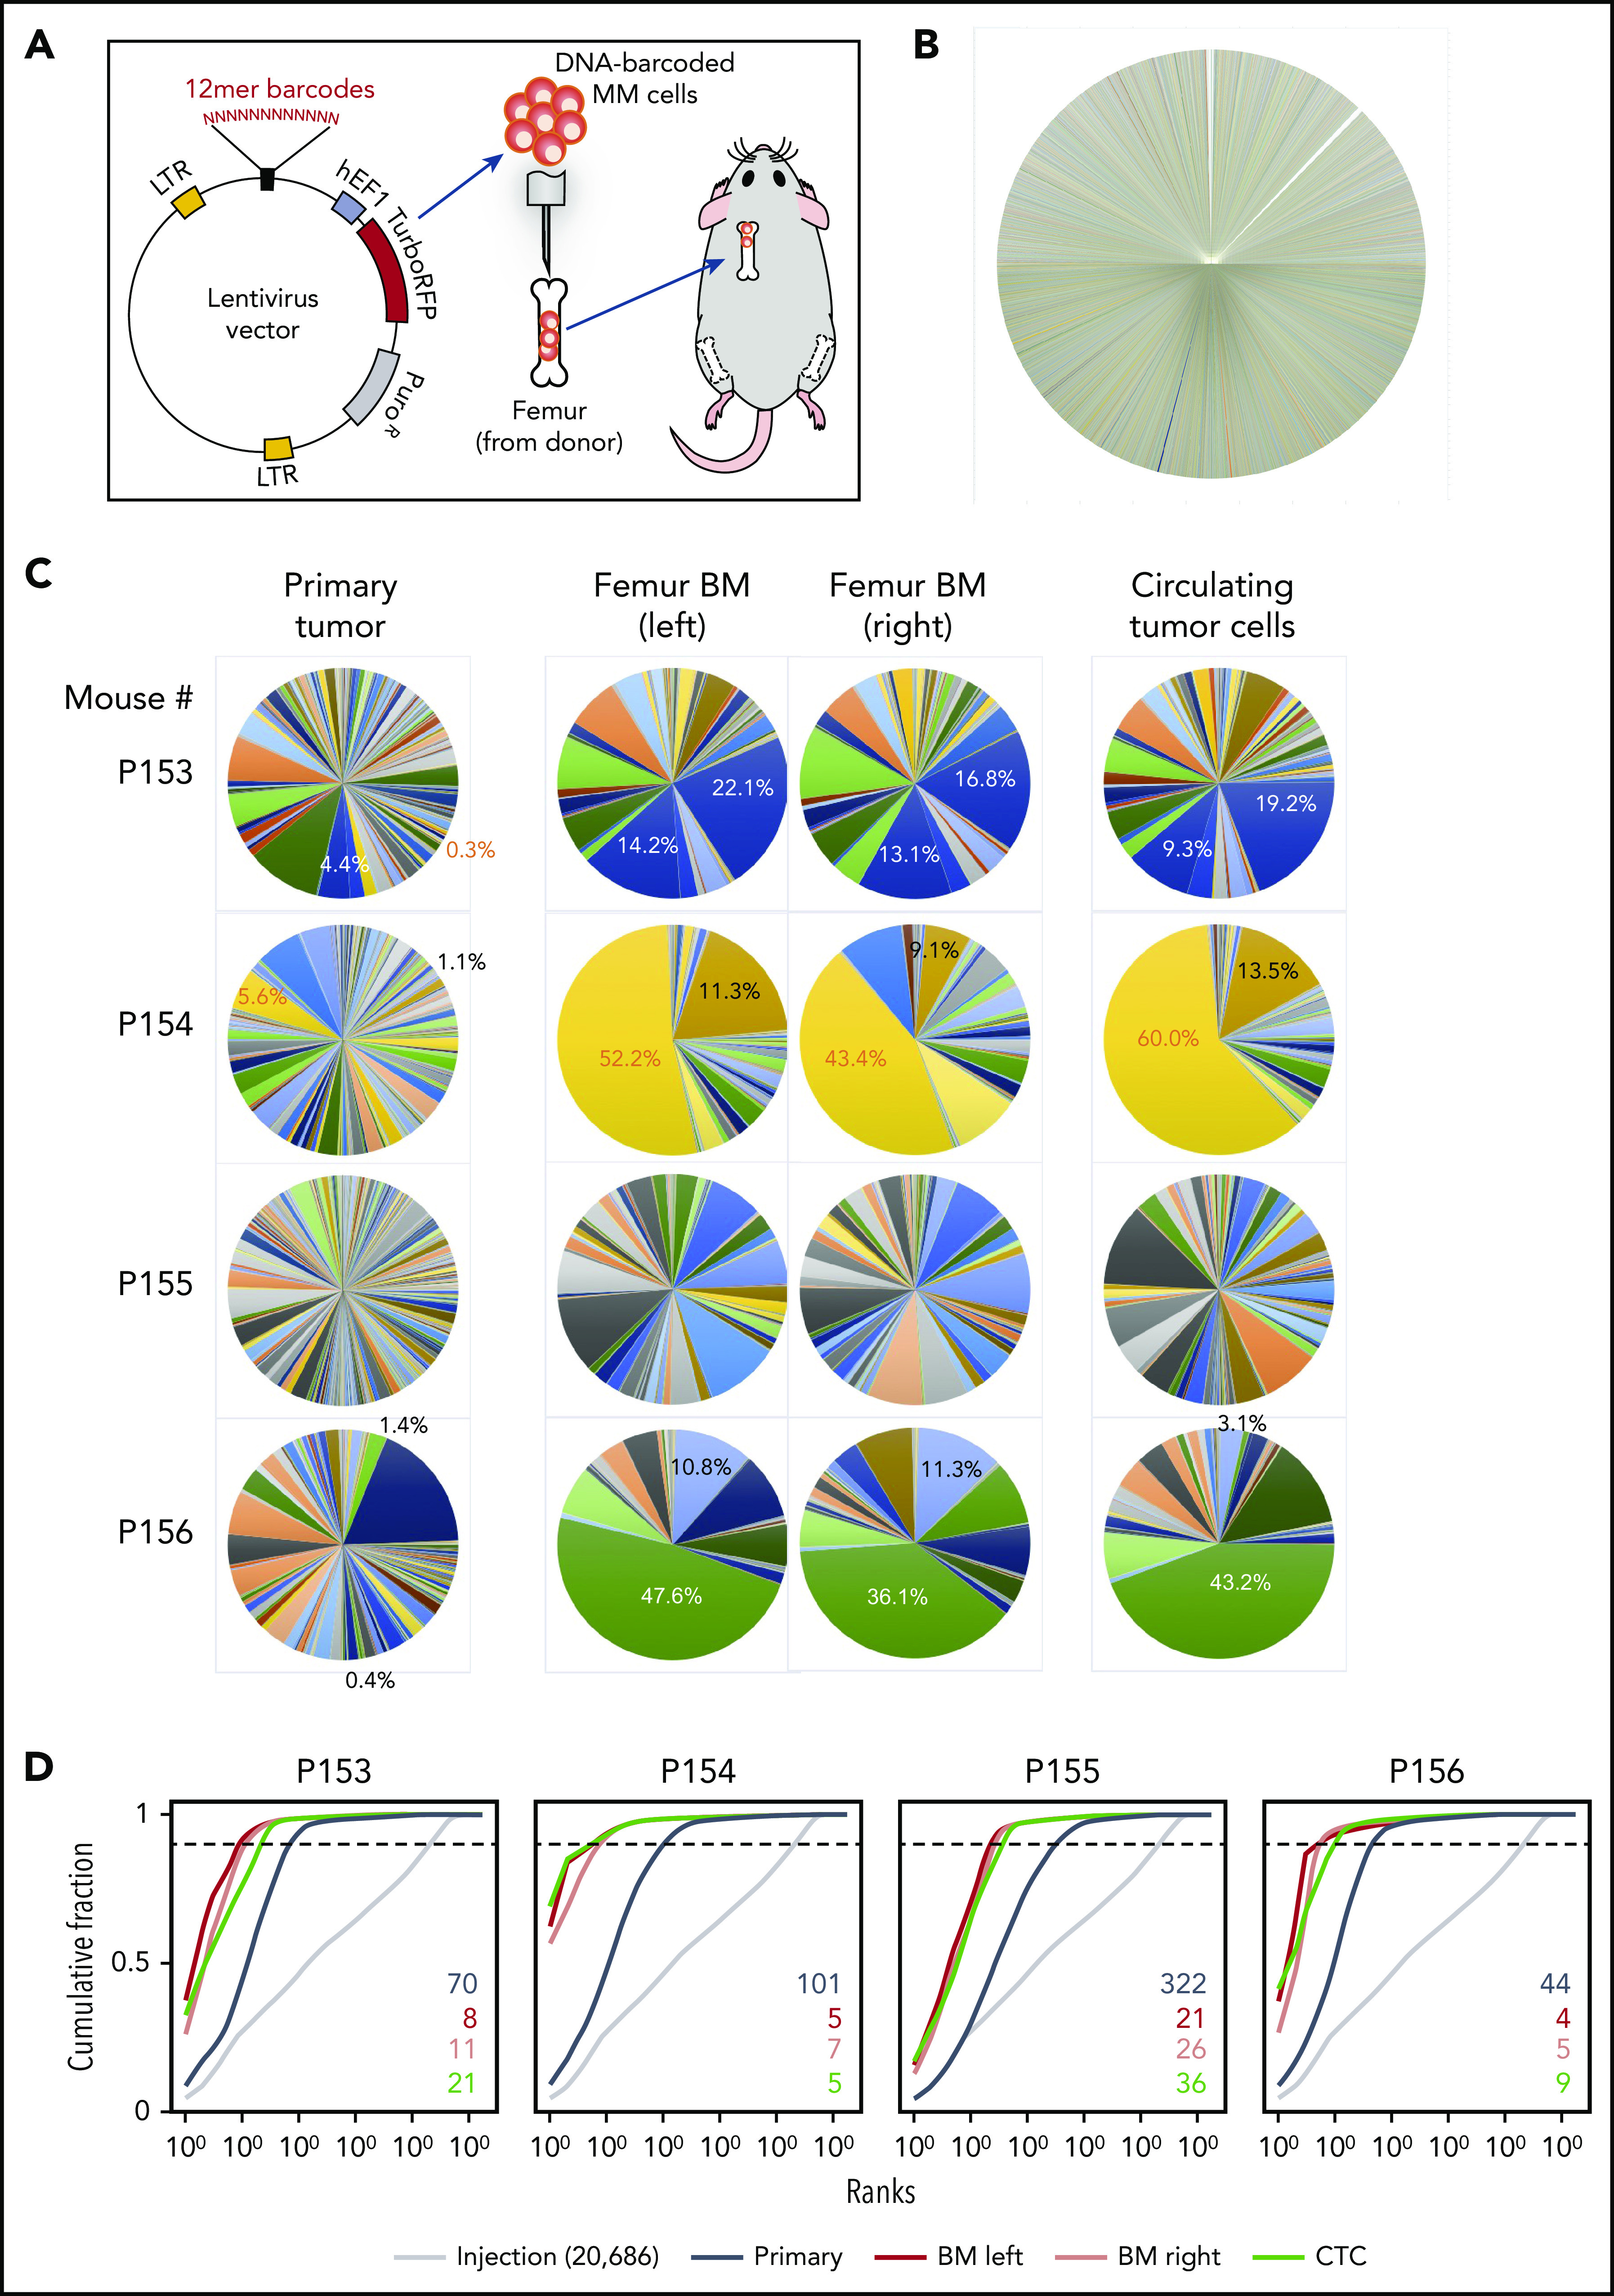
BM dissemination model with DNA-barcoded MM cells. (A) Schematic diagram illustrating the study procedures. Twelve-base random DNA sequences were inserted into the pCW307 lentivirus backbone with RFP as selection marker. MM.1S cells were transduced with the DNA-barcode library and injected into the cavity of femurs freshly harvested from donor mice. Myeloma-bearing bone chips were subcutaneously transplanted under the dorsal skin of recipient mice. (B) Pie chart of barcode diversity in preinjection cell pool shows absence of major clone bias. (C) The proportions of barcoded clones in the implanted bone chip (primary site), left and right femur BM, and CTCs. (D) Cumulative ranking of barcodes from primary tumor site, distant BM site, and CTCs from 4 representative mice. Dotted cutoff lines indicate a threshold, which represents 90% of the total reads. Colored numbers are the number of barcodes that represents 90% of total reads in different sample types. LTR, long terminal repeat.
We also compared different injection methods on clonal evolution. The clonal distributions of CTCs and disseminated BMs of both intravenous and intratibial injections had much higher diversity (supplemental Figure 4), indicating that clonal selection/competition power was much lower than bone chip model. The implanted bone chip acts as a strong bottleneck that selects for cells that are able to first survive at the primary sites and it is out of those that circulation is permitted, enabling a clearer tracking of winning clones from primary tumor to circulation and to distant BM. Thus, PrEDiCT model largely reflects a multistage process of dissemination/metastasis, including invading the local primary tissue, intravasating into the tumor vasculature, circulating, and ultimately extravasating into the parenchymal of distant tissue for further colonization.23-25
A “progression signature” identified from the PrEDiCT model correlates with MM patient survival
To explore the molecular mechanisms underlying disease progression, we performed RNA sequencing on 3 human cell lines (MM.1S, IM-9, and OPM2) harvested from matched primary bone chips and distant BMs separately. Since IM-9 is an Epstein-Barr virus–transformed B lymphoblastoid cell line derived from MM patients and MM.1S and OPM2 have notable genetic differences, such as mutation status of the TP53 gene, we thus used MM.1S as our main model for signature discovery and OPM2 and IM-9 as references. Differential expression analysis identified 1109 upregulated genes and 1865 downregulated genes in the MM.1S model at an FDR cutoff of 5% (supplemental Table 1). The top 300 up- and downregulated genes were selected as a signature to track the dissemination potential of MM cells (Figure 3A), and we designated this gene set as the progression signature. We employed gene set enrichment analysis and showed that both up- and downregulated signatures were significantly enriched in the IM-9 model (supplemental Figure 5A-B), and only downregulated signatures were also significantly repressed in the OPM2 model (supplemental Figure 5C).
Figure 3.
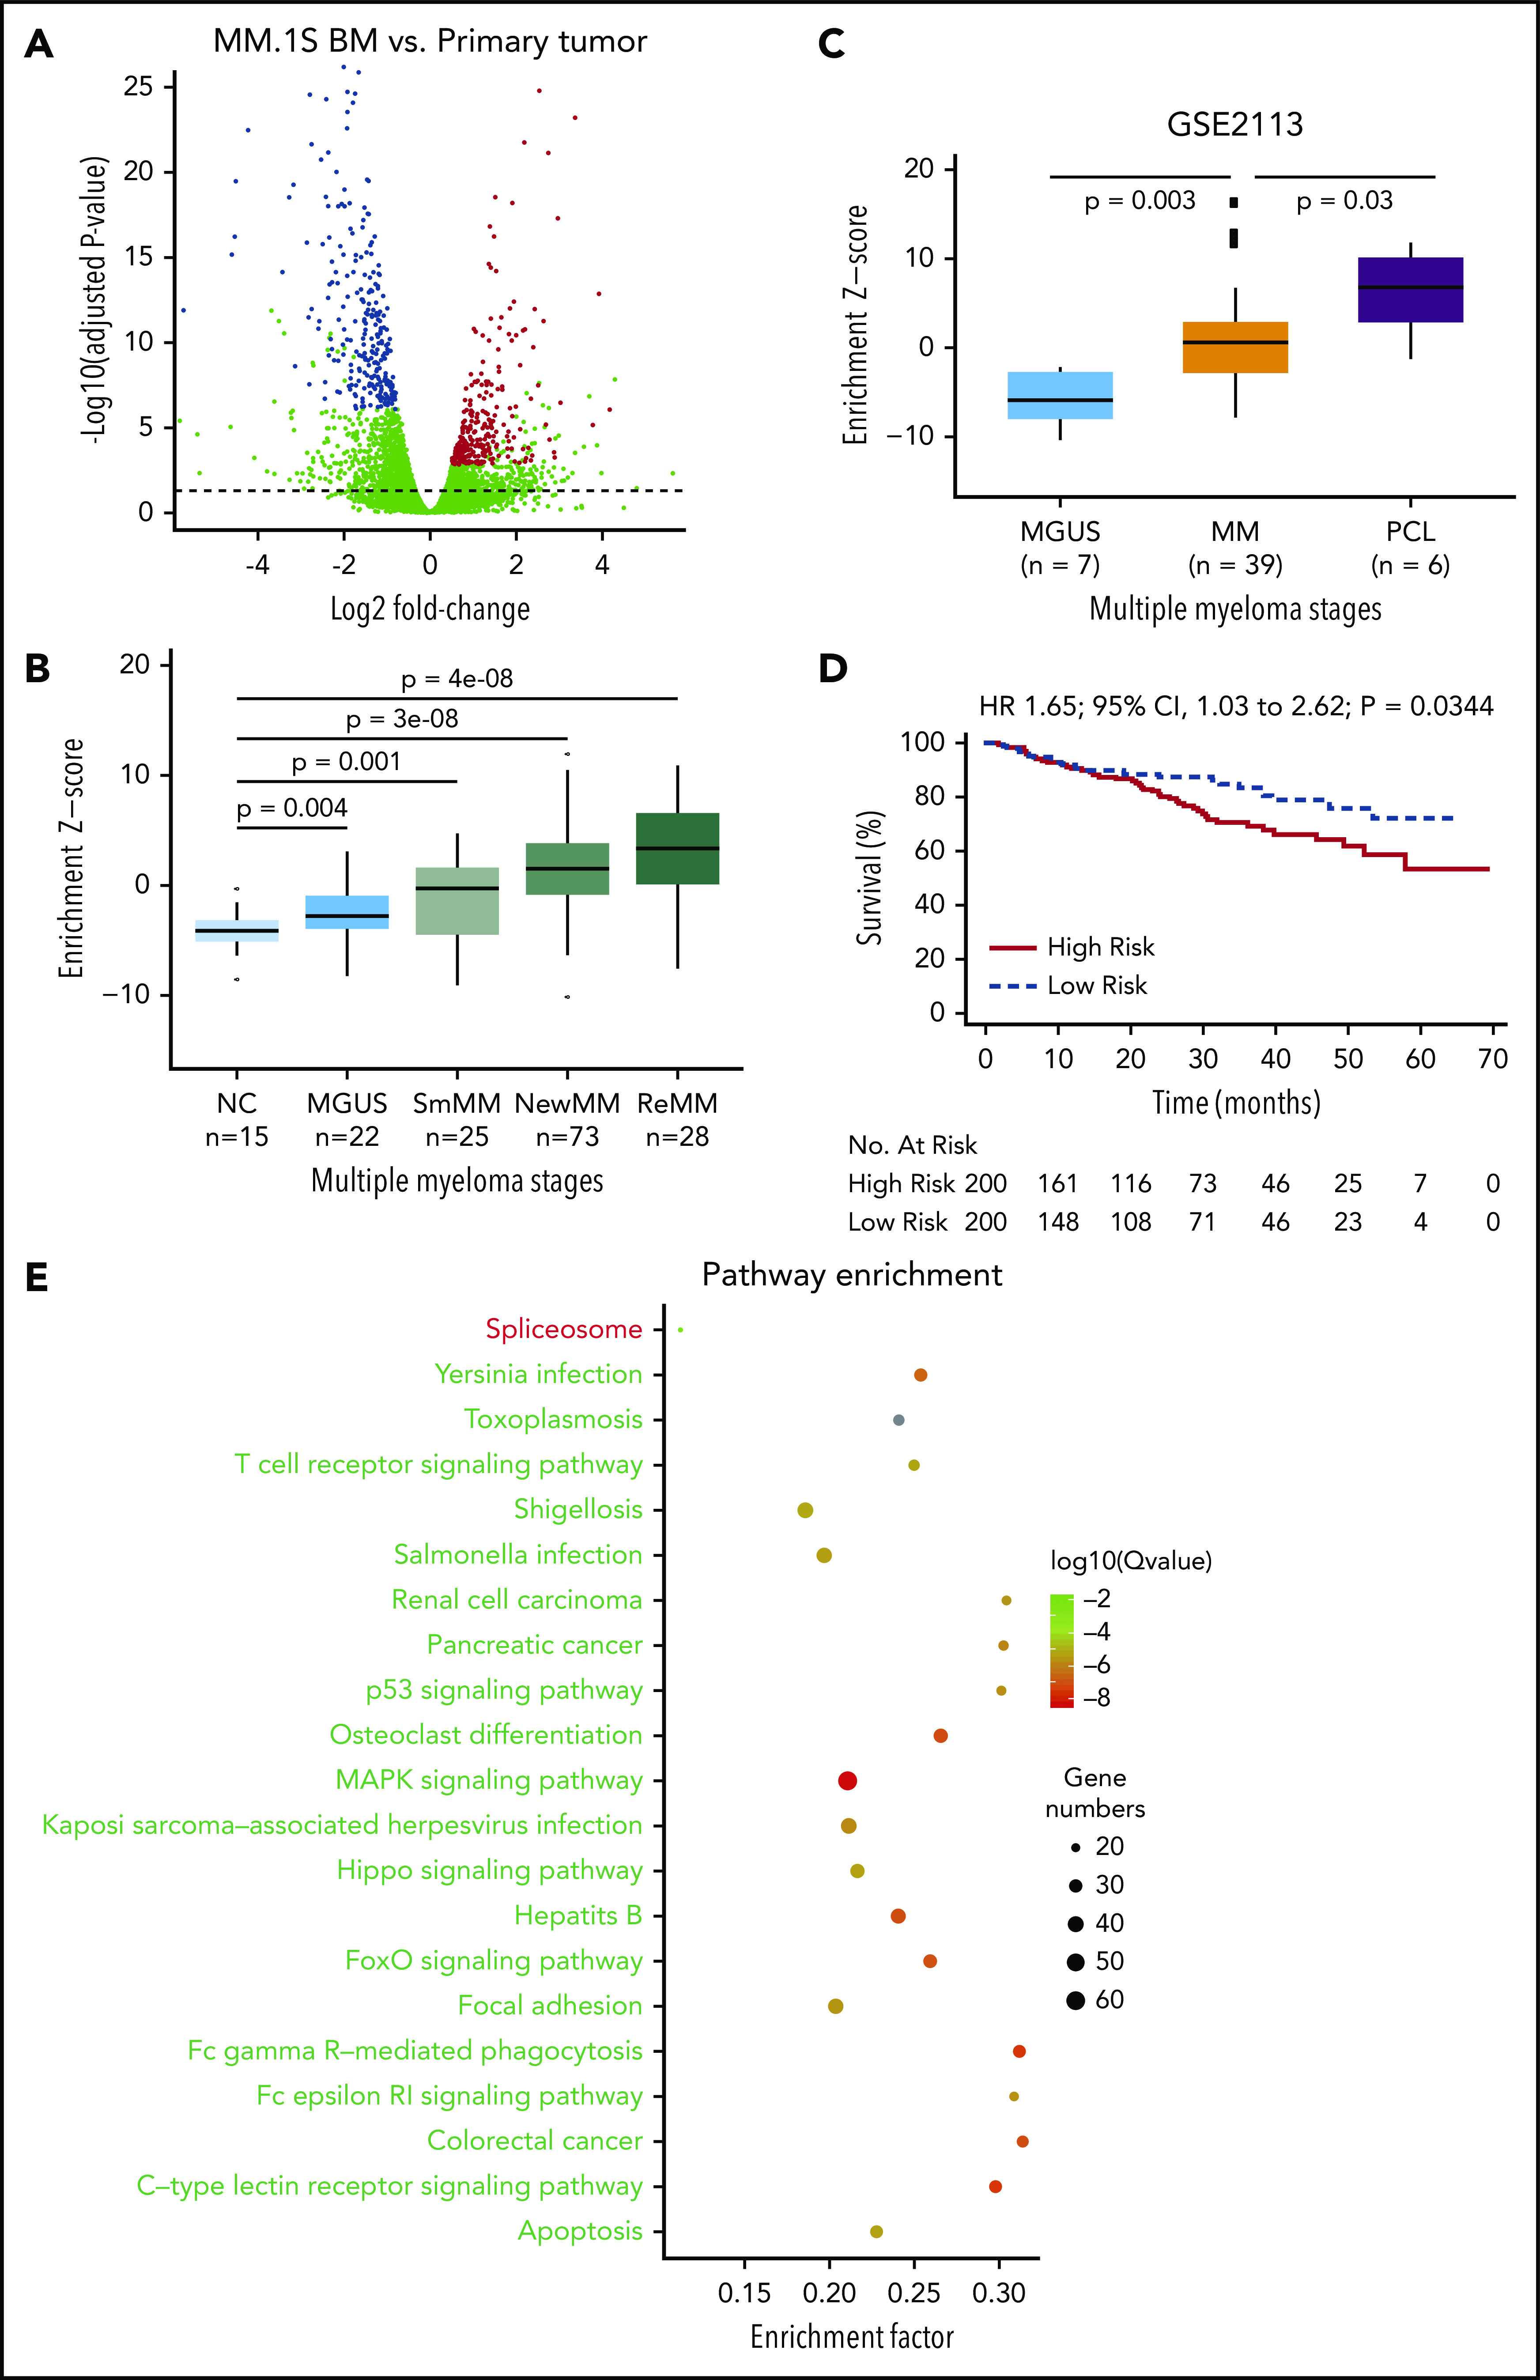
Identification and validation of the MM progression signature. (A) Differential expression analysis was performed by comparing samples from distant BM sites and primary sites in MM.1S model using DESeq2 (FDR <5%). Differentially expressed genes were defined by an FDR cutoff of 5%, as indicated by the horizontal dashed line. The top 300 up- or downregulated genes with highest significance were defined as a progression signature, highlighted in blue (downregulated) or red (upregulated). (B) Association of the progression signature to MM progression and relapse. A Z score was used to quantify the enrichment level of the signature for each gene expression profile in data set GSE6477 (see “Methods”). Distributions were compared between MM stages during disease progression to healthy donors, using Wilcoxon rank sum test. Number of samples in each group and P values are shown. (C) Association of the progression signature to MM progression and aggressive disease. A Z score was used to quantify the enrichment level of the signature for each gene expression profile in data set GSE2113. Distributions were compared between MM stages during disease progression, using Wilcoxon rank sum test. Number of samples in each group and P values are also shown. (D) The progression signature acts as a predictor of overall survival in MM patients. Using a public data set of patient gene expression (GSE24080), the top 200 patients with the highest enrichment of progression signature were defined as a high-risk group, while those with the lowest enrichment were defined as a low-risk group. Statistical comparison was performed by log-rank test. (E) Pathway enrichment analysis of differentially expressed genes in MM.1S model. R package was used to assess significance of KEGG pathways. Top repressed or activated pathways were shown in green or red, respectively. The full list of significant pathways can be found in supplemental Table 5. CI, confidence interval; HR, hazard ratio; MAPK, mitogen activated protein kinase; NC, negative control; NewMM, newly diagnosed MM; PCL, plasma cell leukemia; R, receptor; ReMM, relapsed MM; SmMM, SMM.
Next, we sought to validate the relevance of this signature in human MM progression using a public patient gene expression data set (GSE6477).26 Strikingly, our signature was sequentially activated during MM progression, with more significant P values observed at later stages (Figure 3B). Of note, signature enrichment could already be detected at the MGUS stage (P = .004), potentially reflecting the malignant potential of this early precursor stage, and was further increased in plasma cell leukemia (Figure 3C), an advanced and aggressive form of MM. Most importantly, the progression signature was significantly associated with inferior overall survival (P = .0344) (GSE24080; Figure 3D; supplemental Figure 6).27 Together, our results suggest that the PrEDiCT model closely mirrors MM disease progression within the patient clinical setting at the phenotypic, cellular, and molecular level. Pathway enrichment analysis of dysregulated genes in MM.1S indicates that several pathways contribute to progression potential of MM cells (Figure 3E; supplemental Table 2). For example, apoptosis and the p53 signaling pathway were repressed, which are related to proliferation and transformation. Some immune pathways, such as Fc γ receptor−mediated phagocytosis signaling, are repressed as well. Spliceosome is the only activated pathway, and its biological significance remains to be explored.
Identification of potential upstream regulators that drive MM progression
Gene expression signatures are known to represent phenotypical markers and do not usually suggest upstream regulators. Previous studies have shown that regulon analysis using the master regulators (MRs) inference algorithm can help identify aberrantly activated tumor drivers.28 Briefly, we applied ARACNe29 on a public MM patient expression data set (GSE6477) and identified a regulatory network, which contains 591 MRs targeting 12 395 genes, with a P value cutoff of 10−8. VIPER28 was then applied to identify potential MRs that could be driving MM progression and dissemination in our model, as measured by enrichment of progression signature. A total of 28 MRs were found to be significant with an FDR threshold of 5%, including 15 activated and 13 repressed regulators (Figure 4A; supplemental Table 3). Of note, some of the repressed MRs were downregulated in distant BM sites, including FOSB, JUN, and KLF6. Next, we looked at the MR gene dependency scores in the Project Achilles data set (v20Q2) and found that the majority of the MRs discovered in our model are indeed essential in MM cell lines (Figure 4B; supplemental Figure 7).30 For the purposes of validation, we selected activated ones, as they may serve as novel therapeutic targets. After ruling out previously reported factors in MM like MYC,31-33 CDKN2A,34-36 TOP2A,37,38 and TCF3,39 as well as nonessential genes in MM based on DepMap data, HMGA1, PA2G4, and TRIM28 were selected based on statistical significance, novelty, and putative functional importance as potential therapeutic targets (Figure 4C).
Figure 4.
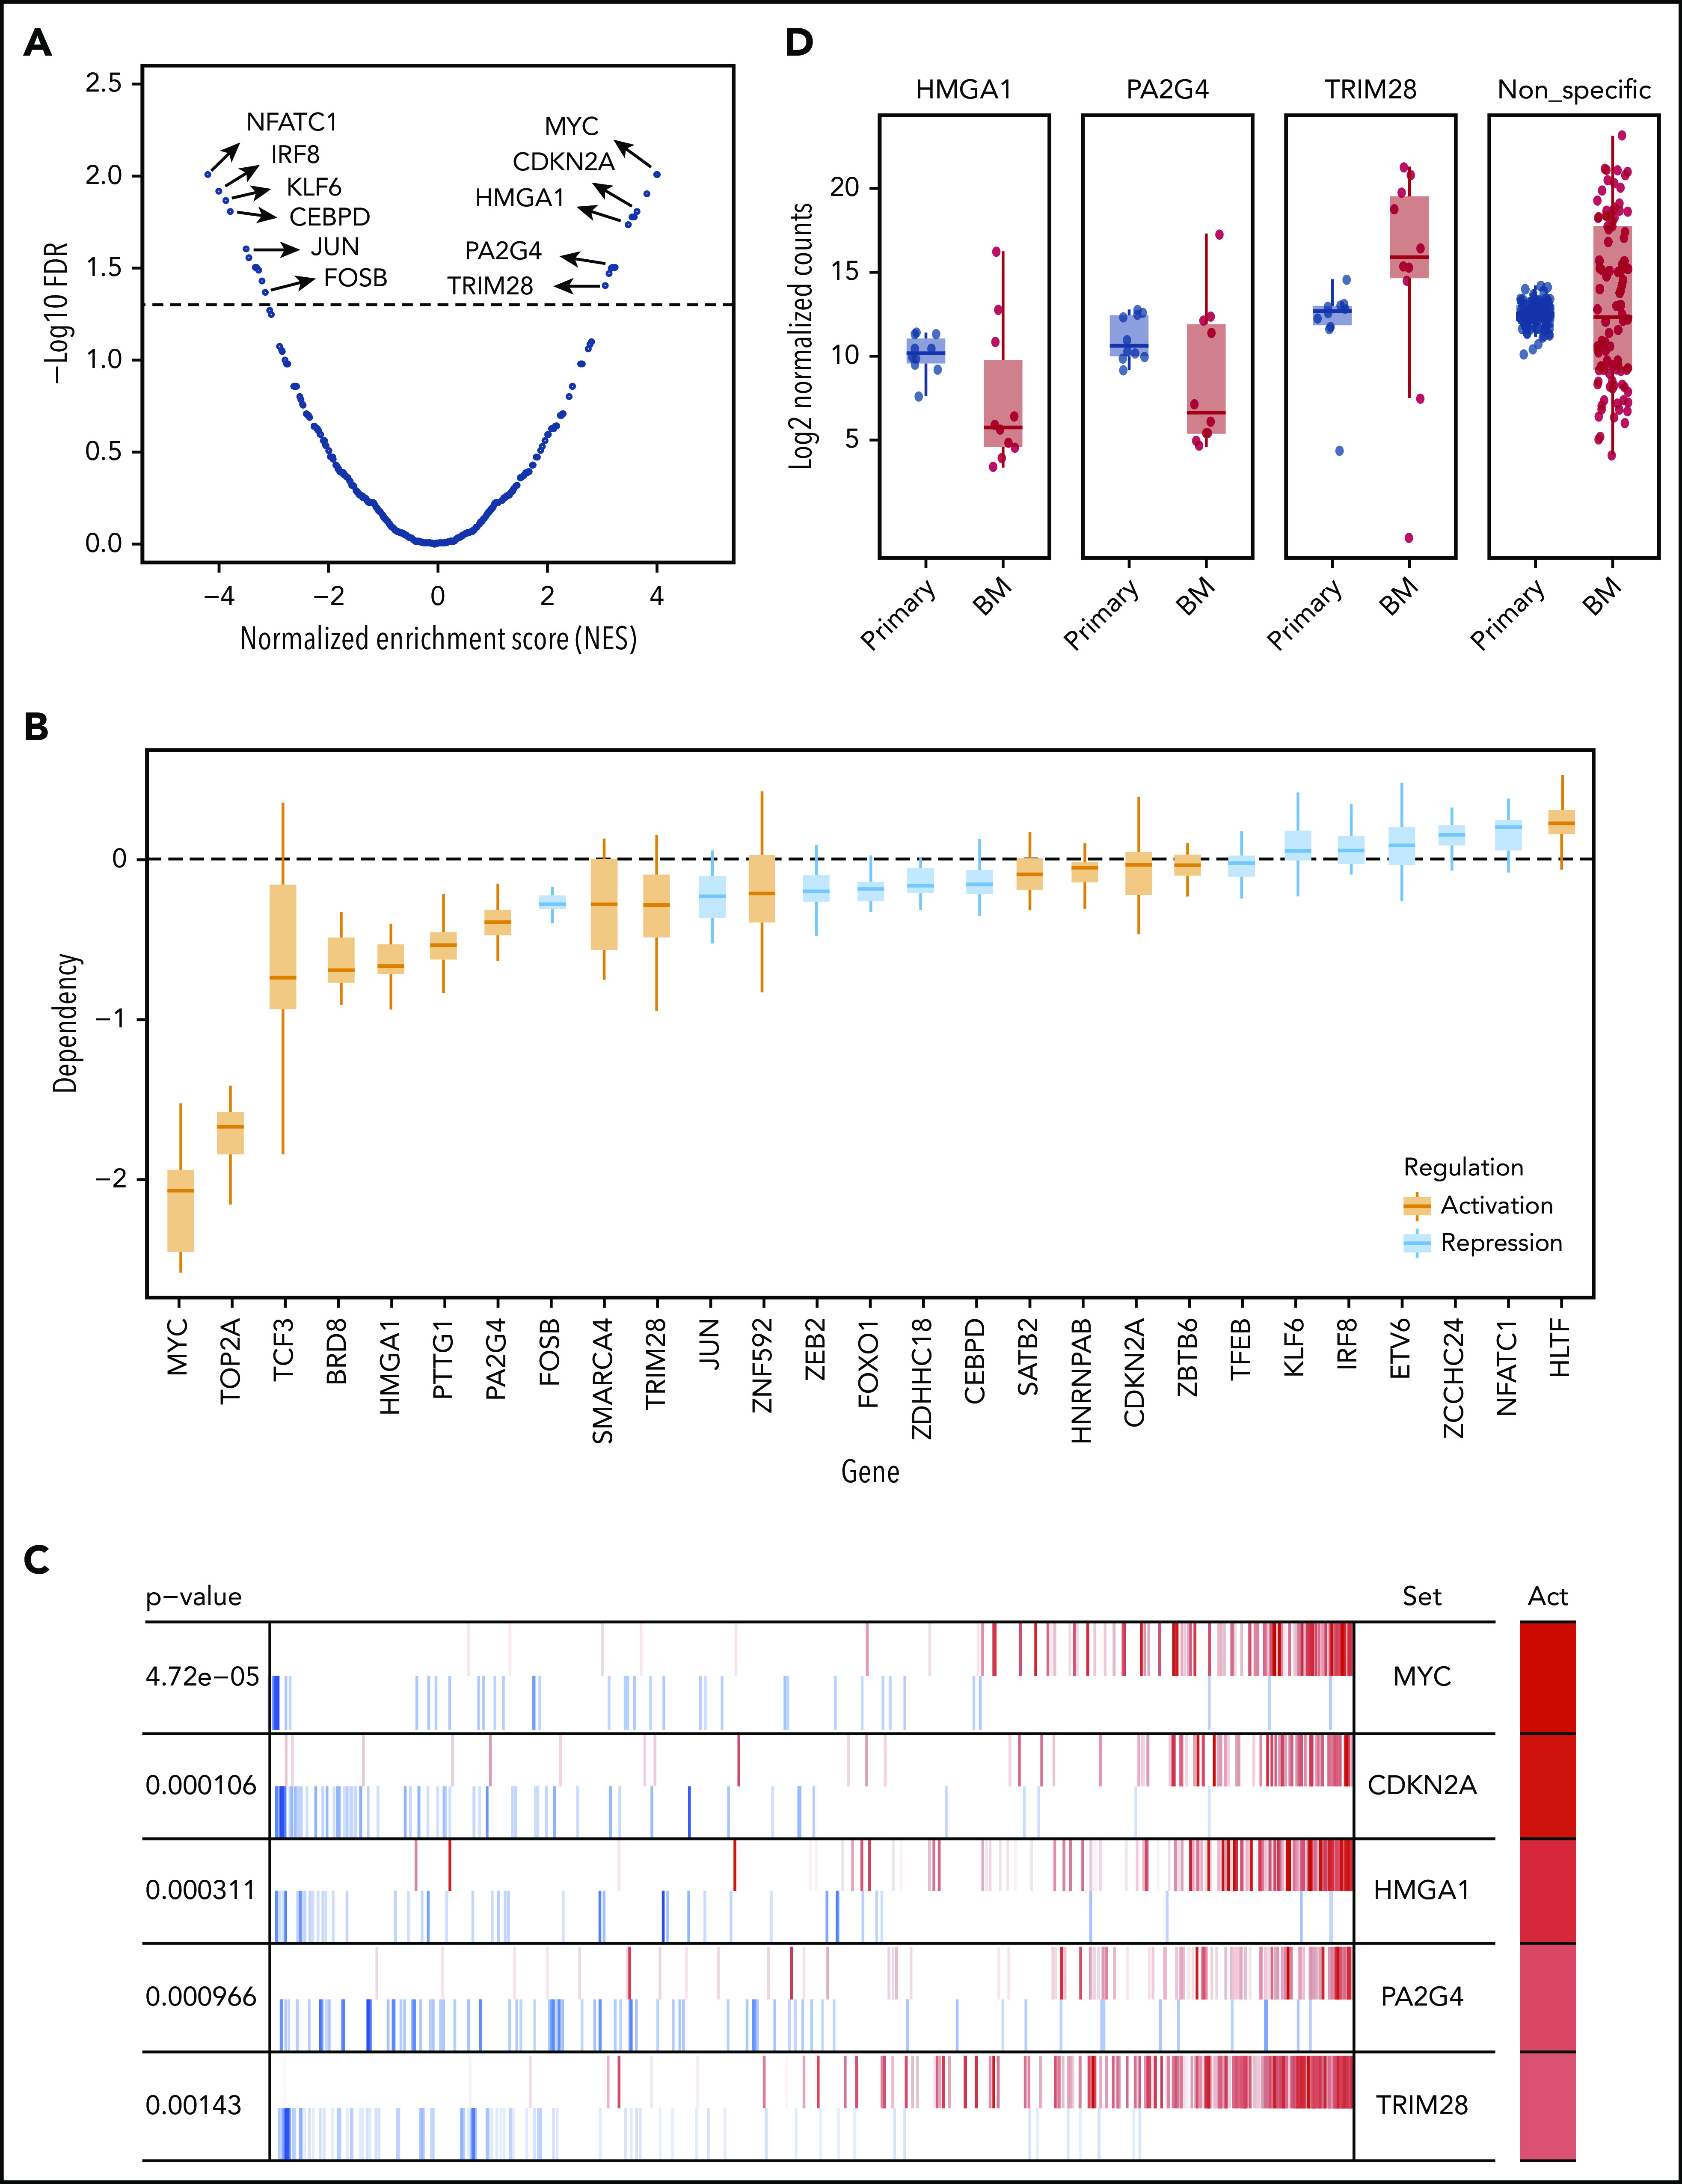
Identification of potential upstream MRs that drive MM progression in the PrEDiCT model. (A) Prediction of MRs. A total of 28 MRs were predicted to be significant (FDR <5%), including 15 activated and 13 repressed ones. Examples of significant MRs were labeled. The full list of significant MRs is shown in supplemental Table 3. (B) Achilles CRISPR dependency scores of all significant MRs, including activated (orange) and repressed regulated (blue) MRs. (C) Example of known and novel MRs in MM. Out of activated (Act) MRs, MYC and CDKN2A rank at the top and are known to be involved in MM progression. HMGA1, PA2G4, and TRIM28 were selected for further experimental validation. (D) Validation of selected MRs by in vivo targeted CRISPR screen. Late-timepoint BM samples from 8 mice were compared with matched primary tumor samples using MAGeCK. The resulting log2 fold changes for each sgRNA were summarized by their targeting gene.
In vivo validation of MRs regulating MM progression using a targeted CRISPR screen
We designed a targeted CRISPR library containing 30 single guide RNAs (sgRNAs) targeting HMGA1, PA2G4, and TRIM28, as well as 100 nontargeting control sgRNAs (supplemental Table 4). Lentiviruses expressing the library were used to transduce MM.1S-GFP-Luc-Cas9 cells, which were then cultured in vitro for 1 week before being transplanted into SCID-beige mice. For each gene, we sequenced and compared distribution of normalized sgRNA counts in both primary tumors and BM at the time of limb paralysis (10-12 weeks after transplantation) using the software package MAGeCK (Model-Based Analysis of Genome-wide CRISPR/Cas9 Knockout).40 sgRNAs targeting HMGA1 and PA2G4 were first significantly depleted in the late-stage primary sites compared with injection pool (supplemental Figure 8A) and further depleted in distant BM sites, as compared with primary sites, while nonspecific sgRNAs have similar median read counts in primary tumor and BM (Figure 4D). Both HMGA1 and PA2G4 were upregulated MRs, which tend to be essential for cell survival in MM cell lines (Figure 4B), indicating both genes can be potential targets for treating myeloma. When looking at the gene expression data from different stages of MM using GSE6477 data set, expression levels of both HMGA1 and PA2G4 were found to be significantly higher in newly diagnosed and relapsed MM (P = .011 and P = .013, P = 3.90e-05, and P = 1.23e-04, respectively) compared with healthy donors, and in the case of PA2G4, expression levels were even significantly higher in MGUS and SMM (P = .019 and P = .04, respectively) (Figure 5). Our results suggest that these genes become increasingly important to MM cells as the disease progresses, confirming their importance in myeloma progression and as potential therapeutic targets.
Figure 5.
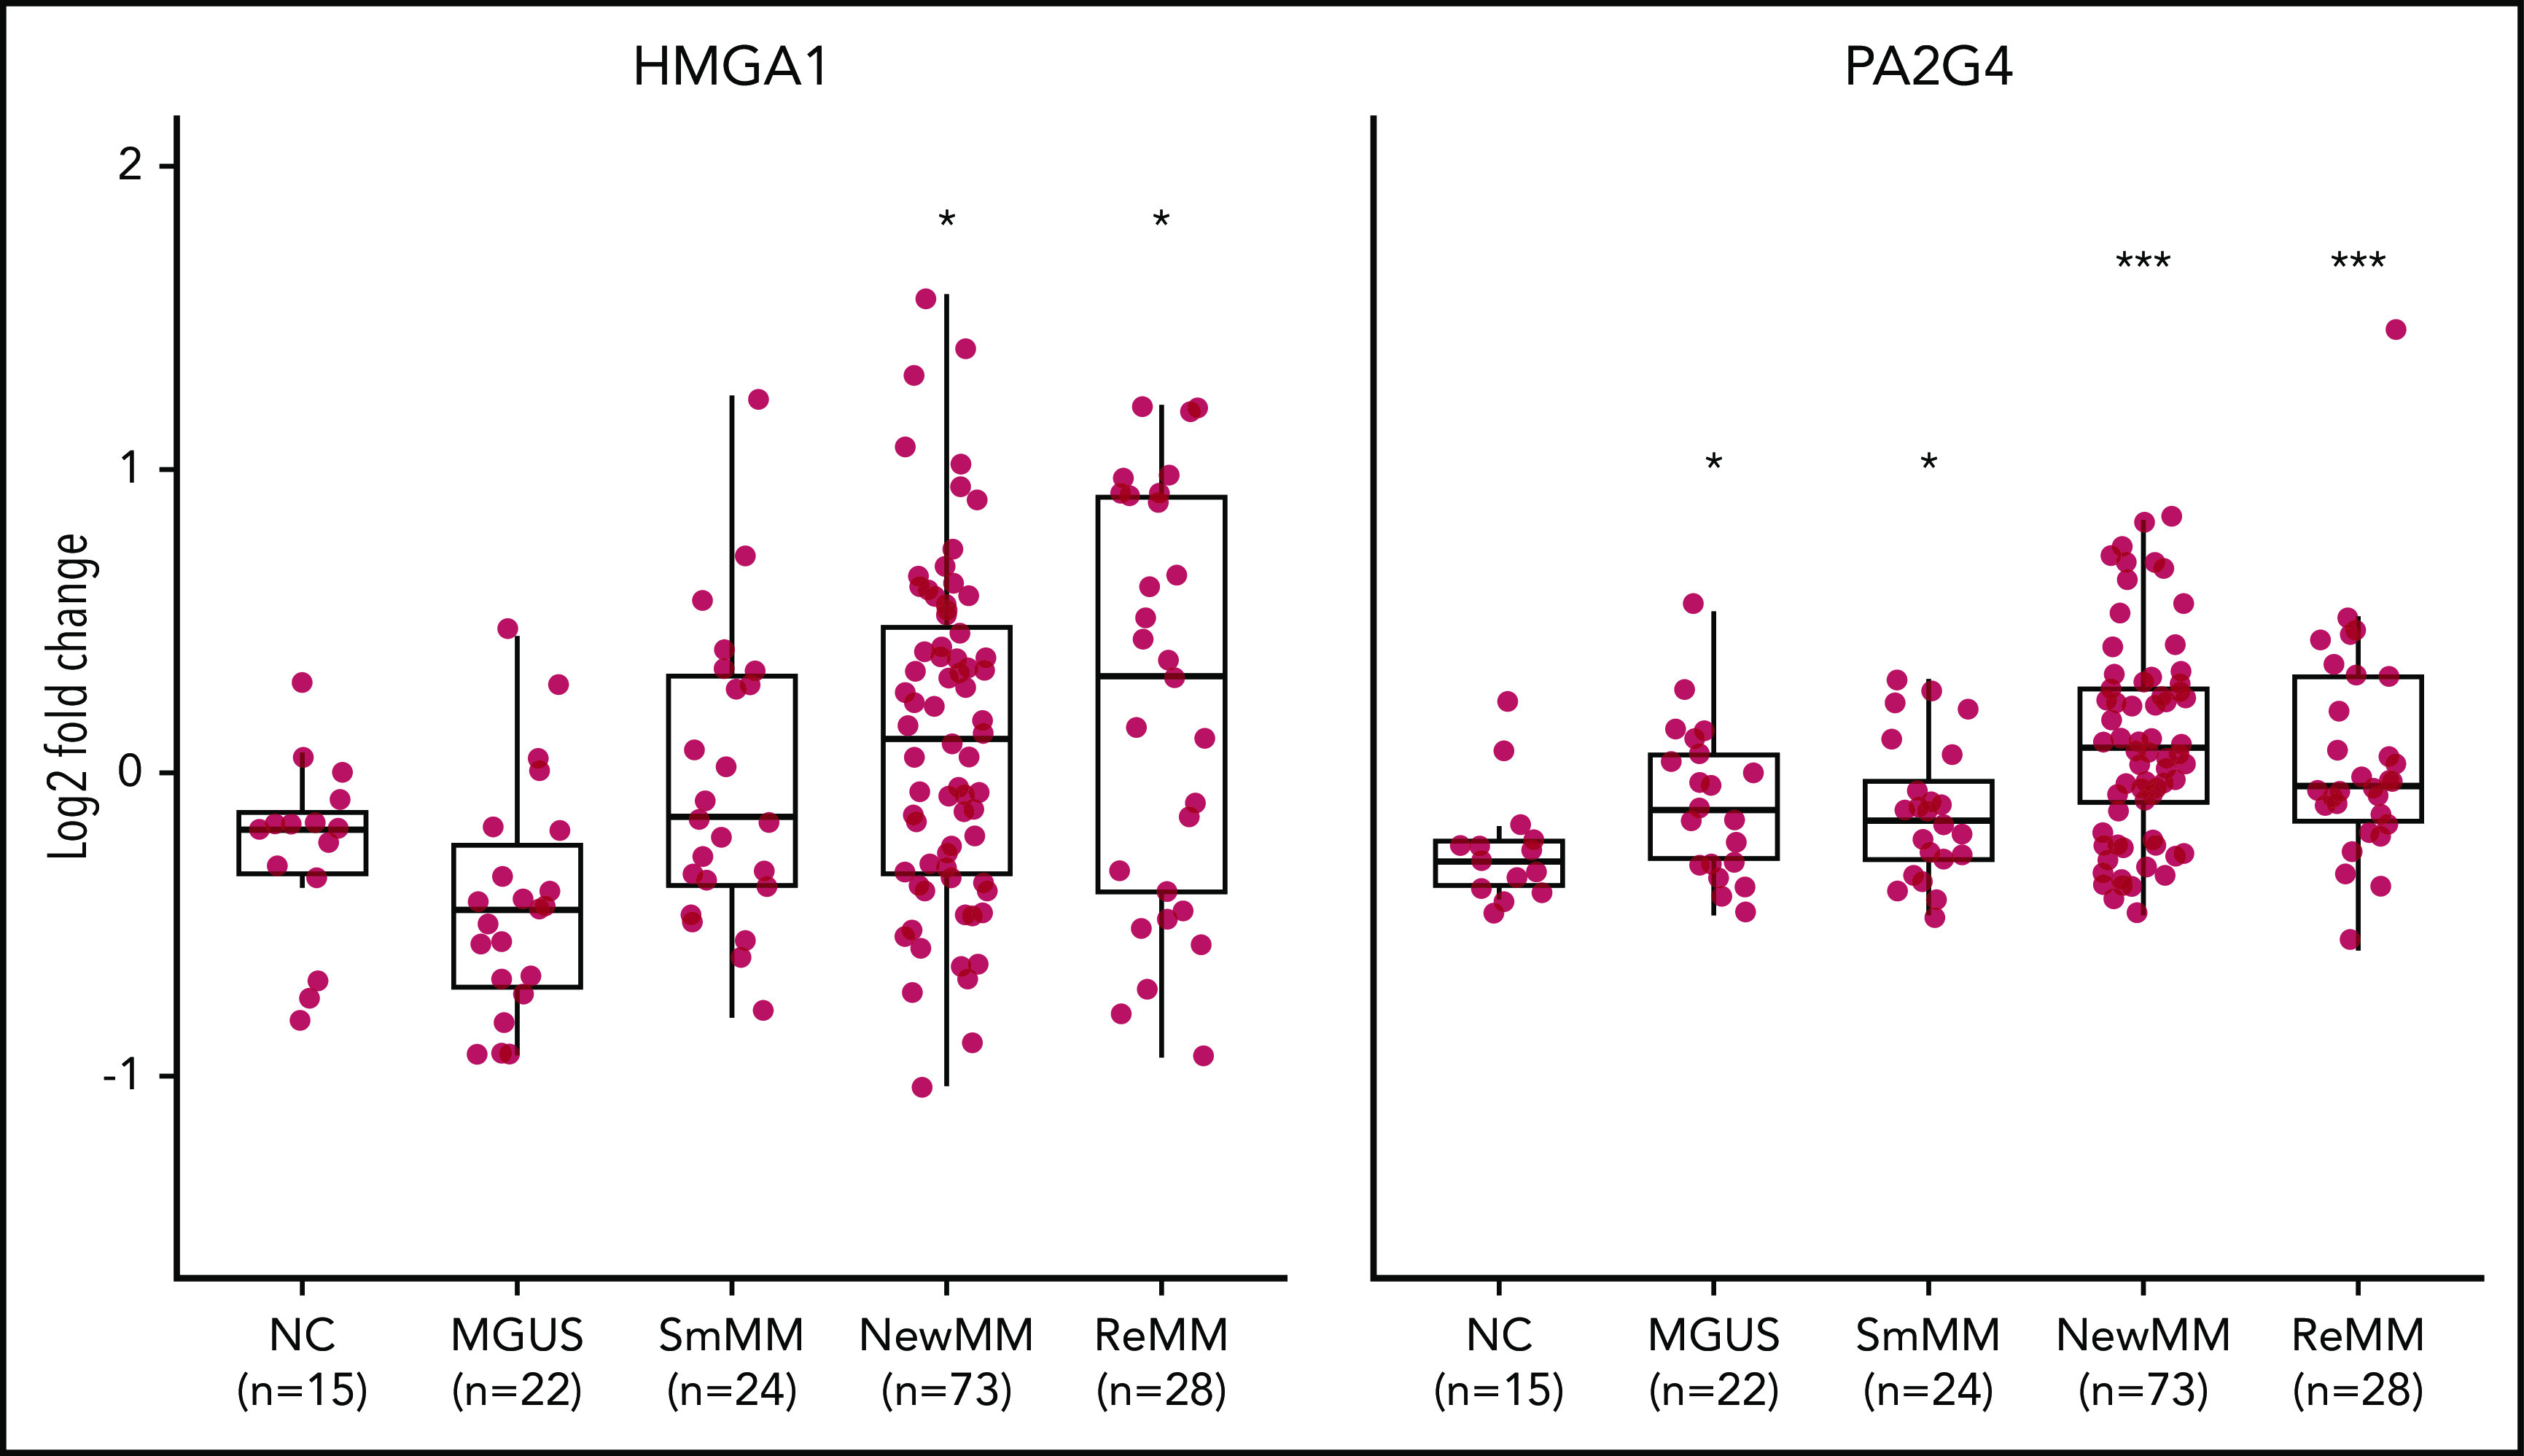
Elevated expression levels of validated MRs in human MM. Log2 fold change analysis showing expression levels of HMGA1 (left) and PA2G4 (right) in healthy negative control (NC), MGUS, SMM (SmMM), newly diagnosed MM (NewMM), and relapsed MM (ReMM) patients in the GSE6477 data set. Statistical comparison was performed by 1-sided rank sum test compared to NCs. *P < .05, ***P < .001.
We next tested whether HMGA1 and PA2G4 regulate the same set of genes from progression signature. Loss of HMGA1 and PA2G4 were confirmed by western blot (supplemental Figure 8B). Real-time polymerase chain reaction was performed on these cells for 5 significantly upregulated (CD38, FANCF, MGST1, AARSD1, and LBR) and 5 downregulated (KLF6, LGMN, SIRT2, GAB1, and TIPARP) genes shared by the MM.1S, OPM2, and IM-9 models. Interestingly, among those genes activated at disseminated sites, CD38, FANCF, and LBR had significantly reduced expression in HMGA1-deficient cells, but not in PA2G4-deficient cells (supplemental Figure 8C). Expression levels of both MGST1 and AARSD1 were slightly increased in both HMGA1- and PA2G4-knockout cells. Similarly, for the 5 genes downregulated at disseminated BM sites, loss of HMGA1 and PA2G4 drastically increased the expression of LGMN, SIRT2, and TIPARP, but only loss of PA2G4 increased KLF6 expression (supplemental Figure 8D). These data suggest that these 2 MRs potentially regulate different gene networks to give cells distinct advantages for disease progression; in other words tumor heterogeneity gives rise to subclones that possess different evolutionary advantages over the others within the tumor environment.
Loss of HMGA1 and PA2G4 compromised the proliferation, migration, and adhesion ability of MM cells in vitro
To further confirm the important roles of HMGA1 and PA2G4 in driving MM progression, we performed in vitro proliferation, migration and adhesion assays with and without BM stromal cells (BMSCs) isolated from relapsed/refractory MM patients. The overall proliferation rates of MM.1S were increased when cocultured with BMSCs; however, loss of HMGA1, PA2G4, and MYC caused significant reductions in proliferation when compared with control cells in both culturing conditions (Figure 6A). We used MYC here as a positive control. Similarly, all knockout cells all showed significantly reduced migration and adhesion (Figure 6B and 6C) toward BMSCs, confirming the important roles of these genes in driving MM progression and dissemination. Interleukin-6 is a proinflammatory cytokine crucial to the growth, proliferation, and survival of myeloma cells.41-43 Addition of 10 ng/mL interleukin-6 increased overall proliferation and migration; however, loss of HMGA1, PA2G4, and MYC compromised the proliferation and migration ability of MM cells significantly (supplemental Figure 9).
Figure 6.

Loss of HMGA1 and PA2G4 inhibited proliferation, migration, and adhesion potential of MM cells in vitro. (A) MM.1S cells infected with nontargeting control sgRNAs or HMGA1, PA2G4, and MYC targeting sgRNAs were cultured with and without BMSCs from relapsed/refractory MM patients for 48 hours. Proliferation rates were normalized to control sgRNA–infected cells cultured without BMSCs, and cells with loss of HMGA1, PA2G4, or MYC exhibited significantly reduced proliferation. (B) BMSCs were seeded 1 day ahead in the lower chamber of 96-transwell plate. MM.1S cells transduced as described in panel A were seeded in the upper chamber for 4 hours. The percentage of cells that migrated to the lower chamber was normalized to control cells without BMSCs, and cells with loss of HMGA1, PA2G4, or MYC exhibited significantly reduced migration toward BMSCs. (C) MM.1S cells transduced as described in panel A were prelabeled with Calcein-AM and cocultured with preseeded BMSCs for 2 hours. The percentage of cells that adhered to BMSCs was normalized to control sgRNA–infected cells, and loss of HMGA1, PA2G4, or MYC compromised the adhesion rates significantly. Two experiments from 2 independent infections were performed, and 1 representative result is shown. Error bars indicate standard deviation. *P < .05, **P < .01, ***P < .001.
Discussion
MM is an incurable plasma cell malignancy of the BM. Although many alterations regulating MM disease progression are tumor cell autonomous, be they genetic or epigenetic,8,44-46 they are not the sole determinants of tumor behavior and are insufficient to induce progression and dissemination.47,48 A permissive microenvironment is required for overt malignancy to emerge.47,49 Indeed, studies have shown that the tumor microenvironment is a key regulator in many steps of the invasion-metastasis cascade, including oncogenesis, egress, protection in the circulation, preparation of the metastatic niche, organ-specific homing, and tumor colonization.50 As such, disease progression in MM is the result of a well-orchestrated, complex network of interactions that cannot be studied outside of the context of the BM microenvironment. Our goal in this study was to develop a xenograft mouse model to reproduce the clonal evolution underlying dissemination/metastasis in progressing patients in the context of stromal microenvironment and enable the investigation of mechanisms underlying these events where mathematical analysis and library or drug screening can be further performed.
Studies by many groups have made the effort to track clonal outgrowth and dissemination in syngeneic mouse models using intravenous injection method, and similar conclusions were made that establishment of dissemination/metastasis is extremely inefficient and individual clones exhibited marked differences in proliferation and gene expression patterns in BM niche.51-53 We also compared the differences in clonal evolution using bone chip, intravenous, and intratibial injection methods and observed significantly reduced clonal diversity in CTCs and distant BM in the PrEDiCT model, indicating that clonal selection/competition power was much higher. The implanted bone chip acts an optimal niche but a strong bottleneck that selects for cells that first survive at primary sites, and it is out of those that circulation is permitted. PrEDiCT could model the entire dissemination/metastatic cascade (invasion, intravasation, circulation, extravasation, and colonization). This approach revealed 3 major findings: (1) clonal competition was already present at the primary sites; (2) establishment of CTCs was extremely inefficient, and the efficiency was further decreased at distant BM sites; and (3) the individual disseminated MM cells exhibited marked differences in their proliferative fates, with the majority of final tumor burden within a bone being attributable to the progeny of very few clones. Thus, the PrEDiCT model provides a powerful platform for studying the role of tumor cell–autonomous alterations and BM stromal compartment in MM disease progression.
In an effort to elucidate expression changes associated with progression, we performed RNA sequencing on tumor cells (MM.1S, IM-9, and OPM2) isolated from primary and distant BM sites at the time of limb paralysis. We identified significantly up and downregulated genes shared across cell lines and designated those found significant in MM.1S cells as “progression signature.” In light of the data that tumor cells alone are not sufficient for dissemination/metastasis without the presence of a BM environment, the progression signature from the PrEDiCT model would reflect the changes in adaptation to the primary and secondary bone environment as well as the intrinsic evolutionary advantages evolved to enable dissemination during progression. Confirming our model’s relevance in studying human MM progression, gene set enrichment analysis of patient expression data showed that the progression signature was sequentially activated during MM progression, and more significant P values were observed when later stages of MM were compared with normal controls. Even more importantly, our signature was shown to be significantly associated with inferior overall survival in patients. These results suggest that the PrEDiCT model adequately represents the biological processes underlying disease progression in MM and thus can be used as a tool to improve our understanding of the mechanisms involved and identify new therapeutic targets.
To demonstrate the potential of our model for therapeutic target detection, we employed a MR analysis approach to identify potential upstream regulators of the progression signature. We selected and validated activated MRs, since they might serve as potential therapeutic targets. Loss of HMGA1 and PA2G4 compromised tumor adaptation to the primary sites and dissemination to distant sites in vivo, and in vitro assays further confirmed compromised abilities of these cells to proliferate, migrate, and adhere to BMSCs, indicating a role for HMGA1 and PA2G4, as progression-related MM additions and loss of both genes compromised the overall ability of tumor cells to overcome each bottleneck in metastasis process. Although HMGA1 has been implicated in oncogenic transformation, invasion and metastasis in various cancers,54-60 its role in pathogenesis and progression of MM is largely unknown. Similarly, PA2G4 has been reported as a regulator for proliferation, but its role in cancers has being paradoxical.61-64 Here, we report for the first time that HMGA1 and PA2G4 were sequentially activated along human MM progression in a public data set65 and might play key roles in regulating dissemination of MM tumor cells within BM microenvironment, potentially as markers and therapeutic targets for progression.
Although both HMGA1 and PA2G4 were validated to be important for MM progression, the gene expression networks regulated by them are very different. Loss of HMGA1, but not loss of PA2G4, caused reduced expression of CD38, FANCF, and LBR, which are activated genes identified from the progression signature, and both genes could only inhibit some of the repressed genes (LGMN, SIRT2, and TIPARP) in the progression signature. This is in line with our clonal tracking observations that tumor clones at metastatic sites had much reduced diversity but still exhibited marked differences, with some clones dominating disseminated sites. In other words, we observed significant tumor heterogeneity from primary tumors to the metastatic sites, which gives rise to subclones that possess an evolutionary advantage over the others within the tumor environment, as manifested by distinct gene expression patterns, metabolism, motility, proliferation, and metastatic potential.
Recent studies showed that tumors are more than insular masses of proliferating cancer cells.1,66,67 Instead, they are complex tissues composed of multiple distinct cell types participating in heterotypic interactions with one another.4,46,68-70 One of the limitations of current model is lacking an intact immune system, while it is technically and experimentally challenging to perform bone chip modeling in syngeneic immune competent mice, we found a permissive BM stromal environment is crucial, because without it, dissemination is not achievable. Indeed, coculture of patient BMSCs with MM cells increased the malignant potential of MM cells, as manifested by significantly enhanced proliferation, migration, and adhesion. It will be interesting to further explore the specific components of stromal compartment and their biological functions in driving dissemination to accelerate our understandings of the complex BM environment in the future.
In summary, we established a novel xenograft mouse model termed PrEDiCT to track clonal dynamics and dissemination of MM, and we further validated HMGA1 and PA2G4 as potential drivers. Our model is unique in its ability to largely mirror the phenotypic, cellular, and mechanistic features of myeloma progression in the context of the BM stromal microenvironment. It constitutes a powerful platform for studying tumor cell and microenvironmental alterations in myeloma progression while providing new opportunities for investigation of mechanisms underlying these events where therapeutic target discovery or drug screening can be further performed.
Supplementary Material
The online version of this article contains a data supplement.
Acknowledgments
This work is supported by National Institutes of Health, National Cancer Institute grants R01 CA181683-01A1 and R01 CA205954-01, Leukemia and Lymphoma Society grant 7004-14, and the Multiple Myeloma Research Foundation. A.M.R. was supported by Fondazione Associazione Italiana per la Ricerca sul Cancro (AIRC), Fondazione Regionale per la Ricerca Biomedica (Regione Lombardia), and JTC 2016 ERA-NET Transcan-2. Y.J.S. received a Young Investigator Award from the International Myeloma Society.
Footnotes
The data reported in this article have been deposited in the Gene Expression Omnibus (GEO) database (accession number GSE121007). Additional data sets include MM patient samples from different disease stages (GEO accession numbers GSE6477 and GSE2113) and MM patient survival data (GEO accession number GSE24080).
For original data, please contact irene_ghobrial@dfci.harvard.edu.
The publication costs of this article were defrayed in part by page charge payment. Therefore, and solely to indicate this fact, this article is hereby marked “advertisement” in accordance with 18 USC section 1734.
Authorship
Contribution: Y.J.S., Y.M., J.S., and I.M.G. designed the study and wrote manuscript; Y.J.S., Y.M., J.S., M.M., S.M., A.M.R., A.S., Y.-T.T., Y.K., N.K.S., and B.B. performed the experiments; and Y.J.S., Y.M., J.S., R.S.-P., R.A.R, J.G.D., D.E.R., F. Mercier, F. Michor, D.T.S., and I.M.G. analyzed and interpreted the data.
Conflict-of-interest disclosure: I.M.G. has a consulting/advisory role with GlaxoSmithKline, Sanofi, Janssen, Celgene, Takeda, Karyopharm, AbbVie, GNS, Cellectar, Medscape, Genetech, Adaptive, Bristol-Myers Squibb, Aptitude, Curio Science, Magenta, and Oncopeptides. A.M.R. is on the advisory board for Amgen and Janssen Pharmaceuticals and has received research funding from AstraZeneca. J.G.D. consults for Tango Therapeutics. D.T.S. is shareholder for Magenta Therapeutics and serves as a director of Agios Pharmaceuticals, Magenta Therapeutics, and Editas Medicines. The remaining authors declare no competing financial interests.
Correspondence: Irene M. Ghobrial, Dana-Farber Cancer Institute, 450 Brookline Ave, Boston, MA USA; e-mail: irene_ghobrial@dfci.harvard.edu.
REFERENCES
- 1.Greaves M, Maley CC. Clonal evolution in cancer. Nature. 2012;481(7381):306-313. [DOI] [PMC free article] [PubMed] [Google Scholar]
- 2.Nowell PC. The clonal evolution of tumor cell populations. Science. 1976;194(4260):23-28. [DOI] [PubMed] [Google Scholar]
- 3.Stratton MR. Exploring the genomes of cancer cells: progress and promise. Science. 2011;331(6024):1553-1558. [DOI] [PubMed] [Google Scholar]
- 4.Merlo LM, Pepper JW, Reid BJ, Maley CC. Cancer as an evolutionary and ecological process. Nat Rev Cancer. 2006;6(12):924-935. [DOI] [PubMed] [Google Scholar]
- 5.Aparicio S, Caldas C. The implications of clonal genome evolution for cancer medicine. N Engl J Med. 2013;368(9):842-851. [DOI] [PubMed] [Google Scholar]
- 6.Klein CA. Parallel progression of primary tumours and metastases. Nat Rev Cancer. 2009;9(4):302-312. [DOI] [PubMed] [Google Scholar]
- 7.Palumbo A, Anderson K. Multiple myeloma. N Engl J Med. 2011;364(11):1046-1060. [DOI] [PubMed] [Google Scholar]
- 8.Manier S, Salem KZ, Park J, Landau DA, Getz G, Ghobrial IM. Genomic complexity of multiple myeloma and its clinical implications. Nat Rev Clin Oncol. 2017;14(2):100-113. [DOI] [PubMed] [Google Scholar]
- 9.Corre J, Munshi N, Avet-Loiseau H. Genetics of multiple myeloma: another heterogeneity level? Blood. 2015;125(12):1870-1876. [DOI] [PMC free article] [PubMed] [Google Scholar]
- 10.Szalat R, Munshi NC. Genomic heterogeneity in multiple myeloma [published correction appears in Curr Opin Genet Dev. 2016;37:158]. Curr Opin Genet Dev. 2015;30:56-65. [DOI] [PubMed] [Google Scholar]
- 11.Weiss BM, Abadie J, Verma P, Howard RS, Kuehl WM. A monoclonal gammopathy precedes multiple myeloma in most patients. Blood. 2009;113(22):5418-5422. [DOI] [PMC free article] [PubMed] [Google Scholar]
- 12.van Nieuwenhuijzen N, Spaan I, Raymakers R, Peperzak V. From MGUS to multiple myeloma, a paradigm for clonal evolution of premalignant cells. Cancer Res. 2018;78(10):2449-2456. [DOI] [PubMed] [Google Scholar]
- 13.Pawlyn C, Morgan GJ. Evolutionary biology of high-risk multiple myeloma. Nat Rev Cancer. 2017;17(9):543-556. [DOI] [PubMed] [Google Scholar]
- 14.Chapman MA, Lawrence MS, Keats JJ, et al. Initial genome sequencing and analysis of multiple myeloma. Nature. 2011;471(7339):467-472. [DOI] [PMC free article] [PubMed] [Google Scholar]
- 15.Lathia JD, Heddleston JM, Venere M, Rich JN. Deadly teamwork: neural cancer stem cells and the tumor microenvironment. Cell Stem Cell. 2011;8(5):482-485. [DOI] [PMC free article] [PubMed] [Google Scholar]
- 16.Plaks V, Kong N, Werb Z. The cancer stem cell niche: how essential is the niche in regulating stemness of tumor cells? Cell Stem Cell. 2015;16(3):225-238. [DOI] [PMC free article] [PubMed] [Google Scholar]
- 17.Poltavets V, Kochetkova M, Pitson SM, Samuel MS. The role of the extracellular matrix and its molecular and cellular regulators in cancer cell plasticity. Front Oncol. 2018;8:431. [DOI] [PMC free article] [PubMed] [Google Scholar]
- 18.Oudin MJ, Jonas O, Kosciuk T, et al. Tumor cell-driven extracellular matrix remodeling drives haptotaxis during metastatic progression. Cancer Discov. 2016;6(5):516-531. [DOI] [PMC free article] [PubMed] [Google Scholar]
- 19.Bray NL, Pimentel H, Melsted P, Pachter L. Near-optimal probabilistic RNA-seq quantification [published correction appears in Nat Biotechnol. 2016;34:888]. Nat Biotechnol. 2016;34(5):525-527. [DOI] [PubMed] [Google Scholar]
- 20.Love MI, Huber W, Anders S. Moderated estimation of fold change and dispersion for RNA-seq data with DESeq2. Genome Biol. 2014;15(12):550. [DOI] [PMC free article] [PubMed] [Google Scholar]
- 21.Yu VWC, Yusuf RZ, Oki T, et al. Epigenetic memory underlies cell-autonomous heterogeneous behavior of hematopoietic stem cells [published correction appears in Cell. 2017;168:944-945]. Cell. 2016;167(5):1310-1322 e1317. [DOI] [PubMed] [Google Scholar]
- 22.Gerrits A, Dykstra B, Kalmykowa OJ, et al. Cellular barcoding tool for clonal analysis in the hematopoietic system. Blood. 2010;115(13):2610-2618. [DOI] [PubMed] [Google Scholar]
- 23.Massagué J, Obenauf AC. Metastatic colonization by circulating tumour cells. Nature. 2016;529(7586):298-306. [DOI] [PMC free article] [PubMed] [Google Scholar]
- 24.Fares J, Fares MY, Khachfe HH, Salhab HA, Fares Y. Molecular principles of metastasis: a hallmark of cancer revisited. Signal Transduct Target Ther. 2020;5(1):28. [DOI] [PMC free article] [PubMed] [Google Scholar]
- 25.Gupta GP, Massagué J. Cancer metastasis: building a framework. Cell. 2006;127(4):679-695. [DOI] [PubMed] [Google Scholar]
- 26.Chng WJ, Kumar S, Vanwier S, et al. Molecular dissection of hyperdiploid multiple myeloma by gene expression profiling. Cancer Res. 2007;67(7):2982-2989. [DOI] [PubMed] [Google Scholar]
- 27.Shi L, Campbell G, Jones WD, et al. ; MAQC Consortium . The MicroArray Quality Control (MAQC)-II study of common practices for the development and validation of microarray-based predictive models. Nat Biotechnol. 2010;28(8):827-838. [DOI] [PMC free article] [PubMed] [Google Scholar]
- 28.Alvarez MJ, Shen Y, Giorgi FM, et al. Functional characterization of somatic mutations in cancer using network-based inference of protein activity. Nat Genet. 2016;48(8):838-847. [DOI] [PMC free article] [PubMed] [Google Scholar]
- 29.Lachmann A, Giorgi FM, Lopez G, Califano A. ARACNe-AP: gene network reverse engineering through adaptive partitioning inference of mutual information. Bioinformatics. 2016;32(14):2233-2235. [DOI] [PMC free article] [PubMed] [Google Scholar]
- 30.Tsherniak A, Vazquez F, Montgomery PG, et al. Defining a cancer dependency map. Cell. 2017;170(3):564-576.e516. [DOI] [PMC free article] [PubMed] [Google Scholar]
- 31.Misund K, Keane N, Stein CK, et al. ; MMRF CoMMpass Network . MYC dysregulation in the progression of multiple myeloma. Leukemia. 2020;34(1):322-326. [DOI] [PMC free article] [PubMed] [Google Scholar]
- 32.Jovanović KK, Roche-Lestienne C, Ghobrial IM, Facon T, Quesnel B, Manier S. Targeting MYC in multiple myeloma. Leukemia. 2018;32(6):1295-1306. [DOI] [PubMed] [Google Scholar]
- 33.Shaffer AL, Emre NC, Lamy L, et al. IRF4 addiction in multiple myeloma. Nature. 2008;454(7201):226-231. [DOI] [PMC free article] [PubMed] [Google Scholar]
- 34.Shah V, Boyd KD, Houlston RS, Kaiser MF. Constitutional mutation in CDKN2A is associated with long term survivorship in multiple myeloma: a case report. BMC Cancer. 2017;17(1):718. [DOI] [PMC free article] [PubMed] [Google Scholar]
- 35.Dilworth D, Liu L, Stewart AK, Berenson JR, Lassam N, Hogg D. Germline CDKN2A mutation implicated in predisposition to multiple myeloma. Blood. 2000;95(5):1869-1871. [PubMed] [Google Scholar]
- 36.Kryukov F, Dementyeva E, Kubiczkova L, et al. Cell cycle genes co-expression in multiple myeloma and plasma cell leukemia. Genomics. 2013;102(4):243-249. [DOI] [PubMed] [Google Scholar]
- 37.Kuiper R, Broyl A, de Knegt Y, et al. A gene expression signature for high-risk multiple myeloma [published correction appears in Leukemia. 2014;28:1178-1180]. Leukemia. 2012;26(11):2406-2413. [DOI] [PubMed] [Google Scholar]
- 38.Huang W, Cao Z, Zeng L, et al. nm23, TOP2A and VEGF expression: potential prognostic biologic factors in peripheral T-cell lymphoma, not otherwise specified. Oncol Lett. 2019;18(4):3803-3810. [DOI] [PMC free article] [PubMed] [Google Scholar]
- 39.Zeid R, Lawlor MA, Poon E, et al. Enhancer invasion shapes MYCN-dependent transcriptional amplification in neuroblastoma. Nat Genet. 2018;50(4):515-523. [DOI] [PMC free article] [PubMed] [Google Scholar]
- 40.Li W, Xu H, Xiao T, et al. MAGeCK enables robust identification of essential genes from genome-scale CRISPR/Cas9 knockout screens. Genome Biol. 2014;15(12):554. [DOI] [PMC free article] [PubMed] [Google Scholar]
- 41.Rosean TR, Tompkins VS, Tricot G, et al. Preclinical validation of interleukin 6 as a therapeutic target in multiple myeloma. Immunol Res. 2014;59(1-3):188-202. [DOI] [PMC free article] [PubMed] [Google Scholar]
- 42.Gadó K, Domján G, Hegyesi H, Falus A. Role of INTERLEUKIN-6 in the pathogenesis of multiple myeloma. Cell Biol Int. 2000;24(4):195-209. [DOI] [PubMed] [Google Scholar]
- 43.Gunn WG, Conley A, Deininger L, Olson SD, Prockop DJ, Gregory CA. A crosstalk between myeloma cells and marrow stromal cells stimulates production of DKK1 and interleukin-6: a potential role in the development of lytic bone disease and tumor progression in multiple myeloma. Stem Cells. 2006;24(4):986-991. [DOI] [PubMed] [Google Scholar]
- 44.Lohr JG, Stojanov P, Carter SL, et al. ; Multiple Myeloma Research Consortium . Widespread genetic heterogeneity in multiple myeloma: implications for targeted therapy. Cancer Cell. 2014;25(1):91-101. [DOI] [PMC free article] [PubMed] [Google Scholar]
- 45.Wei X, Calvo-Vidal MN, Chen S, et al. Germline lysine-specific demethylase 1 (LSD1/KDM1A) mutations confer susceptibility to multiple myeloma. Cancer Res. 2018;78(10):2747-2759. [DOI] [PMC free article] [PubMed] [Google Scholar]
- 46.Valkenburg KC, de Groot AE, Pienta KJ. Targeting the tumour stroma to improve cancer therapy. Nat Rev Clin Oncol. 2018;15(6):366-381. [DOI] [PMC free article] [PubMed] [Google Scholar]
- 47.Valastyan S, Weinberg RA. Tumor metastasis: molecular insights and evolving paradigms. Cell. 2011;147(2):275-292. [DOI] [PMC free article] [PubMed] [Google Scholar]
- 48.Lambert AW, Pattabiraman DR, Weinberg RA. Emerging biological principles of metastasis. Cell. 2017;168(4):670-691. [DOI] [PMC free article] [PubMed] [Google Scholar]
- 49.Roodman GD. Role of the bone marrow microenvironment in multiple myeloma. J Bone Miner Res. 2002;17(11):1921-1925. [DOI] [PubMed] [Google Scholar]
- 50.Psaila B, Lyden D. The metastatic niche: adapting the foreign soil. Nat Rev Cancer. 2009;9(4):285-293. [DOI] [PMC free article] [PubMed] [Google Scholar]
- 51.Lawson MA, McDonald MM, Kovacic N, et al. Osteoclasts control reactivation of dormant myeloma cells by remodelling the endosteal niche. Nat Commun. 2015;6:8983. [DOI] [PMC free article] [PubMed] [Google Scholar]
- 52.Khoo WH, Ledergor G, Weiner A, et al. A niche-dependent myeloid transcriptome signature defines dormant myeloma cells. Blood. 2019;134(1):30-43. [DOI] [PubMed] [Google Scholar]
- 53.Hewett DR, Vandyke K, Lawrence DM, et al. DNA barcoding reveals habitual clonal dominance of myeloma plasma cells in the bone marrow microenvironment. Neoplasia. 2017;19(12):972-981. [DOI] [PMC free article] [PubMed] [Google Scholar]
- 54.Fu F, Wang T, Wu Z, et al. HMGA1 exacerbates tumor growth through regulating the cell cycle and accelerates migration/invasion via targeting miR-221/222 in cervical cancer. Cell Death Dis. 2018;9(6):594. [DOI] [PMC free article] [PubMed] [Google Scholar] [Retracted]
- 55.Santuario-Facio SK, Cardona-Huerta S, Perez-Paramo YX, et al. A new gene expression signature for triple negative breast cancer using frozen fresh tissue before neoadjuvant chemotherapy. Mol Med. 2017;23(1):101-111. [DOI] [PMC free article] [PubMed] [Google Scholar]
- 56.Andreozzi M, Quintavalle C, Benz D, et al. HMGA1 expression in human hepatocellular carcinoma correlates with poor prognosis and promotes tumor growth and migration in in vitro models [published correction appears in Neoplasia. 2020;22(7):272-273]. Neoplasia. 2016;18(12):724-731. [DOI] [PMC free article] [PubMed] [Google Scholar]
- 57.Méndez O, Peg V, Salvans C, et al. Extracellular HMGA1 promotes tumor invasion and metastasis in triple-negative breast cancer. Clin Cancer Res. 2018;24(24):6367-6382. [DOI] [PubMed] [Google Scholar]
- 58.Sgarra R, Pegoraro S, Ros G, et al. High mobility group A (HMGA) proteins: molecular instigators of breast cancer onset and progression. Biochim Biophys Acta Rev Cancer. 2018;1869(2):216-229. [DOI] [PubMed] [Google Scholar]
- 59.Toyozumi T, Hoshino I, Takahashi M, et al. Fra-1 regulates the expression of HMGA1, which is associated with a poor prognosis in human esophageal squamous cell carcinoma. Ann Surg Oncol. 2017;24(11):3446-3455. [DOI] [PubMed] [Google Scholar]
- 60.Zhong J, Liu C, Chen YJ, et al. The association between S100A13 and HMGA1 in the modulation of thyroid cancer proliferation and invasion. J Transl Med. 2016;14(1):80. [DOI] [PMC free article] [PubMed] [Google Scholar]
- 61.Xia X, Cheng A, Lessor T, Zhang Y, Hamburger AW. Ebp1, an ErbB-3 binding protein, interacts with Rb and affects Rb transcriptional regulation. J Cell Physiol. 2001;187(2):209-217. [DOI] [PubMed] [Google Scholar]
- 62.Nguyen XT, Zhu L, Lee Y, Ta L, Mitchell BS. Expression and role of the ErbB3-binding protein 1 in acute myelogenous leukemic cells. Clin Cancer Res. 2016;22(13):3320-3327. [DOI] [PubMed] [Google Scholar]
- 63.Yoo JY, Wang XW, Rishi AK, et al. Interaction of the PA2G4 (EBP1) protein with ErbB-3 and regulation of this binding by heregulin. Br J Cancer. 2000;82(3):683-690. [DOI] [PMC free article] [PubMed] [Google Scholar]
- 64.Zhang Y, Linn D, Liu Z, et al. EBP1, an ErbB3-binding protein, is decreased in prostate cancer and implicated in hormone resistance. Mol Cancer Ther. 2008;7(10):3176-3186. [DOI] [PMC free article] [PubMed] [Google Scholar]
- 65.Zhan F, Barlogie B, Arzoumanian V, et al. Gene-expression signature of benign monoclonal gammopathy evident in multiple myeloma is linked to good prognosis. Blood. 2007;109(4):1692-1700. [DOI] [PMC free article] [PubMed] [Google Scholar]
- 66.Hanahan D, Weinberg RA. Hallmarks of cancer: the next generation. Cell. 2011;144(5):646-674. [DOI] [PubMed] [Google Scholar]
- 67.Hanahan D, Weinberg RA. The hallmarks of cancer. Cell. 2000;100(1):57-70. [DOI] [PubMed] [Google Scholar]
- 68.Ren X, Kang B, Zhang Z. Understanding tumor ecosystems by single-cell sequencing: promises and limitations. Genome Biol. 2018;19(1):211. [DOI] [PMC free article] [PubMed] [Google Scholar]
- 69.Amend SR, Roy S, Brown JS, Pienta KJ. Ecological paradigms to understand the dynamics of metastasis. Cancer Lett. 2016;380(1):237-242. [DOI] [PMC free article] [PubMed] [Google Scholar]
- 70.Maley CC, Aktipis A, Graham TA, et al. Classifying the evolutionary and ecological features of neoplasms. Nat Rev Cancer. 2017;17(10):605-619. [DOI] [PMC free article] [PubMed] [Google Scholar]
Associated Data
This section collects any data citations, data availability statements, or supplementary materials included in this article.