Abstract
Background
Immunoassays for protein analytes measured in situ support a $2 billion laboratory testing industry that suffers from significant interlaboratory disparities, affecting patient treatment. The root cause is that immunohistochemical testing lacks the generally accepted tools for analytic standardization, including reference standards and traceable units of measure. Until now, the creation of these tools has represented an insoluble technical hurdle.
Methods
We address the need with a new concept in metrology—that is, linked traceability. Rather than calculating analyte concentration directly, which has proven too variable, we calculate concentration by measuring an attached fluorescein, traceable to NIST Standard Reference Material 1934, a fluorescein standard.
Results
For validation, newly developed estrogen receptor (ER) calibrators were deployed in tandem with an array of 80 breast cancer tissue sections in a national external quality assessment program. Laboratory performance was assessed using both the ER standards and the tissue array. Similar to previous studies, the tissue array revealed substantial discrepancies in ER test results among the participating laboratories. The new ER calibrators revealed a broad range of analytic sensitivity, with the lower limits of detection ranging from 7310 to 74 790 molecules of ER. The data demonstrate, for the first time, that the variable test results correlate with analytic sensitivity, which can now be measured quantitatively.
Conclusions
The reference standard enables precise interlaboratory alignment of immunohistochemistry test sensitivity for measuring cellular proteins in situ. The introduction of a reference standard and traceable units of measure for protein expression marks an important milestone.
Keywords: reference standard, immunohistochemistry, in situ, microbead, fluorescein
Introduction
Traceability of measurement to a higher order reference standard is a foundation of laboratory testing. In clinical chemistry, immunology, molecular virology, hematology, and other laboratory testing disciplines, hundreds of primary reference standards are maintained at international institutions. However, this system of traceable measurement does not exist for immunohistochemistry (IHC) testing, including all of its clinical applications (1). The science of metrology, the study of measurement, has not yet extended to IHC because of technical challenges. There is no method for creating reference standards for in situ cellular proteins in a fashion analogous to that for soluble (e.g., serum or plasma) analytes. The absence of reference standards and traceable units of measure is associated with comparatively high rates of testing discrepancies among IHC testing laboratories (1). To address this need, we developed a system of measurement traceability using a linked fluorescein tag for creating reference standards for any cellular analyte and validated it for estrogen receptor (ER) testing.
The absence of metrology tools means that we still do not know how many molecules of ER must be present per cell before a pathologist can see the stain and, even more important, how many are required to reliably predict response to hormonal therapy. The lack of metrology standards for IHC makes it impossible to precisely align one laboratory’s test with the next and impedes development of reliable IHC assays for predictive biomarkers in clinical trials (1). For this study, we developed an ER standard to define and compare the thresholds separating “high positive,” “low positive,” and “negative” tests according to recently updated American Society of Clinical Oncology and College of American Pathologists (ASCO/CAP) guidelines (2). The threshold between negative and positive cases is the lower limit of detection (LOD). This study compares each laboratory’s LOD with its test results on a series of 80 tumor samples expressing a range of ER concentrations.
Materials and Methods
Preparation of Calibrators (NIST Standard Reference Material [SRM] 1934–Traceable Standards)
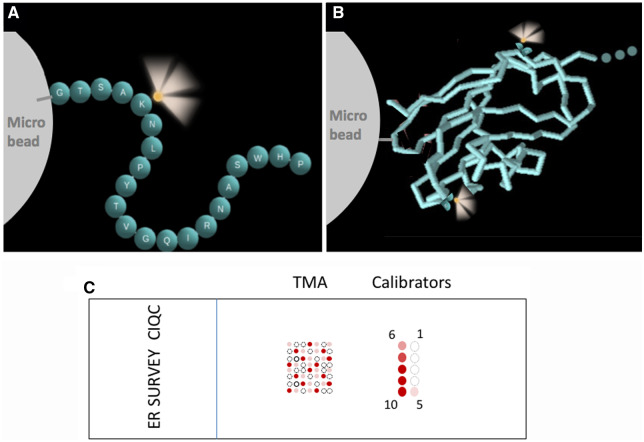
A 24-amino acid long peptide incorporating the linear epitope of the ER binding SP1 monoclonal antibody was covalently coupled to cell-sized (diameter: 7–8 μm) glass microbeads (Cospheric), as described previously (3–5). This coupling reaction was performed at 10 different peptide concentrations, resulting in a range of measurement standards with varying ER peptide concentrations per microbead. The peptide was conjugated with a fluorescein molecule, schematically illustrated in Fig. 1, A, to establish traceability of measurement. The number of peptides conjugated to each group of microbeads was measured at NIST using methods described in the next section.
Fig. 1.
Schematic illustration of calibrator construction. The analyte is represented either by a peptide (A) or a protein (B), covalently coupled to a microbead. (A), Each sphere represents a single amino acid (single letter abbreviation) in a peptide. This particular sequence is for illustrative purposes only. Adapted from Vani et al. (3). (B), The recombinant extracellular domain of the PD-L1 protein is depicted using a stick model. In both peptide and protein, ≥1 fluorescein label (illustrated as glowing yellow spheres) provides a link for traceability of concentration. (C), Schematic illustration of the survey tool, showing the layout of calibrators and the TMA on a slide. The calibrators are organized in 2 columns with levels 1–5 on the right side and 6–10 on the left. Level 1 has the lowest biomarker (ER) concentration; level 10 has the highest. The TMA in (C) is for illustrative purposes; the exact number of tissue cores and the locations of positive and negative cores in the survey slide are different.
The peptide was designed to incorporate a single SP1 epitope and a single fluorescein (at the ε position of a lysine distant from the epitope) so that the two are equimolar. The use of peptides (that incorporate an epitope) in lieu of a native protein was described previously (6–8). Flanking amino acids corresponding to the sequence of native ER were also incorporated into the peptide and served as a spacer. The 1:1 relationship between the amino acids comprising the SP1 epitope and fluorescein was confirmed by establishing 96% peptide purity using mass spectroscopy.
ER peptide-coated microbeads were mixed with color standard microbeads (diameter; 4.5 μm) in a proprietary clear liquid matrix, as described previously (1, 4). When 1 μL of this microbead suspension is dispensed onto a glass microscope slide, the droplet dries within a few minutes. The matrix in the dried droplet retains the microbeads through subsequent routine IHC treatments. Each dried microliter droplet on the slide incorporates approximately 5000 peptide-coated (test) microbeads. Approximately half of the test microbeads bear the relevant analyte, whereas the other half has an antigenically irrelevant peptide, serving as a negative internal control.
Establishing Traceability to NIST SRM 1934
Fluorescence intensity values were used to assign concentration values to the microbeads in terms of equivalent reference fluorophore (ERF) values. The ERF value assignment was performed according to a standard operating procedure (9) that includes 4 steps. First, fluorescence measurements are carried out on serial dilutions of the fluorescein reference solution using a spectrofluorometer equipped with a 488-nm laser excitation. The relative radiometric accuracy as a function of wavelength of the fluorescence detection system was corrected using a calibrated light source, traceable to the NIST realization of the International System of Units (SI) (10–14). All fluorescence measurements were taken at 21°C (SD: 1.0 °C) using a 90° transmitting geometry with the excitation beam incident on and normal to one of the polished surfaces of the sample cuvette. All emission spectra were corrected for the responsivity of the detection system and normalized to the mean laser intensity measured over the same time period as each spectrum was taken. Fluorescence intensity was measured by integrating a fluorescence emission spectrum from 515 nm to 535 nm. The resulting fluorescence intensities and the corresponding concentrations of fluorescein solutions are used to calibrate the response of the fluorimeter.
In the second step, the fluorescence intensities of calibrator microbeads were measured using the spectrofluorometer calibrated in the first step. The objective of the second step is to determine the equivalent concentration of fluorescein reference fluorophore that gives the same fluorescence intensity as the suspension of microbeads. Next, as a third step, a light obscuration–based, liquid particle counter and an Attune NxT flow cytometer from Thermo Fisher Scientific were used to measure the concentration of calibrator microbeads in the suspensions used for the fluorescence measurements. The light obscuration counter was a PAMAS model SVSS-C with an HCB-LD-25/25 sensor head (S/N U32757). Particle concentration was obtained by dividing particle count by the sample volume. Traceability to the SI was assured by determining the confidence that all particles within the sample volume were counted. Flow cytometry was used to confirm the light obscuration–based microbead concentration. This was done using TruCount microbeads from BD Biosciences as an internal standard in the calibration microbead suspension. The light obscuration measurement was used as the primary method for microbead concentration measurements because the uncertainties in the light obscuration measurement are more thoroughly understood and traceable to the SI (15, 16). Flow cytometry was used to ensure that calibrator microbeads were monodispersed. Last, the ERF values of the microbeads at different intensity levels were calculated by dividing the respective ERF values for the microbead suspensions determined in the second step by the concentrations of the microbead suspensions (9).
Biospecimen Materials
Ethics approval for the use of human tissues was obtained from the Institutional Review Board of the University of British Columbia and the British Columbia Cancer Agency. Human biospecimen tier 1 items are summarized in online Supplemental Table 1 according to Biospecimen Reporting for Improved Study Quality (BRISQ) recommendations (17). A tissue microarray (TMA) was constructed by using 80 cores, each 0.6 mm, of 80 routinely formalin-fixed, paraffin-embedded breast carcinomas and 2 benign-tissue negative control samples including benign liver and kidney cortex. Tumors were classified according to the ASCO/CAP guidelines based on ER expression by IHC (2), as measured by the Canadian Immunohistochemistry Quality Control (CIQC) reference laboratory (Vancouver, BC, Canada). The cohort of tumors comprised approximately 35% ER negative, 25% ER-low positive, and 40% ER-high positive tumors, representing the spectrum of ER expression.
CIQC ER Survey
IHC laboratories participating in the CIQC survey received a slide with a 4-μm–thick section of the breast cancer TMA and ER calibrators. The unstained slides were shipped at room temperature within 2 weeks after preparation. Each participating laboratory assessed its own staining and self-reported test results to CIQC. In addition, the stained slides were returned to CIQC for further expert assessment. The stained slides were also shared with Boston Cell Standards for photomicroscopy and image quantification of the ER calibrators. The TMA was also evaluated by an additional expert pathologist (E.E.T) to determine the histology score (HS) for each tumor. The percentages of negative nuclei, weakly positive nuclei (1+), moderately positive nuclei (2+), and strongly positive nuclei (3+) were recorded for each tumor, and the HS was calculated based on previously published recommendations (18), as follows: HSCORE = ∑ Pi(i + 1), where i = 1,2,3 and Pi varies from 0% to 100%. Acceptability criteria were set as follows: minimum of 100 viable tumor cells for assessment from each case and intraobserver reproducibility of H-score at κ ≥ 0.80. The latter was tested on a pilot sample of 30 cases. The HS observer was unblinded for the results with ER calibrators only after obtaining HS for the stained TMAs. Excel 2016 (Microsoft) and SPSS version 26 (IBM Corp) were used for data entry and analyses. Descriptive statistics were used to analyze the results.
Calibrator Quantification
Calibrators were photographed using a Zeiss Axioskop microscope fitted with a Spot Imaging Solutions Insight Gigabit CCD camera (Diagnostic Instruments). The details of microbead stain intensity quantification is described elsewhere (4, 19).
Results
We describe the creation of IHC measurement traceability, how the new tools are used for measuring analytic sensitivity, and their validation in a national laboratory proficiency testing program.
Design of IHC Calibrators
According to this new system of IHC measurement traceability, NIST SRM 1934 serves as a universal clinical IHC standard, regardless of the analyte. NIST SRM 1934 was originally developed for flow cytometry applications. It has a known fluorescein concentration, serving to standardize the fluorescence intensity measurements of small cell-sized microbeads. If fluorescein is attached to an immunohistochemical analyte, then NIST SRM 1934 can serve as a traceable concentration marker for the analyte. For example, because each ER has a single fluorescein, the ER concentration equals the fluorescein concentration. In the absence of any existing immunohistochemical standards, we calculate ER concentration based on a linked fluorescence measurement traceable to NIST SRM 1934.
Figure 1, A and B, schematically illustrates the construction of IHC calibrators, comprising either peptide (Fig. 1, A) or protein (Fig. 1, B) analytes covalently coupled to cell-sized glass microbeads. We previously characterized microbead–peptide constructs for use as test controls (3, 4, 20, 21). In this study, we describe using this construct for the creation and use of calibrators with traceability to an international standard, NIST SRM 1934. The various concentrations, termed “levels,” are pipetted and adhered onto a microscope slide in an array where they remain during staining (Fig. 1, C). The calibrators are processed through all of the same antigen retrieval and staining steps as the 80 patient samples on the same slide.
For the CIQC ER national study, 3 calibrator sets were created with different peptides for the SP1, EP1, and 6F11 monoclonal antibody epitopes. Each laboratory received the appropriate set of calibrators and the same set of patient samples. Fifty-eight laboratories used the SP1 antibody, 17 used EP1, and 3 used 6F11. Of the 58 laboratories that used the SP1 primary antibody clone, 5 were not included because the calibrators were inadvertently removed by the laboratory during staining. In this study, we report the results with the SP1 clone only because this clone was used by the overwhelming majority of participants.
Establishing Traceability to NIST SRM 1934
This new system of measurement traceability is unusual because the reference standard (for fluorescein) is different than the analyte (ER). We describe this as a “linked” system of measurement traceability. Because this article presents the first example of IHC measurement traceability to a recognized reference standard, we briefly describe the process. The fluorescence intensity of each calibrator microbead suspension was compared with the fluorescence intensity of various dilutions of NIST SRM 1934. Each calibrator’s concentration was calculated based on fluorescence intensity by first defining the relationship between integrated fluorescence intensity as a function of reference fluorophore concentration, using serial dilutions of the SRM 1934 fluorescein reference solution (Fig. 2, blue diamonds). A linear regression line was fitted to the plot. The integrated fluorescence intensity of each calibrator microbead suspension was then measured using the same spectrofluorometer settings. The location of each calibrator microbead suspension’s integrated fluorescence intensity on the fitted straight line is shown in red triangles in Fig. 2. When the fluorescence intensity values are interpolated onto the x axis, it provides the equivalent concentration of fluorescein, which is also the ER concentration.
Fig. 2.
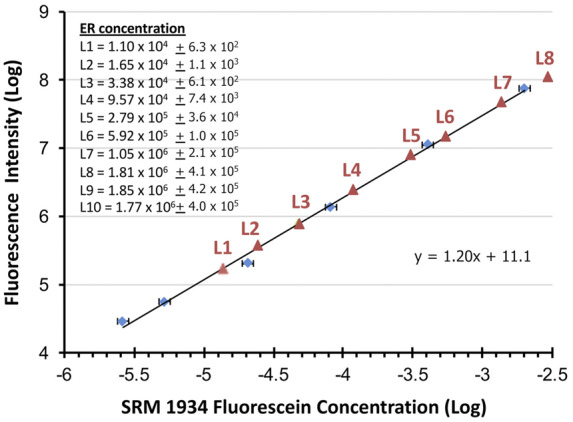
Method for establishing traceability of calibrator microbeads to NIST SRM 1934. The ER concentrations per microbead for each calibrator (list at upper left) are in units of ERFs. The blue diamonds are the data points from graphing fluorescence intensity (y axis) as a function of reference fluorophore concentration in micromoles per liter (x axis) using serial dilutions of the SRM 1934. A linear regression line and its equation from these data points is shown. The red triangles are the fluorescence intensity of each calibrator microbead suspension as each intercepts the linear regression line. Each is interpolated onto the x axis to find the equivalent concentration for the calibrator at each level (L).
The only caveat in this linked system of fluorescein traceability is that NIST SRM 1934 is composed of soluble fluorescein, whereas the calibrator fluorescein fluorophores are on microbeads. This difference—bound vs soluble—can slightly change fluorescence intensity per molecule. Therefore, calibrator fluorescein concentration is expressed as equivalent number of (soluble) reference fluorophores needed to produce a fluorescence intensity equal to that of the (bound) microbead suspension (9). The ERF value for a single calibrator microbead at the 95% confidence level (expansion coefficient k = 2) is provided at the upper left of Fig. 2. It is determined by dividing the ERF value for the microbead suspension by the concentration of the microbead suspension (9). A combined uncertainty (95% confidence limits) associated with the ERF value assigned to each calibrator microbead was calculated from all steps of the value assignment, including weighing the fluorescein reference solution, spectrofluorometer calibration, charge-coupled device (CCD) response calibration, microbead concentration measurement by light obscuration, and the measurement of the fluorescence spectrum of the microbeads in suspension (9). These measurement uncertainties are also provided at the upper left of Fig. 2.
Measurement of Lower LOD
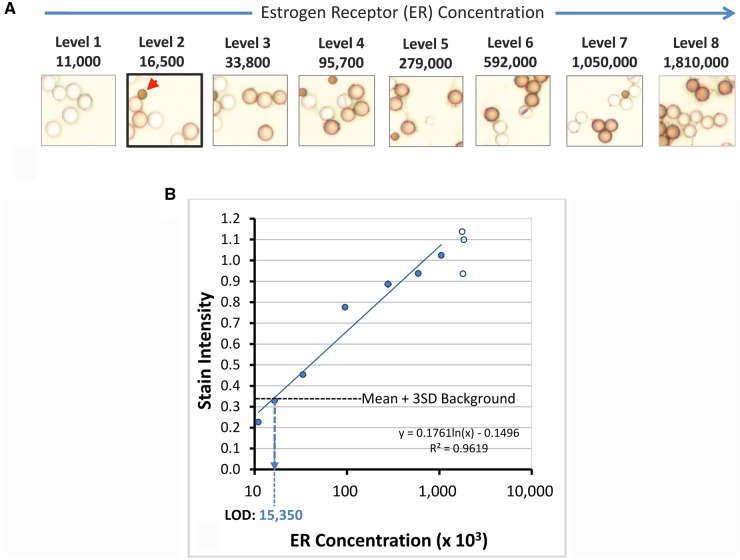
In IHC, the LOD represents the threshold separating a positive result for an analyte from one that is negative. Although the concept of a descriptive (nonquantitative) IHC LOD has been introduced with critical assay performance controls (22), quantitative lower LODs do not presently exist in IHC testing. With the newly developed calibrators introduced in this study, it is possible to measure the LOD of various IHC protocols. Fig. 3, A, shows images of ER (SP1 peptide)–coated microbeads after staining, along with their corresponding ER concentrations. The calibrators comprise negative control microbeads admixed with the positive ER peptide-coated microbeads. This finding allows a direct side-by-side comparison of stained and unstained microbeads in the same images. Fig. 3, A, shows that stain intensity gradually decreases from level 6 (592 000 molecules/microbead) to level 2 (16 500 molecules/microbead). Therefore, the LOD is visually estimated in this example at approximately 16 500 molecules per microbead.
Fig. 3.
Derivation of lower LOD using calibrators. (A), Stained ER calibrators. The ER peptide-coated microbeads have concentrations ranging from 11 000 (level 1) to 1 810 000 (level 8) molecules per microbead. The concentrations are listed above each photomicrograph and are the same as shown at the upper left of Fig. 2. Visually, the LOD is at level 2 (accentuated with thick border). The red arrowhead identifies a smaller optical reference microbead, used for image quantification. These optical reference microbeads are permanently colored brown, regardless of staining. They provide an internal fixed optical reference point for image stain intensity measurement, normalizing for variations in microscopy. (B) Graphical representation of ER calibrator stain intensities (y axis) as a function of ER concentration (x axis). Each data point is the mean of duplicate measurements. The empty circles represent data from higher calibrator levels that are on the analytic response plateau and thus not included in the linear regression calculation. The horizontal dotted line represents the stain intensity of the background plus 3 SD. Background stain intensity is measured with an antigenically irrelevant calibrator. The calculated LOD in this example is 15 350 molecules per microbead.
Figure 3, B, quantitatively depicts an example of the relationship of stain intensity (y axis) as a function of ER concentration (x axis). The LOD is the lowest analyte concentration that can be reliably distinguished from the stain intensity of a zero-concentration sample. For each laboratory, we identified the LOD as the mean plus 3 SD of stain intensity. At this level, there is a 99% probability that higher stain intensity is associated with a nonzero analyte concentration. Using the linear regression line in this particular example (Fig. 3, B, dotted line), the ER concentration at the LOD is 15 350 molecules per microbead. This calculated LOD closely matches the estimated LOD based on visual inspection.
Clinical Validation: Correlation of LOD with Tumor ER Expression
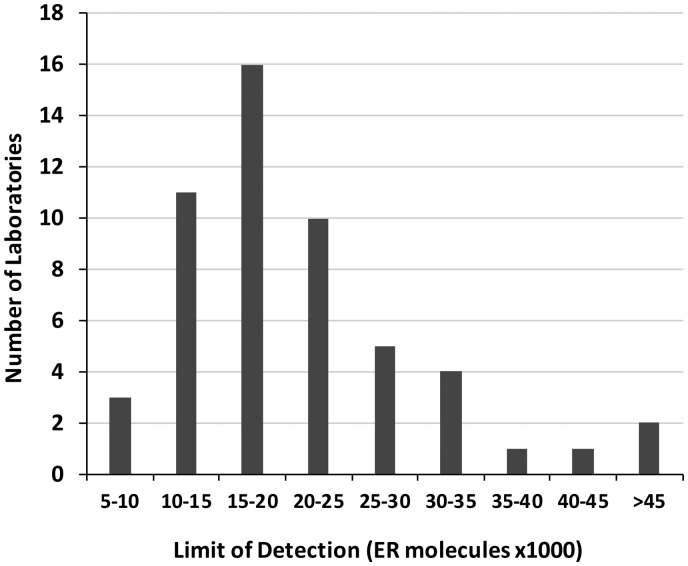
A total of 5590 tissue cores from stained slides were received from all CIQC participants. Of all CIQC laboratory participants, 58 used the SP1 primary antibody clone. This resulted in 4640 tumor samples from which an additional 1602 were excluded because of missing tissue cores, insufficient number of tumor cells, or crush and other tissue artifacts. A total of 3038 tissue samples were included in the analysis. Of the 58 slides with samples, the calibrator had inadvertently been removed from 5 during processing, leaving 53 for evaluation. The distribution of the laboratories’ analytic sensitivity is shown in Fig. 4. Most IHC laboratories had a LOD between 10 000 and 25 000 molecules of ER per microbead.
Fig. 4.
Analytic sensitivity of IHC laboratories’ ER tests using the SP1 antibody. The x axis reflects analytic sensitivity as measured by lower LOD. The y axis reflects the number of laboratories that fall within each LOD range.
Figure 5, A, demonstrates that the percentage of positive patient tumor samples correlates with analytic sensitivity. Depending on the analytic sensitivity, anywhere between approximately 37% and 76% of tumor samples would be considered ER positive. Laboratories with highly sensitive ER assays (low LODs) detected more positive cases, whereas those with poorly sensitive ER tests detected fewer cases. The LOD of each laboratory correlated with the percentage of positive cases that its IHC protocol produced (rs = −0.767, P < 0.0001, Spearman correlation; Fig. 5, A) and with cumulative individual laboratory HS (rs = −0.612, P < 0.0001, Spearman correlation). Fig. 5, B, illustrates that the tumor samples accounting for this difference are principally “low positive,” according to the ASCO/CAP classification (Fig. 5, B, blue dotted line). ER-high positive tumors were less affected by the differences in test analytic sensitivity (Fig. 5, B, red dotted line). Relatively few labs with lower LOD >25 000 were able to detect the ER-low positive breast carcinomas, defined as 1%–10% positive tumor cells at any intensity (2) (Fig. 5, B).
Fig. 5.
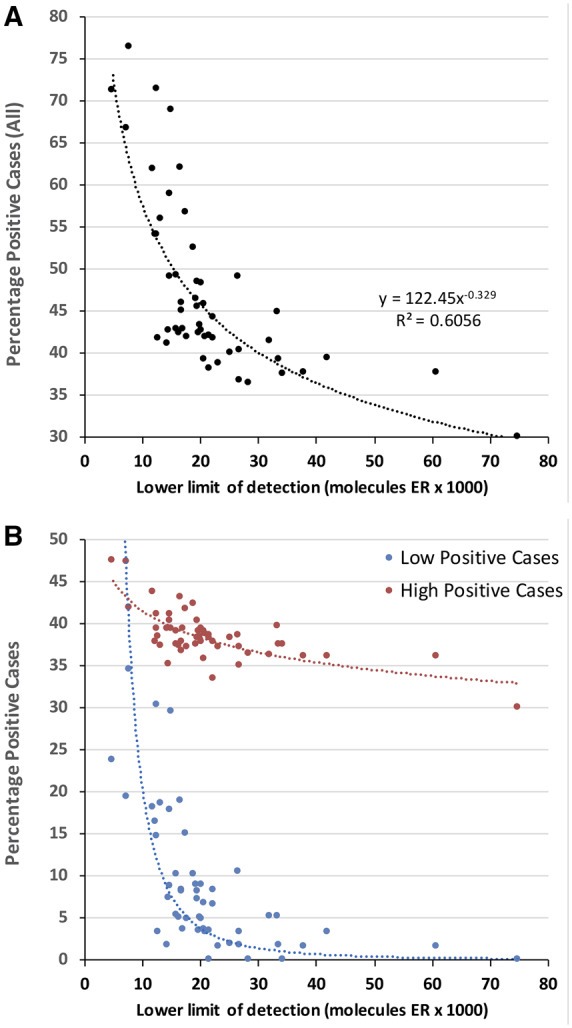
(A), Percentage of all positive cases as a function of analytic sensitivity (lower LOD). (B) Same data as in (A), but stratified by ER-high vs ER-low positive cases. In (B), the y axis is the percentage of cases that are classified as ER-low or ER-high, per the ASCO/CAP guidelines. The interlaboratory differences in analytic sensitivity principally affects the ability to detect ER-low positive breast carcinomas.
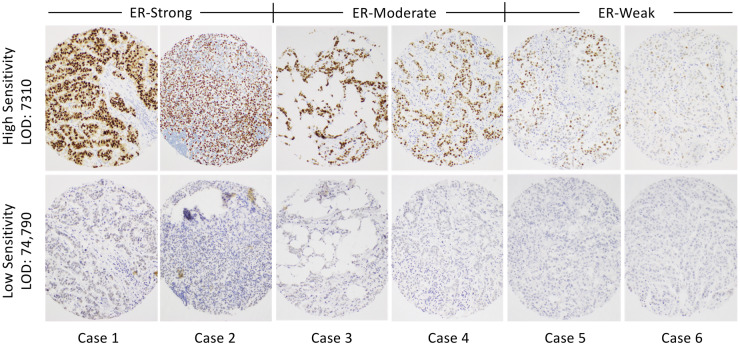
Figure 6 illustrates the actual appearance of stained breast cancer samples from laboratories at the opposite ends of the analytic sensitivity spectrum. These images show just how different the results can be, depending on the test analytic sensitivity. The upper row of images is from the most analytically sensitive laboratory (low LOD), whereas the lower row is from a laboratory with the least sensitive ER test (high LOD). Representative tumor samples considered to be high (cols. 1 and 2), moderate (cols. 3 and 4), and low (cols. 5 and 6) ER expressers are shown.
Fig. 6.
IHC staining of 6 breast carcinomas illustrating the range of stain intensities for the most sensitive (upper row) and least sensitive (lower row) laboratories. Included are cases that appear to have comparatively strong staining (cases 1 and 2), moderate staining (cases 3 and 4), and weak staining (cases 5 and 6) for ER.
Discussion
The complexities of developing standards for IHC arise mostly from the fact that IHC is a cell- and tissue-based in situ immunoassay. The recognition of the need for IHC reference standards dates back to 2002, when a conference of leading organizations issued a call for a HER2 standard (23). The conference participants envisioned the use of transformed cell lines as reference standards, but it was technically more difficult than anticipated. We are not aware of progress since then in generating quantitative and traceable IHC reference standards.
The linked system of measurement traceability (through fluorescein) allows the rapid deployment of calibrators to a broad range of common immunohistochemical tests, all traceable to NIST SRM 1934. In contrast, the traditional approach for creating metrology standards would require a separate standard for each analyte. Assignment of concentration(s) would require a gold standard assay, of which there is none for these protein analytes. In light of the fact that a typical IHC laboratory in a tertiary-care hospital has a test menu of approximately 200 different tests, the traditional approach would involve many years of research and is a technically challenging proposition. Even if the efforts were focused on the most important predictive IHC assays (e.g., PD-L1 testing for immunotherapy, HER2 in breast cancer), the traditional approach in generating IHC standards has yet to bear fruit (23). Beyond predictive markers, there may be an important role of calibrators for many IHC tests, regardless of their ultimate application or use. Like other qualitative testing in laboratory medicine, threshold-based laboratory assays may benefit from a defined threshold of positivity to ensure reproducibility and accuracy in distinguishing positive vs negative results.
Creating standards for cell or tissue-based analytes entails an additional complication not found with laboratory standards for serum testing. The compartmentalization of the analyte in a cell or extracellular matrix means that it cannot be diluted to create different concentrations. For example, a cell line expressing high amounts of ER cannot be diluted to make ER-low cells. In contrast, a reference standard for a soluble analyte (e.g., for blood testing) can be serially diluted to create a calibration scale spanning the analytic measurement range.
The clinical validation data confirm the experimental prediction that analytic sensitivity, as measured with NIST SRM 1934–traceable calibrators, correlates with test results. Highly sensitive ER tests produce more ER-positive test results. Although this conclusion is hardly surprising, the implications of a reference standard and traceable calibrators potentially affect the treatment of millions of patients with breast cancer. As our data illustrate, the treatment options offered to patients with breast and other cancers be affected by which laboratory performs the test. ER-high positive tumors will generally be positive regardless of the laboratory performing the test. However, our data show that ER-low positive tumors are highly affected by the variability in analytic sensitivity between different clinical IHC laboratories. These data argue for the urgent need to standardize testing to a defined analytic sensitivity range.
In this study, we used the reference standard to characterize the LOD of each laboratory’s ER test, not for quantifying ER concentrations in patient specimens. As the technology matures, it will likely become possible to quantify patient test results in terms of median number of molecules per tumor cell. Until then, several immediate clinical uses exist for calibration standards, all of which revolve around quantitatively defining the threshold of positivity: (a) during IHC protocol development for clinical trials and for clinical use, (b) for IHC protocol development and technical and analytical validation in clinical laboratories, (c) as a daily quality control (e.g., on-slide controls to verify the LOD for each tested patient), (d) for revalidation of IHC protocols on a periodic basis, (e) for lot-to-lot validation of reagents, (f) after major service to testing instruments, and (g) in the context of a problem investigation (e.g., suboptimal or poor results in proficiency testing). Furthermore, it is only now that meaningful research can be performed to identify clinically relevant analytic sensitivity thresholds for classifying ER expression levels that predict patients’ responses to hormonal therapy, how they correlate to gene expression profiling, and tumor subclassification. Reference standards are critical not only for development of prognostic and predictive assays but also for methodology transfer from clinical trials or published literature to clinical laboratories. Moreover, reference standards enable more objective design of proficiency testing and more objective comparison of laboratory performance with ER IHC and other IHC assays as more reference standards are developed.
Supplemental Material
Supplemental material is available at Clinical Chemistry online.
Supplementary Material
Acknowledgments
We are grateful to Canadian Immunohistochemistry Quality Control (CIQC) staff members Dr. C. Blake Gilks, Dr. Jennifer Won, and John Garratt for their assistance in providing the tissue microarray samples and for sample distribution and collection. We are also grateful to all CIQC member laboratories that took part in this CIQC exploratory proficiency testing run. Since January 2020, the CIQC has evolved into Canadian Biomarker Quality Assurance (CBQA) and Canadian Pathology Quality Assurance. Dr. Torlakovic is currently associated with CBQA. Disclaimer: Certain commercial equipment, instruments, and materials are identified to specify the experimental procedure. In no case does such identification imply a recommendation or endorsement by the National Institute of Standards and Technology, nor does it imply that the materials or equipment are necessarily the best available for the purpose.
Glossary
Nonstandard Abbreviations
- IHC
immunohistochemistry
- ER
estrogen receptor
- LOD
limit of detection
- SRM
Standard Reference Material
- ERF
equivalent reference fluorophore
- TMA
tissue microarray
- CIQC
Canadian Immunohistochemistry Quality Control
- HS
histology score
Author Contributions
All authors confirmed they have contributed to the intellectual content of this paper and have met the following 4 requirements: (a) significant contributions to the conception and design, acquisition of data, or analysis and interpretation of data; (b) drafting or revising the article for intellectual content; (c) final approval of the published article; and (d) agreement to be accountable for all aspects of the article thus ensuring that questions related to the accuracy or integrity of any part of the article are appropriately investigated and resolved.
Authors’ Disclosures or Potential Conflicts of Interest
Upon manuscript submission, all authors completed the author disclosure form. Disclosures and/or potential conflicts of interest:
Employment or Leadership
S.R. Sompuram, K. Vani, and S.A. Bogen are principals at Boston Cell Standards; A. Schaedle, Boston Cell Standards.
Consultant or Advisory Role
None declared.
Stock Ownership
S.R. Sompuram, K. Vani, and S.A. Bogen are shareholders in Boston Cell Standards.
Honoraria
None declared.
Research Funding
Research reported in this paper was supported in part by the National Cancer Institute of the National Institutes of Health under award number R44CA213476.
Expert Testimony
None declared.
Patents
Boston Cell Standards holds a patent and other patent applications on the technology used in the study. S.R. Sompuram, EP3065704 B1; S.A. Bogen, EP3065704 B1.
Role of Sponsor
The funding organizations played no role in the design of study, choice of enrolled patients, review and interpretation of data, preparation of manuscript, or final approval of manuscript.
References
- 1. Bogen S. A root cause analysis into the high error rate for clinical immunohistochemistry. Appl Immunohistochem Mol Morphol 2019;27:329–38. [DOI] [PMC free article] [PubMed] [Google Scholar]
- 2. Allison K, Hammond M, Dowsett M, McKernin S, Carey L, Fitzgibbons P, et al. Estrogen and progesterone receptor testing in breast cancer: ASCO/CAP guideline update. J Clin Oncol 2020;38:1346–66. [DOI] [PubMed] [Google Scholar]
- 3. Vani K, Sompuram S, Schaedle A, Balasubramanian A, Bogen S.. Analytic response curves of clinical breast cancer IHC tests. J Histochem Cytochem 2017;65:273–83. [DOI] [PMC free article] [PubMed] [Google Scholar]
- 4. Sompuram S, Vani K, Tracey B, Kamstock D, Bogen S.. Standardizing immunohistochemistry: a new reference control for detecting staining problems. J Histochem Cytochem 2015;63:681–90. [DOI] [PMC free article] [PubMed] [Google Scholar]
- 5. Vani K, Sompuram S, Naber S, Goldsmith J, Fulton R, Bogen S.. Levey-Jennings analysis uncovers unsuspected causes of immunohistochemistry stain variability. Appl Immunohistochem Mol Morphol 2016;24:688–94. [DOI] [PMC free article] [PubMed] [Google Scholar]
- 6. Sompuram S, Kodela V, Ramanathan H, Wescott C, Radcliffe G, Bogen S.. Synthetic peptides identified from phage-displayed combinatorial libraries as immunodiagnostic assay surrogate quality control targets. Clin Chem 2002;48:410–20. [PubMed] [Google Scholar]
- 7. Sompuram S, Vani K, Hafer L, Bogen S.. Antibodies immunoreactive with formalin-fixed tissue antigens recognize linear protein epitopes. Am J Clin Pathol 2006;125:82–90. [PubMed] [Google Scholar]
- 8. Sompuram S, Vani K, Bogen S.. A molecular model of antigen retrieval using a peptide array. Am J Clin Pathol 2006;125:91–8. [PubMed] [Google Scholar]
- 9. Wang L, DeRose P, Gaigalas A.. Assignment of the number of equivalent reference fluorophores to dyed microspheres. J Res Natl Inst Stand Technol 2016;121:264–81. [DOI] [PMC free article] [PubMed] [Google Scholar]
- 10. Walker J, Saunders R, Hattenburg A. Spectral radiance calibrations. Special Publication 250-1. Gaithersburg (MD): National Bureau of Standards; 1987.
- 11. Yoon H, Gibson C. Spectral irradiance calibrations. Special Publication 250-89. Gaithersburg (MD): NIST; 2011.
- 12. Larason T, Houston J. Spectroradiometric detector measurements: ultraviolet, visible, and near-infrared detectors for spectral power. Special Publication 250-41. Gaithersburg (MD): NIST; 2008.
- 13. Larason T, Bruce S, Cromer C.. The NIST high accuracy scale for absolute spectral response from 406 nm to 920 nm. J Res Natl Inst Stand Technol 1996;101:133–40. [DOI] [PMC free article] [PubMed] [Google Scholar]
- 14. Barnes P, Early E, Parr A. Spectral reflectance. Special Publication 250-48. Gaithersburg (MD): NIST; 1998.
- 15. Ripple D, DeRose P.. Primary determination of particle number concentration with light obscuration and dynamic imaging particle counters. J Res Natl Inst Stand Technol 2018;123:1–21. [DOI] [PMC free article] [PubMed] [Google Scholar]
- 16. DeRose P, Wang L.. NIST fluorescence-based measurement services. BioPharm Int 2018;31:24–9. [PMC free article] [PubMed] [Google Scholar]
- 17. Moore H, Kelly A, Jewell S, McShane L, Clark D, Greenspan R, et al. Biospecimen reporting for improved study quality (BRISQ). Cancer Cytopathol 2011;119:92–102. [DOI] [PubMed] [Google Scholar]
- 18. McCarty K, Szabo E, Flowers J, Cox E, Leight G, Miller L, et al. Use of a monoclonal anti-estrogen receptor antibody in the immunohistochemical evaluation of human tumors. Cancer Res 1986;46:4244s–4248s. [PubMed] [Google Scholar]
- 19. Sompuram S, Vani K, Schaedle A, Balasubramanian A, Bogen S.. Quantitative assessment of immunohistochemistry laboratory performance by measuring analytic response curves and limits of detection. Arch Pathol Lab Med 2018;142:851–62. [DOI] [PubMed] [Google Scholar]
- 20. Vani K, Sompuram S, Schaedle A, Balasubramanian A, Pilichowska M, Naber S, et al. The importance of epitope density in selecting a positive IHC control. J Histochem Cytochem 2017;65:463–77. [DOI] [PMC free article] [PubMed] [Google Scholar]
- 21. Sompuram SR, Vani K, Schaedle AK, Balasubramanian A, Bogen SA.. Selecting an optimal positive IHC control for verifying antigen retrieval. J Histochem Cytochem 2019;67:275–89. Epub Jan 20, 2019. [DOI] [PMC free article] [PubMed] [Google Scholar]
- 22. Torlakovic E, Nielsen S, Vyberg M, Taylor C.. Getting controls under control: the time is now for immunohistochemistry. J Clin Pathol 2015;68:879–82. [DOI] [PMC free article] [PubMed] [Google Scholar]
- 23. Elizabeth M, Hammond H, Barker P, Taube S, Gutman S.. Standard reference material for Her2 testing: report of a National Institute of Standards and Technology-sponsored consensus workshop. Appl Immunohistochem Mol Morphol 2003;11:103–6. [PubMed] [Google Scholar]
Associated Data
This section collects any data citations, data availability statements, or supplementary materials included in this article.


