

Abstract
Tumor recurrence years after seemingly successful treatment of primary tumors is one of the major causes of mortality in cancer patients. Reactivation of dormant tumor cells is largely responsible for this phenomenon. Using dormancy models of lung and ovarian cancer, we found a specific mechanism, mediated by stress and neutrophils, that may govern this process. Stress hormones cause rapid release of pro-inflammatory S100A8/A9 proteins by neutrophils. S100A8/A9 induce activation of myeloperoxidase, resulting in accumulation of oxidized lipids in these cells. Upon release from neutrophils these lipids upregulate the fibroblast growth factor pathway in tumor cells, causing tumor cell exit from the dormancy and formation of new tumor lesions. Higher serum concentrations of S100A8/A9 were associated with shorter time to recurrence in patients with lung cancer after complete tumor resection. Targeting of S100A8/A9 or β2 adrenergic receptors abrogated stress-induced reactivation of dormant tumor cells. These observations demonstrate a mechanism linking stress and specific neutrophil activation with early recurrence in cancer.
One sentence summary:
Tumor recurrence can be induced by stress-activated neutrophils via release of S100A8/A9 proteins and modified lipids.
Introduction
Tumor recurrence years after complete surgical resection or complete clinical response to chemotherapy or radiation therapy is one of the major causes of cancer-related deaths (1, 2). Cancer cell dissemination is likely to happen early during primary cancer evolution prior to initial therapy (3, 4). Disseminated tumor cells can lie dormant for extended time before initiating tumor outgrowth. Cancer cell dormancy encompasses two major conditions: populations maintaining steady state through similar rates of growth and death (population-level dormancy) and single/small population of quiescent cells in a reversible state of cell arrest in which cells retain the ability to re-enter the cell cycle (cellular dormancy) (5).
Senescence is a stress response that can be induced by a wide range of intrinsic and extrinsic factors including p53/p21cip1 pathway, radiation, or chemotherapy (6). Senescent cancer cells have enlarged size, accumulation of DNA damage foci, and increased activity of senescence-associated β-galactosidase (SA-β-gal) (7). The DNA damage response induces cell cycle arrest either in the G1 or more often in the G2/M stage of cell cycle (8). Senescent cells can persist for a long time, can activate stemness programs, and acquire higher tumorigenicity than original non-senescent cells (9). In contrast to irreversible replicative senescence of normal cells, a tumor cell senescence-like state induced by oncogenes, chemotherapy, or radiation therapy can be reversed (10, 11).
The mechanisms that contribute to reactivation of dormant tumor cells and subsequent cancer recurrence remain mostly unclear. Inflammation is implicated in supporting growth of disseminated tumor cells (12). However, epidemiological evidence directly linking inflammation and infections with cancer recurrence is lacking. Myeloid cells are a critical component of any inflammatory process and are major part of tumor microenvironment (TME). Myeloid cells include populations of macrophages (MΦ), dendritic cells (DC), polymorphonuclear neutrophils (PMN), and monocytes (MON). Accumulation of pathologically activated immune suppressive PMN and MON, termed polymorphonuclear myeloid-derived suppressor cells (PMN-MDSCs) and monocytic MDSCs (M-MDSCs), respectively, is one of the prominent features of cancer and chronic inflammation (13). These cells contribute to tumor progression via multiple mechanisms and their accumulation has been shown to correlate with both cancer stage and poor response responses to therapy (14, 15). Thus, pathologically-activated MDSCs may represent a starting point in understanding the mechanisms behind reactivation of dormant cells.
Here, we identified a stress and inflammation-dependent mechanism of reactivation of dormant tumor cells by PMN. We found that stress hormones induced massive release of pro-inflammatory S100A8/A9 complexes by PMN via β2-adrenergic receptors without affecting their viability. These proteins caused accumulation of oxidized lipids in PMN in autocrine and paracrine fashion, which upon release directly activated proliferation of dormant tumor cells via upregulation of a fibroblast growth factor receptor pathway.
Results
PMN-MDSC but not PMN, reactivate proliferation of dormant tumor cells in a mouse model of lung cancer
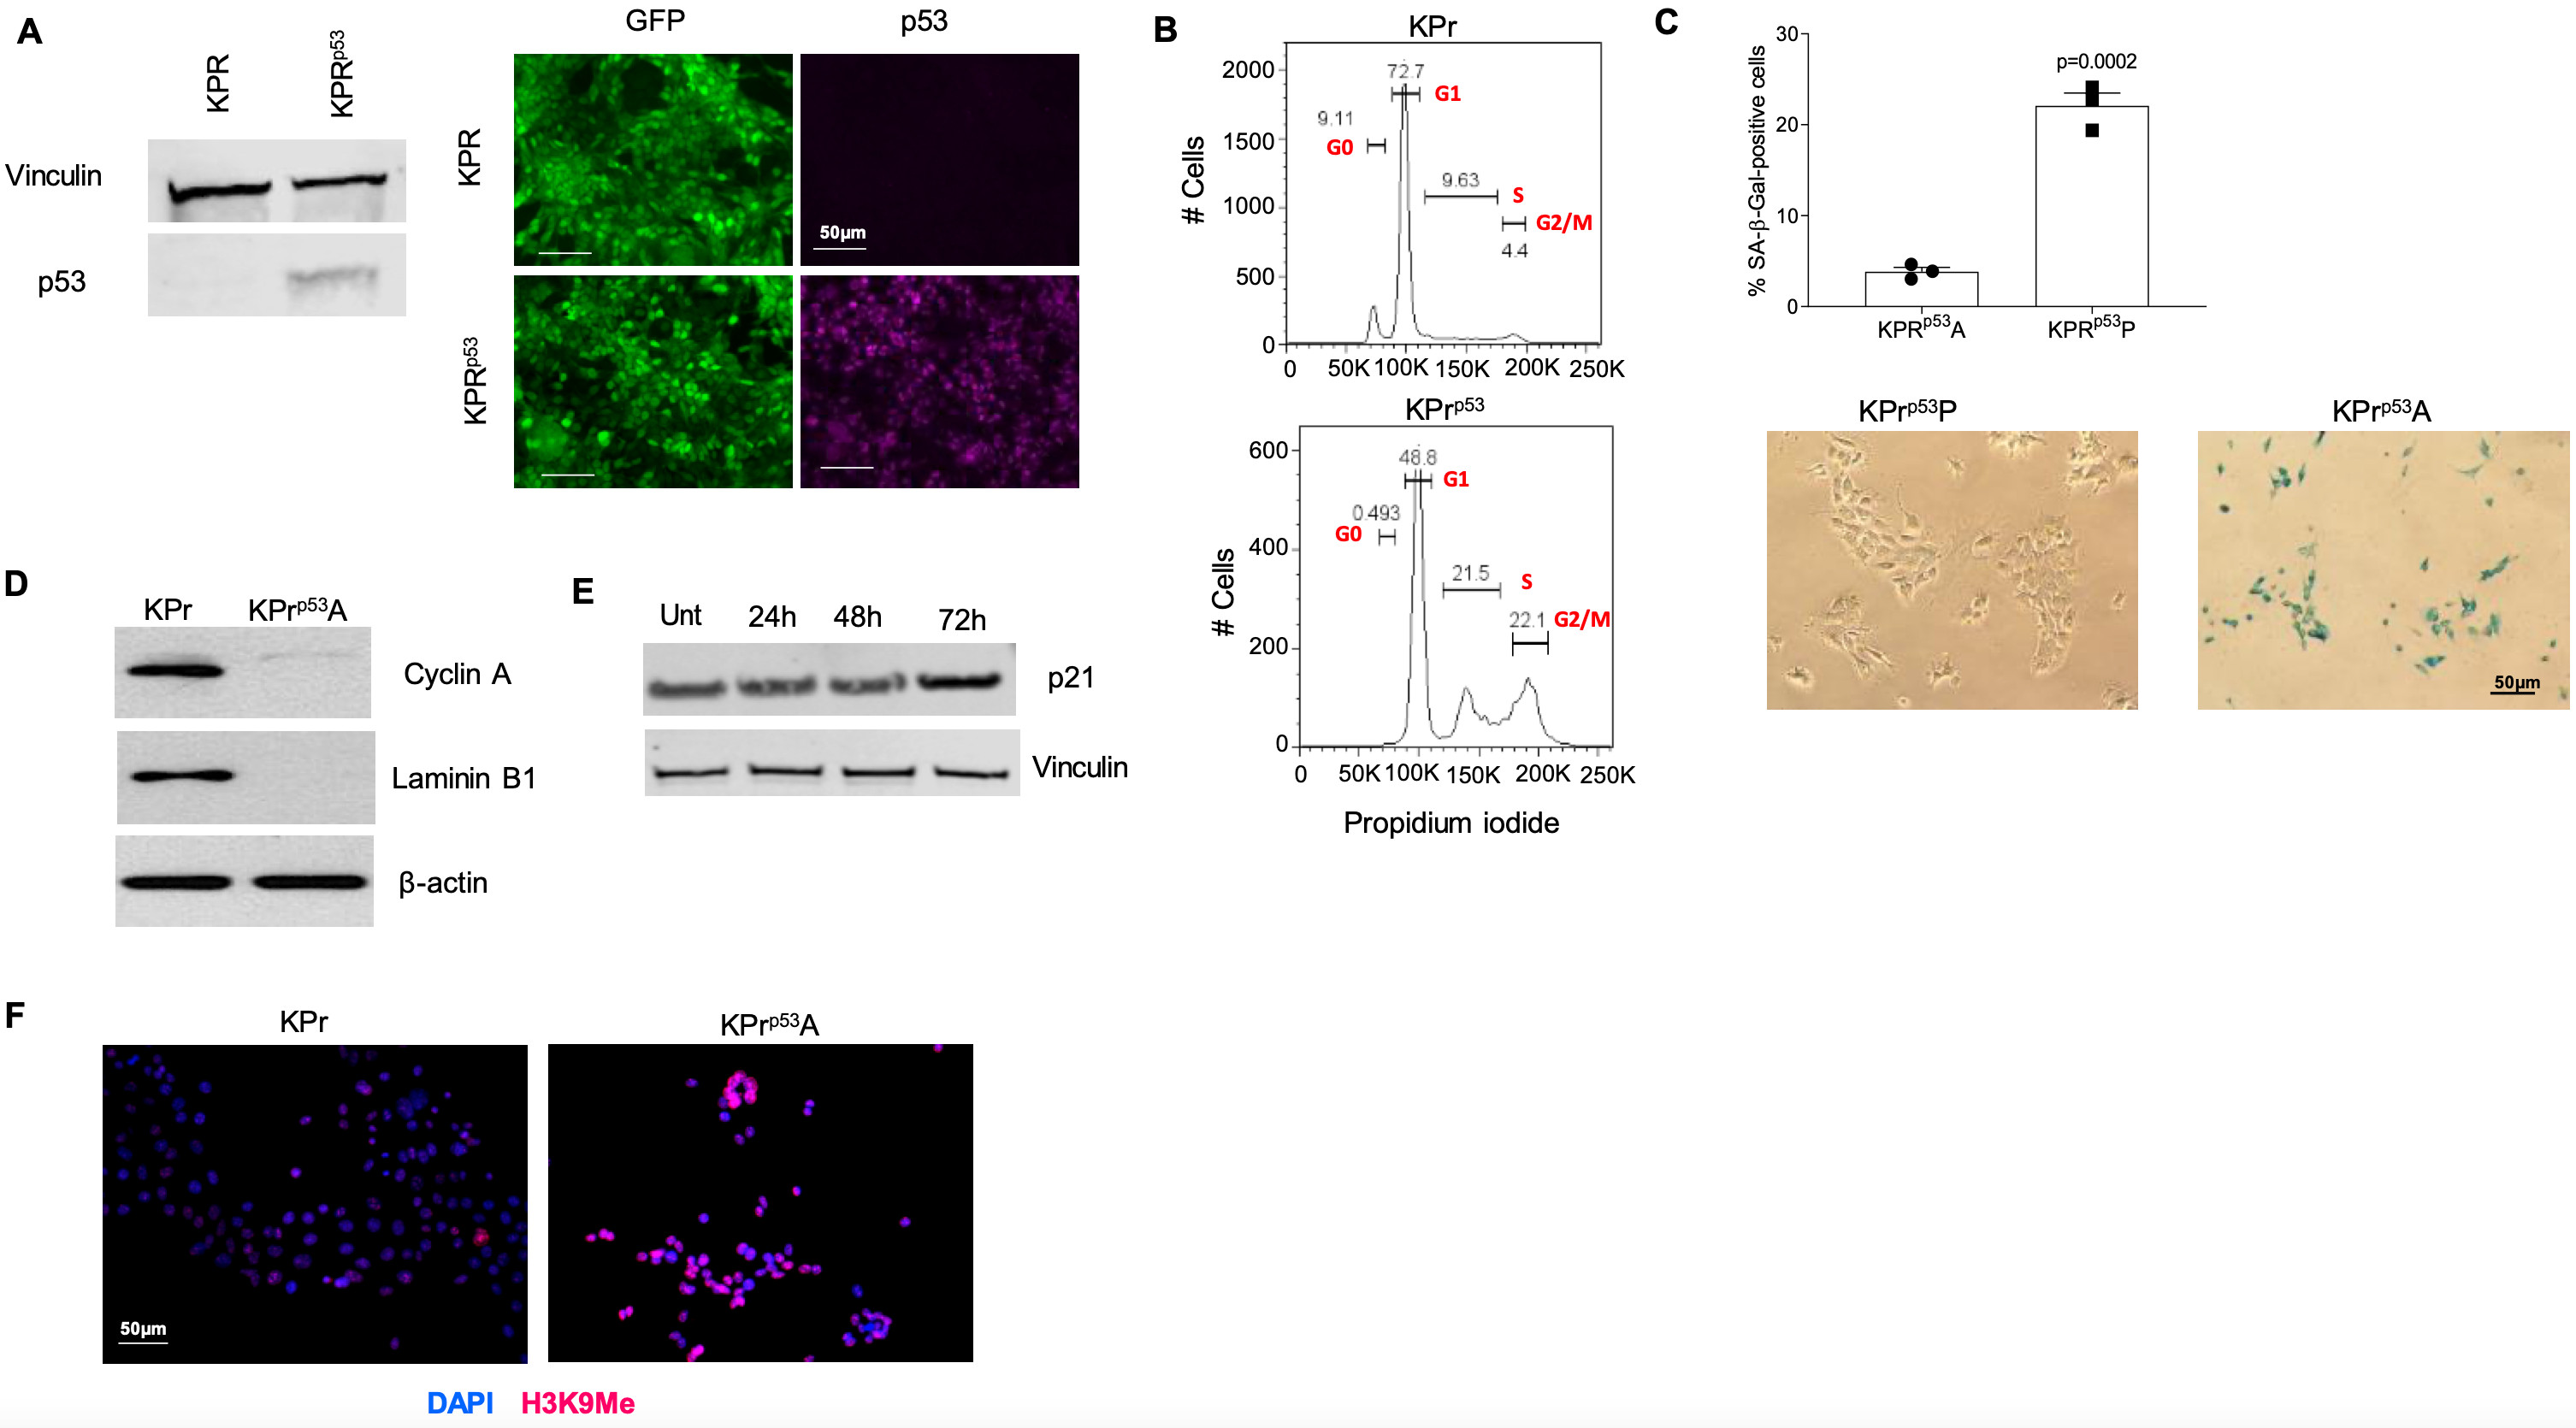
To investigate tumor dormancy, we generated a mouse model of disseminated dormant tumor cells. To accomplish this, mice expressing the KRASG12D allele, which are prone to lung adenocarcinoma, were crossed to a dual transgenic mouse expressing Trp53Lox-STOP-Lox and Rosa26CreER alleles. Spontaneously arising tumors were used to derive KrasG12D/+;Trp53LSL/LSL;Rosa26Cre-ER/CreER (KPr) cell lines, which were further modified to express both luciferase and GFP for in vitro and in vivo monitoring. Tamoxifen-mediated activation of CreER facilitates deletion of the transcriptional STOP cassette embedded in the first intron of the Trp53 locus, resulting in the expression of endogenous p53. This mediates cell cycle arrest and senescence (16, 17). After exposure to tamoxifen and restoration of p53 expression (KPrp53) (fig. S1A), a subset of KPrp53 cells were arrested in G2M phase of cell cycle (fig. S1B). KPrp53-arrested (KPrp53A) cells were sorted from proliferating cells (KPrp53P) based on retention of CellTrace Violet proliferation dye (Fig. 1A). When seeded at low density (1000 cells/cm2) KPrp53A cells did not proliferate for at least 10 days (Fig. 1A–B). Consistent with a p53-mediated senescence-like response, KPrp53A were positive for β-galactosidase activity (fig. S1C), lacked expression of cyclin A and laminin B1 (fig. S1D), had modest but clearly detectable increases in p21 (fig. S1E), and expressed lysine 9-trimethylated histone H3 (H3K9Me3) (fig. S1F).
Figure 1. Polymorphonuclear myeloid-derived suppressor cells but not neutrophils reactivate dormant tumor cells.
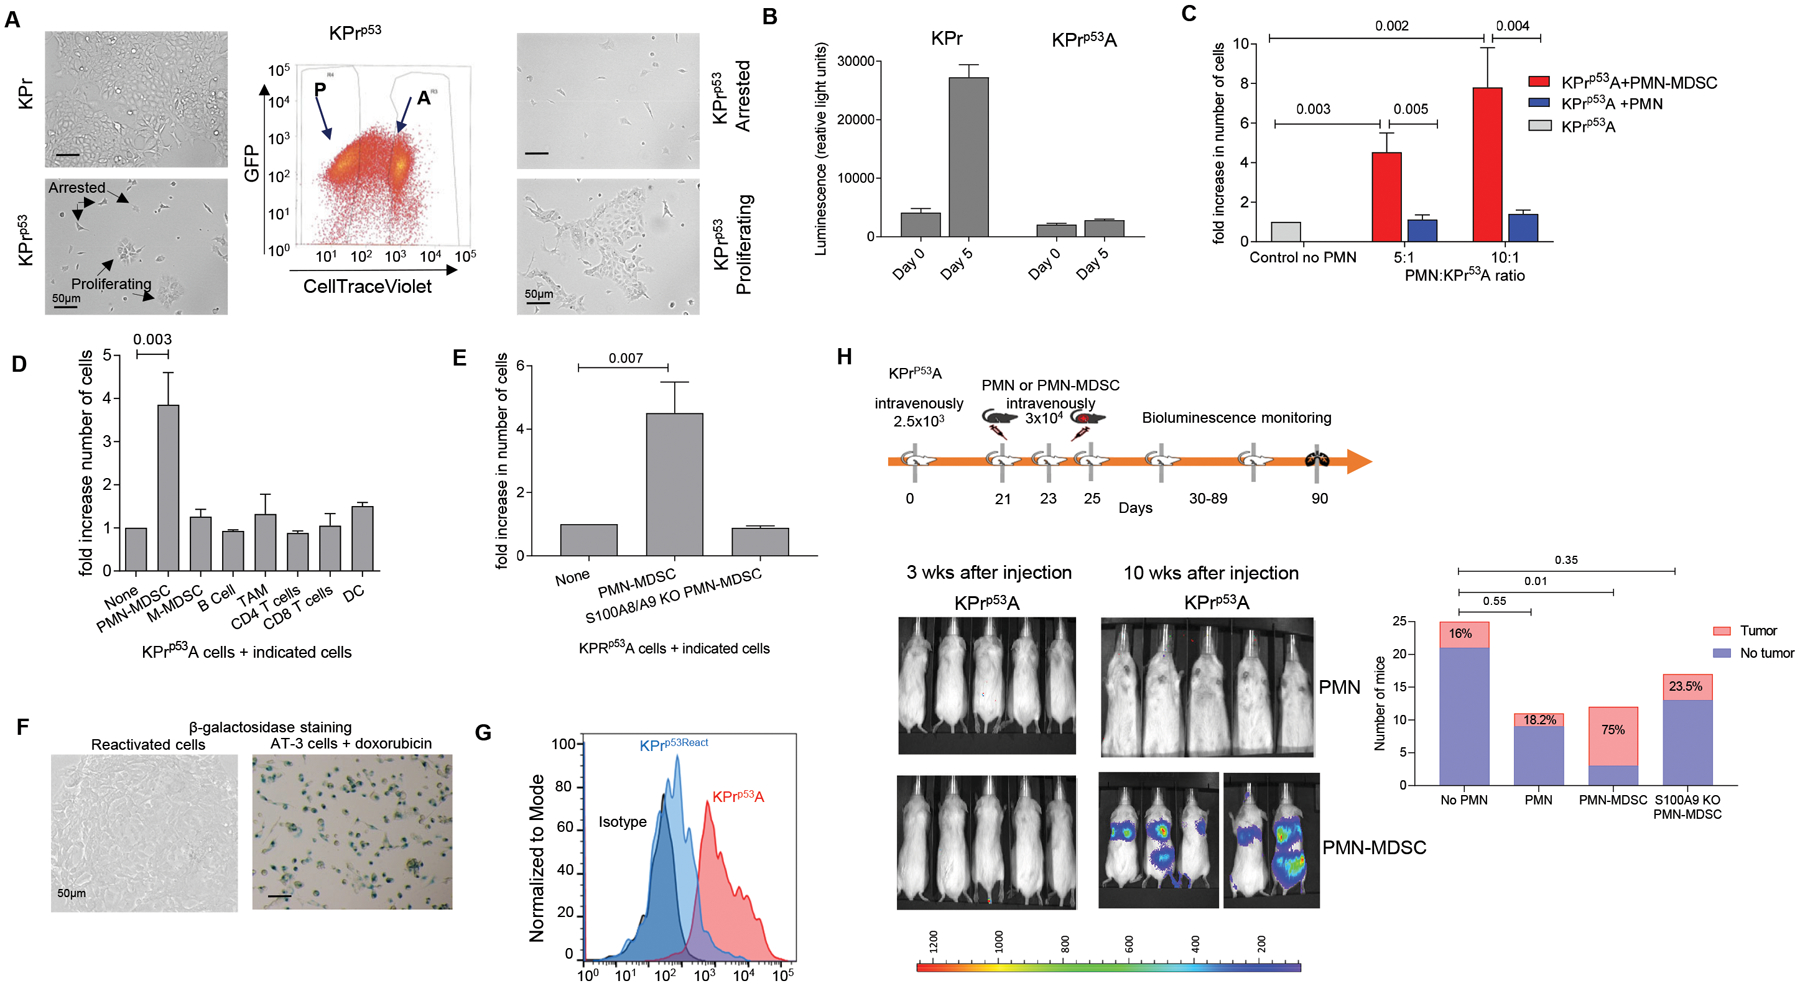
A. Representative image of KPr tumor cells in culture before (left) and after sorting (right). Center panel represents the gating strategy to sort arrested (A) and proliferating (P) cells. Scale bar = 50 μm. B. Example of proliferation measured by luciferase activity in KPr and KPrp53A cells after 5 days of culture. Mean ± SEM are shown, n=3. C. Fold increase in number of KPrp53A cells cultured in the presence of Ly6G+ PMN-MDSC (isolated from LLC tumor-bearing mice) or Ly6G+ PMN (from naïve mice) over KPrp53A cells cultured alone. Data represented as Mean ± SEM. 6 independent experiments with 16 replicates each were performed and one experiment is presented. D. Fold increase in number of KPrp53A cells cultured with indicated cells at 1:10 ratio over KPrp53A cells cultured alone. Data represent Mean ± SEM of 3 independent experiments with 16 replicates each are shown. E. Fold increase in the number of KPrp53A cells cultured at 1:10 ratio with PMN-MDSC isolated from spleens of WT or S100a9KO mice over KPrp53A cells cultured alone. Mean ±SEM of 4 independent experiments with 16 replicates each are shown. C-E. p values were calculated one way ANOVA with correction for multiple comparisons. F. Representative images of β-galactosidase staining in reactivated KPRp53AReact tumor cells. AT-3 cells treated with doxorubicin (20nM) were used as a positive control. G. Flow cytometry analysis of BrdU retention in KPrp53A cells (red) and KPrp53React cells (blue). H. Top panel, schema of the experiment. Bottom panel, representative images of NOD/SCID mice injected intravenously with KPrp53A cells and then with PMN or PMN-MDSC as indicated. Right panel – the number and proportion of mice in each group with detectable tumors. P-values were calculated by Fisher’s exact test.
We next evaluated the ability of different myeloid cells isolated from tumor-bearing or tumor-free mice to reactivate proliferation of KPrp53A cells. While addition of CD11b+Ly6CloLy6G+ PMN from tumor-free mice at 5:1 ratio had no effect on the number of KPrp53A cells after 5 days in culture, addition of PMN-MDSC with the same phenotype isolated from Lewis Lung Carcinomas (LLC) bearing mice resulted in proliferation of KPrp53A cells (Fig. 1C). In contrast, none of other tested myeloid or lymphoid cells were able to reactivate proliferation of KPrp53A cells even at high (10:1) effector:tumor cell ratios (Fig. 1D).
One of the most prominent factors that distinguish PMN-MDSC from PMN is high expression of S100A8/A9 proteins (18). S100A8 and S100A9 are low-molecular-weight intracellular calcium-binding proteins (19). Deletion of S100A8/A9 dramatically reduced suppressive activity of MDSC (20, 21). S100A8/A9 has diverse intracellular functions. These proteins are involved in uptake and transport of arachidonic acid (22), NADPH oxidase activity, and ROS production (23). S100A9 could regulate PMN-MDSC suppressive function via increased expression of Ptges and PGE2 production (21).
We explored the involvement of S100A8/A9 proteins in the ability of PMN-MDSC to reactivate proliferation of KPrp53A tumor cells by using S100A9 knockout (KO) mice (24). These mice also don’t express S100A8 protein, thus making them functional double KO. PMN-MDSC isolated from LLC TB S100A8/A9 KO mice were not able to activate proliferation of KPrp53A cells in vitro (Fig. 1E). Finally, to confirm that reactivated KPrp53A cells (KPrp53AReact) are proliferating, we show that the cells lose β-galactosidase activity (Fig. 1F) and demonstrate incorporation of the proliferation label, bromodeoxyuridine (BrdU) (Fig. 1G).
Immunodeficient NOD/SCID mice were used to assess tumor dormancy in vivo. After intravenous (i.v.) administration of KPrp53P to these mice, lung tumor lesions became detectable via bioluminescence imaging within 2 weeks; conversely, administration of KPrp53A cells did not form detectable lesions after 10 weeks (fig. S2A, Fig. 1H). Tumor lesions were readily detectable by immunohistochemistry in lungs of mice injected with KPrp53P cells (fig. S2B). When lung tissues from mice injected with KPrp53A cells were evaluated by microscopy, single KPrp53A cells were detectable (fig. S2C) indicating that single tumor cells were present in lung but did not proliferate.
In contrast to C57BL/6 WT mice, PMN were not expanded in NOD/SCID LLC TB mice (Fig. S2D) and PMN from these mice failed to re-activate proliferation of KPrp53A cells (Fig. S2E). Thus, NOD/SCID model allows for evaluation of the effect of exogenous PMN. KPrp53A cells were injected i.v. into NOD/SCID mice. One week later, PMN from the spleen of naïve C57BL/6 mice, PMN-MDSC from the spleen of wild-type LLC-bearing mice, or PMN-MDSC from the spleen of S100A8/A9 KO LLC-bearing mice were transferred i.v. 3 times every other day. Ten weeks after the KPrp53A cell transfer, 16% of control mice developed tumor lesions in lungs (Fig. 1H). Transfer of PMN did not affect that frequency. In contrast, 75% of mice injected with wild-type PMN-MDSC developed lung tumors. This effect was completely abrogated when PMN-MDSC were transferred from S100A8/A9 KO LLC TB mice (Fig. 1H). Thus, PMN-MDSC from tumor-bearing mice can reactivate dormant tumor cells, and reactivation depends on expression of S100A8/A9 proteins by PMN-MDSC.
Stress induced S100A8/A9 regulates reactivation of dormant tumor cells by neutrophils
In the absence of tumor burden, mice and humans lack PMN-MDSC (14). We therefore investigated the conditions that could induce PMN to acquire the ability to reactivate dormant tumor cells in the absence of tumor burden by mimicking the events leading to cancer recurrence. Incubation of PMN with pro-inflammatory cytokines such as interleukin 1β (IL-1β), tumor necrosis factor α (TNFα), or interleukin 6 (IL-6) (Fig. 2A), PMA, or the ER stress inducer thapsigargin (Fig. S3A) did not induce their ability to reactivate dormant KPrp53A cells. LPS at concentrations ranging from 0.5 μg/ml to 2 μg/ml also did not affect the ability of PMN to reactivate KPrp53A cells (Fig. 2A, B). In contrast, addition of recombinant S100A8/A9 enabled PMN to induce proliferation of KPrp53A cells. In the absence of PMN, there were no effect of S100A8/9 on reactivation of KPrp53A cells (Fig. 2C). Likewise, incubation of S100A8/A9 with monocytes failed to reactivate KPrp53A cells (fig. S3B). Thus, exogenous S100A8/A9 treatment of PMN phenocopied the effect of PMN-MDSC on dormant cells.
Figure 2. Neutrophil-mediated reactivation of dormant cells is regulated by stressed-induced S100A8/A9.
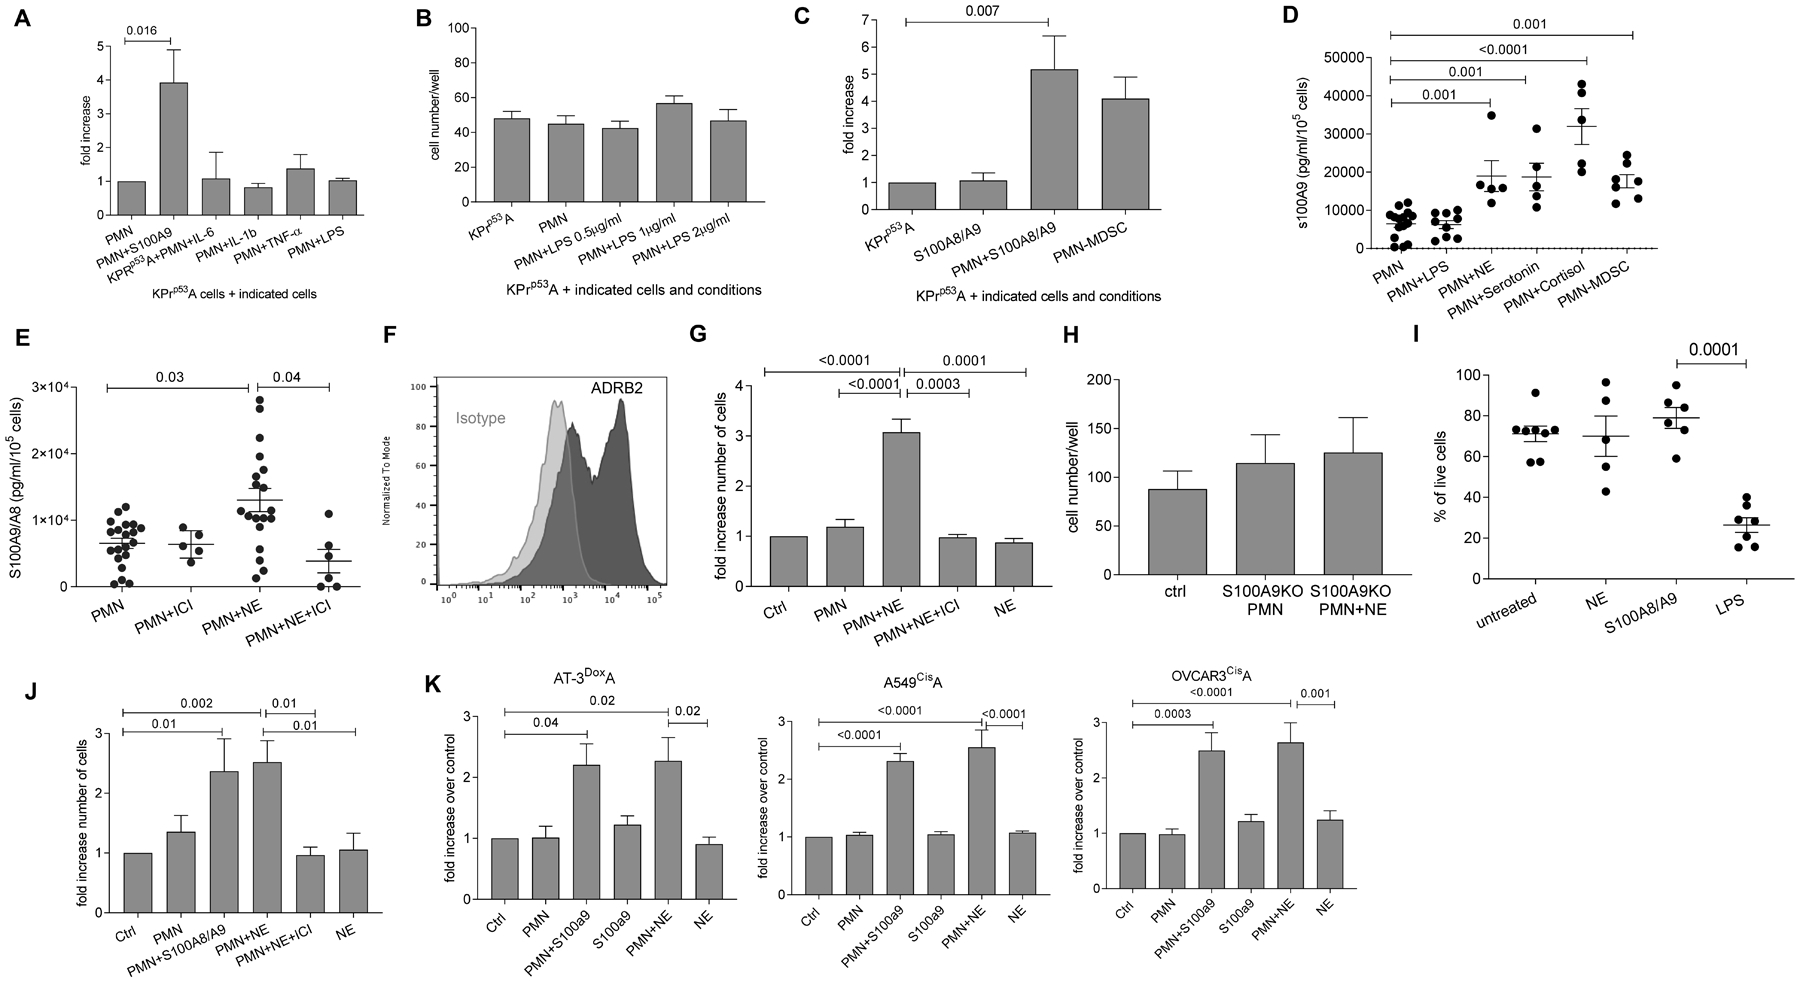
A. Fold increase in the number of KPrp53A cells cultured in the presence of PMN and S100A8/A9 or indicated cytokines relative to KPrp53A cell cultured with PMN. Three independent experiments with 16 replicates were performed. Mean ± SEM of one experiment is shown. B. Fold increase in the number of KPrp53A cells cultured in the presence of PMN and LPS relative to KPrp53A cells cultured with PMN or alone. Mean ± SEM of 3 independent experiments with 16 replicates each are shown. C. Fold increase in the number of KPrp53A cells cultured in the presence of S100A8/A9 alone, PMN and S100A8/A9, or PMN-MDSC relative to KPrp53A cultured alone. Mean ± SEM of 10 independent experiments with 16 replicates each are shown. D. S100A8/A9 protein produced by PMN after treatment with indicated hormones or LPS was measured by ELISA. PMN-MDSC were isolated from spleens of Lewis Lung Carcinoma tumor-bearing mice. Mean ±SEM and results of each independent experiment with 3 replicates are shown. E. S100A8/A9 protein secreted in vitro from PMN and PMN treated with NE with or without ICI-118;553 as measured by ELISA. Mean ± SEM and results of independent experiment with 3 replicates are shown. F. Flow cytometry staining of ADRB2 receptor (dark gray) on PMN isolated from mouse spleen. Isotype control – light gray. Representative histogram of three experiments is shown. G. Fold increase in the number of KPrp53A cells cultured with PMN alone, NE alone, PMN and NE together, and PMN and NE plus ICI-118;553 relative to KPrp53A cells cultured alone (Ctrl). Ten independent experiments with 16 replicates for each experiment were performed. Mean ± SEM in representative experiment are shown. H. Number of KPrp53A cells cultured in the presence of PMN from S100a9KO mice alone or together with NE relative to KPrp53A cells cultured alone (ctrl). Mean ± SEM are reported for 16 replicates. I. Percentage of live PMN after overnight incubation with NE, S100A8/A9, or LPS. Each dot represents the average of 3 experimental replicates of one single experiments. Mean ±SEM are shown for each group. J. Fold increase in number of LL2CisA cells cultured with PMN alone or together with S100A8/A9 or NE relative to LL2CisA cultured alone (Ctrl). Mean ±SEM of 3 independent experiments with 16 replicates each are shown. K. Fold increase of cell counts of indicated mouse AT-3DoxoA and human A549CisA and OVCARCisA tumor cells cultured with PMN alone or together with S100A8/A9 or NE relative to tumor cells cultured alone (Ctrl). Mean ±SEM of 3 independent experiments with 16 replicates each. In all panels p values were calculated in ANOVA test with correction for multiple comparisons.
Since neutrophil extracellular traps (NET) were previously implicated in reactivation of dormant cells (25), we tested the effect of S100A8/A9 protein on NET formation by PMN and PMN-MDSC. S100A8/A9 did not cause significant upregulation of NETs (fig. S3C). Citrullination of histones by peptidyl arginine deiminase 4 (PAD4) is central for NET formation, and PMN isolated from PAD4 KO mice are not able to form NETs (26). PMN isolated from PAD4 KO mice induced proliferation of KPrp53A cells in the presence of S100A8/A9 (fig. S3D) indicating that the effect of S100A8/A9 proteins on PMN is not mediated by NET formation.
We then investigated factors that could affect the release of S100A8/A9 protein by PMN. Epidemiological and clinical studies have provided strong evidence linking chronic stress and cancer progression (27, 28). Therefore, we tested the effect of stress hormones such as epinephrine, norepinephrine (NE), cortisol, and serotonin on S100A8/A9 release by PMN. Treatment of PMN with these hormones, but not with LPS, caused rapid release of S100A8/A9 proteins. The specific β2 adrenergic receptor antagonist (β blocker) ICI-118,551 abrogated the NE-mediated secretion of S100A8/A9 by PMN (Fig. 2D, E). We then focused on NE, since it has previously been implicated in promotion of tumor proliferation (29) and metastasis in the lungs (30) and has shown a direct effect on myeloid cells (31). PMN express a β2-adrenergic receptor (Fig. 2F). Addition of NE to the culture of PMN with KPrp53A caused proliferation of tumor cells, and this effect was abrogated by ICI-118,551 (Fig. 2G). PMN from S100A8/A9 KO mice failed to reactivate dormant tumor cells in the presence of NE, (Fig. 2H) indicating that the effect of S100A8/A9 was downstream of NE. NE alone did not affect the proliferation of KPrp53A cells, although tumor cells express β2 receptor (fig. S3E,F). Overnight incubation of PMN with NE and S100A8/A9 did not affect PMN viability, whereas LPS dramatically reduced it (Fig. 2I). Additionally, ICI-118,551 showed no cytotoxic effect on PMN (fig. S3G). Thus, strong PMN activation by LPS was not a requirement for reactivation of dormant cells and NE signaling promoted PMN-mediated reactivation of dormant cells.
The effect of stress in vitro and in vivo on reactivation of dormant tumor cells
We asked whether PMN could affect tumor cells that underwent chemotherapy-induced senescence. First, we treated mouse lung cancer cells (LL2), human lung cancer cells (A549) and human ovarian cancer cells (OVCAR3) with cisplatin to demonstrate that chemotherapy induced senescence. Cisplatin treatment generated proliferation-arrested cells (LL2cisA; A549cisA; OVCAR3cisA) (fig. S4A). These cells were arrested in G2M phase (fig. S4B), had no or low p53 induction, low cyclin A and laminin B1 (fig. S4C), upregulated p21 (fig. S4D), β-galactosidase activity (fig. S4E), and increased expression of H3K9Me3 (fig. S4F).
Thus, cisplatin caused a senescence-like phenotype in tumor cells in vitro. This provides a model for evaluating the role of PMN in reactivation of chemotherapy-induced senescence. Mouse PMN in combination with mouse S100A8/A9 activated proliferation of LL2cisA cells (Fig. 2J) and breast carcinoma AT-3 cells that were arrested by the treatment with doxorubicin AT-3DoxA (Fig. 2K). Additionally, we found reactivation of A549cisA and OVCAR3cisA cells when cultured with human PMN in combination with human S100A8/A9 (Fig. 2K). NE reactivated dormant mouse and human tumor cells in the presence of PMN, and this effect was abrogated by ICI-118,551 (Fig. 2J, K).
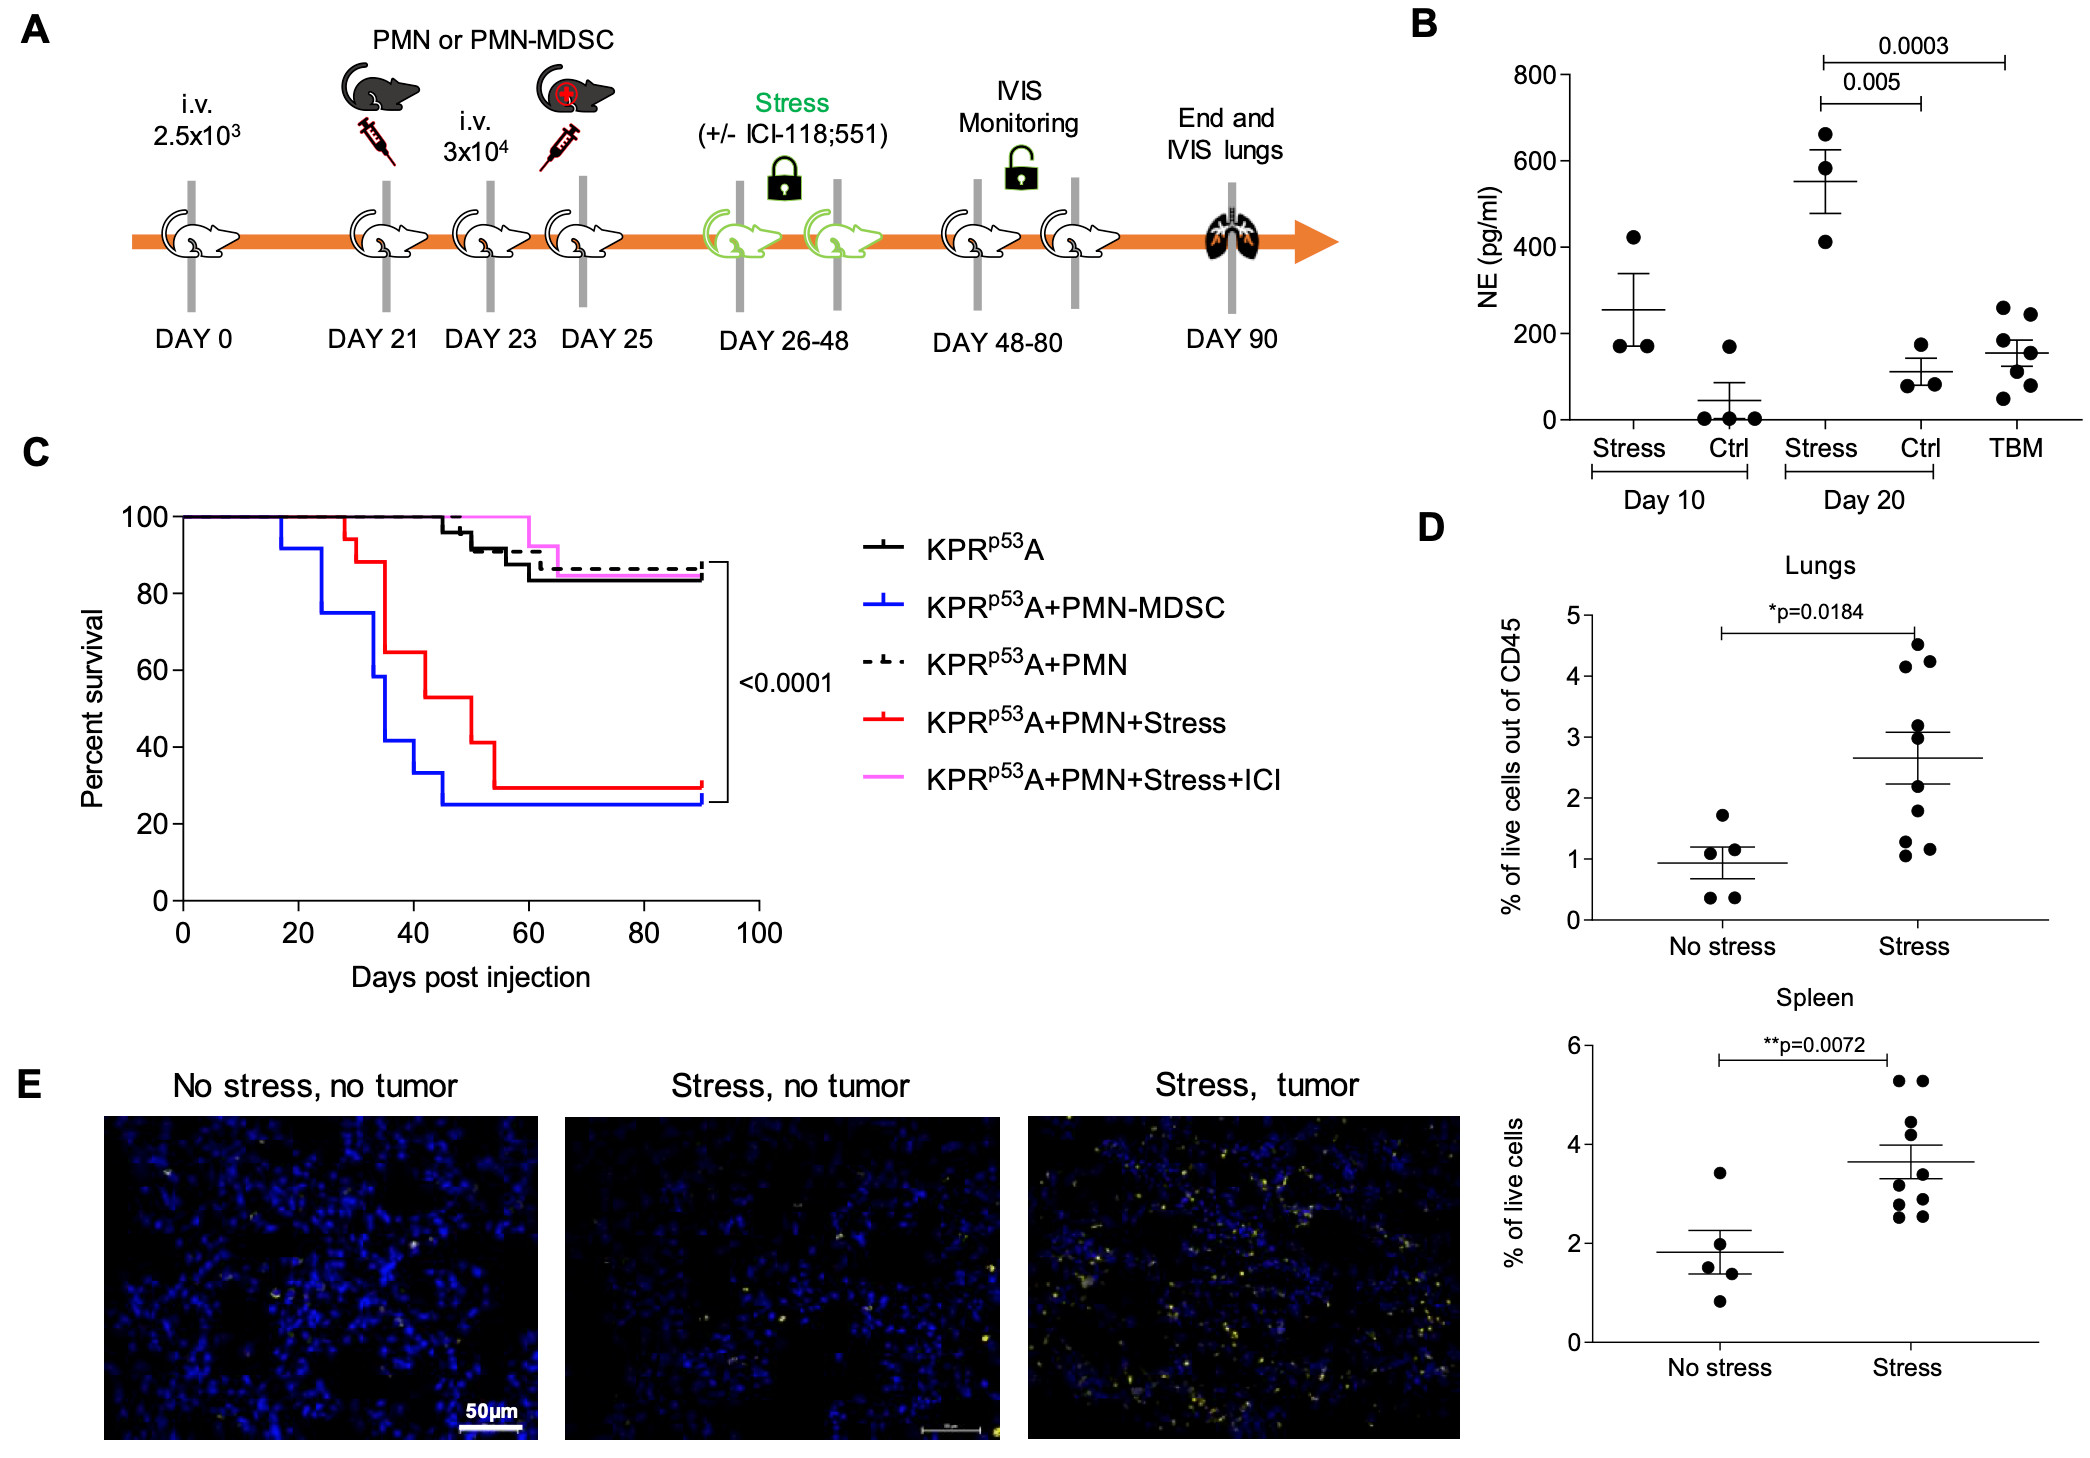
We next evaluated the effect of stress on reactivation of KPrp53A cells in vivo. Stress was induced in vivo by daily immobilization of mice in individual semi-cylindric plastic restrainers (BrainTree scientific) over 3-week period (32, 33) (fig. S5A). As expected, this resulted in substantial increase in NE concentration in circulation (fig. S5B). Injection of PMN i.v. to stressed NOD/SCID tumor-bearing mice caused increased growth of KPrp53A cells in lung and liver in 70.6% of mice, as compared to 18.2% after PMN in injection in mice without stress (p=0.018). Treatment with ICI-118,551 abrogated this effect (Fig. 3A). Using end-point criteria for humane euthanasia of the mice, we also assessed survival of tumor-bearing mice undergoing stress. Administration of PMN to stressed mice bearing KPrp53A cells markedly reduced survival of the mice. The effect was comparable to that observed in non-stressed mice injected with PMN-MDSC from TB mice (fig. S5C). Finally, treatment of mice with ICI-118,551 dramatically improved survival (fig. S5C).
Figure 3. Systemic stress stimulates S100A8/A9 production from PMN and induces tumor reactivation.
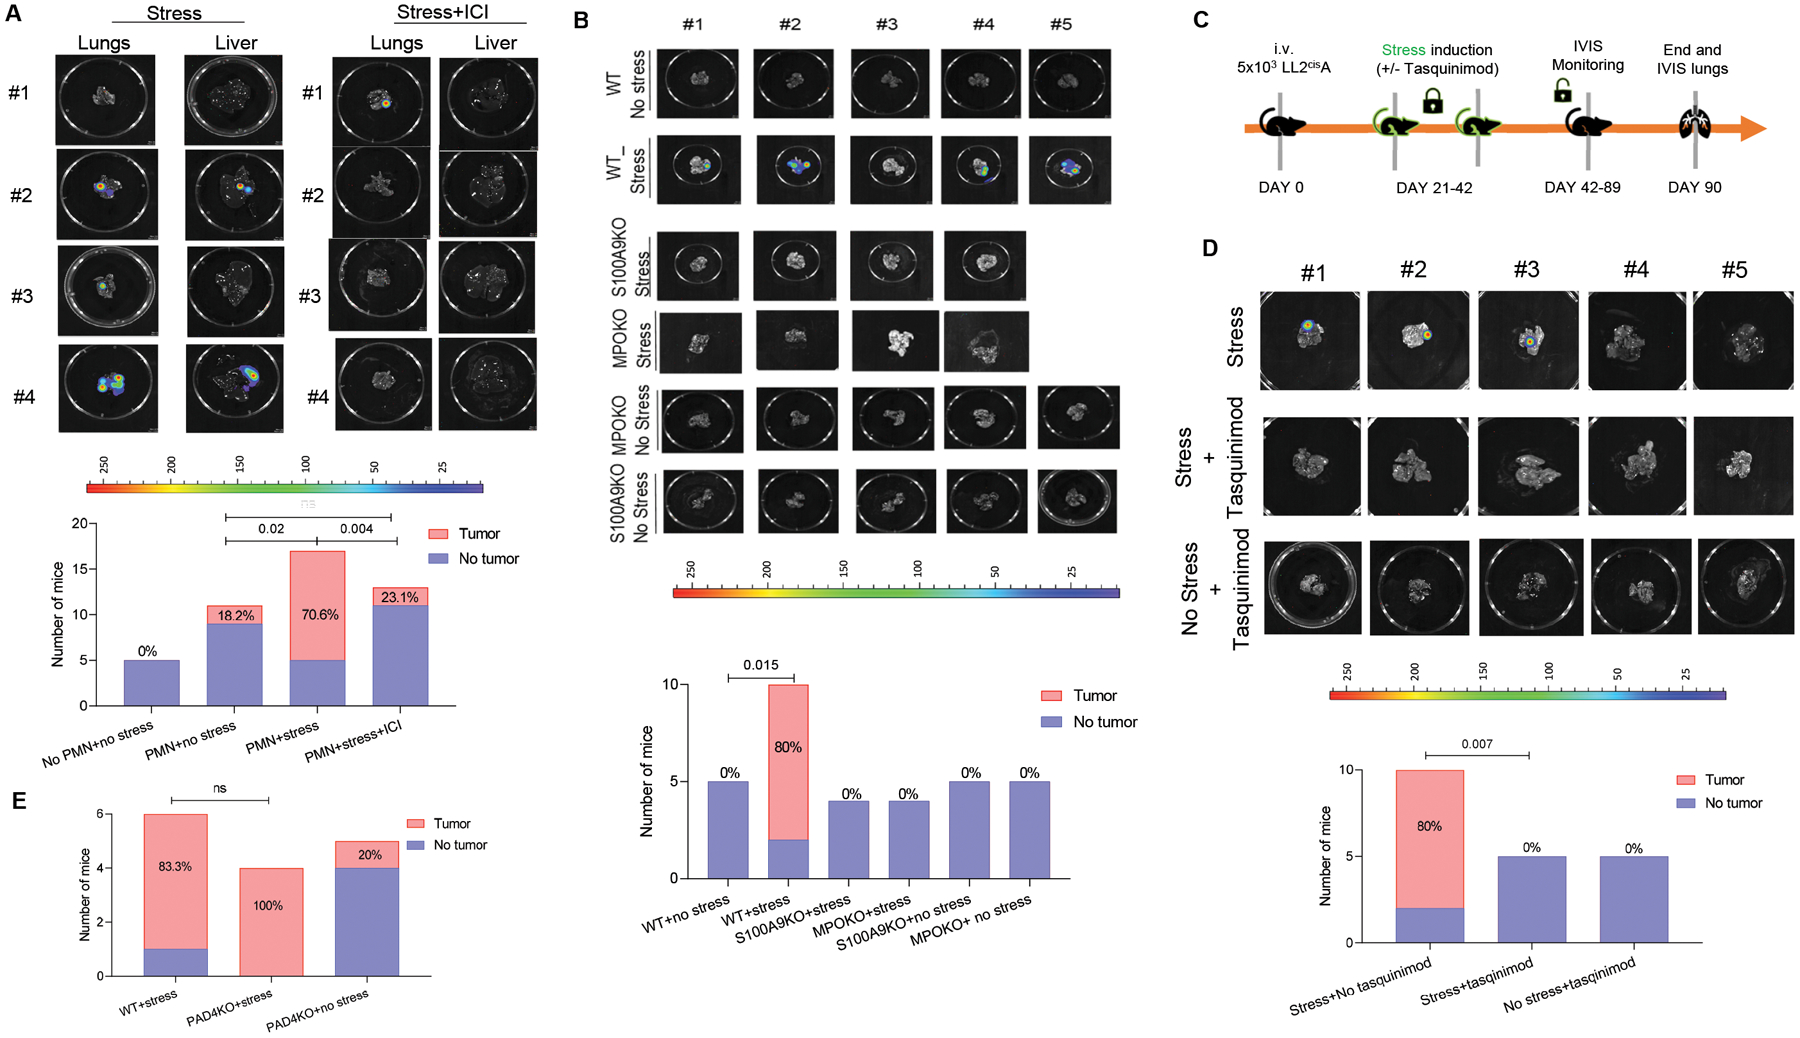
A. Representative images of NOD/SCID mouse lungs and livers after injection of KPrp53A cells and PMN and subjected to stress (left panel) or stress in the presence of ICI-118,551 (right panel). Graph summarizes the number and proportion of mice with detectable tumors. P-values were calculated by Fisher’s exact test. B. Example of images of lungs injected with LL2CisA cells. The number and proportion of C57BL/6 mice with detectable tumors in the lungs are reported after injection of LL2CisA cells and subjected to stress. P values were calculated in Fisher test. C Schema of the experiment with tasquinimod treatment. D. Representative images of C57BL/6 mouse lungs after injection of LL2CisA cells and subjected to stress with or without treatment with tasquinimod. The number and proportion of mice with detectable tumors. P values were calculated in Fisher’s exact test. E. The number and proportion of WT and PAD4 KO mice with tumor lesions in lungs after injection of LL2CisA cells and subjected to stress.
Since LL2 cells can grow in immunocompetent mice, we repeated these experiments in C57BL/6 mice injected i.v. with LL2cisA cells. Stress caused an increase in number of PMN in both lung and spleen (fig. S5D,E). In the absence of stress, LL2cisA cells did not form tumor lesions, but in the presence of stress almost all mice had tumors in lungs. No tumor growth was observed in stressed S100A8/A9 KO mice (Fig. 3B, fig. S5F).
Besides S100A8/A9, upregulation of myeloperoxidase (MPO) is also one of the major features of PMN-MDSC (34). To test the possible involvement of MPO in stress-mediated reactivation of dormant tumor cells, we evaluated the effect of stress in MPO KO mice. In the absence of MPO, stress failed to reactivate dormant tumor cells (Fig. 3B). To block S100A8/A9 in these mice, we treated mice with tasquinimod, a drug with selective neutralizing activity against S100A8/9 in vivo (35, 36) (Fig. 3C). Tasquinimod in stressed LL2cisA cells bearing mice significantly (p=0.007) reduced frequency of tumor lesions (Fig. 3D). Immobilizing stress of PAD4 KO mice, which lack the ability to form NETs, induced tumor growth in all mice injected with LL2cisA cells (Fig. 3E), supporting the conclusion that NETs are unlikely to be involved in stress induced reactivation of dormant tumor cells.
We next measured the expression of S100A9 in PMN in stressed mice. Substantial up regulation of S100a9 gene (Fig. 4A) and S100A9 protein (Fig. 4B) were observed in PMN from stressed tumor free mice as compared to control mice. Concentration of S100A8/A9 in sera of mice undergoing stress was substantially higher than in control mice (Fig. 4C). Additionally, PMN isolated from stressed mice activated proliferation of KPrp53A cells without the need for addition of recombinant S100A9 protein (Fig. 4D) suggesting that PMN-expressed S100A9 reaches saturation in the context of stress.
Figure 4. Effect of stress on S100A8/A9 release by PMN.
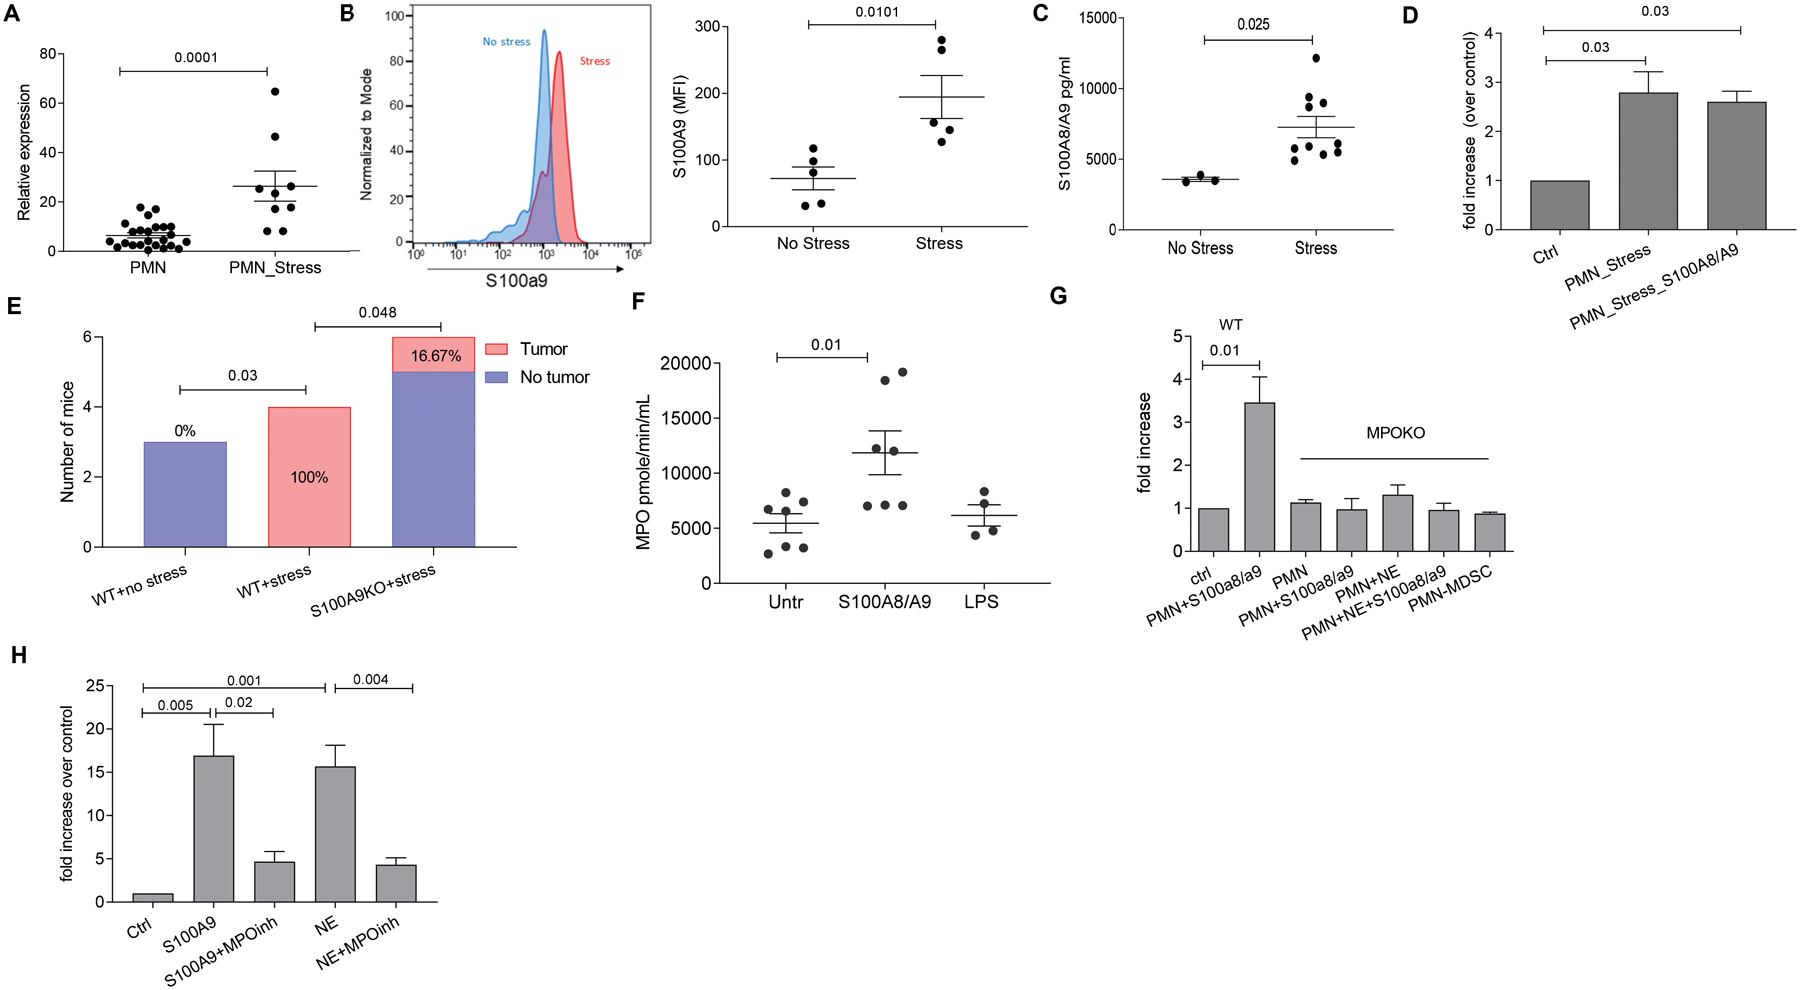
A. Relative expression (to β-actin) of s100a9 gene expression in PMN from stressed or non-stressed mice. Results of individual mice and Mean ±SEM are shown. B. S100A9 protein as measured by flow cytometry in PMN from spleen of stressed and control mice. Left panel, a typical example of staining. Right panel, results of individual mice tested and Mean ± SEM are shown. C. S100A8/A9 protein concentration in plasma of C57BL/6 control or stressed mice as measured by ELISA. Results of individual mice and Mean ±SEM are shown. D. Fold increase in number of KPrp53A cells cultured in the presence of PMN from stressed mice and recombinant S100A8/A9 over KPrp53A cells cultured alone (ctrl). For A-D, p-values were calculated by a two-sided Student’s t-test. E. LL2 tumors were established subcutaneously in WT or S100A9 KO C57BL/6 mice. Tumors were resected when they became palpable, and 7 days later mice were treated with cisplatin (5 mg/kg single dose intravenously.). One week after cisplatin treatment, mice were exposed to stress. The number and proportion of mice with detectable tumors is reported. P values were calculated in Fisher’s exact test. F. MPO enzymatic activity in PMN stimulated with 5 μg/ml of S100A8/A9 or 2 μg/ml LPS. Results of individual mice (n=4 for LPS group; n=7 for two other groups) and Mean ± SEM are shown. G. Fold increase in number of KPrp53A cells cultured in the presence of PMN from MPO KO mice alone or together with S100A8/A9 or NE relative to KPrp53A cells cultured alone (ctrl). Mean ± SEM of 3 independent experiments with 16 replicates for each. H. Fold increase in the number of KPrp53A cells cultured in the presence of PMN and S100A8/A9 or PMN and NE over control (KPrp53A cell cultured with PMN alone) in the presence or absence of MPO inhibitor (4-ABAH) at 2 μM concentration. Mean ± SEM of 3 independent experiments with 16 replicates each are shown. P values were calculated in ANOVA test with correction for multiple comparisons.
We asked whether this mechanism can regulate reactivation of tumor growth in the spontaneous model of cancer treatment with surgery and chemotherapy. LL2 tumors were established subcutaneously in WT or S100A9 KO C57BL/6 mice. When tumors became palpable, they were resected, and mice were treated with cisplatin (5 mg/kg single dose i.v.) seven days later. One week after cisplatin treatment, mice were exposed to stress and were imaged by bioluminescence weekly to detect tumor lesions in lungs. Experiments were terminated after 3 weeks, at which point all stressed WT mice had large tumor lesions in lung. In contrast, no tumors were detected in mice not exposed to stress. Additionally, only 16.7% of stressed S100A9 KO mice had tumor lesions (Fig. 4E). In this in vivo treatment model, in contrast to the models with transfer of dormant tumor cells, tumor dormancy cannot be formally established due to lack of available cells in tissues for analysis. However, these experiments demonstrate the effect of stress, mediated by S100A9, on tumor progression in the clinically relevant condition of resection.
S100A8/A9 regulation of reactivation of dormant tumor cells is mediated by modified lipids
Because S100A8/A9-expressing PMNs were sufficient to mediate dormant tumor cell reactivation, we next sought to understand what changes were induced by S100A8/A9 proteins in PMN that induced the ability to reactivate dormant tumor cells. S100A8/A9 proteins had no effect on ROS production (fig. S6A), and little or no effect on expression of Arg1, Ptgs2, or Ptges (fig. S6B). We found that S100A8/A9, but not LPS, activated MPO in PMN (Fig. 4F). PMN derived from MPO KO mice were unable to reactivate dormant cells after exposure to either S100A8/A9 or NE (Fig. 4G). Additionally, inhibition of MPO activity with the selective inhibitor 4-Aminobenzoic hydrazide 95% (4-ABAH) resulted in abrogation of dormant cell reactivation by PMN (Fig. 4H).
MPO is known to play a major role in lipid modifications, including lipid chlorination/oxidation and hydrolysis (37). Considering that vinyl ether bond of plasmalogens is a molecular target of the reactive chlorinating species produced by MPO, we analyzed this class of phospholipids. By using liquid chromatography tandem mass spectrometry (LC-MS/MS), we found that phosphatidylcholine (PC) and phosphatidylethanolamine (PE) were two major classes of phospholipids in S100A8/9-stimulated PMN (Fig. 5A). Plasmalogen alkenyl-acyl species of PE (PE-p) and PC (PC-p) were more predominant than di-acylated PE (PE-d) and PC (PC-d) species (fig. S7A). PE-p were mostly represented by the molecular species with highly oxidizable arachidonic acid in the sn-2 position. In contrast, PC-p species had saturated and monoenoic acids in the sn-2 position (fig. S7A). In the presence of chloride and H2O2, MPO generates hypochlorous acid (HOCl) that can cause the formation of chlorinated and peroxidized lipids (fig. S7B, C). HOCl can also attack plasmalogens and hydrolyze a weak alkenyl-bond, thus leading to the production of mono-acylated lyso-phospholipid species and aldehydes, particularly 4-hydroxynonenal (4-HNE). 4-HNE can covalently react with amino-groups of proteins and amino-phospholipids, such as PE (38). Indeed, we detected increased contents of Michael adducts of PE-4HNE in PMN (Fig. 5B), as well as lyso-PE (LPE) species (fig. S7C) in mouse (Fig. 5C) and human PMN (Fig. 5D) incubated with S100A8/A9. In contrast, phosphatidylserine (PS) modified by 4-HNE (PS-4-HNE adduct) was not detected. The accumulation of Lyso-PE was not observed in MPO deficient mouse PMN (Fig. 5C). Likewise, the accumulation of PE-4HNE Michael adducts was abrogated in MPO-deficient PMN (Fig. 5E). No significant changes in the content of oxidatively truncated PC species were found after PMN incubation with S100A8/A9 (fig. S7D). Furthermore, profiles of unsaturated lyso-PE were similar in PMN isolated from stressed mice and PMN treated with S100A8/A9 (fig. S7E). The content of unsaturated lyso-PE was increased similarly in responses to either stress (in vivo) and exposure to S100A8/A9 (in vitro). In contrast to MPO dependent accumulation of LPE molecular species containing unsaturated fatty acids (Fig. 5C), treatment with S100A8/A9 did not change the content of LPE containing saturated and monoenic acyl chains in PMN (Fig. 5F). Thus, S100A8/A9 caused marked accumulation of oxidized, oxidatively truncated as well as lyso-PE in PMN, and this effect was dependent on MPO.
Figure 5. Effect of S100a9 on PMN lipid content.
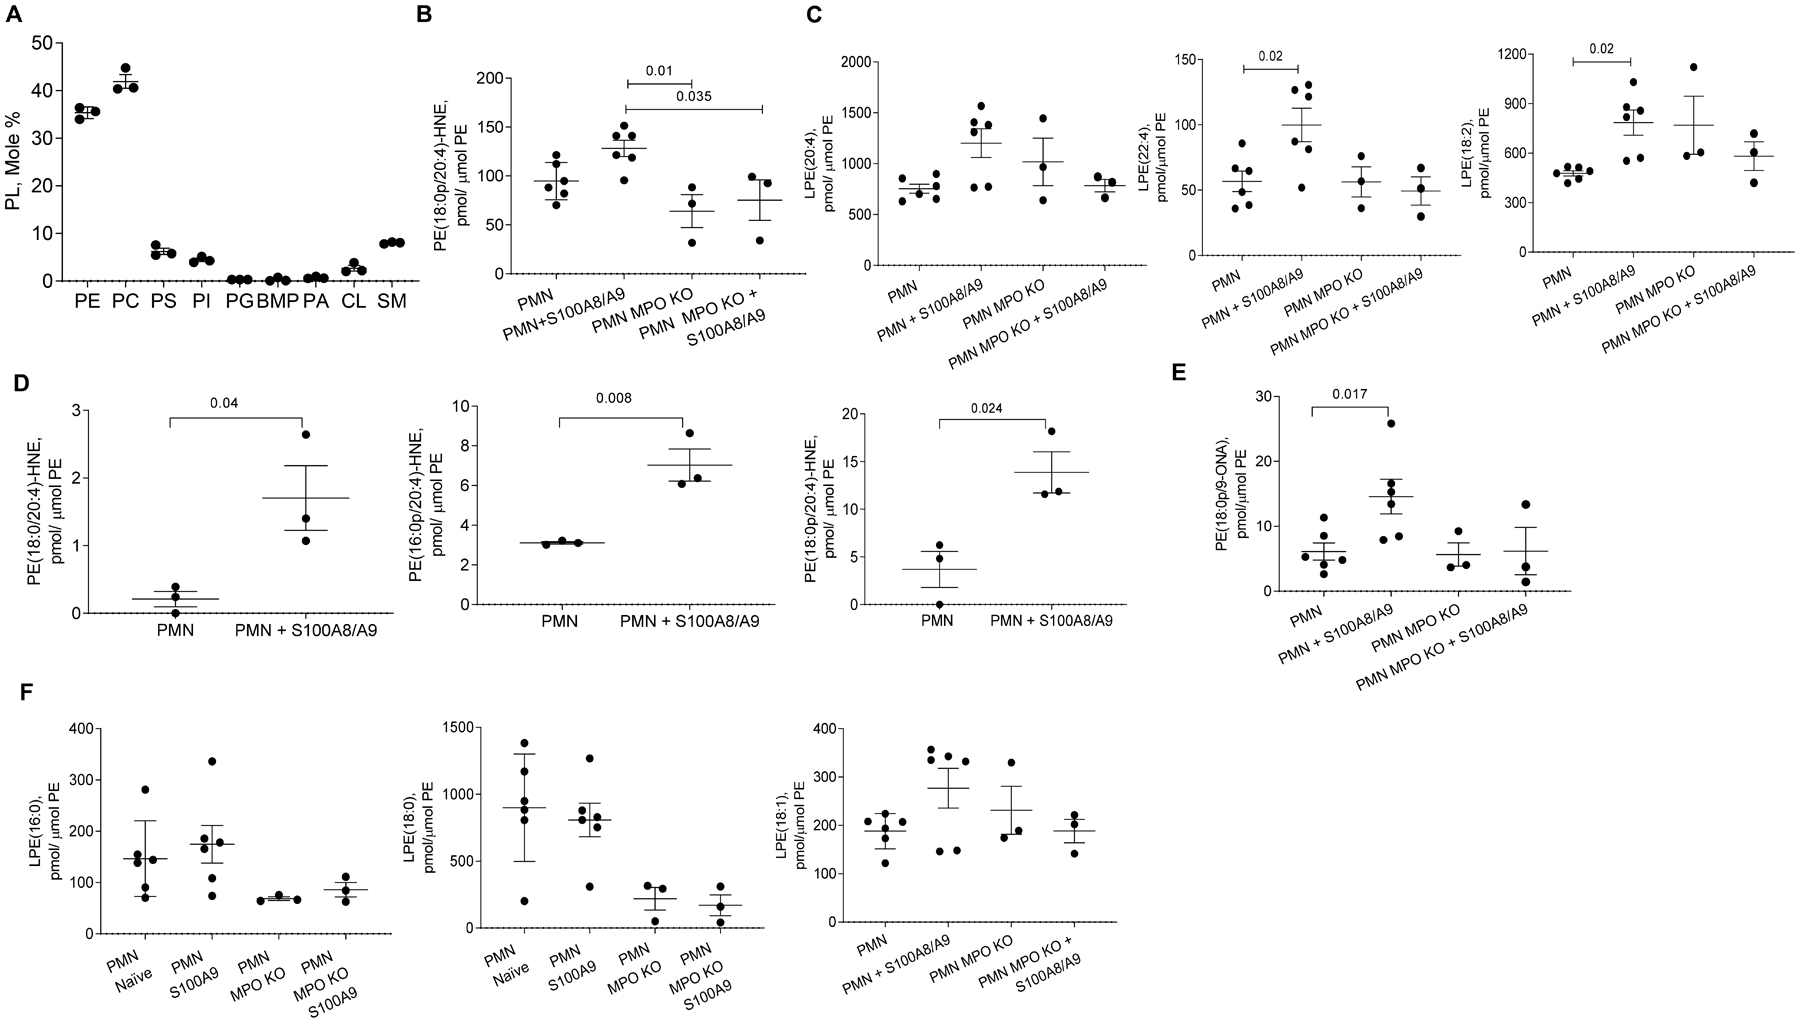
A. LC-ESI-MS/MS mass spectrometry of PMN. Results of individual mice (n=3) and Mean ±SEM are shown. B. PE-4-HNE Michael adduct of shown molecular species of PE in mouse WT and MPO KO PMN untreated or treated overnight with S100A8/A9. C. Lyso-PE (LPE) species in mouse PMN treated with S100A8/A9. Mean ± SEM are shown; n=6 in untreated and S100A8/A9-treated PMN groups and n=3 in other groups. D. PE-4-HNE Michael adduct molecular species of different PE in human PMN untreated or treated overnight with human recombinant S100A8/A9. E. Oxidatively truncated PE in WT and MPO KO PMN untreated or treated overnight with S100A8/A9. F. Lyso-PE containing saturated and monoenic acyl chains fatty acids in mouse PMN treated overnight with S100A8/A9 protein. In panels results of individual experiments (n=3–6) and Mean ± SEM are shown. In D p-values were calculated by a two-sided Student’s t-test. In all other panels by ANOVA test with multiple comparison analysis. PE-phosphatidylethanolamine; PC-phosphatidylcholine; PS-phosphatidylserine; PI- phosphatidylinositol; PG-phosphatidylglycerol; BMP-bis(monoacylglycero)phosphate; PA-phosphatidic acid; CL-cardiolipin; SM- sphingomyelin.
To directly test the role of lipids in reactivation of tumor dormancy, we extracted lipids from PMN and then added them to KPrp53A cells. Lipids extracted from PMN treated with S100A8/A9, but not from control PMN, stimulated proliferation of dormant tumor cells (Fig. 6A). Further, lipids extracted from S100A8/A9-treated MPO deficient PMN failed in induce proliferation of dormant tumor cells (Fig. 6B). Lipids extracted from PMN isolated from stressed mice reactivated dormant tumor cells (Fig. 6C), and similar results were found in the context of LL2cisA cells by testing different concentrations of lipids extracted S100A8/A9 treated PMN (Fig. 6D) or PMN from stressed mice (Fig. 6E, data file S5). Lipids extracted from PMN isolated from human healthy donors and treated with S100A8/A9 activated proliferation of A549cisA or OVCAR3cisA cells. In contrast, lipids isolated from untreated PMN did not reactivate dormant tumor cells (Fig. 6F).
Figure 6. Lipids from PMN treated with S100A8/A9 reactivate dormant tumor cells.
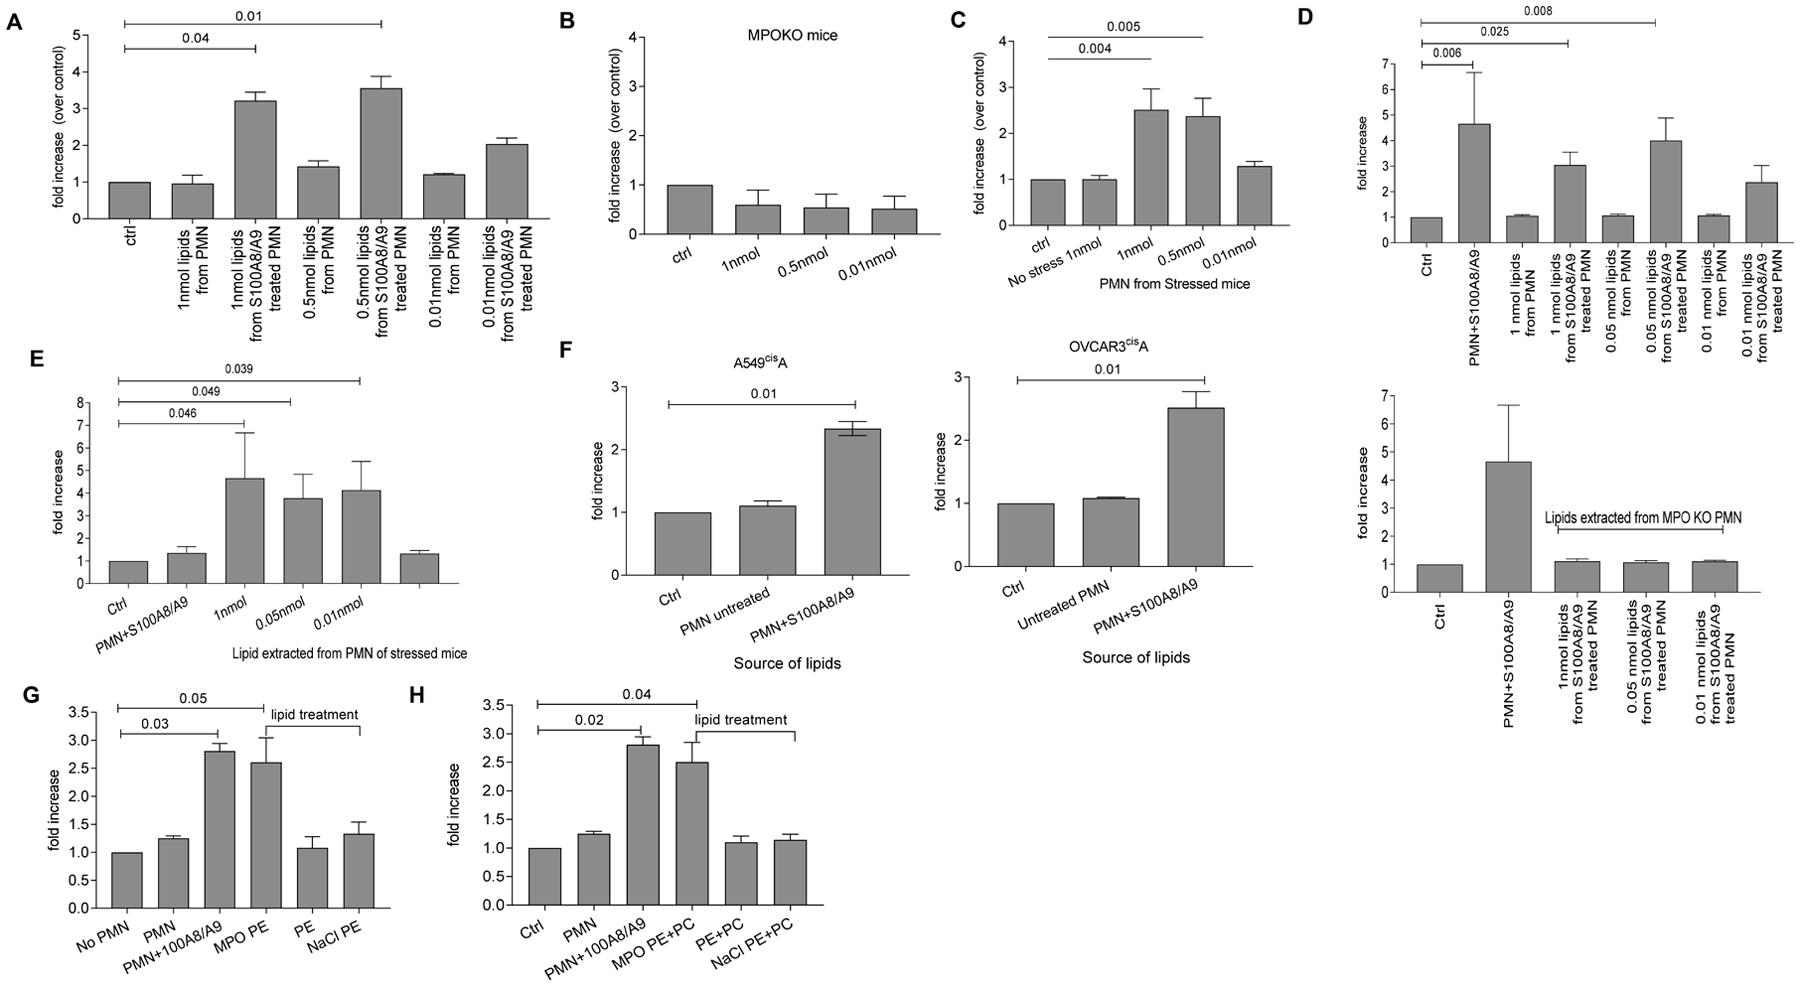
A. Fold increase in the number of KPrp53A cells cultured with lipids (at the indicated concentrations) extracted from untreated PMN (untr) or PMN treated with S100A8/A9 (S100) relative to KPrp53A cells cultured alone (ctrl). Mean ± SEM results of 3 independent experiments with 16 replicates for each are shown. B. Increase in the number of KPrp53A cells cultured with lipids extracted from MPO KO PMN treated with S100A8/A9 relative to KPrp53A cells alone (ctrl). Mean ±SEM of 3 independent experiments with 16 replicates for each condition are shown. C. Increase in the number of KPRp53A cells cultured with lipids extracted from PMN isolated from control or stressed mice. Mean ±SEM of 3 independent experiments with 16 replicates for each condition are shown. D. Increase in the number of LL2CisA cells cultured with lipids extracted from untreated PMN (untr) or PMN treated with S100A8/A9 (S100) at the indicated concentrations over LL2CisA cells cultured alone (ctrl). Top panel – PMN from wild-type mice, bottom panel – PMN from MPO KO mice. Mean ±SEM of 3 independent experiments with 16 replicates for each are shown. E. Increase in the number of LL2CisA cells cultured with lipids extracted from PMN from stressed C57BL/6 mice relative to the number of LL2CisA cells cultured alone (ctrl). Mean ±SEM of 3 independent experiments with 16 replicates for each. F. Increase in number of human A549cisA or OVCAR3cisA cells treated with lipids extracted from human healthy donor PMN over tumor cells cultured alone (ctrl). Mean ±SEM of 3 independent experiments with 16 replicates for each condition are shown. G. Increase in the number of KPrp53A cells cultured with PE treated with MPO/H2O2/NaCl (MPO PE) over untreated KPrp53A. Untreated (PE) or treated only with NaCl (NaCl PE) were used as control. PMN with S100A8/A9 were used as positive control. Mean ± SEM of 3 independent experiments with 8 replicates for each condition are shown. H. Increase in the number of KPrp53A cells cultured with mixture of PE and PC treated with MPO/H2O2/NaCl over untreated KPrp53A. Mean ±SEM of 3 independent experiments with 8 replicates for each condition are shown. In all experiments p values were calculated using ANOVA test with correction for multiple comparisons.
To verify the structure of products formed in the MPO-catalyzed reaction, we incubated PE(18:0p/20:4) with MPO/H2O2/NaCl. We found that the major products generated in MPO driven reaction were represented by PE (18:0p/20:4)-4HNE and lysoPE containing C20:4 in sn-2 position (OH/20:4). Thus, treatment of pPE-containing lipid sample with MPO/H2O2/NaCl recapitulated the nature of PE-4HNE and LPE observed in PMN treated with S100A8/A9. This incubation system, however, also generated hydroperoxy-PE-p species. No lyso-PE-OH/20:4 was formed when PE (18:0p/20:4) was substituted with diacyl PE(18:0/20:4) (fig. S7F).
Untreated PE or PE treated with only with NaCl did not activate proliferation of KPrp53A cells. In contrast, MPO/H2O2/NaCl treated PE caused tumor cell expansion comparable to S100A8/A9 treated PMN (Fig. 6G). A similar effect was obtained when mixtures of 18:0p/20:4 and 18:0p/22:6 PE and PC were used (Fig. 6H). Notably, a mixture of di-acyl-PE and di-acyl-PC did not have an activating effect on dormant tumor cells. Thus, lipid modification by MPO in stressed or S100A8/9-treated PMNs was sufficient to cause reactivation of dormant tumor cells.
Transcriptional signature of dormant tumor cells reactivated by PMN
To elucidate the mechanism of tumor cell reactivation, we performed RNASeq transcriptomic analysis of parent (KPr) and KPrp53A cells that were re-activated by PMN in the presence of S100A8/A9 (KPrp53Areact). The proliferation rates of non-arrested versus arrested and reactivated cells were similar (fig. S8A). We observed a major overall transcriptomic effect, as 2396 genes were changed at least 2-fold and 899 genes at least 5-fold between non-arrested and reactivated tumor cells (false discovery rate, FDR<5%) (fig. S8B) with the 70 genes changed at least 10-fold (Fig. 7A). Pathway analysis of the genes changed at least 2-fold demonstrated considerable change in activity of 27 pathways (Z-score>2), with 20 activated in re-activated cells and 7 inhibited (fig. S8C). Notably, among the 240 genes shared across the 27 pathways, there were 24 genes (Fig. 7B) involved in at least 5 of those pathways, with fibroblast growth factor receptors 1 and 2 (Fgfr1 and Fgfr2) being involved in the most (11 pathways). Fgfr1 and Fgfr2 were both up-regulated in KPrp53Areact as compared with KPr cells (14 and 4-fold respectively). Interrogating a list of genes involved in protein-protein interactions with FGFR1 and FGFR2 also showed increased expression of fibroblast growth factor 2 and 7 as well as potential upstream regulators known to increase Fgfr1/2 expression (Fig. 7B). RNAseq data were validated by qRT-PCR and Western Blot analysis (Fig. 7C). Additionally, lipid extracts from stressed PMN upregulated expression of Fgfr1, Fgfr2, and Fgf7 in KPrp53A cells, while lipid extracts from unstressed PMN did not affect arrested cells (Fig. 7D–E).
Figure 7. Dormant cells reactivation and FGFR1 signaling in tumor cells.
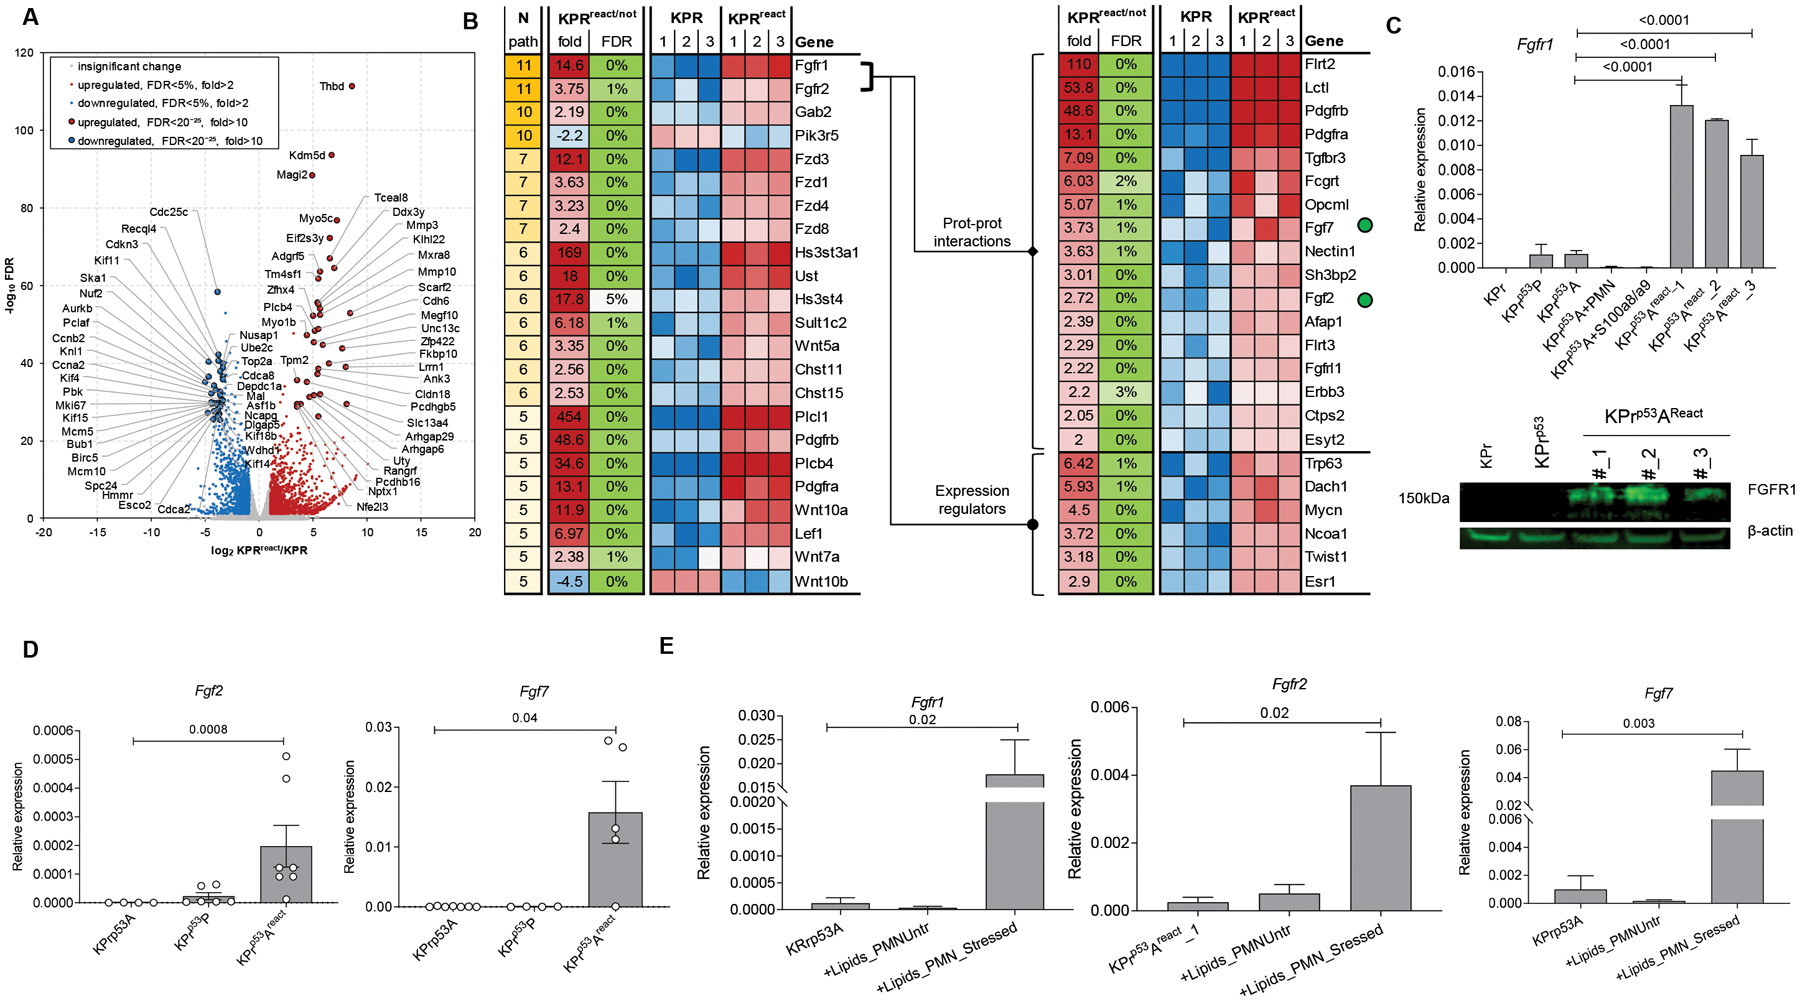
A. Volcano plot with the log2 and fold changes in gene expression between KPr and KPrp53AReact on the x-axis and the log10 FDR on the y-axis reveals genes with significant changes of expression in KPrp53AReact over KPr cells as measured by RNA sequencing. B. Heat map of gene expression data showing the top pathways that were differentially expressed between KPr and KPrp53AReact (left) and showing the different expression of genes associated to FGFR pathway (right). Fgf2 and Fgf7 are denoted by green dots. C. qRT-PCR of relative Fgfr1 expression (top) and WB of FGFR1 protein (bottom) in KPrp53AReact cells compared to KPr and KPrp53P cells. Three experiments were performed. D. qRT-PCR of Fgfr2 (left) and Fgf7 (right) expression. Mean ± SEM, n=4 in KPr53A group, 6 in KPrp53P group, and 7 in KPrp53Areact group. E. qRT-PCR expression of indicated genes in KPrp53A cells untreated or treated overnight with lipids from PMN from stressed mice. Mean±SEM, n=3. In all panels, p-values were calculated using ANOVA test with correction for multiple comparisons.
To test a causal role of the FGFR signaling pathway in PMN-mediated reactivation of dormant tumor cells, we employed BGJ398 - a potent and selective pan-FGFR antagonist (39, 40). Treatment of parental KPr or KPrp53P cells with BGJ398 at 5 or 10μM did not affect proliferation of tumor cells, whereas treatment of KPrp53Areact cells abrogated cell proliferation (fig. S8D). Additionally, blockade of FGFRs in KPrp53A, LLCcisA, OVCAR3cisA and A549cisA tumor cells with BGJ398 abrogated their reactivation by PMN treated with S100A8/A9 or NE (Fig. 8A). To assess the effect of FGFRi in vivo, LL2cisA cells were i.v. transferred to C57BL/6 mice. Three weeks later, mice were exposed to 3 weeks of stress with or without treatment with 30 mg/kg of BGJ398. Five out of 6 mice that were not treated with FGFRi developed lung tumor lesions in at the end of the study. In striking contrast, no mice treated with BGJ398 (0 out of 4) had tumor lesions despite exposure to stress (Fig. 8B).
Figure 8. Functional role of FGF signaling in PMN mediated tumor cell reactivation from dormancy.
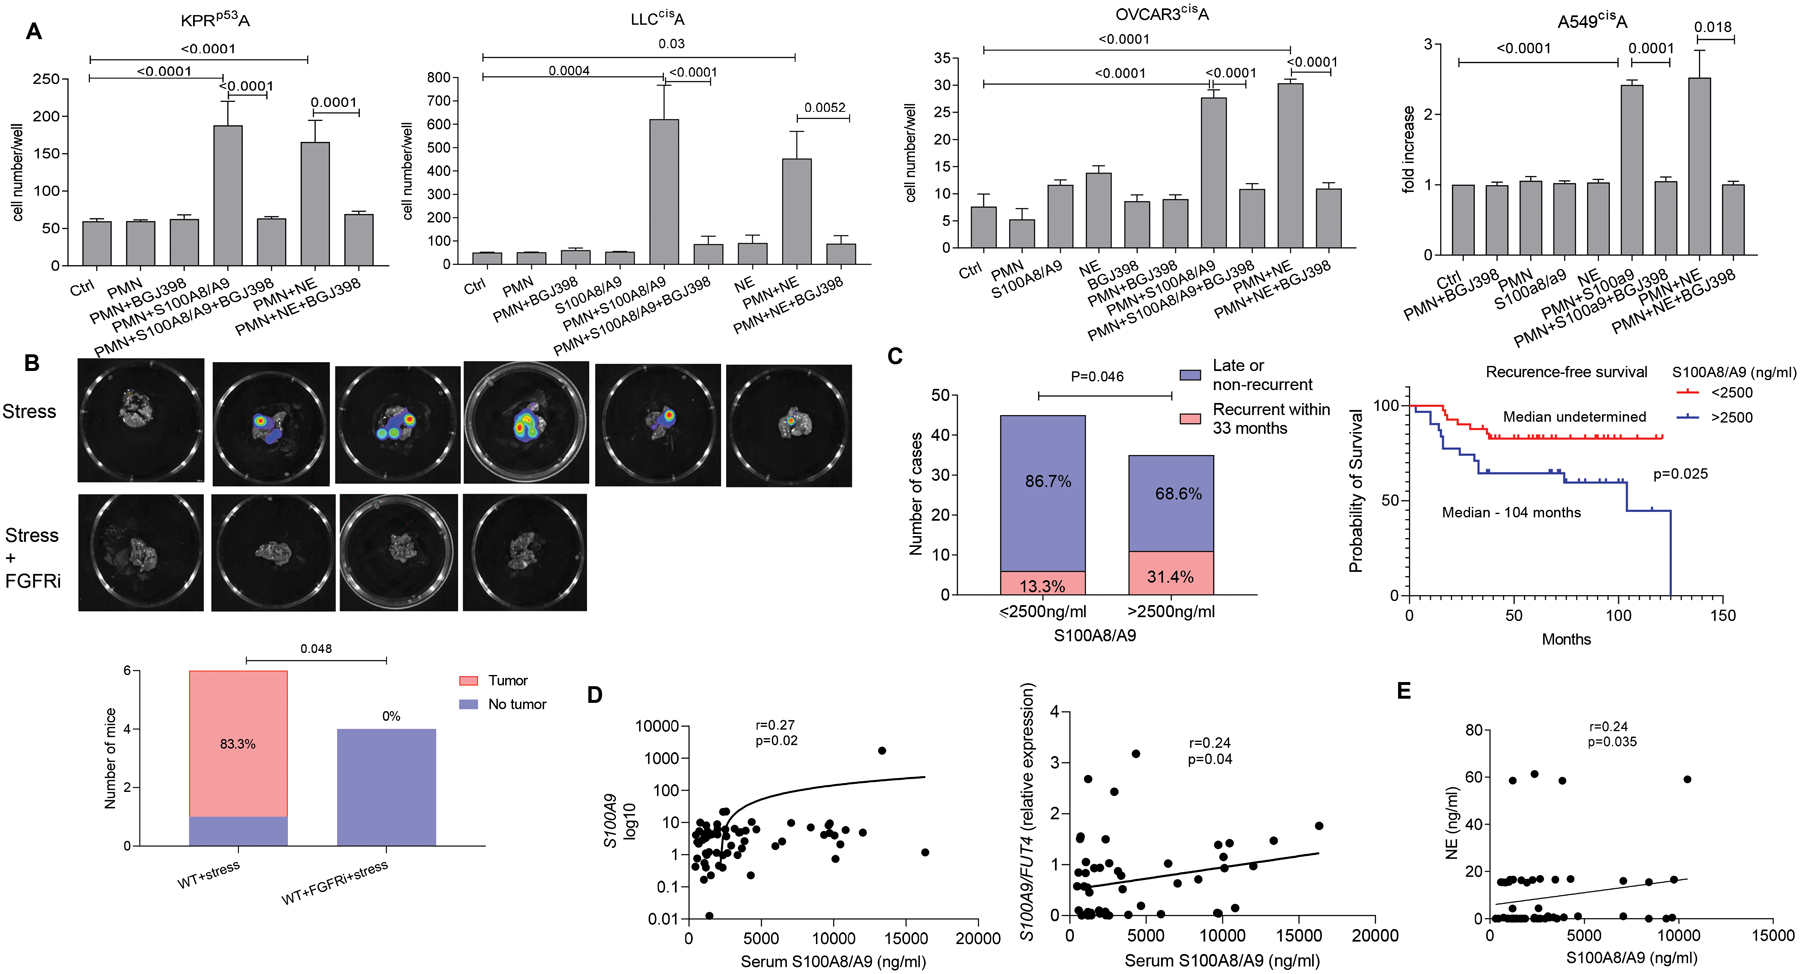
A. Number of tumor cells cultured in the presence of PMN and S100A8/A9 with or without BGJ398 FGFR inhibitor relative to tumor cells cultured alone. Mean ±SEM of 3 independent experiments with 16 replicates for each condition are shown. P-values were calculated using ANOVA test with correction for multiple comparisons. B. Representative images of C57BL/6 mouse lungs after injection of LL2CisA cells and subjected to stress with and without treatment with BGJ398. Graph summarizes the number and proportion of mice with detectable tumors. P-values were calculated using Fisher’s exact test. C. Left panel - Proportion of patients with early recurrence of NSCLC among patients grouped based on serum concentrations of S100A8/A9. P-values were calculated using Boschloo’s Test. Right panel – recurrence-free survival of patients grouped based on serum concentration of S100A8/A9. P values were calculated in Log-Rank (Mantel-Cox) test. D. Correlation between serum concentrations of S100A8/A9 and expression of S100A9 or the ratio of S100A9/FUT4 in frozen buffy coat cells (qRT-PCR). E. Correlation between serum concentrations of S100A8/A9 and NE. In D and E Spearman correlation coefficient and one-sided p-values were calculated.
To assess clinical relevance of the described findings, we evaluated the association between the amount of S100A8/A9 in circulation and the time of recurrence in non-small cell lung cancer (NSCLC) patients. We used archived serum samples from patients with stage I-II NSCLC who underwent complete tumor resection. Samples were collected 3 months after the surgery, before any detectable tumor recurrence. In total, 80 patients were included into this cohort (table S1). Seventeen patients had tumor recurrence within 33 months after the surgery (considered as early recurrence) and 63 patients either recurred at later time point (all more than 37 months after surgery) or did not have recurrence at least 37 months after the surgery. Serum concentrations of S100A8/A9 heterodimers were measured by enzyme-linked immunosorbent assay (ELISA). We used a cut-off of 33 months from time of surgery to separate patients with early recurrence from all other patients. We found that the recurrence rates within 33 months from time of tumor resection were 31.4% (11/35) in patients who had serum concentration of S100A8/A9 higher than 2,500 ng/ml and 13.3% (6/45) in patients who had lower concentrations at their three-month follow up time point (Fig. 8C) (p=0.046). No differences were found in the concentration of S100A8/A9 between patients with late recurrence or those who did not recur within the period of observation. We compared recurrence-free survival between patients with high (more than 2,500 ng/ml) and low (less than 2,500 ng/ml) serum concentrations of S100A8/A9. Patients with high S100A8/A9 concentration had significantly (p=0.025) shorter recurrence-free survival than patients with low concentration of the proteins (Fig. 8C). Frozen buffy coat cells were available from a subset of patients. Therefore, we evaluated a possible link between serum concentrations of S100A8/A9 and expression of S100A9 in buffy coat cells by performing qRT-PCR using RNA extracted directly from pellet of frozen cells, which avoided loss of PMN during thawing. We found correlation (r=0.27, p=0.02) between S100A9 expression by total buffy coat cells and serum concentration of S100A8/A9 (Fig. 8D). To more precisely assess S100A9 expression in PMN, we calculated the ratio of S100A9 and neutrophil-specific FUT4 (encoding CD15) expression in these samples. A positive correlation was observed (r=0.24, p=0.04) between S100A9 and Fut4 expression. Finally, serum concentration of NE in a subset of patient samples was measured by ELISA. The serum concentration of NE correlated positively with the serum concentration of S100A8/A9 (r=0.24; p=0.035) (Fig. 8E). Thus, concentration of S100A8/A9 correlated with shorter time to recurrence in patients with NSCLC after curative tumor resection and with the serum concentration of NE in these patients.
Discussion
The goal of this study was to identify mechanisms that drive reactivation of dormant tumor cells. To this end, we demonstrated that stress-activated PMN were able to reverse tumor cell dormancy caused by genetic upregulation of p53 or by chemotherapy. Isolation of proliferation-arrested cells allowed us to create experimental conditions of tumor dormancy where cells remained in a non-proliferative state for at least 10 days in vitro or 8 weeks in vivo. Myeloid or lymphoid cells did not activate proliferation of dormant cells even in the presence of pro-inflammatory cytokines, ER stress, or LPS at concentrations up to 2μg/ml. Recently, PMN activated by LPS were shown to revert the quiescent state of D2.OR breast cancer cells, which was associated with enhanced processing of Laminin-111 in the basement membrane and release of NET (25). D2.OR cells used in that study were quiescent cells. In the tumor reactivation experiments reported by this previous study, high number of tumor cells were injected to the lungs (5×10⁵ cells) and dormancy exit was achieved in the presence of experimental conditions mimicking massive gram-negative bacterial inflammation (equivalent of about 8μg/ml LPS). In comparison, LPS concentrations in sera of patients with septic shock are detected within the range of pg/ml (41). These considerations stimulated further search for potential mechanisms involved in pathological reversal of tumor dormancy.
PMN-MDSC, but no other myeloid or lymphoid cells, induced proliferation of dormant cells in vitro and in vivo. One of the most prominent features of PMN-MDSC is high amount of S100A8 and S100A9 proteins (18). Amounts of S100A8 and S100A9 are much lower in monocytes and are practically undetectable in macrophages, DC, and lymphocytes. Our study demonstrated that the ability of PMN-MDSC to reactivate proliferation of dormant tumor cells was dependent on S100A8/A9. However, PMN-MDSC are absent adults following complete surgical resection of tumors. To this end, we found that addition of recombinant S100A8/A9 to PMN from tumor-free mice or healthy volunteers enabled these cells to reverse tumor dormancy similar to PMN-MDSC. Importantly, PMN were required for reversion of tumor dormancy, as addition of S100A8/A9 to dormant tumor cells in the absence of PMN did not affect tumor cells proliferation. These results strongly suggested that the release of S100A8/A9 from PMN is critical for their ability to reverse tumor cell dormancy.
S100A8/A9 proteins lack signal peptides required for the classical Golgi-mediated secretion pathway. Their release is mediated by alternative secretion pathways, which are dependent on src, syk, and tubulin (42). S100A8/A9 have been reported in granules (43), suggesting that they could be released following neutrophil degranulation. However, a subsequent study demonstrated that activation of PMN led to the translocation of S100A8/A9 from the cytosol to the cytoskeleton and membrane before secretion. The secretion was not associated with NETosis or degranulation, and the majority of secreted proteins was found in soluble form or associated with large vesicles (44).
In this study, we found that stress-associated adrenergic hormones caused rapid release of S100A8/A9 from PMN without affecting their viability or NET formation. These results supported the concept that S100A8/A9 release is not associated with PMN degranulation or NETosis. Although increased amount of S100A8/A9 was shared between stress-activated PMN and PMN-MDSC in tumor-bearing mice, it does not appear that these cells are similar. However, in this study we did not specifically investigate this question.
A role for stress in reactivation of tumor cell dormancy was found by treatment of PMN with NE. Further, the NE- and PMN-induced reactivation of dormant cells was abrogated in S100A8/A9-deficient PMN, indicating that NE-mediated reactivation of dormant cells is mediated via release of S100A8/A9 by PMN. This would be consistent with the epidemiological and clinical studies that provided evidence for links between chronic stress and cancer progression (27, 45).
It appears that autocrine and paracrine effects of S100A8/A9 specifically on PMN is critical for the reactivation of dormant tumor cells. We observed rapid activation of MPO in PMN by S100A8/A9. It was consistent with previous observation that S100A8/A9 could induce HOCl in a cell-free system (46) and that MPO and S100A8/A9 worked synergistically on production of HOCl (47). MPO is important for lipid peroxidation (48). MPO induces peroxidation of phospholipids by causing accumulation of 4-HNE adducts, oxidative truncation, or formation of lyso-PE. Our data indicated that lipid species produced by S100A8/A9-treated or stressed PMN were necessary and sufficient to cause reactivation of dormant tumor cells.
Our data suggest that one of the mechanisms by which lipids can support exit of cells from dormancy could be FGFR pathway. FGFR signaling regulates cell cycle progression, migration, metabolism, survival, proliferation, and differentiation of tumor cells (49). Oxidized phospholipids have pleotropic effect on many cells by affecting signaling mediated by microRNA, cyclic adenosine monophosphate, peroxisome proliferator activated receptor, or NF-κB (50). Lyso-phospholipids are described as lipid mediators with a wide variety of functions mediated through G protein-coupled receptors (51, 52). Oxidatively-truncated molecular species PE, including PE-4-HNE Michael adducts may mediate their effects via receptor binding and activation of cell signaling (53, 54).
Tumor dormancy is a complex system that combines several conditions. Our study was focused on senescence-like state of tumor cells induced by p53 targeting and by chemotherapy. Our study was not designed to clarify molecular mechanisms of this process. Currently, there are no good models to study tumor dormancy in vivo. A limitation of our study is that we had to use a transfer of dormant tumor cells into mice. Although this approach allows for investigation of the effect of stress and PMN on reactivation of dormant tumor cells, more sophisticated models of tumor cell dormancy in vivo will be needed to clarify the mechanism of this phenomenon.
Our findings may have clinical implications. High concentrations of S100A8/S100A9 are a notable risk factor for a recurrence in NSCLC patients. These data are in line with two earlier reports. S100A8/S100A9 serum concentrations were found to be reliable surrogate markers for identification of patients at risk for the diagnosis of lung cancer (55). Furthermore, tumor microenvironment-derived S100A8/S100A9 was associated with formation of metastases and had a predictive value for survival rates in melanoma in a similar concentration range found in our patient cohort (56).
Our data also suggest several possible therapeutic approaches to reduction of tumor recurrence. First is the targeting of S100A8/A9, which is a central component of the reactivation process. Tasquinimod binds to S100A9 and inhibits its interaction with its receptors TLR4, RAGE, and CD147, reverting the stress-induced reactivation of dormant tumor cells in mice. Tasquinimod has recently emerged as a therapeutic agent for cancer in a limited number of experimental models (57). Earlier data in prostate cancer patients showed that tasquinimod prolonged progression-free survival compared to placebo (58). However, in a randomized phase III trial, tasquinimod treatment did not affect overall survival, although it increased disease-free survival (59). These data suggest that tasquinimod may be effective in delaying tumor progression, but does not affect tumor growth once started. This would be consistent with the potential effect of this drug in our study.
Second, therapy with β-blockers are already used to treat patients with cardiovascular diseases long-term. In our study, inhibition of β2-adrenergic receptors resulted in abrogation of reactivation of dormant tumor cells in mice exposed to stress. This is consistent with clinical observations that lung cancer patients who used β-blockers showed extended lung cancer survival (60). It has been reported that cancer patients undergoing β-blocker therapy for associated pathology showed reduced breast cancer recurrence (61) and better survival from ovarian cancer(62). In a meta-analysis over 300,000 patients, beta-blocker use was associated with improved survival among patients with ovarian cancer, pancreatic cancer, and melanoma (63). Thus, targeting of stress mediators with β-blockers may provide clinical benefits for cancer patients by delaying or preventing tumor recurrence.
Third, identification of the exact lipid species responsible for reactivation of dormant cells may result in the development of strategies to neutralize their effect. Identification of the receptors on tumor cells responsible for binding those lipid species could lead to the development of antibodies able to block reactivation of dormant tumor cells.
In conclusion, this study demonstrates that tumor dormancy can be overcome by stress hormone-mediated activation of conventional PMN. This activation is characterized by the release of S100A8/A9 proteins. PMN remained viable and responded to S100A8/A9 proteins in paracrine and autocrine fashion by activation of MPO and production of oxidized or hydrolyzed phospholipids. These lipids can reactivate dormant tumor cells by up-regulating FGFRs signaling. These results provide insight into the mechanisms regulating reactivation of dormant tumor cells and suggest possible therapeutic strategies to delay or prevent tumor recurrence.
Materials and Methods
Study Design.
The clinical portion of the study was designed to assess correlation between clinical outcome and concentration of S100A8/A9 in sera. This was a retrospective study of all available archived samples of sera from patients with NSCLC, and therefore randomization and study size calculation was not performed. In experiments with treatment of mice, the overall goal was to assess the effect of stress on tumor recurrence. After injection of dormant tumor cells, mice were assigned to different treatment groups by a simple randomization technique based on single sequence of random assignments. The study was not blinded. Due to exploratory nature of the experiments, sample size calculation was not performed before conducting experiments. Multiple biological replicates were used in the study and reported in each figure.
Patients with cancer.
Serum samples were collected from 80 individuals (10 males and 50 females) aged 50–84 diagnosed with stage I-II NSCLC who underwent tumor resection at New York University Medical Center. Informed consent was obtained from all patients, and the study was approved by NYU Medical Center Institutional Review Board (Protocol H8896, H.P. CoI). Tumor recurrence was evaluated during regular follow up visits. We evaluated samples collected 3 months after surgery. This time frame was selected to avoid direct effect stress associated with operation and post-operative manipulations. No patients had a recurrence within a 3-month period after surgery.
Mice.
NOD/SCID and C57BL/6 mice were obtained from Taconic. S100A9KO were generated and described by us earlier (24). MPO KO mice (B6.129X1-Mpotm1Lus/J) were obtained from Jackson Lab. PAD4 KO mice were obtained from Jackson Lab (B6.Cg-Padi4tm1.1Kmow/J). PMN donor mice were used with matched sex/age and they were housed in same condition (room, food, water) and same rack in the animal facility to minimize environmental variation. Male and female mice were equally represented in each experiment. Mice were 6–8 weeks old at the start of the experiments. Mice were housed in a specific pathogen free animal facility at Wistar Institute, and all experiments were approved by Wistar Institute IACUC.
Reagents are shown in table S2.
Cell lines (LL2, KPr, A549, OVACR3) were maintained in RPMI 1640 medium with 10% fetal bovine serum (FBS) in humified incubator at 37C. LL2, A549, and OVCAR3 were obtained from ATCC. KPr were derived from transgenic mice described previously(16)
Establishment of dormant cells.
The KPr cell line (16) was maintained in RPMI 1640 medium (Corning) and 10% fetal bovine serum (FBS) (Gibco). Treatment of KPr cells with 250 nM of 4-hydroxytamoxifen (4-OHT, Sigma-Aldrich) induced p53 expression. p53-induced cells (KPrp53) were stained with CellTrace dye for 20 min at 37°C according to manufacturer’s instructions (Life Technologies) and seeded at 8500 cells/cm2 in culture in T175 tissue culture-treated flask (Gibco). After 7 days, cells were detached and sorted based on the CellTrace dye intensity as proliferating (KPrp53P, with lower CellTrace) and arrested cells (KPrp53A, with higher intensity CellTrace, see Figure 1A for representative image). LL2 cells were seeded at 1000 cells/cm2 and treated for 3 days with 2.5 μM cisplatin (Selleckchem). After that, cells were stained with CellTrace and sorted as described above. OVCAR3 cell senescence was induced by treating 5×10⁴ cells/cm2 with 0.5 μM cisplatin for 72 h. After that time, cells were stained with CellTrace and sorted. A549 senescence was induced by 72 h treatment with 4 μM cisplatin and cells were sorted after staining with CellTrace. Time points for sorting was chosen as the best to observe separation between arrested and proliferating cells. Cells were sorted on Astrios (Beckman Coulter) or Melody (Becton Dickinson) fluorescence activated cell sorters.
Cell proliferation.
2000 cells/well were seeded in 96-well clear bottom plate in triplicate (Lonza,). 16 h after seeding, norepinephrine (NE, Sigma-Aldrich) at 0.5–5 μM final concentration or BGJ398 at 0.75 μM final concentration (Selleckchem) were added to culture. To test the effect of BGJ398t on KPrp53AReact cells, escalating doses ranging from 0 to10 μM final concentrations were used. To detect luciferase activity (proportional to number of cells in culture), Luciferin (Perkin Elmer) was added 1:200 from stock according to manufacturer’s instructions and luminescence was measured with a Victor spectrophotometer (PerkinElmer).
Cell isolation.
PMN or PMN-MDSC were isolated from spleen of tumor-free mice or LLC tumor-bearing mice, respectively. 5×10⁵ LLC cells were injected into the right flank of mice, and spleens were harvested when tumors reached 200 mm2. Spleens were mechanically dissociated. Red blood cells were lysed with ACK buffer cells. Splenocytes were stained with mouse biotin-conjugated Ly6G antibody (Miltenyi Biotec) followed by biotin microbeads. Ly6G+ cells were purified by magnetic separation with MACS column for magnetic cell isolation, according to manufacturer’s instructions (Miltenyi Biotec).
B and T cells were isolated with magnetic beads using CD19, CD4, or CD8 antibodies. T cells were maintained for 48 h with 100U/ml IL-2 prior to experiments. Macrophages were sorted with MoFlo AStrios cell sorter (Beckman Coulter) from spleens of tumor bearing mice as CD11b+Ly6C−F4/80+ cells after exclusion of dead cells and doublets. Mouse macrophages/DCs were also generated from enriched BM hematopoietic progenitor cells (HPCs) after HPCs isolation using a lineage depletion kit per manufacturer’s instructions (Miltenyi). Cells were seeded at 50,000 cell/ml in 24-well plates and 10 ng/ml of granulocyte-macrophage colony-stimulating factor (GM-CSF) was added to the culture at day 0 and day 3. On day 6, cells were collected and CD11c+ cells were isolated by staining with anti-CD11c conjugated microbeads and separated with MACS column for magnetic cell isolation, according to manufacturer’s instructions (Miltenyi Biotec).
In vitro co-culture with PMN and PMN-MDSC.
Arrested tumor cells were plated at 100 cells/cm2 in 48-well tissue culture-treated plate (Costar) for co-culture experiments. After 24h, PMN-MDSC or PMN were added at indicated ratios. Co-cultures were maintained for 48 h in RPMI 1640+10% FBS in the presence of 10 ng/ml mouse recombinant GM-CSF (Rocky Hill) to ensure neutrophil viability. All control conditions were in presence of media with GM-CSF. All indicated supplements (NE, S100A8/A9, BGJ398, ICI 118–551, IL-2, MPO inhibitor, LPS, lipids, PMA, thapsigargin 1μM) were added to culture at the same time as PMN and maintained for 48 h. After that, media were removed and replaced by fresh media without GM-CSF. After one week, GFP+ cells in wells were counted via an inverted microscope. When lipids extracts were used, lipids were added to dormant cells in culture at 1–0.05 or 0.01 nmol as indicated in each experiment.
In vivo experiments with dormant cells.
2.5×10⁴ KPrp53A cells were injected i.v. to NOD/SCID mice. Beginning three weeks after injection, mice were imaged weekly. Luciferin (PerkinElmer) was injected i.p. in mice before the imaging according to manufacturer’s instruction. Mice were imaged with IVIS Spectrum In Vivo Imaging System (IVIS, PerkinElmer) to detect luminescent signal coming from growing cancer cells. Mice were put under anesthesia in the induction chamber with isoflurane vaporizer set to 2.5%, at ~ 1.5 liters per minute flow. Mice were then transferred in the IVIS imaging stage nose cone inside the IVIS manifold (IVIS manifold nose cones flow set to ~ 0.25 LPM). Animals were monitored by video during imaging. Once the images of luciferase/luciferin activity were acquired, the anesthesia was turned off and the animals were returned to their cages. Only animals lacking luminescent signal (about 90% of the mice) were enrolled in further studies. PMN or PMN-MDSC were injected at 0.3×10⁶ cells/mouse i.v. three times every other day. Analysis and quantification were performed with IVIS imaging system Living Image Software 4.7.4 (PerkinElmer). Photon counts in the area of interest were reported after subtraction of background. When signal was detected, mice were sacrificed, and bioluminescent images of the harvested lung were taken. Mouse lungs and livers were embedded in optimal cutting temperature (OCT) compound (Thermo Fisher Scientific) after exposure to increased concentration of sucrose (5%, 15%, 20%, 30%) and frozen for immunofluorescence (IF) analysis. If no bioluminescence was detected in lungs after 80 days from last PMN injection, experiments were terminated, and lung tissue were collected. LL2CisA cells were injected at 0.5×10⁵ i.v into C57Bl/6 mice. Bioluminescence was not detected in any LL2CisA-injected mice at three weeks post injection. Mice were treated with PMN or PMN-MDSC and analyzed as described above.
In vivo stress induction.
To induce stress, mice were restrained in individual semi-cylindric plastic restrainers (BrainTree scientific) four hours per day for five days per week. Stress induction started one week before PMN injection for a total of three weeks. Mice could move back and forward the tube, but they could not completely turn. When a study included β-blocker treatment, 1mg/kg ICI-118, 5551 (Selleckchem) was injected i.p. daily during the stress induction period. In studied with tasquinimod, mice injected with dormant cells were treated with tasquinimod (Selleckchem, cat# S7617) diluted in drinking water at final concentration of 0.15 mg/ml during the stress induction period. Water was replenished twice a week and kept in a dark bottle to limit exposure to light. Mouse lungs and livers were embedded in OCT (Thermo Fisher Scientific) after sucrose gradient and frozen for IF analysis as described above.
Immunofluorescence and Immunohistochemistry.
For GFP detection, frozen tissues were cut 5 μm thick on CM1950 cryostat (Leica), placed on superfrost plus microscope slides (Fisher Scientific), and fixed with 4% paraformaldehyde (Sigma-Aldrich) for 10 min at RT. Tissues were stained for nuclei detection with Hoechst 33342 or DAPI (Thermofisher) diluted at 5 μg/ml 10 min RT. For Ly6G staining, tissues were fixed with 4% paraformaldehyde in phosphate buffered saline (PBS) for 10 min at room temperature (RT). After washing, blocking was achieved with 1 h incubation at RT with PBS/BSA 5%. Slides were stained with Alexa Fluor 594-conjugated rat anti-mouse Ly6G (Biolegend, Clone 1A8) at 1:100 and incubated at 4°C overnight in a humid chamber. After washing, nuclei were stained as described above. Cover slips were added with ProLong Diamond Antifade Mountant (ThermoFisher Scientific) and images were acquired with a Nikon 80i upright microscope (Nikon).
For p53 or H3K9Me staining, cells were fixed in a 24-well plate with 4% paraformaldehyde in PBS for 10 min at RT, then washed with PBS and 1% bovine serum albumin (BSA). Cells were permeabilized with triton 0.1% X100 solution in PBS for 20 min at RT. After washing, samples were blocked with 5% PBS/BSA for 1h at RT. Rabbit anti-mouse p53 (Leica) antibody or rabbit-anti-mouse Tri-Methyl-Histone H3 (Lys9) antibody (Cell Signaling) was added at a 1:200 dilution in PBS/1% BSA and incubated for 3h at 37°C. After washing, slides were then incubated with anti-rabbit Alexa 549 (Life Technologies) secondary antibody at a 1:500 dilution for 2h at RT. Nuclei were stained as described above. Images were acquired at the TIE2000 inverted microscope (Nikon). All images were then processed with ImageJ software. For hematoxylin and eosin staining, mice were euthanized and lungs were harvested. The lungs were formalin-fixed then paraffin-embedded. Tissue sections of 5μm thick were stained with Hematoxylin and Eosin and images were acquired with Nikon 80i upright microscope (Nikon).
Flow cytometry.
KPR cells and KPRp53React cells were plated on day 0 in complete RPMI-1640 medium supplemented with 10% fetal bovine serum. After 24 h cells were pulsed with BrdU according to manufacturer instructions (Becton Dickinson). BrdU was removed and replaced with fresh medium. On day 2, cells were exposed to tamoxifen to restore p53 (KPRp53). On day 4, cells were stained with CellTrace Violet as described above while attached to the plate to minimize handling. On day 10, cells were harvested and stained with an anti-BrdU PE-conjugated antibody according to the manufacturer’s BrdU Flow Kit protocol (BD Biosciences). For cell cycle analysis, cells were fixed in 70% ethanol and stained with FxCycle PI/RNase staining solution (BD Biosciences) according to manufacturer’s instruction. Samples were analyzed using an BD™ LSRII cytometer (Becton Dickinson) and data were analyzed by FlowJo 10.5 software (Becton Dickinson).
Norepinephrine and S100A8/A9 measurement by ELISA.
100 μl of mouse peripheral blood were collected from facial vein. Norepinephrine was measured by a mouse norepinephrine ELISA Kit (Novus Biological). S100A8/A9 was measured by Mouse S100A8/S100A9 Heterodimer DuoSet ELISA (R&D System). S100A8/A9 concentrations in human serum samples were determined by using a double-sandwich ELISA system as previously described (64), which is different from commercial ELISA kits. Human NE was measured using an ELISA kit (Abnova).
MPO activity in neutrophils.
Neutrophils were isolated from tumor-free mice as described above and MPO activity was measured with a MPO Fluorometric Activity Assay Kit (Sigma-Aldrich) using a VICTOR spectrophotometer(Perkin Elmer). Absorbance was measured every 5 minutes until plateau was reached, and MPO activity was calculated with the formula suggested by the manufacturer.
β-Galactosidase activity.
Arrested or proliferating cells from all models used in the study (KPr, LL2, A549, and OVCAR3) were plated at 5×10⁴ cells/ml and incubated overnight. Cells were then stained for β-Galactosidase using senescence β-Galactosidase Staining Kit (Cell Signaling) per manufacturer’s instructions.
Western blot.
Cells were lysed in radioimmunoprecipitation lysis buffer (RIPA lysis buffer) supplemented with phosphatase inhibitors (Roche). 30–40 μg of protein were loaded in each lane of 4–12% Nupage gradient gels (Thermofihser Scientific). Gels were run on a Nupage apparatus in Nupage 1x running buffer and transferred in wet system with running buffer (Thermo Fisher Scientific). Membranes were blocked for 2 h at RT in Odyssey blocking buffer (LI-COR Biosciences), then primary antibodies 1:500 in PBS+1% Tween (Thermo Fisher) were added. IRDye 800CW Goat anti-Mouse IgG (LI-COR Biosciences) secondary antibodies were incubated for 2 h at RT in PBS+1% Tween at 1:10000 dilution. Membranes were imaged using an Odyssey imaging system (LI-COR Biosciences).
NET detection.
PMN were cultured for 8h in 24 well flat-bottom plates in RPMI 1640+10% FBS. PMN were then fixed with 4% paraformaldehyde (Electron Microscopy Sciences) followed by staining with SYTOX Green Nucleic Acid Stain (SYTOX) at a final concentration of 250nM. A Nikon TE300 inverted microscope equipped with a motorized XY stage was used to image NETs by acquiring 25 random locations per well. The z-stacks per location were then combined into an extended depth focused (EDF) image. The total NET area was calculated by segmenting each image using a defined threshold pixel intensity setting. The spot detection tool in NIS-Elements Advanced Research (Nikon) was used to count the number of cells per field. The sum of the total NET area in the 25 random fields of view was divided by the total number of cells in the 25 fields of view to obtain NET area (μM)/cell.
qRT-PCR.
RNA from tumor cells or PMN was extracted from snap frozen pellets with Quick-RNA Microprep or Quick-RNA Miniprep (Zymo Research) per manufacturer’s instructions. cDNA was prepared with High-Capacity cDNA Reverse Transcription Kit with RNase Inhibitor (Thermo Fisher Scientific) per manufacturer’s instructions. qRT-PCR was performed in ABI Quant Studio 5 Rm 422 machine (Applied Biosystems). PCR primers are shown in table S3.
RNA Sequencing.
Total RNA was extracted from cell pellets using the Direct-zol RNA Miniprep (Zymo Research) per manufacturer’s instructions. RNA quality was validated using the TapeStation RNA ScreenTape (Agilent). 100 ng of total RNA was used to prepare a library for Illumina Sequencing using the Quant-Seq 3’mRNA-Seq Library Preparation Kit (Lexogen). Library quantity was determined using qPCR kit and absolute quantification with standard curve method (KAPA Biosystem). Overall library size was determined using the Agilent TapeStation and the DNA High Sensitivity D5000 ScreenTape (Agilent). Equimolar amounts of each sample library were pooled, denatured and Mid-Output, Paired-End, 150 cycle Next Generation Sequencing was done on a NextSeq 500 (Illumina).
Data were aligned using bowtie2 (65) against mm10 genome, and gene-level read counts were estimated with RSEM v1.2.12 software (66) for ensemble transcriptome. DESeq2 (67) was used to estimate significance of differences between any two experimental groups, and genes that changed at least two-fold with a false discovery rate threshold less than 5% were considered significantly different. Gene set enrichment analysis was done using QIAGEN’s Ingenuity Pathway Analysis software (IPA, QIAGEN) using the “Canonical Pathways” option. Activation states of pathways were predicted and Z-scores calculated by IPA based on known information about roles of membership genes and their direction of change. Pathways with significantly predicted activation scores (|Z-score|>2) were reported. Known upstream regulators and protein-protein interaction partners for Fgfr1 and Fgfr2 were derived from Ingenuity Knowledgebase. Gene expression data were deposited to Gene Expression Omnibus accession GSE153944.
LC-ESI-MS analysis of lipids.
Lipids were extracted by the Folch procedure with slight modifications, under nitrogen atmosphere, at all steps. Briefly, methanol (1 ml) was added to the cell suspension and mixed. After that, chloroform (2 mL) was added, and the mixture was vortexed every 15 min during 1 h at 0° C. Next, 0.1 M NaCl (0.5 mL) was added to the samples, vortexed, and the chloroform layer was separated by centrifugation (1500 g, 5 min). The lower (organic) layer was collected. The aqueous layer was re-extracted with 1 ml of chloroform:methanol (2:1, v/v). The chloroform (lower) layers were combined, evaporated under a stream of nitrogen, and used for lipidomics analysis. MS analysis of phospholipids was performed on a Fusion Lumos trihybrid-quadrupole-orbitrap-ion trap mass spectrometer (ThermoFisher Scientific). Phospholipids were separated on a normal phase column (Luna 3 μm Silica (2) 100Å, 150 × 1.0 mm, (Phenomenex)) at a flow rate of 0.065 mL/min on a Thermo Ultimate 3000 HPLC system. The column was maintained at 35°C. The analysis was performed using gradient solvents (A and B) containing 10 mM ammonium formate. Solvent A contained propanol:hexane:water (285:215:5, v/v/v) and solvent B contained propanol:hexane:water (285:215:40, v/v/v). All solvents were LC/MS grade. The column was eluted for 0–3 min with a linear gradient from 10% to 37% B, then held for 3–15 min at 37% B. The column was eluted for 15–23 min with a linear gradient of 37–100% B, and then held for 23–75 min at 100% B. The column was eluted again for 75–76 min with a linear gradient from 100% to 10% B followed by equilibration from 76 to 90 min at 10% B. Analysis was performed in negative ion mode at a resolution of 120,000 for the full MS scan in a data-dependent mode. The scan range for MS analysis was 400–1800 m/z with a maximum injection time of 100 ms using 1 microscan. An isolation window of 1.2 Da was set for the MS and MS2 scans. Capillary spray voltage was set at 3.5 kV, and capillary temperature was 320°C.
MPO lipid treatment.
Lipids extracted from PMN were dried under N2, then were re-suspended in 200 μl 20 mM PBS pH 7.4 containing 100 mM NaCl and 100 μM diethylenetriaminepentaacetic acid (DTPA) and incubated with 28 nM MPO (Sigma), 50 μM H2O2 during in 1h at 37°C. H2O2 (2 μl of 5 mM) was added every 5 min. Individual molecular species of phospholipids, including PE(18:0p/20:4), PE(18:0/20:4), PC(18:0p/20:4), PC(18:0/20:4), and PC(18:0p/22:6) (AvaniPolar Lipids), were treated separately by 56 nM MPO in 20 mM PBS at pH 7.4 in the presence of 100 μM NaCl and 100 μM DTPA for 1h at 37°C. 50 μM H2O2 was added every 5 min. Additionally, individual phospholipids were incubated with 250 μM NaClO in 20 mM PBS at pH 7.4 in the presence of 100 mM NaCl and 100 μM DTPA for 1h at 37°C.
Statistical analyses.
After testing for normal distribution of data, statistical analyses were performed using two-tailed Student’s t-test and GraphPad Prism 5 software (GraphPad Software Inc.). All data are presented as mean ± SEM and p-values less than 0.05 were considered significant. Fisher’s exact test and Boschloo’s test were used for analysis of categorical data. One way ANOVA test with correction for multiple comparisons (Kruskal-Wallis or Tukey’s tests) was used in experiments with more than two groups. A non-parametric Spearman test was used to calculate correlation coefficients, and one-sided p-values were calculated. One-sided test was selected because the hypothesis stated only one-directional changes in the data. Original data are in data files S1–S13
Supplementary Material
Figure S1. Characterization of dormant tumor cells
Figure S2. Characteristics of tumor growth in vivo
Figure S3. Mechanism of dormant tumor cells reawakening
Figure S4. Characterization of cisplatin induced tumor cell dormancy
Figure S5. Characterization of stress induction model
Figure S6. Effect of S100A9 on PMN activity
Figure S7. Characterization of lipids extracted from PMN
Figure S8. Characterization of reactivated tumor cells
Table S1 Patients characteristics
Table S2: Reagents used in the study
Table S3. Primer sequences used in this study
Data file S1. Original data for Figure 1.
Data file S2. Original data for Figure 2.
Data file S3. Original data for Figure 4.
Data file S4. Original data for Figure 5.
Data file S5. Original data for Figure 6.
Data file S6. Original data for Figure 7.
Data file S7. Original data for Figure 8.
Data file S8. Original data for figure S2.
Data file S9. Original data for figure S3.
Data file S10. Original data for figure S4.
Data file S12. Original data for figure S6.
Data file S11. Original data for figure S5.
Data file S13. Original data for figure S8.
Acknowledgments
Funding: This work was supported in part by DOD grant W81XWH-19-1-0571 (to DIG) and NIH grant CA100062S1 (to DIG and RZ0, NIH grant CA165065 (to DIG and VK), DOD grant LC180388, NIH grant 1UO1 CA214195 (to HP), and Wistar Cancer Center Support NIH grant P50 CA168536.
Footnotes
Competing interests:
D.I.G. is employee of AstraZeneca. All other authors declare that they have no competing interests.
Data and materials availability: All data associated with this study are present in the paper or Supplementary Materials. Gene expression data are deposited to Gene Expression Omnibus accession GSE153944.
References and notes
- 1.Gong J, Salgia R, Managing Patients With Relapsed Small-Cell Lung Cancer. J Oncol Pract 14, 359–366 (2018). [DOI] [PMC free article] [PubMed] [Google Scholar]
- 2.Collaud S et al. , Long-term outcome after en bloc resection of non-small-cell lung cancer invading the pulmonary sulcus and spine. J Thorac Oncol 8, 1538–1544 (2013). [DOI] [PubMed] [Google Scholar]
- 3.Rhim AD et al. , EMT and dissemination precede pancreatic tumor formation. Cell 148, 349–361 (2012). [DOI] [PMC free article] [PubMed] [Google Scholar]
- 4.Perego M et al. , A slow-cycling subpopulation of melanoma cells with highly invasive properties. Oncogene 37, 302–312 (2018). [DOI] [PMC free article] [PubMed] [Google Scholar]
- 5.Goss PE, Chambers AF, Does tumour dormancy offer a therapeutic target? Nat Rev Cancer 10, 871–877 (2010). [DOI] [PubMed] [Google Scholar]
- 6.Ewald JA, Desotelle JA, Wilding G, Jarrard DF, Therapy-induced senescence in cancer. J Natl Cancer Inst 102, 1536–1546 (2010). [DOI] [PMC free article] [PubMed] [Google Scholar]
- 7.Herranz N, Gil J, Mechanisms and functions of cellular senescence. J Clin Invest 128, 1238–1246 (2018). [DOI] [PMC free article] [PubMed] [Google Scholar]
- 8.Denoyelle C et al. , Anti-oncogenic role of the endoplasmic reticulum differentially activated by mutations in the MAPK pathway. Nat Cell Biol 8, 1053–1063 (2006). [DOI] [PubMed] [Google Scholar]
- 9.Milanovic M et al. , Senescence-associated reprogramming promotes cancer stemness. Nature 553, 96–100 (2018). [DOI] [PubMed] [Google Scholar]
- 10.Chakradeo S, Elmore LW, Gewirtz DA, Is Senescence Reversible? Curr Drug Targets 17, 460–466 (2016). [DOI] [PubMed] [Google Scholar]
- 11.Lau L, David G, Pro- and anti-tumorigenic functions of the senescence-associated secretory phenotype. Expert Opin Ther Targets 23, 1041–1051 (2019). [DOI] [PMC free article] [PubMed] [Google Scholar]
- 12.Gay LJ, Malanchi I, The sleeping ugly: Tumour microenvironment’s act to make or break the spell of dormancy. Biochim Biophys Acta 1868, 231–238 (2017). [DOI] [PubMed] [Google Scholar]
- 13.Veglia F, Perego M, Gabrilovich D, Myeloid-derived suppressor cells coming of age. Nat Immunol 19, 108–119 (2018). [DOI] [PMC free article] [PubMed] [Google Scholar]
- 14.Gabrilovich DI, Myeloid-Derived Suppressor Cells. Cancer Immunol Res 5, 3–8 (2017). [DOI] [PMC free article] [PubMed] [Google Scholar]
- 15.Wang PF et al. , Prognostic role of pretreatment circulating MDSCs in patients with solid malignancies: A meta-analysis of 40 studies. Oncoimmunology 7, e1494113 (2018). [DOI] [PMC free article] [PubMed] [Google Scholar]
- 16.Feldser DM et al. , Stage-specific sensitivity to p53 restoration during lung cancer progression. Nature 468, 572–575 (2010). [DOI] [PMC free article] [PubMed] [Google Scholar]
- 17.Stokes KL et al. , Natural killer cells limit the clearance of senescent lung adenocarcinoma cells. Oncogenesis 8, 24 (2019). [DOI] [PMC free article] [PubMed] [Google Scholar]
- 18.Bronte V et al. , Recommendations for myeloid-derived suppressor cell nomenclature and characterization standards. Nat. Commun. 7: 12150, (2016). [DOI] [PMC free article] [PubMed] [Google Scholar]
- 19.Ghavami S et al. , S100A8/A9: a Janus-faced molecule in cancer therapy and tumorgenesis. Eur J Pharmacol 625, 73–83 (2009). [DOI] [PubMed] [Google Scholar]
- 20.Ortiz ML, Lu L, Ramachandran I, Gabrilovich DI, Myeloid-derived suppressor cells in the development of lung cancer. Cancer Immunol Res 2, 50–58 (2014). [DOI] [PMC free article] [PubMed] [Google Scholar]
- 21.He YM et al. , Transitory presence of myeloid-derived suppressor cells in neonates is critical for control of inflammation. Nat Med 24, 224–231 (2018). [DOI] [PMC free article] [PubMed] [Google Scholar]
- 22.Kerkhoff C et al. , The arachidonic acid-binding protein S100A8/A9 promotes NADPH oxidase activation by interaction with p67phox and Rac-2. FASEB J 19, 467–469 (2005). [DOI] [PubMed] [Google Scholar]
- 23.Oppenheim JJ, Yang D, Alarmins: chemotactic activators of immune responses. Curr Opin Immunol. 17, 359–365 (2005). [DOI] [PubMed] [Google Scholar]
- 24.Manitz MP et al. , Loss of S100A9 (MRP14) results in reduced interleukin-8-induced CD11b surface expression, a polarized microfilament system, and diminished responsiveness to chemoattractants in vitro. Mol Cell Biol 23, 1034–1043 (2003). [DOI] [PMC free article] [PubMed] [Google Scholar]
- 25.Albrengues J et al. , Neutrophil extracellular traps produced during inflammation awaken dormant cancer cells in mice. Science 361, (2018). [DOI] [PMC free article] [PubMed] [Google Scholar]
- 26.Sorensen OE, Borregaard N, Neutrophil extracellular traps - the dark side of neutrophils. J Clin Invest 126, 1612–1620 (2016). [DOI] [PMC free article] [PubMed] [Google Scholar]
- 27.Chiriac VF, Baban A, Dumitrascu DL, Psychological stress and breast cancer incidence: a systematic review. Clujul Med 91, 18–26 (2018). [DOI] [PMC free article] [PubMed] [Google Scholar]
- 28.Obradovic MMS et al. , Glucocorticoids promote breast cancer metastasis. Nature 567, 540–544 (2019). [DOI] [PubMed] [Google Scholar]
- 29.Zahalka AH et al. , Adrenergic nerves activate an angio-metabolic switch in prostate cancer. Science 358, 321–326 (2017). [DOI] [PMC free article] [PubMed] [Google Scholar]
- 30.Nagaraja AS et al. , Sustained adrenergic signaling leads to increased metastasis in ovarian cancer via increased PGE2 synthesis. Oncogene 35, 2390–2397 (2016). [DOI] [PMC free article] [PubMed] [Google Scholar]
- 31.Beis D et al. , The Role of Norepinephrine and alpha-Adrenergic Receptors in Acute Stress-Induced Changes in Granulocytes and Monocytes. Psychosomatic medicine 80, 649–658 (2018). [DOI] [PubMed] [Google Scholar]
- 32.Campos AC, Fogaca MV, Aguiar DC, Guimaraes FS, Animal models of anxiety disorders and stress. Braz J Psychiatry 35 Suppl 2, S101–111 (2013). [DOI] [PubMed] [Google Scholar]
- 33.Banagozar Mohammadi A et al. , Sericin alleviates restraint stress induced depressive- and anxiety-like behaviors via modulation of oxidative stress, neuroinflammation and apoptosis in the prefrontal cortex and hippocampus. Brain Res 1715, 47–56 (2019). [DOI] [PubMed] [Google Scholar]
- 34.Youn JI, Collazo M, Shalova IN, Biswas SK, Gabrilovich DI, Characterization of the nature of granulocytic myeloid-derived suppressor cells in tumor-bearing mice. J Leukoc Biol 91, 167–181 (2012). [DOI] [PMC free article] [PubMed] [Google Scholar]
- 35.Shen L et al. , Tasquinimod modulates suppressive myeloid cells and enhances cancer immunotherapies in murine models. Cancer Immunol Res 3, 136–148 (2015). [DOI] [PMC free article] [PubMed] [Google Scholar]
- 36.Raymond E, Dalgleish A, Damber JE, Smith M, Pili R, Mechanisms of action of tasquinimod on the tumour microenvironment. Cancer Chemother Pharmacol 73, 1–8 (2014). [DOI] [PMC free article] [PubMed] [Google Scholar]
- 37.Palladino END, Hartman CL, Albert CJ, Ford DA, The chlorinated lipidome originating from myeloperoxidase-derived HOCl targeting plasmalogens: Metabolism, clearance, and biological properties. Arch Biochem Biophys 641, 31–38 (2018). [DOI] [PMC free article] [PubMed] [Google Scholar]
- 38.Guichardant M, Taibi-Tronche P, Fay LB, Lagarde M, Covalent modifications of aminophospholipids by 4-hydroxynonenal. Free Radic Biol Med 25, 1049–1056 (1998). [DOI] [PubMed] [Google Scholar]
- 39.Pal SK et al. , Efficacy of BGJ398, a Fibroblast Growth Factor Receptor 1–3 Inhibitor, in Patients with Previously Treated Advanced Urothelial Carcinoma with FGFR3 Alterations. Cancer Discov 8, 812–821 (2018). [DOI] [PMC free article] [PubMed] [Google Scholar]
- 40.Javle M et al. , Phase II Study of BGJ398 in Patients With FGFR-Altered Advanced Cholangiocarcinoma. J Clin Oncol 36, 276–282 (2018). [DOI] [PMC free article] [PubMed] [Google Scholar]
- 41.Danner RL et al. , Endotoxemia in human septic shock. Chest 99, 169–175 (1991). [DOI] [PubMed] [Google Scholar]
- 42.Ryckman C et al. , Role of S100A8 and S100A9 in neutrophil recruitment in response to monosodium urate monohydrate crystals in the air-pouch model of acute gouty arthritis. Arthritis Rheum 48, 2310–2320 (2003). [DOI] [PubMed] [Google Scholar]
- 43.Stroncek DF, Shankar RA, Skubitz KM, The subcellular distribution of myeloid-related protein 8 (MRP8) and MRP14 in human neutrophils. J Transl Med 3, 36 (2005). [DOI] [PMC free article] [PubMed] [Google Scholar]
- 44.Tardif MR et al. , Secretion of S100A8, S100A9, and S100A12 by Neutrophils Involves Reactive Oxygen Species and Potassium Efflux. J Immunol Res 2015, 296149 (2015). [DOI] [PMC free article] [PubMed] [Google Scholar]
- 45.Moreno-Smith M, Lutgendorf SK, Sood AK, Impact of stress on cancer metastasis. Future Oncol 6, 1863–1881 (2010). [DOI] [PMC free article] [PubMed] [Google Scholar]
- 46.Boyum A et al. , Calprotectin (S100A8/S100A9) and myeloperoxidase: co-regulators of formation of reactive oxygen species. Toxins 2, 95–115 (2010). [DOI] [PMC free article] [PubMed] [Google Scholar]
- 47.Simard JC, Girard D, Tessier PA, Induction of neutrophil degranulation by S100A9 via a MAPK-dependent mechanism. J Leukoc Biol 87, 905–914 (2010). [DOI] [PubMed] [Google Scholar]
- 48.Strzepa A, Pritchard KA, Dittel BN, Myeloperoxidase: A new player in autoimmunity. Cell Immunol 317, 1–8 (2017). [DOI] [PMC free article] [PubMed] [Google Scholar]
- 49.Desai A, Adjei AA, FGFR Signaling as a Target for Lung Cancer Therapy. J Thorac Oncol 11, 9–20 (2016). [DOI] [PubMed] [Google Scholar]
- 50.Bochkov V et al. , Pleiotropic effects of oxidized phospholipids. Free Radic Biol Med 111, 6–24 (2017). [DOI] [PubMed] [Google Scholar]
- 51.Rolin J, Maghazachi AA, Effects of lysophospholipids on tumor microenvironment. Cancer Microenviron 4, 393–403 (2011). [DOI] [PMC free article] [PubMed] [Google Scholar]
- 52.Makide K et al. , Novel lysophosphoplipid receptors: their structure and function. Journal of lipid research 55, 1986–1995 (2014). [DOI] [PMC free article] [PubMed] [Google Scholar]
- 53.Spickett CM, The lipid peroxidation product 4-hydroxy-2-nonenal: Advances in chemistry and analysis. Redox Biol 1, 145–152 (2013). [DOI] [PMC free article] [PubMed] [Google Scholar]
- 54.Schaur RJ, Siems W, Bresgen N, Eckl PM, 4-Hydroxy-nonenal-A Bioactive Lipid Peroxidation Product. Biomolecules 5, 2247–2337 (2015). [DOI] [PMC free article] [PubMed] [Google Scholar]
- 55.Blanco-Prieto S et al. , Serum calprotectin, CD26 and EGF to establish a panel for the diagnosis of lung cancer. PloS one 10, e0127318 (2015). [DOI] [PMC free article] [PubMed] [Google Scholar]
- 56.Wagner NB et al. , Tumor microenvironment-derived S100A8/A9 is a novel prognostic biomarker for advanced melanoma patients and during immunotherapy with anti-PD-1 antibodies. J Immunother Cancer 7, 343 (2019). [DOI] [PMC free article] [PubMed] [Google Scholar]
- 57.Kallberg E et al. , S100A9 interaction with TLR4 promotes tumor growth. PloS one 7, e34207 (2012). [DOI] [PMC free article] [PubMed] [Google Scholar]
- 58.Pili R et al. , Phase II randomized, double-blind, placebo-controlled study of tasquinimod in men with minimally symptomatic metastatic castrate-resistant prostate cancer. J Clin Oncol 29, 4022–4028 (2011). [DOI] [PubMed] [Google Scholar]
- 59.Sternberg C et al. , Randomized, Double-Blind, Placebo-Controlled Phase III Study of Tasquinimod in Men With Metastatic Castration-Resistant Prostate Cancer. J Clin Oncol 34, 2636–2643 (2016). [DOI] [PubMed] [Google Scholar]
- 60.Zingone A et al. , Relationship between anti-depressant use and lung cancer survival. Cancer treatment and research communications 10, 33–39 (2017). [DOI] [PMC free article] [PubMed] [Google Scholar]
- 61.Childers WK, Hollenbeak CS, Cheriyath P, beta-Blockers Reduce Breast Cancer Recurrence and Breast Cancer Death: A Meta-Analysis. Clin Breast Cancer 15, 426–431 (2015). [DOI] [PubMed] [Google Scholar]
- 62.Baek MH, Kim DY, Kim SO, Kim YJ, Park YH, Impact of beta blockers on survival outcomes in ovarian cancer: a nationwide population-based cohort study. J Gynecol Oncol 29, e82 (2018). [DOI] [PMC free article] [PubMed] [Google Scholar]
- 63.Na Z et al. , The effects of beta-blocker use on cancer prognosis: a meta-analysis based on 319,006 patients. Onco Targets Ther 11, 4913–4944 (2018). [DOI] [PMC free article] [PubMed] [Google Scholar]
- 64.Frosch M et al. , Myeloid-related proteins 8 and 14 are specifically secreted during interaction of phagocytes and activated endothelium and are useful markers for monitoring disease activity in pauciarticular-onset juvenile rheumatoid arthritis. Arthritis Rheum 43, 628–637 (2000). [DOI] [PubMed] [Google Scholar]
- 65.Langmead B, Salzberg SL, Fast gapped-read alignment with Bowtie 2. Nat Methods 9, 357–359 (2012). [DOI] [PMC free article] [PubMed] [Google Scholar]
- 66.Li B, Dewey CN, RSEM: accurate transcript quantification from RNA-Seq data with or without a reference genome. BMC bioinformatics 12, 323 (2011). [DOI] [PMC free article] [PubMed] [Google Scholar]
- 67.Love MI, Huber W, Anders S, Moderated estimation of fold change and dispersion for RNA-seq data with DESeq2. Genome biology 15, 550 (2014). [DOI] [PMC free article] [PubMed] [Google Scholar]
Associated Data
This section collects any data citations, data availability statements, or supplementary materials included in this article.
Supplementary Materials
Figure S1. Characterization of dormant tumor cells
Figure S2. Characteristics of tumor growth in vivo
Figure S3. Mechanism of dormant tumor cells reawakening
Figure S4. Characterization of cisplatin induced tumor cell dormancy
Figure S5. Characterization of stress induction model
Figure S6. Effect of S100A9 on PMN activity
Figure S7. Characterization of lipids extracted from PMN
Figure S8. Characterization of reactivated tumor cells
Table S1 Patients characteristics
Table S2: Reagents used in the study
Table S3. Primer sequences used in this study
Data file S1. Original data for Figure 1.
Data file S2. Original data for Figure 2.
Data file S3. Original data for Figure 4.
Data file S4. Original data for Figure 5.
Data file S5. Original data for Figure 6.
Data file S6. Original data for Figure 7.
Data file S7. Original data for Figure 8.
Data file S8. Original data for figure S2.
Data file S9. Original data for figure S3.
Data file S10. Original data for figure S4.
Data file S12. Original data for figure S6.
Data file S11. Original data for figure S5.
Data file S13. Original data for figure S8.